KOTO Collaboration
First Search for the Decay
Abstract
We report the first search for the decay, which is forbidden by Lorentz invariance, using the data from 2016 to 2018 at the J-PARC KOTO experiment. With a single event sensitivity of , no candidate event was observed in the signal region. The upper limit on the branching fraction was set to be at the 90% confidence level.
The decay is forbidden by the conservation of angular momentum. In the rest frame, the spin of a massless photon must be polarized along the decay axis, but the back-to-back configuration of two-body decays does not allow the parallel component of the orbital angular momentum. In the broader context, threatens Lorentz invariance and gauge invariance decayofheavymesons . Such restrictions on provide the opportunity to search for new physics beyond the standard model (SM). In particular, as Ref. HighEnergytest suggests, similarly to experiments such as ones using optical resonators lv_spect ; lv_spect2 , Lorentz invariance should be tested in short distances. Several scenarios predict a finite rate of the decay decayofheavymesons ; noncummutivity . Using charged kaons, the E949 experiment at BNL searched for the decay and set upper limit on the branching fraction to be e949results at the 90% confidence level (C.L.); no measurements have been made for neutral kaons.
The KOTO experiment is being carried out using the 30 GeV Main Ring accelerator at J-PARC in Ibaraki, Japan. A beam was produced by protons hitting a gold target, and was transported into the KOTO detector at an angle of from the primary beam citebeamline . Photons in the beam were removed by a 35-mm-thick lead plate placed in the upstream, and charged particles were removed by a sweeping magnet. The solid angle of the neutral beam after a collimation was 7.8 sr, and the size was at 20 m downstream from the target. At the exit of the beam line, the peak of the momentum distribution was GeV. The incident rate to the KOTO detector was measured to be 7 MHz at a beam power of 50 kW, based on the measured and decays (this corresponded to per proton on target).
The primary purpose of the KOTO experiment is to study the CP-violating decay, which is suppressed in the SM, and the branching fraction is predicted to be KLpi0nunutheory . The signature of is + nothing; hence the KOTO detector consists of a fine-grained electromagnetic calorimeter and hermetic veto counters surrounding the decay volume. Thus, the apparatus is ideal to search for the decay.
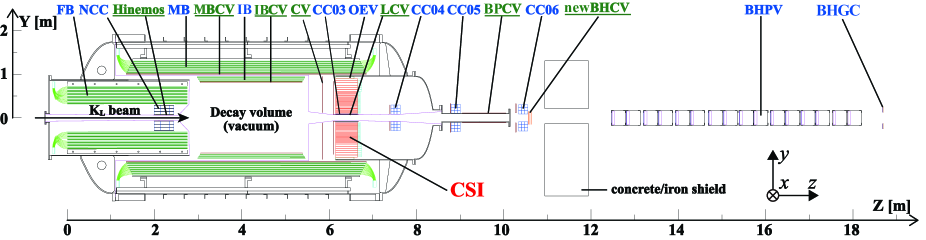
Figure 1 shows the sectional view of the KOTO detector, in which the axis is in the center of the beam line. The decay volume was kept in vacuum of Pa to suppress interactions between beam neutrons and residual gas. An electromagnetic calorimeter (CSI), consisting of 2716 50-cm-long undoped Cesium Iodide crystals, measured the energies and hit positions of incident photons from decays. The central and outer regions of CSI were made of and crystals in cross section, respectively citeCSI ; citeCSI2 . The crystals were stacked inside a 1.9-m-diameter cylinder, leaving a central hole for the beam path. The FB, MB, and IB IBpaper were lead-scintillator sandwich counters, hermetically covering the decay volume to veto extra particles from decays. The inner surfaces of IB, MB, and the beam hole of CSI were covered with plastic scintillators (their thicknesses were 5 mm, 10 mm, and 3 mm, respectively) to veto charged particles. Two layers of 3-mm-thick plastic scintillation counters (CV) citeCV were placed upstream of CSI to veto charged particles. To veto charged particles escaping through the beam hole of CSI, three layers of wire chambers were placed downstream of CSI in the beam (newBHCV). To veto photons passing through the beam hole, four sets of collar-shaped undoped Cesium Iodide counters were installed in CSI (CC03) and downstream of CSI (CC04, CC05, and CC06). To veto photons passing through the beam hole, sixteen modules, each made of lead and aerogel (BHPV) cite_BHPV , and four modules, each made of lead and acrylic plates (BHGC), were placed downstream of CSI. To veto particles going upstream, a counter made of undoped Cesium Iodide crystals (NCC) was placed inside of FB. The waveform of the signal from all the detector components was recorded with either 125 MHz or 500 MHz digitizers. Details of the KOTO detector are available in Refs. KOTOdet ; KOTO2015 .
In this analysis, we used data taken in the periods of from May to June 2016, from May to July 2017, and from January to February 2018 with the proton beam power of 42-50 kW, corresponding to protons on target in total. The trigger required an energy deposit of MeV in CSI with no coincident signals in IB, MB, CC03, CC04, CC05, CC06, CV, and NCC. The online energy thresholds for the veto counters were set sufficiently higher than those used in the offline analysis to avoid acceptance loss. With CSI, the number of clusters was calculated online. A cluster is defined as a collection of contiguous crystals with energies deposited larger than 22 MeV and 44 MeV for the small and large crystals, respectively. The data with exactly three clusters in CSI was used to search for the decay. Details of data acquisition system are available in Ref. JayDAQpaper .
Candidates for were required to have exactly three clusters, , and (hereafter, are indices of two ’s from decay and 0 is for the other ) in CSI. Each cluster was reconstructed by integrating all adjoining crystals located within 70 mm and with the deposited energy larger than 3 MeV cite_masuda . The cluster energy was defined as the sum of all the energy deposits of the crystals in the cluster. The cluster timing and position were defined as energy-weighted averages of the timings and crystal locations, respectively. All the cluster timings were required to be within 10 ns of each other. The clusters were required to be outside the beam hole region: mm.
The decay vertex position of the along the beam, , was first reconstructed assuming that two of the three clusters were from the , the decay position was along the axis, and the invariant mass, , was equal to the nominal mass. Of the three photon combinations, the one with the smallest absolute magnitude of two vertex displacement, , was selected, where was calculated by assuming that the invariant mass of all the three ’s equals the nominal mass of . The four-momenta of the three ’s were then reconstructed assuming that they are produced at . The optimization of selection criteria (cuts) and estimation of acceptances were based on the Monte Carlo (MC) simulation using the GEANT4 package citegeant4_1 ; citegeant4_2 ; citegeant4_3 . To reflect the real beam-related activities, the MC events were further overlaid with random trigger data taken during physics data collection.
To avoid bias, we adopted a blind analysis technique: the signal region (SR) had been defined in the two-dimensional space of , and the selection criteria were determined using a data set with all the events in the SR removed. To gain the largest possible efficiency for while suppressing the background contribution, the SR was defined to be , and . The range of the decay vertex position was determined to be more upstream than that of analysis (), because the decay contributes to the downstream region. The side band regions were used as control regions (CRs). The region referred to as CR2, defined as and , dominated by decays, was used to calculate the yield.
The shape of each cluster in the - plane was required to be consistent with the shape of electromagnetic shower from a single photon obtained by the MC simulation. The MC template of the nominal energy deposits and their standard deviations in crystals was prepared as a function of the incident angle of and the observed cluster energy, and was used to compute a value (shape ). We required all the cluster candidates to satisfy . These requirements discriminated a hadronic cluster due to neutrons or a fusion cluster from photon overlaps in close proximity. To further remove clusters produced by neutrons, a neural network technique (NN) TMVA2007 was used to distinguish clusters from neutron clusters based on the information on two-dimensional cluster shape, relative energies of crystals, energy-weighted -position of the cluster, timings of the observed signals in crystals, and the ’s incident angle. All the ’s were required to have a likelihood of more than 0.8, which corresponds to 90% efficiency for ’s and 33 reduction for neutrons.
To suppress other decays, we required no in-time signals in the veto counters above each threshold. In particular, we imposed stringent energy thresholds of MeV in the three barrel counters (FB, MB, and IB) and NCC. After imposing all the veto cuts, the decay was the largest contribution of all the background sources. This decay mode could be a background if a photon with a small energy was undetected by the veto counters or two of the four clusters in CSI fused. To suppress this contribution, the two vertex displacement was required to satisfy as shown in Fig. 2a. Furthermore, the minimum photon energy of three ’s () was required to be larger than 600 MeV, as shown in Fig. 2b. The momentum was calculated as a sum of momenta of , , and , and its transverse momentum and polar angle with respect to the axis were required to be less than 100 MeV and , respectively ( direction cuts). Figures 3a and 3b show the reconstructed mass () versus decay vertex () plots after imposing the cuts described above for the decay and other decays generated by MC, respectively. A summary of the estimated acceptances for the , , and decays at each step by the MC samples is shown in Table 1
| Index | Selection | |||
|---|---|---|---|---|
| 1 | decay 111 A probability that decay occurs in the SR. | 9% | 9% | 9% |
| 2 | Geometry and trigger | |||
| 3 | Shape of clusters | |||
| 4 | position of clusters | |||
| 5 | direction | |||
| 6 | Veto | |||
| 7 | Separation of with NN | |||
| 8 | ||||
| 9 | 300 MeV | |||
| 10 | 600 MeV | |||
| 11 | CR2, 300 MeV | - | ||
| 12 | SR, 600 MeV | - |
. From the indices of 1 to 10, the accumulated acceptances are shown, whereas for 11 and 12, cuts of 1 to 8 are included.
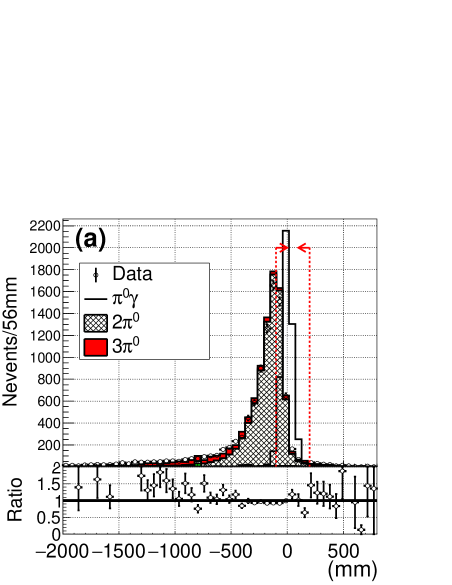
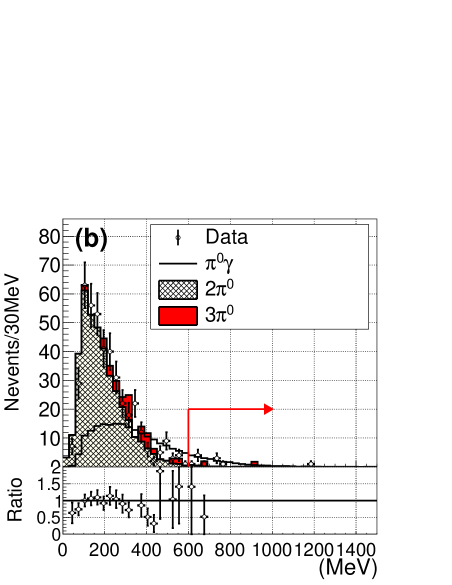
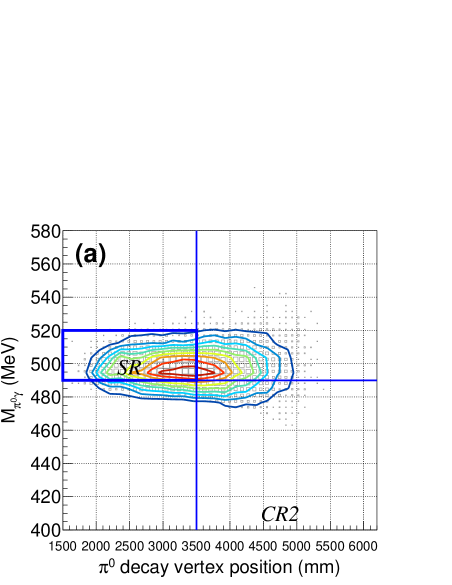
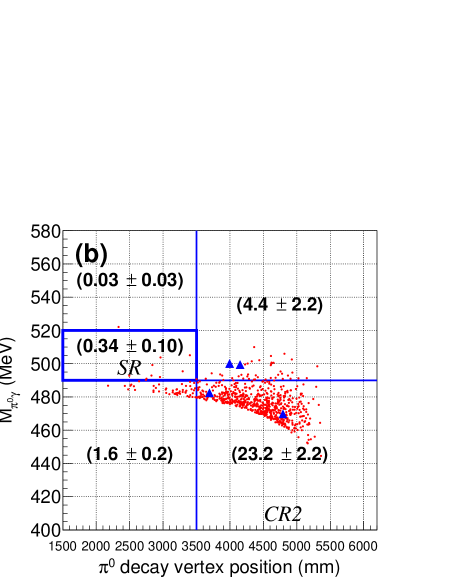
Table 2
| Source | Number of events |
|---|---|
| Neutron | |
| Other decays | |
| Total | 222 See the main text for this calculation. The total number of events and its uncertainty in the SR only include background estimates with central values because all of the upper limits came from the limited statistics of MC samples. If the contributions of all the sources are assumed, the upper limit of the number of backgrounds in the SR is 1.0 at 68% C.L. |
summarizes the expected number of background events in the SR. The contribution of the events in the SR was estimated to be:
| (1) |
where is the number of the observed events in the CR2 region with an energy threshold for photons of MeV, is the number of events in the corresponding region with an energy threshold of 600 MeV (300 MeV) estimated by the MC simulation, and is the purity of the decay in the CR2.
The number of events in the SR was estimated based on another control region dominated by the decays, MeV, where , and are the four-vectors of the three ’s dalitzexp . Using the number of events in this region () and at 68% C.L., we estimated the number of events in the SR to be less than at the 68% C.L.
If the decay was coincident with an accidental hit in CSI, it could become a background. We generated the MC samples of the decay, corresponding to 18 times the experimental data, and found that no events satisfied the cuts.
Another type of background was the production by an interaction of beam halo neutrons in NCC, where two photons from the decay entered CSI with an additional accidental hit. We produced a MC sample and confirmed that the requirement removed all the events in the SR even without imposing various cuts: shape , direction, separation with NN, and . We thus set the upper limit to be 0.02 at the 68% C.L., assuming Poisson distribution.
The decay mode could be a background to if one of the energies was soft in the laboratory frame. However, due to its small branching fraction of PDG_paper , its contribution was negligible.
We also studied the contributions from decays with charged particles in the final state. The cut on CV hits suppressed the contributions in the SR to be less than 0.04 events at the 68% C.L.
The total number of background events and its uncertainty in the SR only includes background estimates with central values because all of the upper limits came from the limited statistics of MC samples. On the other hand, if we conservatively consider the contributions of all the sources, the upper limit of the number of backgrounds in the SR was 1.0 at the 68% C.L.
The branching fraction of the signal was measured using the numbers of events in the SR and CR2 as:
| (2) |
where is the number of observed events in the SR, is the single event sensitivity of the decay, is the number of the events in the CR2 (under the condition of MeV), , , and are the acceptances obtained by the MC of the , , and decays in each region, respectively, and and are the branching fraction of the and decays, respectively PDG_paper . The obtained was , where the first and second uncertainties are statistical and systematic, respectively.
The various sources of uncertainties on are summarized in Table 3.
| Source | Uncertainty[%] |
|---|---|
| Offline veto | 17 |
| Kinematic selection | 12 |
| Online veto | 6.4 |
| Online cluster counting | 1.8 |
| Shape and separation with NN | 1.5 |
| Geometrical | 1.5 |
| Clustering | 1.0 |
| Reconstruction | 0.3 |
| 0.6 | |
| Statistics for normalization | 4.4 |
| Total |
As Eq. 2 shows, systematic uncertainties due to common bias between the and decays cancel ( contribution is only 3%). Thus, we used the events in the CR2 to conservatively evaluate the acceptances of offline and online vetoes, common kinematic selection, online cluster counting, geometry, and reconstruction. Kinematic selections which were not considered to be common were , and the acceptance being inside of the SR. However, the aceptances of these cuts for the decay are much smaller than the decay, and the evaluation of the uncertainty of by the decay is also conservative. For this reason, we evaluated their uncertainties using the events in the CR2 by the loosening threshold down to 300 MeV. Shape , separation with NN, and clustering, were evaluated using a different control sample which is dominated by the decays.
The largest contribution came from the discrepancies of the offline veto acceptances between data and MC. The systematic uncertainty of a given offline cut was calculated using a double ratio:
| (3) |
where are the numbers of events after imposing all the vetoes, and are the corresponding numbers when one of the vetoes was removed. The deviation of from 1 was the systematic uncertainty from the offline veto. The quadratic sum of all the vetoes was the total systematic uncertainty due to offline veto. The second largest effect came from the systematic uncertainty of the kinematic selection described before. Similarly to the offline veto cuts, we relaxed one of the kinematic cuts and compared the double ratio between data and MC. This uncertainty was mainly caused by the limited statistics of data used for this evaluation. The third largest source of the systematic uncertainty was from the online veto. This was estimated using data triggered without imposing online vetoes while keeping the information on online trigger decision. This uncertainty was mainly due to the intentionally-loosened offline veto energy threshold of CV set to minimize the acceptance loss from the accidental hits. As a result, the online threshold was close to that of the offline threshold. Uncertainties from online cluster counting, cluster-shape discrimination, geometrical acceptance, clustering, and reconstruction were smaller than those from the three aforementioned sources. The uncertainty of the branching fraction of was taken from the PDG value PDG_paper . The total statistical and systematic uncertainties were 4.4% and 22%, respectively.
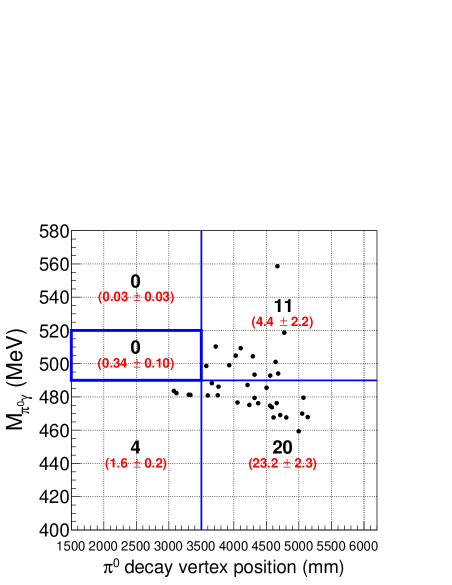
After determining the cuts described above, we unmasked the SR and observed no candidate events, as shown in Fig. 4. The discrepancy between the number of observed events and the MC simulation in the upper right region could be explained by the limited statistics of the simulated decay sample. In fact, when we loosened the cut on the minimum photon energy () from 600 MeV to 300 MeV, the contribution from the and decays by the MC simulation increased to and , respectively, in which uncertainties were statistical only, and the sum of them was consistent with the observation of 96 events. Taking into account the systematic uncertainty of Cousins , the upper limit was set to at the 90% C.L. This is the first experimental upper limit set on the decay.
In conclusion, we searched for the decay, which is forbidden by Lorentz invariance and gauge invariance, for the first time. From the data collected between 2016 and 2018, we observed no candidate events in the signal region. The first upper limit of the branching fraction of the decay is at the 90% confidence level.
Acknowledgement
We would like to express our gratitude to all members of the J-PARC Accelerator and Hadron Experimental Facility groups for their support. We also thank the KEK Computing Research Center for KEKCC and the National Institute of Information for SINET4. This work was supported by the Ministry of Education, Culture, Sports, Science, and Technology (MEXT) of Japan and the Japan Society for the Promotion of Science (JSPS) under the MEXT KAKENHI Grant No. JP18071006, the JSPS KAKENHI Grants No. JP23224007, and No. JP16H06343, by the research fellowship program for postdoctoral scientists No. 17J02178, and through the Japan-U.S. Cooperative Research Program in High Energy Physics; the U.S. Department of Energy, Office of Science, Office of High Energy Physics, under Awards No. DE-SC0006497, No. DE-SC0007859, and No. DE-SC0009798; the Ministry of Education and the Ministry of Science and Technology in Taiwan under Grants No. 104-2112-M-002-021, 105-2112-M-002-013 and 106-2112-M-002-016; and the National Research Foundation of Korea (2017R1A2B2011334 and 2019R1A2C1084552).
References
- (1) S. Oneda, S. Sasaki, and S. Ozaki, Prog. Theo. Phys. 5, 165 (1950).
- (2) S. Coleman, and S. L. Glashow, Phys. Rev. D 59, 116008 (1999).
- (3) Y. Michimura, N. Matsumoto, N. Ohmae, W. Kokuyama, Y. Aso, M. Ando, and K. Tsubono, Phys. Rev. Lett. 110, 200401 (2013).
- (4) M. E. Tobar, P. Wolf, S. Bize, G. Santarelli, and V. Flambaum, Phys. Rev. D 81, 022003 (2010).
- (5) B. Melić, K. P. Kumeric̆ki, and J. Trampetić, Phys. Rev. D 72, 057502 (2005).
- (6) A. V. Artamonov et al., Phys. Lett. B 623, 192 (2005).
- (7) T. Shimogawa, Nucl. Instrum. Methods A 623, 585 (2010).
- (8) A. J. Buras et al., J. High Energy Phys. 11 033 (2015).
- (9) E. Iwai et al., Nucl. Instrum. Methods A 786 135 (2015).
- (10) T. Masuda et al., Nucl. Instrum. Methods A 746, 11 (2014).
- (11) R. Murayama, M. Togawa et al., Nucl. Instrum. Methods A 953, 163255 (2020).
- (12) D. Naito et al., Prog. Theor. Exp. Phys., 2016, 023C01 (2016).
- (13) Y. Maeda et al., Prog. Theor. Exp. Phys., 2015, 063H01 (2015).
- (14) J. K. Ahn et al., Prog. Theor. Exp. Phys., 2017, 021C01 (2017).
- (15) J. K. Ahn et al., Phys. Rev. Lett. 122, 021802 (2019).
- (16) C. Lin et al., J. Phys. Conf. 1526, 012034 (2020).
- (17) T. Masuda et al., Prog. Theor. Exp. Phys., 2016, 013C03 (2016).
- (18) S. Agostinelli et al., Nucl. Instrum. Methods A 506, 250 (2003).
- (19) J. Allison et al., IEEE Trans. Nucl. Sci. 53, 270 (2006).
- (20) J. Allison et al., Nucl. Instrum. Methods A 835, 186 (2016).
- (21) A. Hoecker et al., PoS A CAT 040 [physics/0703039] (2007).
- (22) M. Tanabashi et al., (Particle Data Group), Phys. Rev. D 98, 030001 (2018).
- (23) For the decay, . This value becomes smaller when the decay makes a three cluster event with missing either , whereas this value can become larger when the decay makes a three cluster event with fusion clusters.
- (24) R. D. Cousins, and V. L. Highland, Nucl. Instrum. Methods A 320, 331 (1992).