PASA \jyear2024
Unexpected Circular Radio Objects at High Galactic Latitude
Abstract
We have found a \alterclass of circular radio objects in the Evolutionary Map of the Universe Pilot Survey, using the Australian Square Kilometre Array Pathfinder telescope. The objects appear in radio images as circular edge-brightened discs, about one arcmin diameter, \alterthat are unlike other objects previously reported in the literature. We explore several possible mechanisms that might cause these objects, but none seems to be a \revbcompelling explanation.
doi:
10.1017/pas.2024.xxxkeywords:
Extragalactic radio sources1 Introduction
Circular features are well-known in radio astronomical images, and usually represent a spherical object such as a supernova remnant, a planetary nebula, a circumstellar shell, or a face-on disc such as a protoplanetary disc or a star-forming galaxy. They may also arise from imaging artefacts around bright sources caused by calibration errors or inadequate deconvolution. Here we report the discovery of a class of circular feature in radio images that do not seem to correspond to any of these known types of object or artefact. For brevity, and lacking an explanation for their origins, we dub these objects “Odd Radio Circles”, or ORCs.
These objects were first discovered in the Pilot Survey (Norris et al., 2020) of the Evolutionary Map of the Universe (EMU: Norris et al., 2011), which is an all-sky continuum survey using the newly-completed Australian Square Kilometre Array Pathfinder telescope (ASKAP) (Johnston et al., 2007, 2008; McConnell et al., 2016).
Three ORCs (ORCs 1–3) were discovered by visual inspection of the images from the survey. Their rarity, together with their low surface brightness, makes it unlikely that they could have been discovered in previous radio surveys.
We discovered a further ORC (ORC 4) in archival data taken with the Giant MetreWave Radio Telescope (GMRT) (Ananthakrishnan & Pramesh Rao, 2001) in March 2013. In most respects it is very similar to ORCs 1–3, but differs in having a central radio continuum source.
We observed three of the ORCs with the Australia Telescope Compact \revbArray (ATCA: Wilson et al., 2011) and the Murchison Widefield Array (MWA: Tingay et al., 2013) to provide independent confirmation of the reality of these objects, and to provide spectral index information.
The EMU Pilot Survey area is covered by Data Release 1 of the Dark Energy Survey (DES: Abbott et al., 2018) and we use DES data throughout this paper, together with infrared data from the Wide-field Infrared Survey Explorer (WISE) (Wright et al., 2010), and, for ORC 4, optical data from the Sloan Digital Sky Survey SDSS (Aguado et al., 2019).
In Sections 2 and 3 of this paper we describe the observations and results. In Section 4 we present the observational properties of the ORCs, and in Section 5 we discuss possible causes of this phenomenon.
Throughout this paper we assume a flat CDM cosmology, based on Planck Collaboration et al. (2018), with the following parameters: H0 = 67.36. = 0.3153, = 0.6847. For a source with flux density S at frequency , we define spectral index as .
2 Observations
2.1 ASKAP Observations
ASKAP consists of -m antennas, each of which is equipped with a chequerboard Phased Array Feed (PAF), giving a field of view of about 30 square degrees of the sky, resulting in a high survey speed. A full description of ASKAP may be found in Hotan et al. (2020; in preparation).
The EMU Pilot Survey (Norris et al., 2020) (hereafter EMU-PS) consists of ten observations, each lasting 10–12 hours, in the period 15 July to 24 November 2019. Between 32 and 36 ASKAP antennas were used in each observation, always including the outer four, with baselines up to 6.4 km, with the remaining antennas within a region of 2.3 km diameter. We used 36 PAF beams, with the beam centres separated by 0.9 degrees, arranged in the “Closepack36” configuration (Norris et al., 2020). Specifications of the observations are given in Table 1.
| Area of survey | 270 deg2 |
|---|---|
| Field centre | 21h, –55 degr |
| Synthesised beamwidth | FWHM |
| Frequency range | 800 – 1088 MHz |
| Observing configuration | closepack36, pitch 0.9∘ |
| no interleave | |
| Weighting | Robust = 0 |
| RMS sensitivity | 25 – 35 Jy/beam |
| Total integration time | 100 hours |
| Number of sources detected | 250,000 |
2.2 ATCA Observations
We observed ORC 1 and ORCs 2–3 (Project code C3350) with the Australia Telescope Compact Array (ATCA) on 9–10 April 2020, at 1.1–3.1 GHz (weighted central frequency after the removal of radio frequency interference = 2121 MHz), over a period of 2 12 hours using the 6A configuration. The data were processed using miriad, using the standard ATCA multi-frequency synthesis process, and cleaned with a robustness of +0.5. The observations were affected by radio frequency interference, resulting in a relatively high rms of 10–15 Jy/beam, with a synthesised beamsize of 5.0 4.3 arcsec.
2.3 GMRT Observations
ORC-4 was found in archival 325 MHz GMRT data taken on the cluster source project (ID 23 017) (Venturi et al., 2017) on the cluster Abell 2142. The data were reprocessed with the SPAM pipeline (Intema et al., 2017) yielding a sensitivity of 47 Jy/beam at the field center, and a resolution of 9.4 7.9 arcsec. At the location of the ORC, the sensitivity is 66 Jy/beam, mainly due to primary beam attenuation.
2.4 MWA Observations
The observations with the Murchison Widefield Array (Tingay et al., 2013) in its ‘Phase II’ extended configuration (MWA-2: Wayth et al., 2018) were taken as part of project G0045 which aims to image diffuse, non-thermal radio emission in galaxy clusters across five frequency bands of MHz centered on 88, 118, 154, 185, and 216 MHz. As these observations have a large field of view, ORC1 and ORC2 fall within the primary beam main lobe half power point in one of the observed fields: ‘FIELD4’. MWA observations of this form are taken in a 2-min snapshot mode due to a fixed primary beam. All data undergo radio frequency interference flagging using AOFlagger (Offringa et al., 2015). To increase integration time on a source, large numbers of 2-min snapshots are independently calibrated with the full-Jones Mitchcal algorithm (Offringa et al., 2016), independently imaged, and finally stacked in the image plane as a linear mosaic.
MWA-2 data reduction for this work follows the process described in detail by Duchesne et al. (2020), using a purpose-written MWA-2 pipeline (piip 111https://gitlab.com/Sunmish/piip).
2.5 Measurement of Flux Density and Spectral Index
To measure flux densities, we used the measure_source.py tool222https://github.com/nhurleywalker/polygon-flux, in which a polygon is drawn around the source (Hurley-Walker et al., 2019). \alterEstimated uncertainties include a noise term and also the uncertainty in the flux density scale for each measurement.
Spectral indices were derived by weighted least-squares fitting to the flux densities listed in the Tables, assuming a power-law spectral energy distribution. The uncertainty on the spectral index was estimated using the leastsq algorithm in scipy.optimize333https://docs.scipy.org/doc/scipy/reference/optimize.html.
2.6 Optical/IR properties
Photometry for the galaxies that may be associated with the ORCs were taken from the DES (Abbott et al., 2018), WISE (Wright et al., 2010), and GALEX (Morrissey et al., 2007) surveys and are listed in Tables 2 to 3.
The photometric redshifts listed in Tables 2 to 3 typically have quoted uncertainties of 0.01–0.02, but on the other hand we have found that independent photometric redshifts by different authors of radio sources in the EMU-PS field typically differ by 0.1–0.2, and so we regard this as being a more realistic uncertainty.
. ASKAP GALEX DES WISE Source Name ID flux FUV NUV g r i z Y W1 W2 W3 W1–W2 z Notes [mJy] [mag] [mag] [mag] WISE J210258.15–620014.4 ORC 1 C 0.1 — — 22.04 20.10 19.23 18.79 18.70 15.065 14.984 12.939 0.081 \revb0.5513 0.06 0.01 0.01 0.02 0.04 0.031 0.061 WISE J210257.88–620046.3 ORC 1 S 0.86 23.7 22.3 19.733 18.945 18.550 18.351 18.311 15.472 15.063 11.201 0.409 \revb0.2283 1.2 0.3 0.005 0.003 0.005 0.008 0.023 0.034 0.057 0.138 WISE J205851.65–573554.1 ORC 2 A 1.0 25.9 20.9 17.676 17.355 17.263 17.253 17.352 16.038 16.501 12.716 –0.463 1.372 listed as a star in Gaia DR2 (Gaia Collaboration et al., 2018) 4.0 0.1 0.001 0.001 0.001 0.002 0.01 0.050 0.252 WISE J205848.80–573612.1 ORC 2 B 1.7 — — 20.53 19.03 18.52 18.20 18.09 15.138 14.995 12.431 0.143 \alter0.3111 2.5 arcsec extended galaxy 0.02 0.01 0.01 0.01 0.05 0.035 0.071 WISE J205847.91–573653.8 ORC 2 C 0.2? — — 21.38 20.95 20.82 20.72 20.37 15.499 14.930 11.729 0.569 \alter0.2861 edge-on spiral 0.02 0.02 0.02 0.03 0.2 0.041 0.066 0.232 \alterRedshifts are taken from 1(Bilicki et al., 2016), 2(Drlica-Wagner et al., 2018) \revb3(Zou et al., 2019)
| GMRT | GALEX | SDSS | WISE | ||||||||||||
| Source Name | ID | flux | FUV | NUV | u | g | r | i | z | W1 | W2 | W3 | W1–W2 | z | Notes |
| [mJy] | [mag] | [mag] | [mag] | ||||||||||||
| WISE J155524.65+272633.7 | G | 1.15 | — | — | 22.61 | 21.18 | 19.64 | 19.00 | 18.40 | 14.847 | 15.119 | 12.341 | –0.272 | 0.385 | |
| SDSS J155524.63+272634.3 | ? | 0.70 | 0.09 | 0.03 | 0.03 | 0.06 | 0.057 | 0.112 | 0.483 | 0.126 | |||||
Galaxy classification was estimated using the WISE colours, following the WISE colour-colour diagram (Wright et al., 2010), and also using the DES and GALEX colours in a colour-magnitude diagram (e.g. Masters et al., 2011; Schawinski et al., 2014). However these classifications are quite uncertain because \alterthey are redshift-dependent and most of the galaxies do not have a spectroscopic redshift.
3 Results
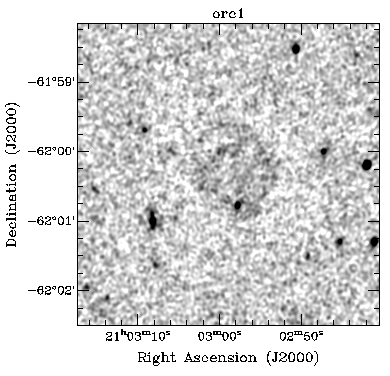
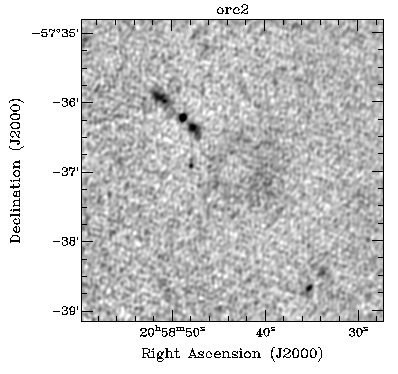
Figure 1 shows the radio and optical images of the ORC 1 (top), ORCs 2 & 3 (middle) and ORC 4 (bottom), and their positions are listed in Table 4. Measured flux densities and spectral indices are shown in Table 5.
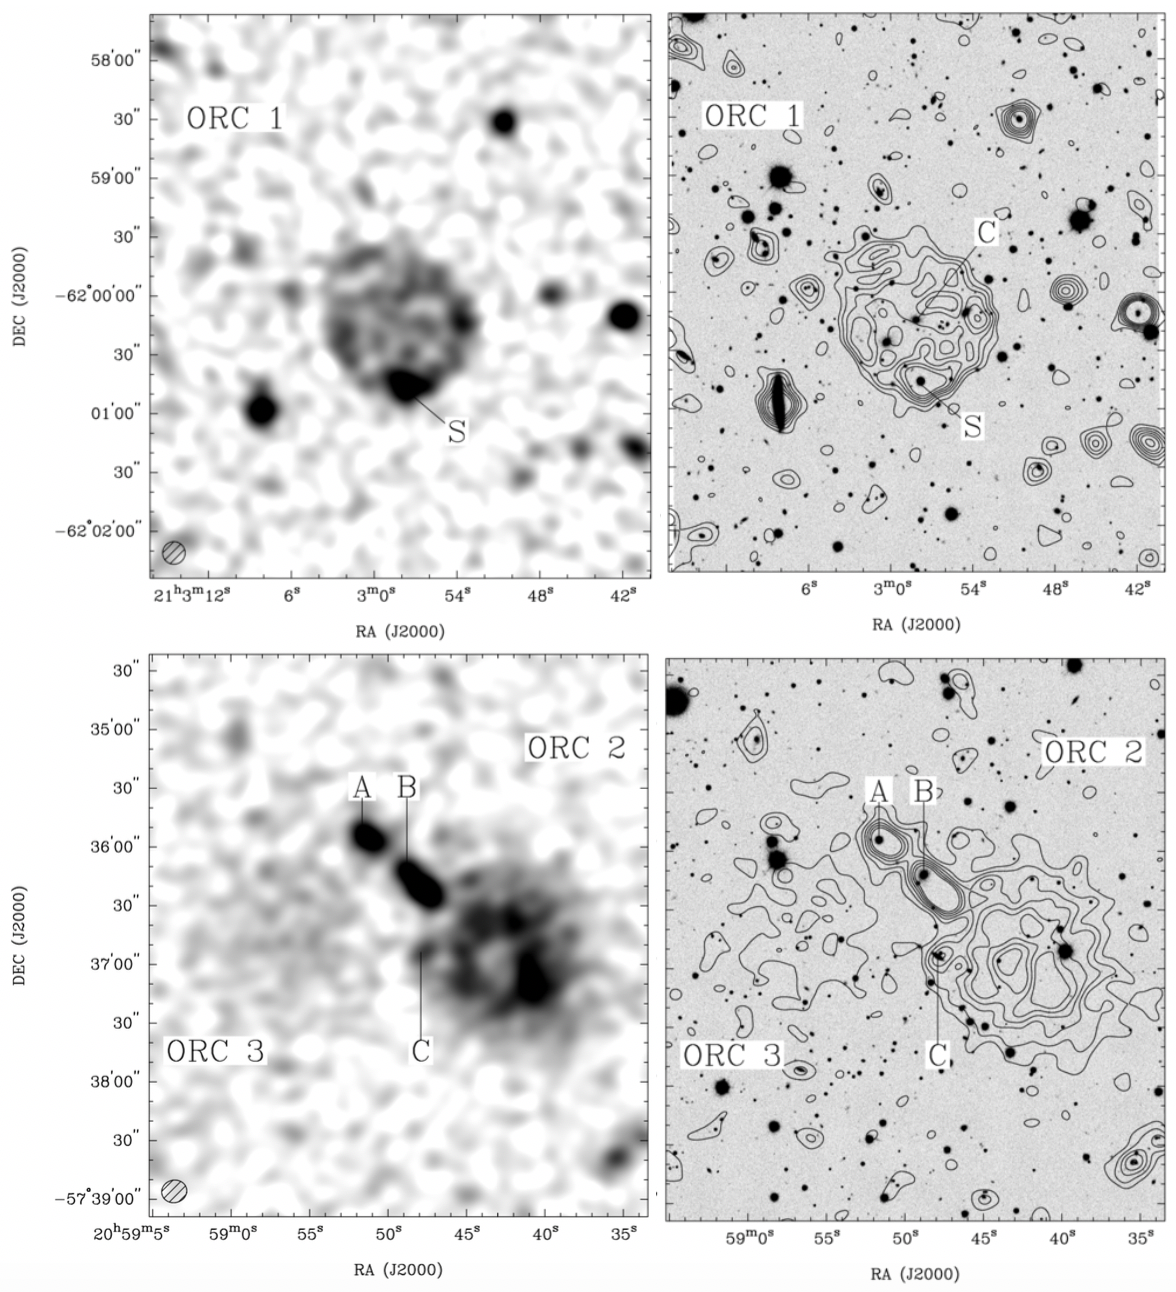
It is difficult to appreciate the structure of these sources in a simple greyscale image with a linear transfer function, so in Figures 2 and 3 we show images that have been modified to bring out features of interest that may not be apparent in Figure 1. The details of the transformation applied are shown in the Figure captions.
| ID | Name | RA (deg) | Dec (deg) | l | b | \alter observation |
|---|---|---|---|---|---|---|
| J2000 | J2000 | (deg) | (deg) | |||
| ORC 1 | EMU PD J210357.9–620014 | 315.74292 | –62.00444 | 333.41592 | -39.00906 | EMU-PS |
| ORC 2 | EMU PD J205842.8–573658 | 314.67833 | –57.61611 | 339.08813 | -39.52277 | EMU-PS |
| ORC 3 | EMU PD J205856.0-573655 | 314.73458 | –57.61528 | 339.08147 | -39.55247 | EMU-PS |
| ORC 4 | 155524.63+272634.7 | 238.85272 | +27.44271 | 44.35860 | 49.36566 | GMRT |
| source | 88 | 118 | 154 | 944 | 2121 | |
|---|---|---|---|---|---|---|
| MHz | MHz | MHz | MHz | MHz | ||
| ORC 1 | 10516.5 | 69.58.6 | 386.0 | 6.261.25 | 2.290.23 | –1.170.04 |
| ORC 1(S) | . | 0.600.12 | 0.150.03 | –1.710.35 | ||
| ORC 2 | 2814.4 | 256.8 | 145.3 | 6.971.39 | 2.310.23 | –0.800.08 |
| ORC 2(A) | 0.460.10 | 0.460.05 | 0.00.34 | |||
| ORC 2(B) | 0.760.15 | 0.660.07 | –0.170.22 | |||
| ORC 2(C) | 0.190.05 | 0.070.03 | –1.230.36 | |||
| ORC 3 | 5 | 1.860.37 | 1.0 | –0.500.20 |
None of the ORCs has obvious optical, infrared, or X-ray counterparts to the diffuse emission, although in two cases there is an optical galaxy near the centre of the radio emission.
ORCs 1–2 were subsequently observed at 2.1 GHz with the Australia Telescope Compact Array (ATCA) resulting in the images shown in Figure 4, and were also found in previously observed data at 88–154 MHz with the Murchison Widefield Array (MWA).
Our current radio data do not enable the measurement of polarisation or in-band spectral index for such faint diffuse objects.
4 Properties of the ORCs
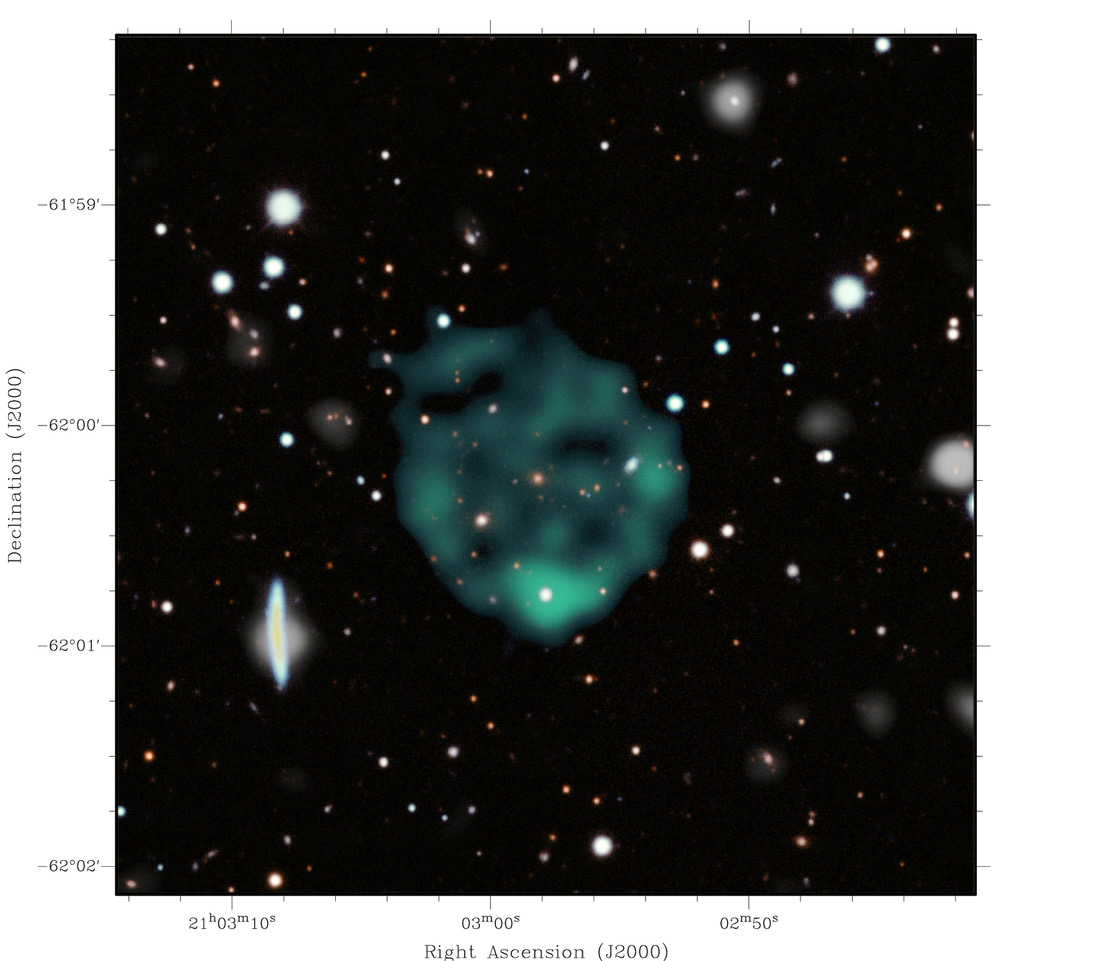
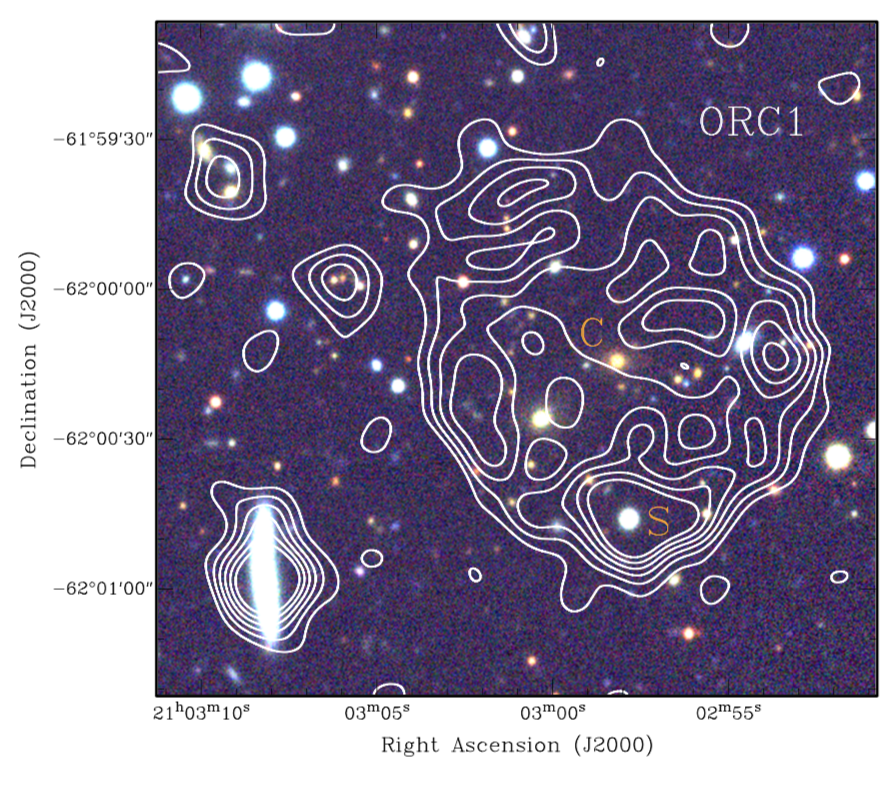
4.1 ORC 1: EMU PD J210357.9–620014
This radio source (diameter 80 arcsec) has a near circular, edge-brightened filled morphology with brighter spots around its periphery. Figure 5 shows the radio contours overlaid on the DES 3-color () optical image. There is no optical emission corresponding to the ring. The typical radio brightness over ORC 1 in the ASKAP image is 130 Jy/beam, with an integrated flux density of 6.26 mJy. By comparing our data from all the radio observations, we derive a spectral index of the diffuse emission of . Such a steep spectral index may indicate an ageing electron population, as often found in SNRs, cluster haloes, and dying radio galaxies (Murgia et al., 2002).
On the southern edge of the ring is a bright radio source (labelled “S” in Figure 1) which is associated with a galaxy detected both by WISE (WISE J210257.88–620046.3) (Wright et al., 2010) and by GALEX (GALEXASC J210257.91–620045.4) (Morrissey et al., 2007). The WISE colours indicate that this is a star-forming galaxy, and possibly a starburst or LIRG (luminous infrared galaxy). \revbZou et al. (2019) measure a photometric redshift of 0.228 for this galaxy.
The radio observations listed in Table 5 show that source S has a spectral index of , making it more likely to be an active galactic nucleus (AGN) than a star-forming galaxy. The space density of radio sources in the EMU-PS at least as bright as source S is per deg2, giving a 15% probability that an unrelated source \altermay be located within the 1.4 arcmin2 area of ORC 1. It is therefore possible that this is an unrelated object, physically unconnected to the diffuse object.
At the centre of the ring is a faint optical object (WISE J210258.15–620014.4), labelled “C” in Figure 1, with no detectable radio emission in any of our observations. The enlarged DES -band image in Figure 5 shows that this central object is extended E-W with a total extent of about 6 arcsec, (c.f. the 1 arcsec resolution of DES) and is probably a galaxy.
The WISE colours for the central object (W1–W2 = 0.081, W2–W3 2.045 ) do not enable us to distinguish between a star-forming galaxy or a quiescent galaxy, but the optical colours suggest a quiescent galaxy. \revbZou et al. (2019) measure a photometric redshift of 0.551 for this galaxy.
At z=0.551, 6 arcsec corresponds to a diameter of 39 kpc, making it unlikely to be a normal star-forming galaxy at high redshift. The local space density of galaxies (6333 per sq deg at W115) mean that there is a 15% probability of there being a source brighter than 15 mag within 10 arcsec of the centre. We therefore consider it possible that this is an unrelated object.
One arcmin to the south-east of the radio source is a 16-magnitude galaxy (WISE J210308.23–620055.0) which is very elongated north-south in the optical image, and also appears as an elongated radio source. The WISE colours of this source are that of a spiral, so we consider it likely to be an edge-on spiral galaxy. It appears to be unconnected to the diffuse radio object and will not be discussed further.
4.2 ORC 2: EMU PD J205842.8–573658.
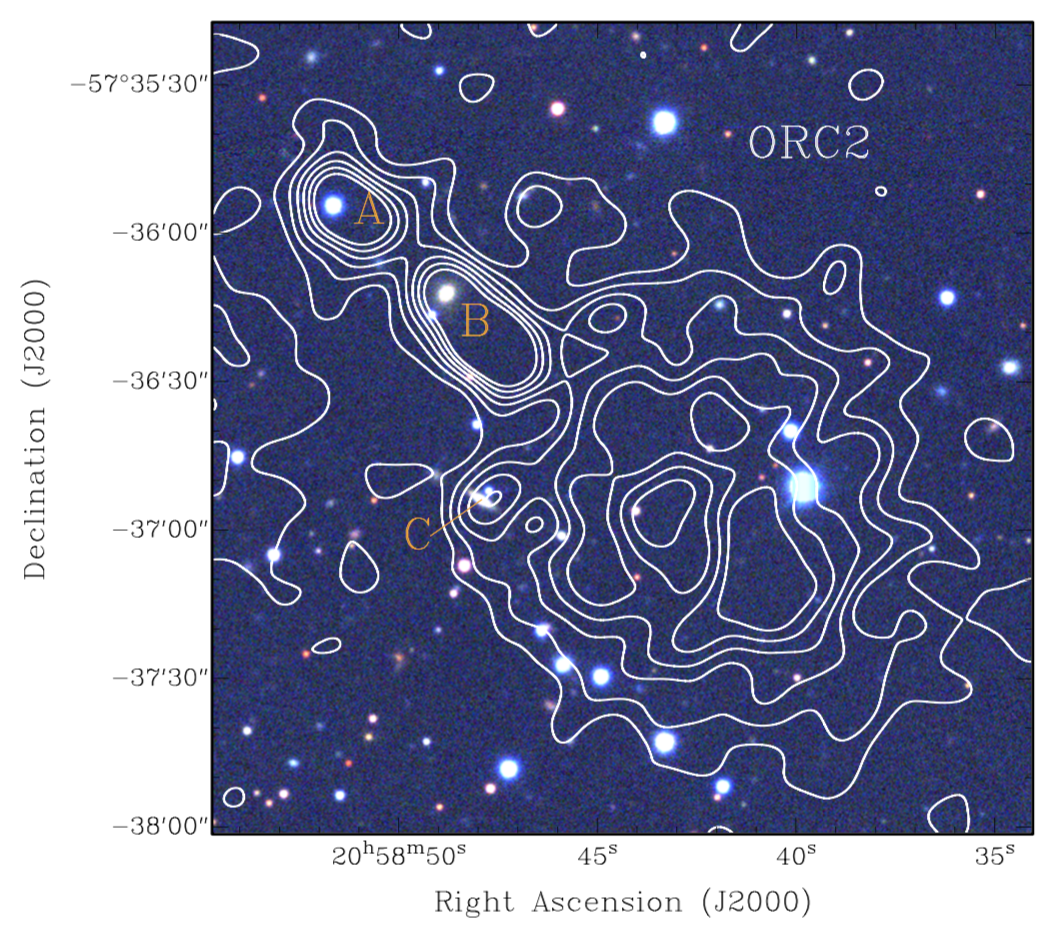
Like ORC 1, this unusual radio source (diameter 80 arcsec) has a near circular, edge-brightened filled morphology with brighter spots around its periphery. Figure 6 shows the radio contours overlaid on the DES 3-color (gri) optical image.
The typical brightness over the diffuse object is 100–200 Jy/beam, and the integrated flux density over the object (excluding sources A,B, and C) is 6.97 mJy at 944 MHz.
To the north-east of ORC 2 in the ASKAP image is a pair of strong radio components. The ATCA image (Figure 4) shows a flat-spectrum source between them which is not visible on the ASKAP image, but which appears to be the central component of a double-lobed radio source, and which is within 1 arcsec of the nearby optical galaxy labelled “B”, which is a 2.5 arcsec extended galaxy, at a redshift of 0.311.
The space density of components in the EMU-PS at least as strong as source B is about 219 per deg2, so the probability of finding B within 1 arcmin of the ORC is about 19%, and so while it is tempting to consider that this source is associated with the ORCs, it is also possible that this source is an unrelated object. We discuss a possible role for this source is Section 5.8.
Within the eastern limb of ORC 2 in the ASKAP image is a compact radio source which is coincident with the galaxy labelled C in Table 2, which appears in the DES image to resemble an edge-on disk galaxy. \revbIts colour of g-r=0.43 confirms that it is a star-forming galaxy, and so we classify this galaxy as an edge-on spiral. (e.g. Masters et al., 2011). The space density of components in the EMU-PS at least as strong as source C is about 1000 per deg2, so the probability of finding B within 1 arcmin of the ORC is about 90%, and so we consider it likely that this source is an unrelated object.
4.3 ORC 3: EMU PD J205856.0-573655.
Immediately to the east of ORC 2 is a another faint circular patch, which is visible in two independent observations with ASKAP, but is too faint to be seen in ATCA or MWA data. This faint diffuse patch, which we call ORC-3, has a typical brightness of 50–80 Jy/beam, and the integrated flux density over the object is 1.86 mJy at 944 MHz. It has a spectral index of , although this is quite uncertain because it depends on \alterone detection bracketed by two upper limits.
ORC 3 appears to be a fainter example of the ORC phenomenon exhibited by ORCs 1 and 2, but it is puzzling that it is so close to ORC 2. Within the EMU-PS, there are 2 very obvious ORCs (ORCs 1 and 2) and about six fainter “candidate ORCs”, \alterfound during a careful visual inspection of the area of the EMU-PS. While this is not a rigorously defined statistical sample, it enables us to estimate a space density of \alter 0.03 per deg2. The probability of one of these lying within 2 arcmin is therefore \alter . We therefore consider it unlikely that this is a chance association, but instead deduce that ORC 2 and ORC 3 are in some way related.
Assuming that ORC2 and 3 are driven by the same mechanism as the other ORCs, this militates against the ORCs being caused by a transient event.
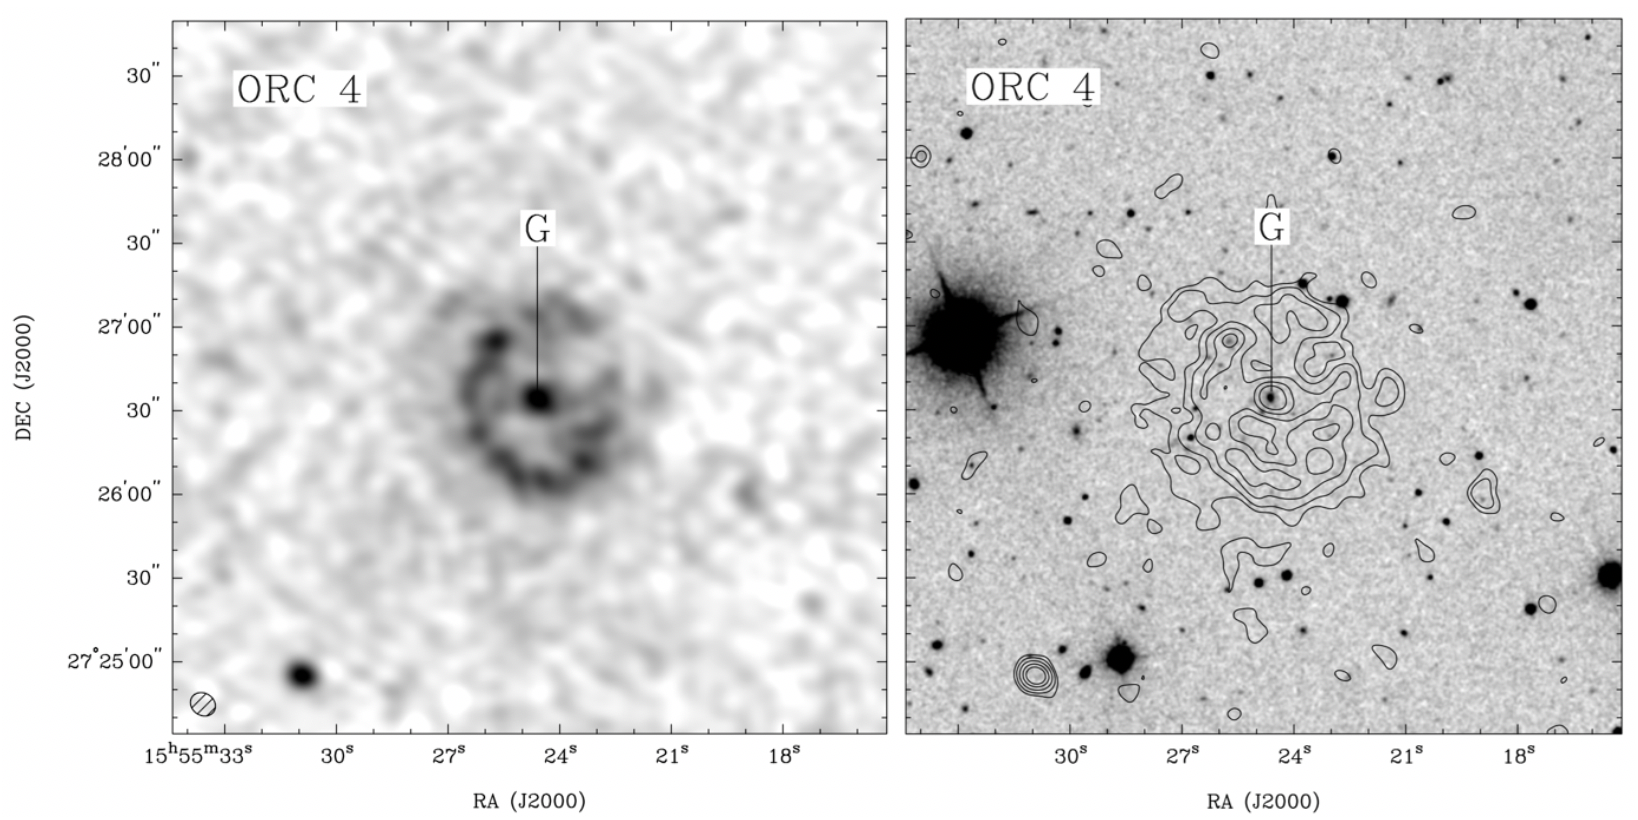
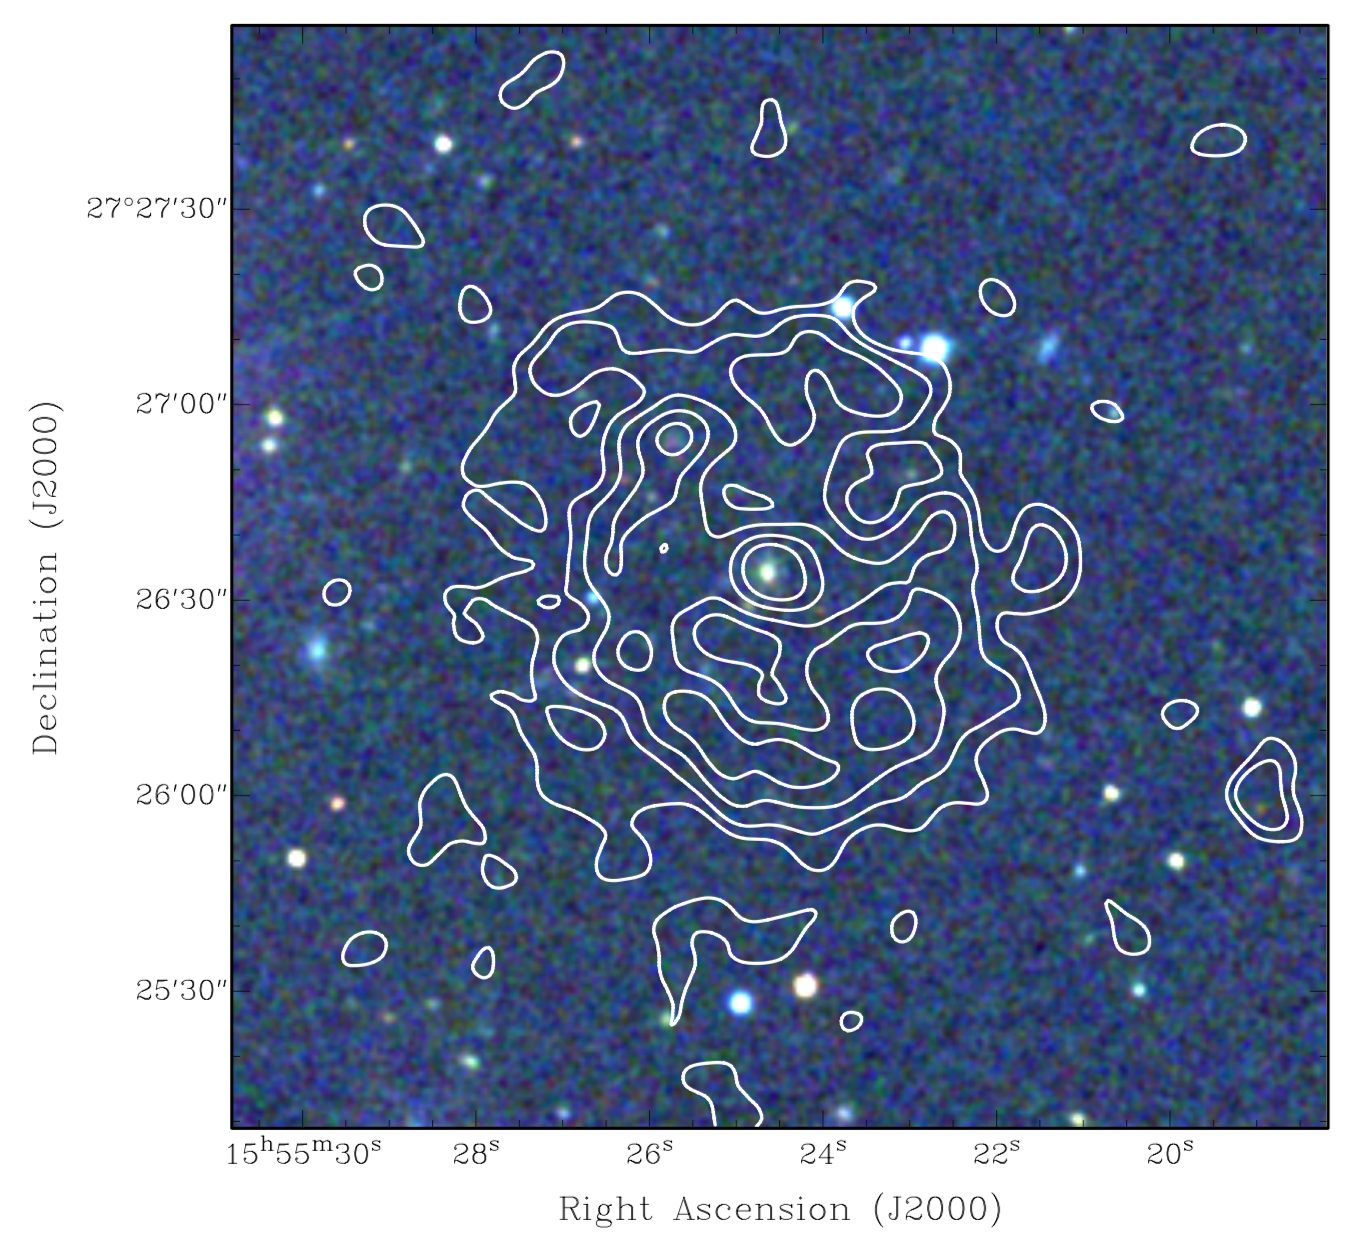
4.4 ORC 4
ORC 4 was discovered serendipitously by Intema in archival observations (Venturi et al., 2017) of the cluster Abell 2142 taken at 325 MHz with the Giant MetreWave Radio Telescope (GMRT: Ananthakrishnan & Pramesh Rao, 2001) in March 2013. \alterNote that Abell 2142 is 14 arcmin away from ORC4, at a redshift of 0.091, so is unlikely to be physically associated. Intema viewed hundreds of GMRT images before finding ORC4, suggesting these sources are rare. In most respects ORC 4 is very similar to ORCs 1–3, but differs in having a central radio continuum source.
ORC 4 is marginally detected at 150 MHz in TGSS (Intema et al., 2017) and at 1.4 GHz in NVSS (Condon et al., 1998a), but in both cases the image quality is poor because of poor sensitivity, uv-coverage, and low resolution. The measured total flux densities are given in Table 6.
| source | 150 | 325 | 1400 | |
|---|---|---|---|---|
| MHz | MHz | MHz | ||
| ORC 4 | 3910 | 282.8 | 5.30.7 | –0.920.18 |
| ORC 4(G) | 1.430.13 |
Combining all aperture flux measurements, we fit a single spectral index = –0.92 0.18.
ORC 4 differs from the other ORCs in having a central radio source, labelled “G” in Figure 1, which is listed in the NVSS catalogue (Condon et al., 1998a) as NVSS J155524+272629. It is coincident with a red galaxy seen in both SDSS and Pan-Starrs images, and detected by WISE. The compact source has an unambiguous optical/IR counterpart in SDSS (SDSS J155524.63+272634.3) and WISE (WISEA J155524.65+272633.7) with a photometric redshift of 0.39 (Bilicki et al., 2016) implying a linear size of the ring of 410 kpc 350 kpc.
4.5 Summary of ORC properties
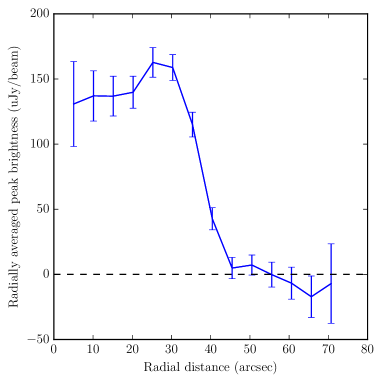
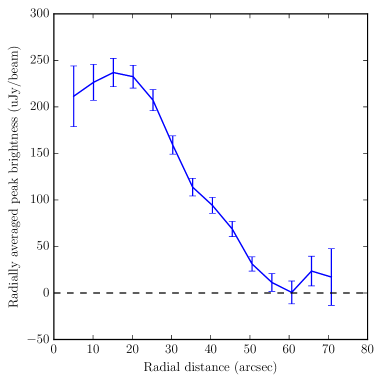
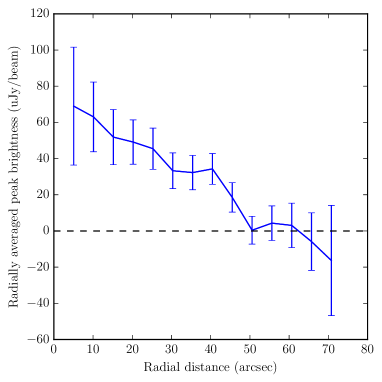
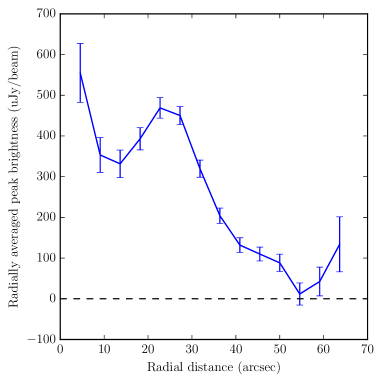
The four ORCs discussed here are similar in displaying a strong circular symmetry. They are also similar in (a) having a diameter about 1 arcmin, (b) having a steep spectral index (c) being at high Galactic latitude. They differ in that (a) two of them have a central galaxy while two do not, and (b) three of them (ORCs 1, 2 & 4) consist of a partly filled ring while one (ORC 3) seems to be a uniform disc. The radial profiles of the ORCs are shown in Figure 8. ORC 1, ORC 2, and ORC 4 are similar in having a filled but edge-brightened disc, while ORC 3 decreases monotonically from the centre.
ORC 1
 ORC 2
ORC 2
 ORC 3
ORC 3
 ORC 4
ORC 4
There is also the puzzling fact that two of them (ORCs 2 and 3) are very close together, implying that these two ORCs have a common origin. No such counterpart is visible for ORCs 1 and 4 above the noise in the image, implying that any such counterpart must be weaker than 10% of the visible ORC. A counterpart similar to ORC 3 would be visible in both cases. We cannot of course exclude a counterpart hidden behind the visible ORC, and note the faint extended emission slightly to the east of ORC4 in Figure 1, which might be interpreted as a second ring behind the first.
If the central galaxy in ORC 4 is associated with the ring, then the ring is at a redshift of 0.39 and has a size of 410 350 kpc.
We estimated proper motion by comparing the positions of ORCs 1 and 2 in the ASKAP (taken in November 2019) and ATCA observations (taken in March 2020). This is difficult because of their diffuse nature and the low SNR of the ATCA observations, but we estimate an upper limit of about 4 arcsec on any spatial shift of the diffuse emission between the two sets of observations, which rules out a solar system object.
5 Discussion
Our argument that these are new types of object naturally provokes two questions: (a) Are they real? and (b) are they new?
We propose that at least ORCs 1 and 2 are certainly real because they have been independently detected by two different telescopes using different software, which produce images of rings with the same diameter.
We propose that they are new because nowhere in the literature can we find an example of an object with the striking circularity of the ORCs, except for starburst rings and the Galactic objects which we argue below are not the cause of the ORCs.
We now consider whether these objects might be explained by known phenomena. For the purposes of this discussion, we assume all four to have a similar cause, although we acknowledge that it is possible that we may have more than one type of object represented in the class of ORCs. \alterFor example, it could be that the single ORCs are produced by a transient event in a galaxy, while the double ORC is produced by a binary phenomenon such as the two jets from an AGN, even though no previously known double-radio-lobed AGN resembles ORC 2 and 3.
5.1 Imaging Artefact
Circular artefacts are well-known in radio images, and are often caused by imperfect deconvolution of a strong source, resulting in some fraction of the telescope point-spread-function appearing in the final image. However, ORCs 1 and 2 are clearly imaged with two different telescopes, at different times, with different processing software, and all ORCs have been detected by more than one telescope. We therefore consider artefacts to be a very improbable explanation.
5.2 Supernova Remnant
The morphology of the ORCs is remarkably similar to some typical supernova remnants (SNRs) (Anderson et al., 2017; Bozzetto et al., 2017; Green, 2019; Joseph et al., 2019; Maggi et al., 2019). We calculate the probability that the ORCs are SNRs as follows.
First we note that the 294 known SNRs444Green D. A., 2019, ‘A Catalogue of Galactic Supernova Remnants (2019 June version)’, available at http://www.mrao.cam.ac.uk/surveys/snrs/(Green, 2019) have a Galactic latitude distribution, shown in Figure 9, which is strongly peaked at , but with outliers extending out to b = –21.5∘ and b = +15∘. The Galactic latitude of the four ORCs discussed here are –39.0∘, –39.5∘, –39.6∘, and +49.4∘, all of which are well outside the range of known SNRs, and so it seems unlikely that these four objects are members of this population.
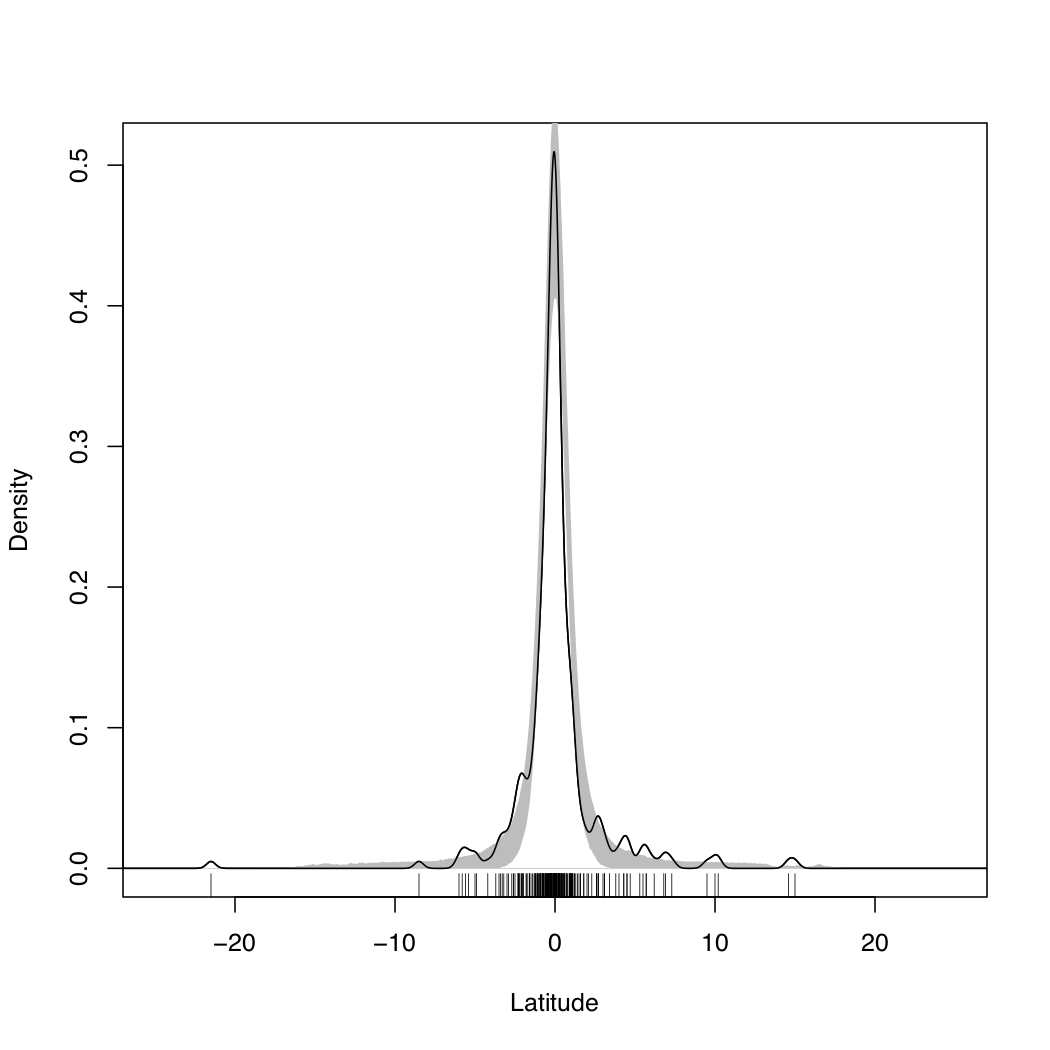
To quantify this, we use a subset of SNRs with measured distances (Vukotić et al., 2019) to construct a model of the SNR distribution in the Galaxy. The distribution of z values (the distance from the mid-plane) of these SNRs is roughly Gaussian with a mean of 3.7 pc and a standard deviation of 127 pc. We then simulate a population with this distribution of z values, and a uniform distribution of x and y coordinates, within the cylinder of the Galaxy bounded by the solar circle which has a radius of 8.2 kpc (Gravity Collaboration et al., 2019). We then measure the Galactic latitude of this population as observed from Earth, and show the resulting distribution overlaid on the real data in Figure 9. From these simulations we can calculate the probability of obtaining SNRs within the solar circle at latitudes -39.0∘, -39.5∘, -39.6∘.
We find that the probability that at least one of these is a member of the parent population of SNRs is 0.055, and that the probability of all three belonging to the parent population of SNRs is . We therefore consider it unlikely that these are SNRs, although we cannot rule out the possibility that we have discovered a new population of high-latitude SNRs.
5.3 Galactic Planetary Nebula
Planetary nebulae (PNe) can also appear as diffuse disks of radio emission (Meixner et al., 1996).
3709 candidate PNe are currently listed in the HASH catalog (Parker et al., 2017), of which 2627 are “true” PNe (i.e. PNstat=T), of which 2226 lie within the solar circle. Unfortunately very few reliable distances are known, precluding the construction of a model as we used for SNRs. Instead we model the angular distribution of the 2226 PNe. At the Galactic latitude of the ORCs (-30∘< b <-50∘), the HASH catalog lists 3 PNe, giving a sky density of one PNe per 919 square degrees, so that the expected number of PNe in the 270 sq. deg EMU-PS is 0.3, giving a probability of 0.3 of finding one in the EMU-PS field, or 0.1 of finding three in the EMU-PS field. Thus PNe seem unlikely as a possible mechanism for ORCs, but cannot be completely excluded on the basis of the latitude distribution alone.
The radio emission of PNe is generated by thermal free-free emission, and is therefore expected to have a positive spectral index (Hajduk et al., 2018), which might vary from –0.1, in the optically thin case to +2 in the optically thick case. Gruenwald & Aleman (2007) and Hajduk et al. (2018) show a good fit between these calculated spectral indices and observations. This is quite different from the steep spectral indices for the ORCs listed in Tables 5 and 6.
A wider range of spectral indices are reported in two surveys (Bojičić et al., 2011; Wang et al., 2018). However, both these surveys suffer from large uncertainties because of poor frequency coverage and mismatched instrumentation.
We therefore consider it unlikely that the ORCs are PNe.
5.4 Ring around Wolf-Rayet star
Wolf-Rayet (WR) stars can eject bubbles of material that appear at both radio and optical wavelengths as a ring of emission (Cichowolski et al., 2001). 667 WR stars are known in our Galaxy555http://pacrowther.staff.shef.ac.uk/WRcat (Rosslowe & Crowther, 2015), although it is estimated that there could be as many as 2000. However, the radio emission associated with WR stars is typically of size a few arcsec or less (Abbott et al., 1986) and they generally have a flatter spectral index than the ORCs (Dougherty & Williams, 2000). \alterThe 667 known WR stars have Galactic latitudes ranging from -10.1∘to +6.5∘ so the probability of finding one at a latitude of -39.5 is very small. We therefore consider WR stars to be an unlikely cause of the ORCs.
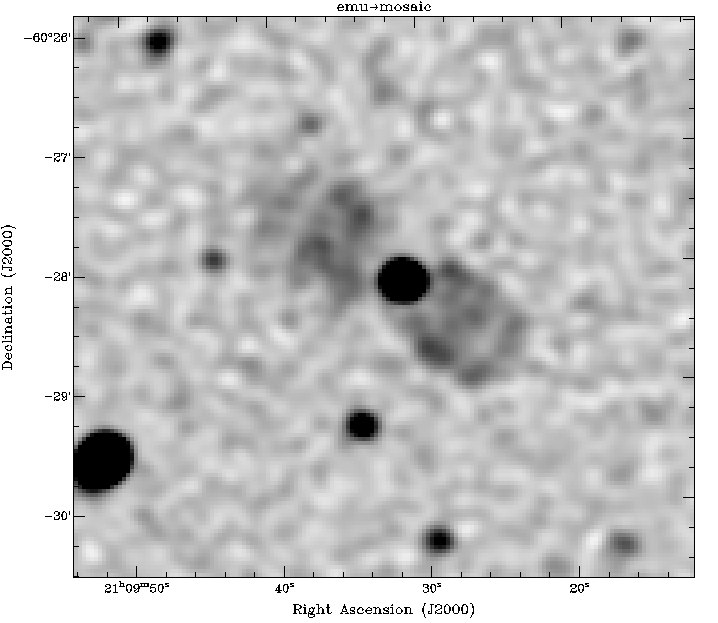
5.5 Face-on star-forming galaxy or ring galaxy
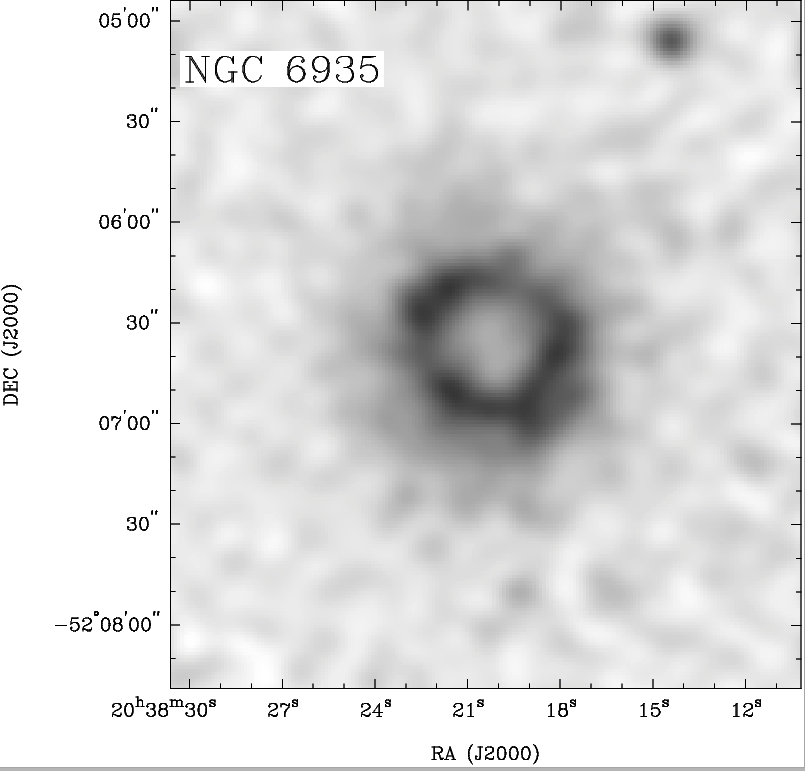
Ring-shaped star-forming galaxies such as the Cartwheel galaxy are well-known (Higdon, 1996), and some nearby, nearly face-on spiral galaxies have star-forming rings, typically detected in the H emission line and in radio continuum (Pogge & Eskridge, 1993; Forbes et al., 1994). An example detected by ASKAP is shown in Figure 10. However, in all known cases these ring galaxies and starburst rings are bright at optical wavelengths, which contrasts with the lack of measurable optical emission from the ORCs on a similar scale to the radio emission. If the ORC emission corresponded to the size of a typical disk galaxy (10–20 kpc) it would lie at a distance of about 25–50 Mpc (). The emission from such a large, nearby face-on disk galaxy would be easily detectable in the DES imaging. We therefore do not consider these to be a likely explanation for ORCs.
5.6 Galactic Wind Termination Shock
The winds from star-forming galaxies create a bubble surrounded by a termination shock. For a Milky Way-like galaxy forming few M⊙/year in an isotropic environment, a roughly spherical galactic wind termination shock at a distance of (few - 10) 10 kpc is predicted (Jokipii & Morfill, 1987; Völk & Zirakashvili, 2004); to reproduce the observed 1 arcmin angular diameter scale of an ORC, a galaxy with a termination shock at 30 kpc would then need to be located at an angular diameter distance of Mpc or .
This shock at velocity will accelerate cosmic ray electrons to an energy limited by inverse Compton cooling of
where we have normalised to a conservatively small characteristic flow speed and a 0.1 G field (Crocker et al., 2015). This implies that the termination shock associated with a star-forming galaxy should be easily capable of accelerating CR electrons to the few 10 GeV energies at which they would produce synchrotron radiation at 1 GHz.
The energetics of this scenario are also reasonable: assuming that non-thermal electrons account for 1% of the mechanical power dissipated at the putative shock, a mJy source located at requires a shock dissipating erg/s which can be easily energised by a host with a star formation rate of a few solar masses per year.
While this is a theoretical possibility, such a shock has not yet been observed elsewhere.
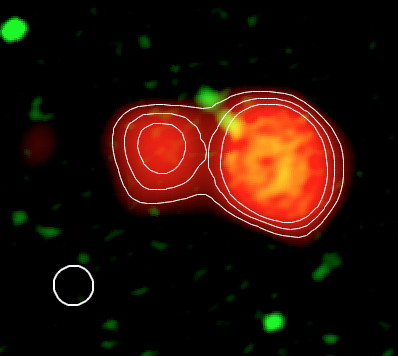
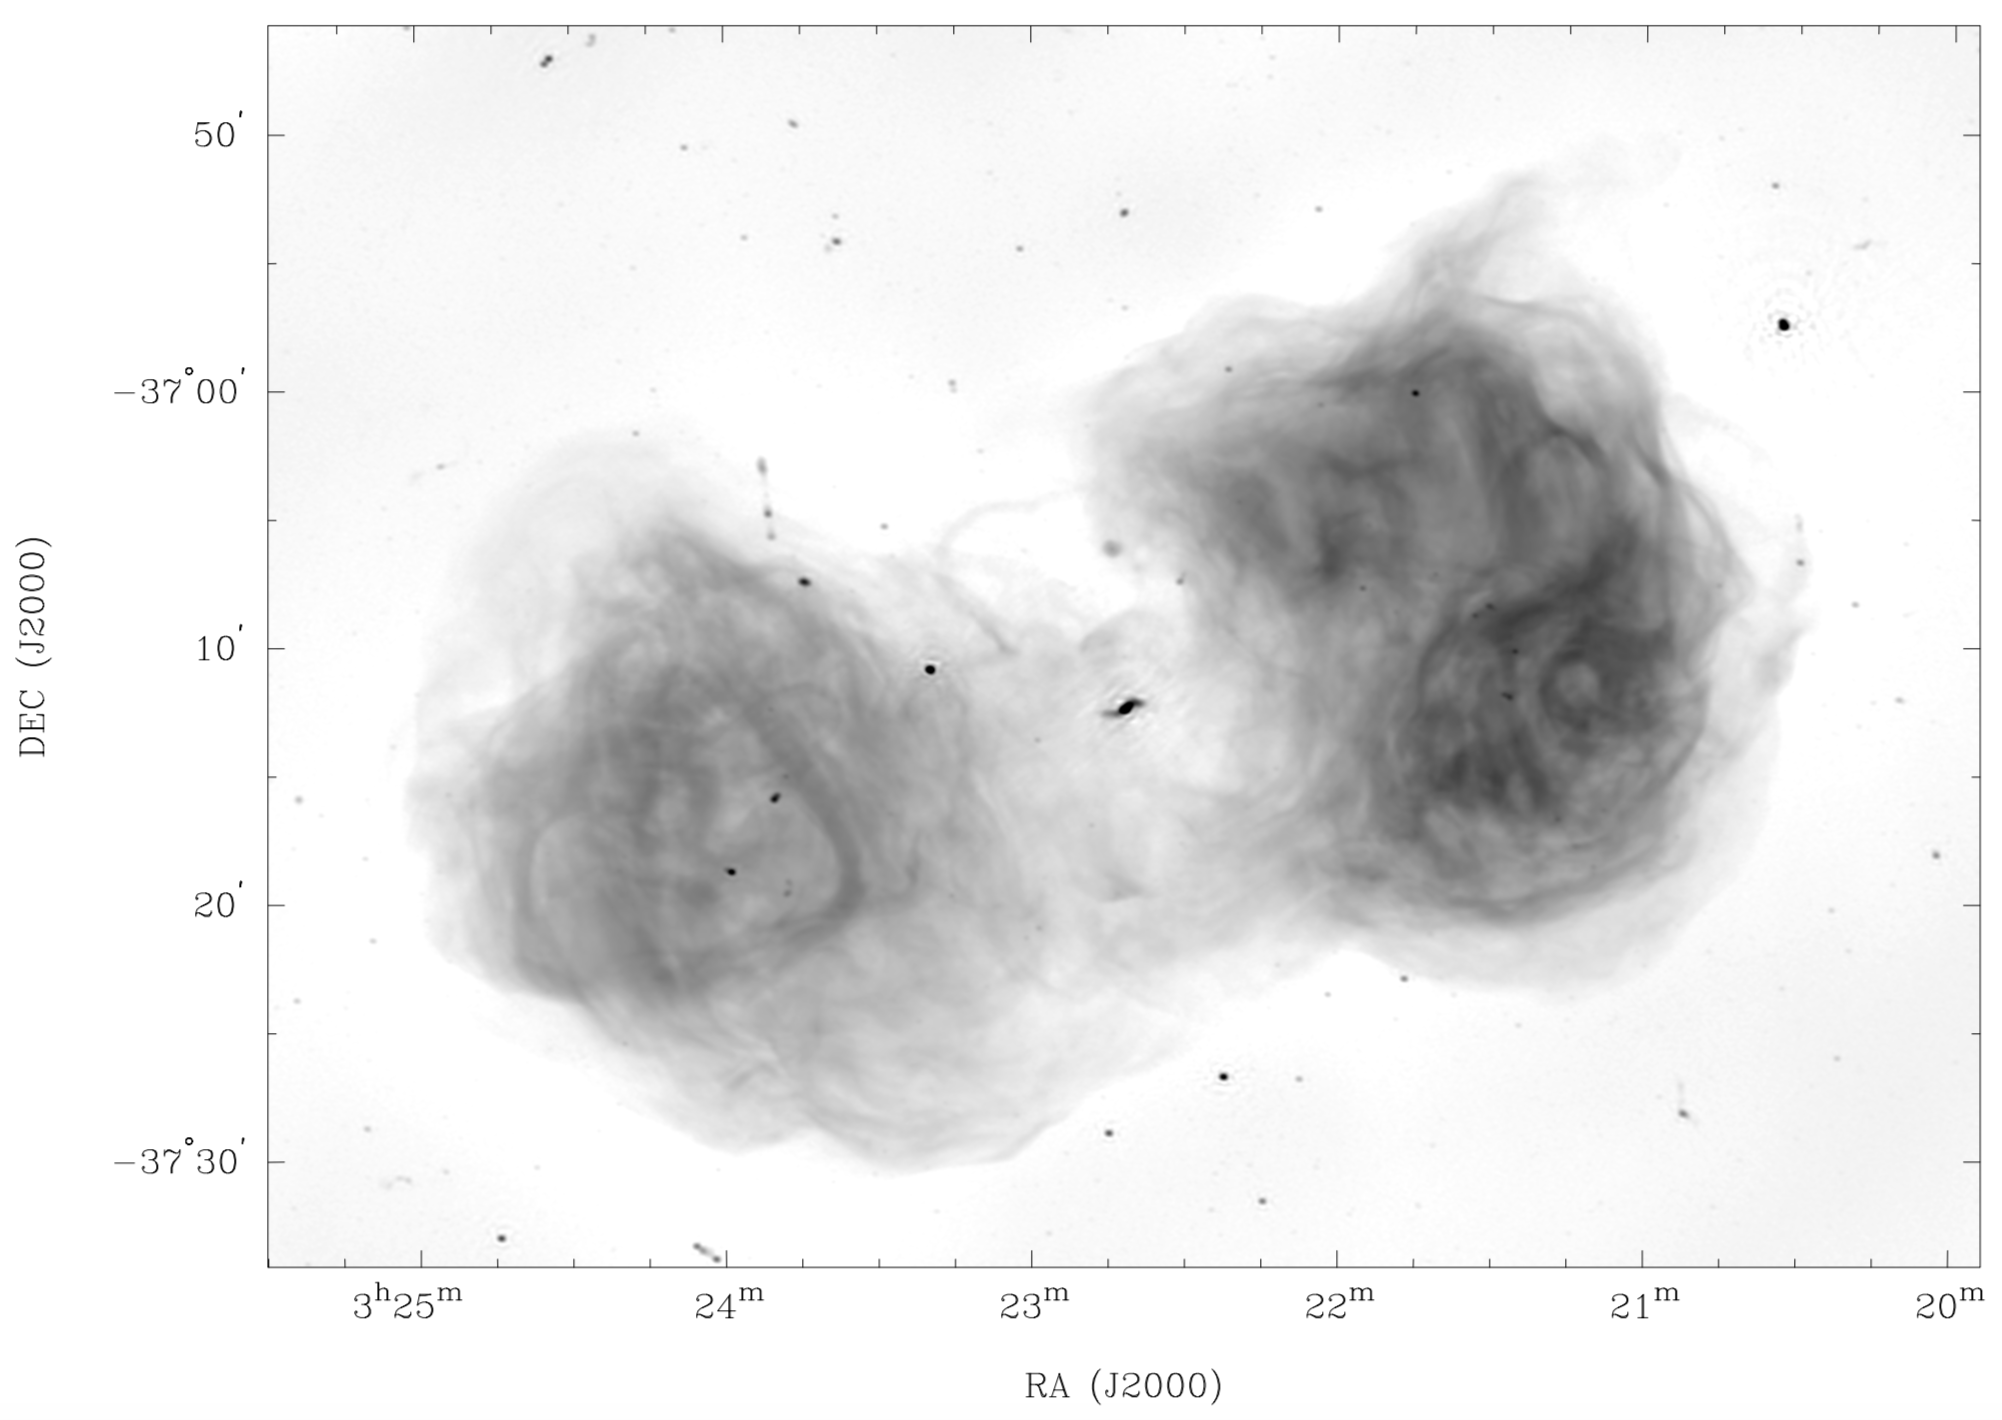
5.7 A bent-tail radio galaxy
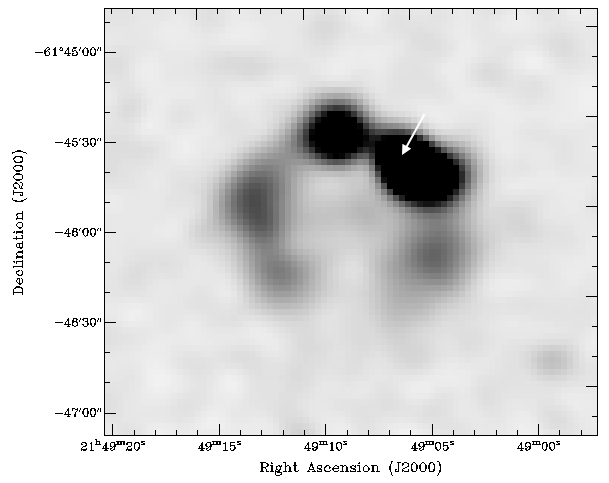
In a bent-tail radio galaxy, the two jets are bent/curved by their relative motion through the intra-cluster medium. In the case of the source shown in Figure 11, the bending is so severe as to form almost a circle, and its formation would require additional forces or jet variations over and above relative motion. In the case of ORC 1, it could be argued that source S is the host galaxy. However, jets from SF galaxies are rare, and bent ones have not yet been seen. Similar to the ORCs, there is faint central emission between the bent tails, approximately 30% as bright as the tails. However, no bent-tail galaxy, including the source shown in Figure 11, shows the striking circular symmetry of the ORCs, and so we do not consider this to be a likely cause of the ORCs.
5.8 Lobe from a double-lobed radio galaxy, viewed side-on
The ORCs might, in principle, be one lobe of a double-lobed radio galaxy. For example, the radio galaxy Fornax A has two near-circular radio lobes, shown in Figure 12. However, we consider this unlikely \alter primarily because the ORCs are strikingly circular, and in most cases edge-brightened, unlike the morphology typically seen in double-lobed radio galaxies.
ORCs 1 and 4 also have no corresponding lobe, although it is possible that a corresponding lobe may be below our sensitivity threshold.
Because ORCs 2 and 3 are close together, it is tempting to consider them as the lobes of a radio galaxy. However, there is no sign of a central optical or radio host source between the two lobes. Source C in the limb of ORC 2 could potentially be a host, but it is an edge-on star-forming galaxy, which rarely host double-lobed radio sources.
A possible host is the double-lobed AGN (sources A and B in Figure 1) close to ORCs 2 and 3. However, although the AGN points roughly at ORC2, it does not point at ORC3, and it is not located between them, but to the north.
5.9 Lobe from a double-lobed radio galaxy, viewed end-on
If a radio-loud AGN is viewed “down the barrel” of the jet, the end-on radio lobe can appear as a \alterroughly circular object, as seen in some BL Lac sources (Ulvestad et al., 1983). If the central radio source were precessing, then the central spot could in principle be a circle, although this has not yet been observed. However, such sources are accompanied by (in the case of a BL Lac source) a bright, blue, unresolved (sub-arcsec) optical counterpart, or (in the case of a radio galaxy) by a quiescent galaxy. \revbIn such sources, the central radio emission is brighter than the fainter halo, and this is not seen in the ORCs.
This model is also inconsistent with the inferred physical sizes. If the ORCs are at redshifts at 0.3, which is consistent with faint optical counterpart galaxies and with the measured redshift of source G in ORC 4, then the transverse sizes would be of order of 400 kpc, which is about an order of magnitude greater than observed in other radio galaxies.
Another possibility is that a population of radio galaxies with edge-brightened lobes, such as the one in Figure 13, could provide the parent population. This source has a total extent of 150" and a width of 40", with an edge on the southern lobes that is 30-50% brighter than the central regions of the lobe. Such extremely faint sources would be detected more easily when viewed end-on, where they would appear ORC-like. However, such sources would still have a bright central AGN, which is not seen in all ORCs, and \alterthis model suffers from the same problem as the previous model: the inferred transverse sizes \alterof the lobes of hundreds of kpc \alteris an order of magnitude greater than is observed in other radio galaxies.
ORC-like structures could also appear from the end-on view of bubbles or tori from buoyantly rising old lobes of radio galaxies in a cluster atmosphere (Churazov et al., 2001; Randall et al., 2010). In a later stage of evolution, these could even be re-energized and become visible through collisions with shocks (Kang, 2018) and be responsible for elliptical ring-like radio “relics” produced during cluster mergers (Bagchi et al., 2006; Paul et al., 2011; Kale et al., 2012), if seen edge on. However, these suffer from the problems that (a) such relics do not have the strong circular symmetry of the ORCs, and (b) \alteras discussed in Section 5.10, no known cluster is associated with the ORCs.
Another possibility is that a radio galaxy can leave behind a blob of plasma, which can then form a vortex ring if it encounters a shock. Although the initial shape of the ring is likely to be irregular, reflecting the irregular intersection cross section, the vortex ring is self-propagating and tends to circularize with time (Nolting et al., 2019a, b). Such a blob/shock encounter was proposed to explain the large ring at the end of NGC 1265 (Pfrommer & Jones, 2011). After the AGN has turned off, the re-energized synchrotron-emitting ring may not show any obvious connection to its parent galaxy. \alterWe consider this to be a possible, although unproven, mechanism to explain the ORCs.
5.10 Cluster halo
Clusters of galaxies often show diffuse radio halos about an arcmin \revbor more in diameter (Feretti et al., 2012; van Weeren et al., 2019). However, their morphology is typically irregular, and punctuated by radio emission from their constituent galaxies, and sometimes with a diffuse relic towards the edge. Radio halo brightness profiles typically peak at the centre and decrease radially without any ring-like structures. They are often observed as patchy, but none, to the best of our knowledge, shows the circularly symmetric edge-brightening seen in the ORCs. Furthermore, cluster halo emission is generally accompanied by a cluster of galaxies, and no cluster of galaxies is seen within the ORCs, nor listed in any of the cluster catalogues covering this area (listed by Manojlović et al., 2020, in preparation).
We therefore consider it unlikely that the ORCs are cluster halos. The possibility that ORCs are related instead to radio “relics” seen at the peripheries of merging clusters is discussed in Section 5.9.
5.11 Einstein Ring
Gravitational lensing of background sources can produce arcs of emission. If the source, lens, and observer are aligned, then the lensed image can take the form of a so-called Einstein ring, \revbtypically detected in the optical (e.g. Belokurov et al., 2007). For example, the radio gravitational (compound) lens PKS 1830–211, consists of a 1 arcsec diameter radio ring (Jauncey et al., 1991). However, such Einstein rings are rarely more than a few arcsec in diameter. Much larger gravitational lenses are known (Zitrin et al., 2009) but the lensed image in such cases is irregular, consisting of a number of sub-images, because neither the lensing source nor the background source is sufficiently smooth and axisymmetric to produce a circle. A ring similar to the ORCs could in principle be produced by a lensing cluster of mass at a redshift of 1, but (a) there is no sign of a visible cluster within the rings, and (b) it is unlikely that such a lens would be sufficiently symmetric, and perfectly aligned with the background source, to produce the observed circular symmetry.
6 Conclusion
In this paper, we report a potentially new class of radio-astronomical object, consisting of a circular disc seen only at radio wavelengths, which in some cases is limb-brightened, and sometimes contains a galaxy at its centre. We know they are real, because they have been detected using three different telescopes using different software.
A careful search of the literature has found no previous report of such circular radio objects, other than the well-known objects, such as supernova remnants and starburst rings, which we have shown above can not explain our observations. We therefore propose that they are a new class of radio source.
Such a discovery is not unexpected when a new telescope such as ASKAP observes the sky in a relatively unexplored part of the observational parameter space (Norris, 2017a, b). In particular, no previous telescope was able to survey large areas of sky with the low-surface-brightness sensitivity, combined with good spatial resolution, of ASKAP.
In this paper, we have shown that none of the known types of radio object seems able to explain the ORCs as a class.
For example, if the ORCs are Galactic SNRs, which they strongly resemble, then this implies a population of SNRs in the Galaxy \alterseveral orders of magnitude larger than the currently accepted figure, or else a new class of SNR which has not previously been reported. \alterIf the ORCs are starburst rings, which they also strongly resemble, then we would be able to see the stellar ring counterpart in optical observations.
We speculate that the edge-brightening in some ORCs suggests that this circular image may represent a spherical object, which in turn suggests a spherical wave from some transient event. Several such classes of transient events, capable of producing a spherical shock wave, have recently been discovered, such as fast radio bursts (Bannister et al., 2019), gamma-ray bursts (Ayal & Piran, 2001), and neutron star mergers (Hotokezaka & Piran, 2015). However, because of the large angular size of the ORCs, any such transients would have taken place in the distant past. It also seems unlikely that such an event could cause two ORCs together, as seen in ORCs 2 and 3.
It is also possible that the ORCs represent a new category of a known phenomenon, such as the jets of a radio galaxy or blazar when seen end-on, down the “barrel” of the jet. Alternatively, they may represent some remnant of a previous outflow from a radio galaxy. However, no existing observations of this phenomenon closely resemble the ORCs in features such as their \alterstriking circularity, the edge-brightening in most cases, or the absence of a visual blazar or radio galaxy at the centre.
We also acknowledge the possibility that the ORCs may represent more than one phenomenon, and that they have been discovered simultaneously because they match the spatial frequency characteristics of the ASKAP observations, which occupy a part of the observational parameter space which has hitherto been poorly studied. For example, if ORCs 2 and 3 are explained in terms of an unusual radio galaxy, then a spherical wave from a transient event may explain ORCs 1 and 4.
Finally, we note that Kirillov & Savelova (2020) have proposed that an ORC may represent the throat of a wormhole.
Further work is continuing to investigate the nature of these objects.
Acknowledgements.
We thank Heinz Andernach, Paul Nulsen, Tom Jones, Chris Nolting and many EMU members for valuable comments on a draft of this paper, and Stefan Duchesne for helping with the MWA data. \revbWe thank Robert Becker and an anonymous PASA referee for helpful comments. Partial support for LR comes from U.S. National Science Foundation grant AST17-14205 to the University of Minnesota. The Australian SKA Pathfinder is part of the Australia Telescope National Facility which is managed by CSIRO. Operation of ASKAP is funded by the Australian Government with support from the National Collaborative Research Infrastructure Strategy. ASKAP uses the resources of the Pawsey Supercomputing Centre. Establishment of ASKAP, the Murchison Radio-astronomy Observatory and the Pawsey Supercomputing Centre are initiatives of the Australian Government, with support from the Government of Western Australia and the Science and Industry Endowment Fund. We acknowledge the Wajarri Yamatji people as the traditional owners of the Observatory site.7 Data availability.
All EMU-PS data (tables and images, and uv data) are available from CASDA on http://hdl.handle.net/102.100.100/164555?index=1 or from https://data.csiro.au/dap/public/casda/casdaSearch.zul under project code AS101. A zoomable image of the EMU-PS survey is available on http://emu-survey.org. A listing of observations is on https://apps.atnf.csiro.au/OMP/index.jsp.
References
- Abbott et al. (1986) Abbott D. C., Beiging J. H., Churchwell E., Torres A. V., 1986, ApJ, 303, 239
- Abbott et al. (2018) Abbott T. M. C., et al., 2018, ApJS, 239, 18
- Aguado et al. (2019) Aguado D. S., et al., 2019, ApJS, 240, 23
- Ananthakrishnan & Pramesh Rao (2001) Ananthakrishnan S., Pramesh Rao A., 2001, in 2001 Asia-Pacific Radio Science Conference AP-RASC ’01. p. 237
- Anderson et al. (2017) Anderson L. D., et al., 2017, A&A, 605, A58
- Ayal & Piran (2001) Ayal S., Piran T., 2001, ApJ, 555, 23
- Bagchi et al. (2006) Bagchi J., Durret F., Neto G. B. L., Paul S., 2006, Science, 314, 791
- Bannister et al. (2019) Bannister K. W., et al., 2019, Science, 365, 565
- Belokurov et al. (2007) Belokurov V., et al., 2007, ApJ, 671, L9
- Bilicki et al. (2016) Bilicki M., et al., 2016, Ap J Suppl., 225, 5
- Bojičić et al. (2011) Bojičić I. S., Parker Q. A., Filipović M. D., Frew D. J., 2011, MNRAS, 412, 223
- Bozzetto et al. (2017) Bozzetto L. M., et al., 2017, ApJS, 230, 2
- Churazov et al. (2001) Churazov E., Brüggen M., Kaiser C. R., Böhringer H., Forman W., 2001, ApJ, 554, 261
- Cichowolski et al. (2001) Cichowolski S., Pineault S., Arnal E. M., Testori J. C., Goss W. M., Cappa C. E., 2001, AJ, 122, 1938
- Condon et al. (1998a) Condon J. J., Cotton W. D., Greisen E. W., Yin Q. F., Perley R. A., Taylor G. B., Broderick J. J., 1998a, AJ, 115, 1693
- Condon et al. (1998b) Condon J. J., Cotton W. D., Greisen E. W., Yin Q. F., Perley R. A., Taylor G. B., Broderick J. J., 1998b, AJ, 115, 1693
- Crocker et al. (2015) Crocker R. M., Bicknell G. V., Taylor A. M., Carretti E., 2015, ApJ, 808, 107
- Dougherty & Williams (2000) Dougherty S. M., Williams P. M., 2000, MNRAS, 319, 1005
- Drlica-Wagner et al. (2018) Drlica-Wagner A., et al., 2018, ApJS, 235, 33
- Duchesne et al. (2020) Duchesne S. W., Johnston-Hollitt M., Zhu Z., Wayth R. B., Line J. L. B., 2020, arXiv e-prints, p. arXiv:2007.15199
- Feretti et al. (2012) Feretti L., Giovannini G., Govoni F., Murgia M., 2012, A&A Rev., 20, 54
- Forbes et al. (1994) Forbes D. A., Norris R. P., Williger G. M., Smith R. C., 1994, AJ, 107, 984
- Gaia Collaboration et al. (2018) Gaia Collaboration et al., 2018, A&A, 616, A1
- Gravity Collaboration et al. (2019) Gravity Collaboration et al., 2019, A&A, 625, L10
- Green (2019) Green D. A., 2019, Journal of Astrophysics and Astronomy, 40, 36
- Gruenwald & Aleman (2007) Gruenwald R., Aleman A., 2007, A&A, 461, 1019
- Hajduk et al. (2018) Hajduk M., van Hoof P. A. M., Śniadkowska K., Krankowski A., Błaszkiewicz L., Dąbrowski B., Zijlstra A. A., 2018, MNRAS, 479, 5657
- Higdon (1996) Higdon J. L., 1996, ApJ, 467, 241
- Hotokezaka & Piran (2015) Hotokezaka K., Piran T., 2015, MNRAS, 450, 1430
- Hurley-Walker et al. (2019) Hurley-Walker N., et al., 2019, PASA, 36, e048
- Intema et al. (2017) Intema H. T., Jagannathan P., Mooley K. P., Frail D. A., 2017, A&A, 598, A78
- Jauncey et al. (1991) Jauncey D. L., et al., 1991, Nature, 352, 132
- Johnston et al. (2007) Johnston S., et al., 2007, PASA, 24, 174
- Johnston et al. (2008) Johnston S., et al., 2008, Experimental Astronomy, 22, 151
- Jokipii & Morfill (1987) Jokipii J. R., Morfill G., 1987, ApJ, 312, 170
- Joseph et al. (2019) Joseph T. D., et al., 2019, MNRAS, 490, 1202
- Kale et al. (2012) Kale R., Dwarakanath K. S., Bagchi J., Paul S., 2012, MNRAS, 426, 1204
- Kang (2018) Kang H., 2018, Journal of Korean Astronomical Society, 51, 185
- Kirillov & Savelova (2020) Kirillov A. A., Savelova E. P., 2020, European Physical Journal C, 80, 810
- Maggi et al. (2019) Maggi P., et al., 2019, A&A, 631, A127
- Masters et al. (2011) Masters K. L., et al., 2011, MNRAS, 418, 1055
- McConnell et al. (2016) McConnell D., et al., 2016, PASA, 33, e042
- Meixner et al. (1996) Meixner M., Skinner C. J., Keto E., Zijlstra A., Hoare M. G., Arens J. F., Jernigan J. G., 1996, A&A, 313, 234
- Morrissey et al. (2007) Morrissey P., et al., 2007, ApJS, 173, 682
- Murgia et al. (2002) Murgia M., Fanti C., Fanti R., Gregorini L., Klein U., Mack K. H., Vigotti M., 2002, New A Rev., 46, 307
- Nolting et al. (2019a) Nolting C., Jones T. W., O’Neill B. J., Mendygral P. J., 2019a, ApJ, 876, 154
- Nolting et al. (2019b) Nolting C., Jones T. W., O’Neill B. J., Mendygral P. J., 2019b, ApJ, 885, 80
- Norris (2017a) Norris R. P., 2017a, Nature Astronomy, 1, 671
- Norris (2017b) Norris R. P., 2017b, PASA, 34, e007
- Norris et al. (2011) Norris R. P., et al., 2011, PASA, 28, 215
- Norris et al. (2020) Norris R. P., Marvil J., et al. 2020, PASA, p. in preparation
- Offringa et al. (2015) Offringa A. R., et al., 2015, PASA, 32, e008
- Offringa et al. (2016) Offringa A. R., et al., 2016, MNRAS, 458, 1057
- Parker et al. (2017) Parker Q. A., Bojičić I., Frew D. J., 2017, in Liu X., Stanghellini L., Karakas A., eds, IAU Symposium Vol. 323, Planetary Nebulae: Multi-Wavelength Probes of Stellar and Galactic Evolution. pp 36–39 (arXiv:1612.00167), doi:10.1017/S1743921317000904
- Paul et al. (2011) Paul S., Iapichino L., Miniati F., Bagchi J., Mannheim K., 2011, ApJ, 726, 17
- Pfrommer & Jones (2011) Pfrommer C., Jones T. W., 2011, ApJ, 730, 22
- Planck Collaboration et al. (2018) Planck Collaboration et al., 2018, arXiv e-prints, p. arXiv:1807.06209
- Pogge & Eskridge (1993) Pogge R. W., Eskridge P. B., 1993, AJ, 106, 1405
- Randall et al. (2010) Randall S. W., Clarke T. E., Nulsen P. E. J., Owers M. S., Sarazin C. L., Forman W. R., Murray S. S., 2010, ApJ, 722, 825
- Rosslowe & Crowther (2015) Rosslowe C. K., Crowther P. A., 2015, Monthly Notices of the Royal Astronomical Society, 447, 2322
- Rudnick (2002) Rudnick L., 2002, PASP, 114, 427
- Schawinski et al. (2014) Schawinski K., et al., 2014, MNRAS, 440, 889
- Tingay et al. (2013) Tingay S. J., et al., 2013, PASA, 30, e007
- Ulvestad et al. (1983) Ulvestad J. S., Johnston K. J., Weiler K. W., 1983, ApJ, 266, 18
- Venturi et al. (2017) Venturi T., et al., 2017, A&A, 603, A125
- Völk & Zirakashvili (2004) Völk H. J., Zirakashvili V. N., 2004, A&A, 417, 807
- Vukotić et al. (2019) Vukotić B., Ćiprijanović A., Vučetić M. M., Onić D., Urošević D., 2019, Serbian Astronomical Journal, 199, 23
- Wang et al. (2018) Wang Y., et al., 2018, A&A, 619, A124
- Wayth et al. (2018) Wayth R. B., et al., 2018, PASA, 35
- Whiting et al. (2017) Whiting M., Voronkov M., Mitchell D., Askap Team 2017, in Lorente N. P. F., Shortridge K., Wayth R., eds, Astronomical Society of the Pacific Conference Series, Vol. 512, Astronomical Data Analysis Software and Systems XXV, Volume 512, Held October 25-29 2015, Proceedings of a conference held at Rydges World Square, Sydney, NSW, Australia Edited by Nuria P. F. Lorente, Keith Shortridge, and Randall Wayth. San Francisco: Astronomical Society of the Pacific, 2017, p.431. Astronomical Society of the Pacific, p. 431
- Wilson et al. (2011) Wilson W. E., et al., 2011, MNRAS, 416, 832
- Wright et al. (2010) Wright E. L., et al., 2010, AJ, 140, 1868
- Zitrin et al. (2009) Zitrin A., Broadhurst T., Rephaeli Y., Sadeh S., 2009, ApJ, 707, L102
- Zou et al. (2019) Zou H., Gao J., Zhou X., Kong X., 2019, ApJS, 242, 8
- van Weeren et al. (2019) van Weeren R. J., de Gasperin F., Akamatsu H., Brüggen M., Feretti L., Kang H., Stroe A., Zandanel F., 2019, Space Sci. Rev., 215, 16