Structure and vibrational properties of sodium silicate glass surfaces
Abstract
Using molecular dynamics simulations we investigate the dependence of the structural and vibrational properties of the surfaces of sodo-silicate glasses on the sodium content as well as the nature of the surface. Two types of glass surfaces are considered: A melt-formed surface (MS) in which a liquid with a free surface has been cooled down into the glass phase and a fracture surface (FS) obtained by tensile loading of a glass sample. We find that the MS is more abundant in Na and non-bridging oxygen atoms than the FS and the bulk glass, whereas the FS has higher concentration of structural defects such as two-membered rings and under-coordinated Si than the MS. We associate these structural differences to the production histories of the glasses and the mobility of the Na ions. It is also found that for Na-poor systems the fluctuations in composition and local atomic charge density decay with a power-law as a function of distance from the surface while Na-rich systems show an exponential decay with a typical decay length of Å. The vibrational density of states shows that the presence of the surfaces leads to a decrease of the characteristic frequencies in the system. The two-membered rings give rise to a pronounce band at cm-1 which is in good agreement experimental observations.
I Introduction
Silicate glasses are not only ubiquitous in many technical applications and in our daily life but also in the focus of many scientific studies. [1, 2, 3] For many practical applications of glasses, such as displays of electronic devices and biomedical containers, the properties of the glass surface are highly important since the coating and structuring of the surface allows to devise novel functional materials.[4, 5, 6, 7, 8, 9] A further motivation to study the surfaces of glasses is that such investigation allow to obtain a better understanding of the failure mechanisms of bulk glasses, since very often fracture starts at the surface defects of the sample. [10, 11] Analyzing the post-mortem fracture surface of broken glass allows thus to gain insight on the origin of the failure and the way the fracture front propagates, knowledge that are valuable for a deeper understanding of fracture of amorphous materials. [12, 13, 14, 15, 16, 17, 18, 19, 20, 21]
One of the primary goals of surface characterization is to determine the composition and microstructure of the sample. In experiments this can be done, e.g., by spectroscopic techniques such as low-energy ion scattering (LEIS) spectroscopy, X-ray photoelectron spectroscopy (XPS), or atomic force microscopy (AFM). [22, 23, 24, 25, 26, 27, 28, 29] Ion scattering spectroscopy study have revealed that the fracture surface of silica glass shows an abundance of oxygen atoms, and that the fracture surface of potassium trisilicate glass has a potassium concentration that is higher than the one of the bulk composition, [22] a result which was attributed to the charge shielding on the surface. More recent studies using LEIS investigated the melt-formed and fracture surfaces of binary silicate glasses. [23, 24] It was shown that, when compared with the bulk composition, the melt-formed surfaces are usually depleted of the modifier atoms (i.e., Na) which was hypothesized to be a consequence of surface evaporation while the sample was still in the liquid state. In contrast to this, the fracture surfaces were found to be enriched in alkali species, while depleted of divalent barium (which was attributed the immobility of the Ba2+ cations). The authors of that study also investigated the depth profiles of elemental concentration and were able to detect the presence of concentration gradient normal to the glass surfaces. [24] Also spectroscopic studies are useful to determine structural features of the glass surface. For example infrared and Raman measurements allowed to identify an interesting structural motif on the surfaces of silicate glasses, namely two-membered (2M) rings, [30, 31, 32, 33, 34, 35] i.e., closed loops of two oxygen and two silicon atoms. Such metastable rings, which are absent in the bulk, are of particular interest since they form reactive sites on the surface. [31, 32, 34, 33, 35, 36] Also the AFM has proven to be a valuable tool for direct imaging the structural features on glass surfaces with atomic resolution, allowing to access structural information such as interatomic distances and grouping of atoms. [26, 27, 28, 29]
To summarize, these experimental studies have given clear evidence that the composition and structure of glass surfaces are different from the ones of the bulk. In addition, the surface composition and structure were also found to depend strongly on the processing history. However, it should be noted that these spectroscopic data are essentially semi-quantitative and the results depend also on the environment under which the measurements were performed. As a consequence we are at present still lacking a good understanding about the composition and structure of the glass surfaces and how these properties depend on the system considered. [37, 38]
In addition to experimental studies, computer simulations have been used to probe the microscopic properties of glass surfaces, particularly for the case of silica. [39, 40, 41, 42, 43, 36] To characterize the simulated surface one often defines a surface layer, the thickness of which is usually determined from properties such as the density profile in the orthogonal direction with respect to the surface, see for example in Ref. 41. These simulation studies have revealed the presence of structural units such as nonbridging oxygen, 2M rings and undercoordinated Si on the glass surfaces, in qualitative agreement with the experimental findings. However, the vibrational spectrum and other properties which require a reliable interaction potential are rarely reported, [41, 44] despite their relevance for experiments. Also, at present it remains poorly understood how the change in glass composition, e.g., different concentration of alkali oxides, affects the surface structure and other related properties. [37, 38]
The objective of the present work is to investigate how the properties (structure, composition, vibrational spectra,…) of the glass surface depend on the production history and the composition. To this end, we perform large scale atomistic simulations to produce sodium silicate glasses with varied content of Na2O and compare the characteristics of the melt-formed surface (MS) with the ones of the fracture surface (FS) of the glasses.
II Methodology
II.1 Simulation details
We have carried out molecular dynamics simulations to probe the surface properties of SiO2 and Na2O-SiO2 (NS) glasses. We choose the compositions with and 20, and together with SiO2 these compositions correspond to a Na2O concentration that varies from 0 to 25 mole percent. To start the simulations, we randomly placed around atoms in the simulation box which has a fixed volume corresponding to the experimental value of glass density at room temperature. [45, 46] [The glass density increases from 2.20 g/cm3 for silica to 2.43 g/cm3 for NS3 (25% Na2O).] The dimensions of the boxes were roughly nm30 nm50 nm. Such large samples (surface areas are 600 nm2 and 1000 nm2 for the melt and fracture surfaces, respectively) are necessary to obtain results with high accuracy, in particular for the case of the fracture surfaces. These samples, with periodic boundary conditions applied, were first melted and equilibrated at 6000 K for 80 ps in the canonical ensemble () and then cooled and equilibrated at a lower temperature (still in liquid state) for another 160 ps, see Fig. 1(d). The temperature ranges from 3000 K for SiO2 to 2000 K for NS3 (25 mole% Na2O) and its dependence reflects the fact that the viscosity of NS depends strongly on . Subsequently we cut the sample orthogonal to the axis, and added an empty space, thus creating two free surfaces, i.e. the sample had the geometry of a sandwich, see Fig. 1(a). Periodic boundary conditions were maintained in all three directions. In order to ensure that the two free surfaces do not interact with each other, the thickness of the vacuum layer varied from 6 nm for silica to 14 nm for NS3. The samples with free surfaces were then equilibrated at for 1.6 ns, a time span that is sufficiently long to allow the reconstruction of the surfaces and the equilibration of the interior of the samples. (The averaged displacement of Si in silica and NS3 is larger than 40 Å and 6.2 Å, respectively.) Following this equilibration the liquid samples were cooled via a two-stage quenching: A cooling rate of K/ps was used to quench the sample from to a temperature and a faster cooling rate K/ps to cool it from to 300 K, see Fig. 1(b). Finally, the samples were annealed at 300 K for 800 ps. The temperature at which the cooling rate changes was chosen to be at least 200 K below the simulation glass transition temperature , see Fig. 1(d). At , we also switched the simulation ensemble from to (at zero pressure).
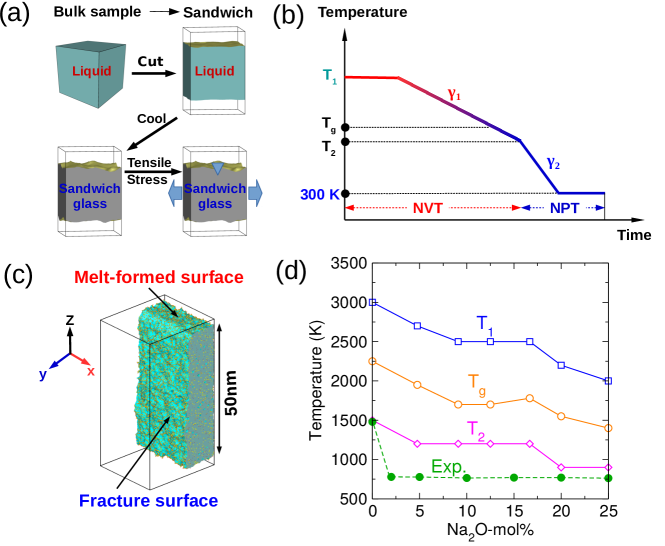
The described simulation protocol has the advantages that: 1) The fast cooling below saves computer time while retaining statistically the same structure as slow cooling; 2) The simulation in the high range helps to retain a regular shape of the sample. Below the sample has more or less a regular shape and switching to the ensemble allows to release internal stresses and facilitate local structural rearrangements. In the following we will refer to the two surfaces of the sandwich glass samples as the melt-formed surfaces (MS).
The sandwich glass samples were subsequently notched on one surface and then subjected to an uniaxial strain in the direction until complete fracture occurred, creating thus two fracture surfaces (FS), see Fig. 1(c). The cross section of the introduced triangular notch had a width and height of 3 nm and 2 nm, respectively (more details in Ref. 49) and the strain rate was chosen to be 0.5 ns-1, a value that is small enough to obtain results that do not depend in significant manner on the rate. [49, 50] The fracture simulations were done is the ensemble at zero pressure, i.e., the pressures in the directions orthogonal to the loading direction are set to zero, allowing the sample to relax in the and direction. (The constant pressure ensemble is more close to real experiments than the constant volume ensemble since the latter induces artifact brittle fracture behavior of the sample under tension. [50, 51]) We note that the current simulation setup mimics the plane stress condition, i.e., a thin slab in the plane with the stress component , for .
For the simulations we used a pairwise effective potential named SHIK which has been demonstrated to give a reliable description of the structural and mechanical properties of sodium silicate glasses. [52, 50] Its functional form is given by
| (1) |
where is the distance between two atoms of species and . This potential uses partial charges for different atomic species: The charges for Si and Na are, respectively, fixed at 1.7755 and 0.5497, while the charge of O depends on composition and is given by ensuring charge neutrality of the sample, i.e.,
| (2) |
where is the molar concentration of Na2O, i.e., . The other parameters of the potential, , and , occurring in Eq. (1) are given in Ref. 50. It is also worth to mention that these parameters of the SHIK potential were optimized by using bulk properties obtained from experiments and ab initio calculations. [52] To the best of our knowledge it is the first time that this potential is used to study dry surfaces of glasses.
Temperature and pressure were controlled using a Nosé-Hoover thermostat and barostat. [53, 54, 55] All simulations were carried out using the Large-scale Atomic/Molecular Massively Parallel Simulator software [56] with a time step of 1.6 fs. The results presented in the following sections correspond to one melt-quench sample for each composition. However, we emphasize that the system sizes considered in this study are sufficiently large to make sample-to-sample fluctuations negligible. For the MS, the results for the two surfaces on the top and bottom sides of the glass sample were averaged. For the FS, four surfaces, resulting from two independent fracture (by changing the location of the notch), were averaged. For each sample the number of surface atoms was typically around 11000 for the MS and 18000 for the FS.
II.2 Construction of the geometric surface
In atomistic simulations, constructing the surface of a solid corresponds to define the geometric boundary of a set of points in space (the atoms) which allows to divide volume into solid and empty regions. Figure 2 shows schematically the procedure for constructing the geometric surfaces. To start we have used the alpha-shape method proposed by Edelsbrunner and Mücke [57] to construct a surface mesh. For the two-dimensional case, this method relies on the Delaunay triangulation (DT) of the input point set, see Fig. 2(a). For a given set of discrete points, the triangulation DT() is done in such a way that no point in is inside the circumcircle of any triangle in DT(). For the three-dimensional case, the circumcircle extends naturally to a circumscribed sphere which touches each of the tetrahedron’s vertices (Delaunay tetrahedrization). All tessellation elements are then tested by comparing their circumspheres to a reference probe sphere, which has a radius of . The elements (with circumsphere radius ) which satisfy are classified as solid, and the union of all solid Delaunay elements defines the geometric shape of the atomistic solid. The mesh points which define this geometric surface are the atoms on the outermost surface layer, Fig. 2(c).
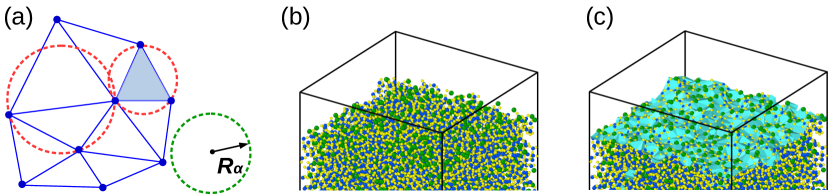
It is important to mention that the probe sphere radius is the length scale which determines how many details and small features of the solid’s geometric shape are resolved. Usually, the value of should be chosen to represent the average spacing between the basic structural units in a material. [58] For the investigated silicate glasses, we have chosen Å which corresponds approximately to the nearest neighbor distance between two [SiO4] tetrahedra. By visual inspection of the constructed surface, we find that the chosen allows to resolve fine surface features while avoiding artificial holes in the constructed surfaces. We note, however, that a small change of (e.g. Å) will not alter significantly the results presented in the following (more detailed tests can be found in Ref. 49). Visualization of the atomic models and the surface mesh were realized by using the OVITO software. [59] Finally we mention that the procedure for constructing the FS is the same as the one for the MS. However, for the FS we have eliminated the atoms that were closer than nm to the top/bottom MS in order to avoid the influence of these surfaces onto the properties of the FS.
III Results and discussion
III.1 Composition of the vapor during the melt-quench process
Before we discuss the properties of the glass surfaces it is instructive to look at the simulation samples at high temperatures, notably at the vapor phase, since this allows to understand better how the melt surfaces are formed.
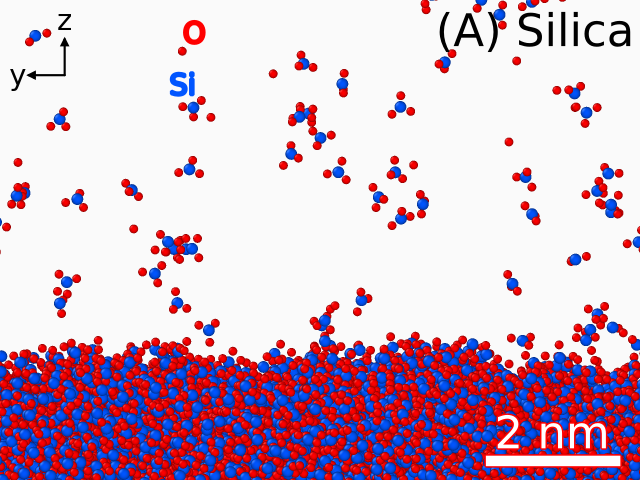
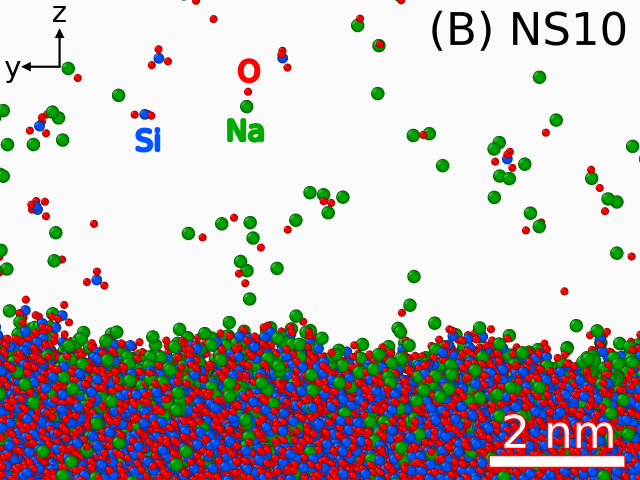
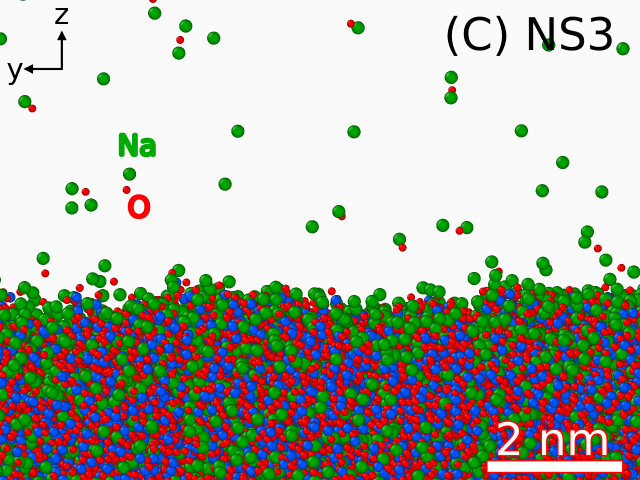
Figure 3 shows snapshots of a part of the samples close to one of the surfaces at the temperature , i.e. when the samples are still in the liquid state, see Fig. 1(d). For silica, panel (a), one recognizes that most Si atoms in the vapor are surrounded by three O atom and therefore one can expect that in the vapor the ratio between the fractions of O and Si is around 3. With the addition of Na, NS10 panel (b), the concentration of Si atoms in the vapor phase decreases quickly since they are replaced to a large extent by the Na atoms which are more volatile and still allow for (partial) charge compensation. The trend of Si being replaced by Na continues if the Na content is increased further, NS3 panel (c). One sees that for NS3 there are basically no Si atoms in the vapor phase. This result agrees with the experimental finding that O and alkali (Na and K) atoms will evaporate from the surfaces of alkali trisilicate glass at elevated temperatures, while Si atoms remain at the surface and in the bulk. [60] It is worth to mention that since the temperature considered for the three snapshots are not the same, the reduction of Si content in the vapor may partially be attributed to the decreased temperature for the samples containing Na (see below).
In order to get a more quantitative understanding of these observations we show in Fig. 4 the number density of atoms, , (upper panels) and the fractions of various atomic species (lower panels) in the vapor phase as a function of time during the equilibation (first 2 ns) and during the quench of the system. For silica, panel (a), one sees that increases while the system is at 3000 K, indicating that more and more atoms in the near-surface region evaporate to the vacuum, demonstrating that the sample is above the boiling point. Once the temperature is lowered, quickly decreases and for below 1400 K only very few atoms remain in the gas phase. Interestingly one finds that the relative concentrations of O and Si in the vapor are independent of temperature and that the ratio between O and Si is close to 3, panel (b). This result indicates that, at these temperatures, each Si atom moving in and out from the surface is likely to be associated with three O atoms, instead of four as one would expect for a [SiO4] tetrahedral unit, in agreement with the snapshot in Fig. 3(a).
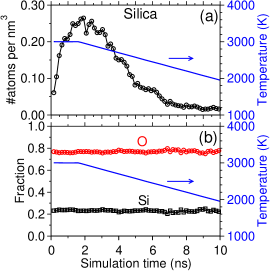
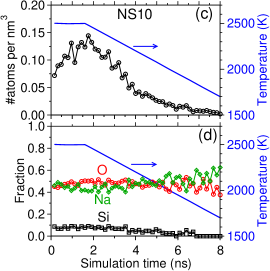
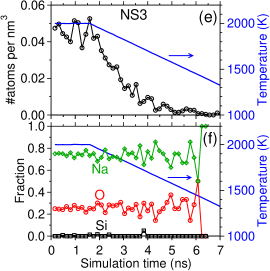
With increasing Na2O content, panels (c) and (e), the density of atoms in the vapor decreases considerably relative to the silica one. This result is on one hand due to the reduced temperature of equilibration (Fig. 1d) and on the other hand because of the increased volume of the vacuum layer. Regarding the composition of the vapor one finds that for NS10, panel (d), the fraction of Si is around 10% during the equilibration, and then decreases with lowering , while the Na fraction is around 50% and this number increases slightly as the temperature decreases. For NS3, panel (f), the enrichment of Na in the vapor is even more pronounced than in NS10, reaching a concentration of around 75% (compared to the nominal fraction of Na for NS3), while the concentration of Si in the vapor becomes negligible, a result that is consistent with the observation from the snapshot in Fig. 3(c). Interestingly, one finds that the relative concentration between Na and O is around 3, independent of temperature.
Finally we note that if one multiplies the concentration of the various atoms with their respective charges, one finds that the total charge of the vapor phase is negative for silica and NS10, panels (b) and (d), while it is positive for NS3, panel (f). Consequently, the condensed phases are also not charge neutral. This charge non-neutrality of the two phases have consequences in the surface properties as we will see later.
III.2 Monolayer surface composition and structure
Having understood the composition of the vapor phase at elevated temperatures, we now focus on the surface properties at 300 K. To start we characterize the local structure of the surfaces by the distributions of interatomic distances and bond angles and compare these distributions with the ones of the bulk glass. This bulk data is obtained by considering only the atoms in a cube with side length of 120 Å in the geometric center of the sandwich glass, i.e. these atoms have a distance of at least 190 Å from any free surface and thus can be expected to reflect the bulk behavior of the glass sample.
Figure 5 shows the distributions of nearest neighbor for various pairs. For clarity, we show only the results for three representative compositions, namely silica, NS10 (Na-poor) and NS3 (Na-rich). For Si-O, panels (a-c), one recognizes that the distributions for the surfaces and the bulk are very similar to each other, indicating that the presence of the surface does not modify significantly the bonding distance. Nevertheless one sees that the distribution for the bulk is narrower than the one of the free surfaces and that the FS has a distribution that is somewhat broader than the one of the MS. The latter result is reasonable since the FS has more structural defects (see below). For the Si-Si distances, panels (d-f), we find for the surfaces a pronounced peak at Å , a feature that is completely absent in the distribution for the bulk sample. (Note that the MS curves for NS10 and NS3 are not shown since they are too noisy as only a small number of Si atoms is found on the surface.) This peak arises from the two-membered (2M) rings in which two edge-sharing Si atoms (esSi) are connected by two edge-sharing bridging O atoms (esBO), as already documented in previous studies. [30, 31, 32, 33, 34, 35, 44, 41, 42, 61, 62]
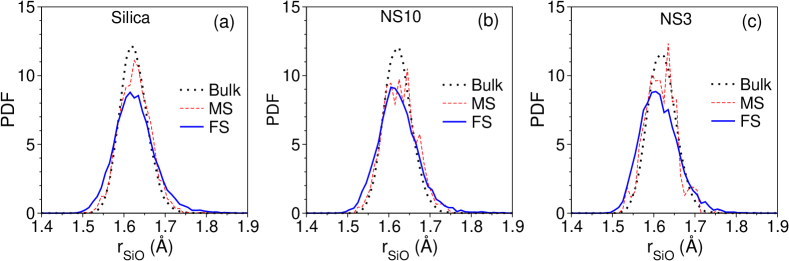
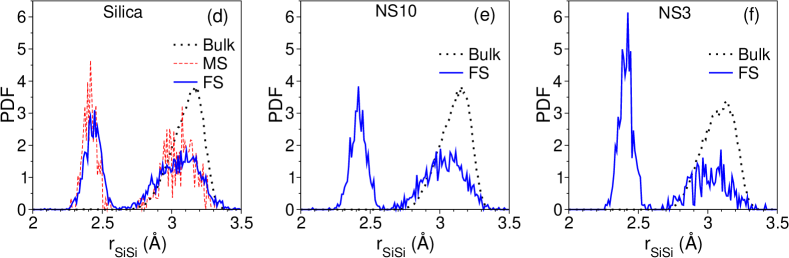
Figure 6(a) shows the concentrations of Si and esSi as a function of Na2O content for the surfaces. As a reference we have included in the graph also the concentration of Si in the bulk state (black dashed line), which decreases linearly with the Na concentration. The graph demonstrates that due to the enrichment of O and Na atoms on the surfaces, the surface concentration of Si is considerably lower than the bulk one. Furthermore one sees that for the FS the concentration of esSi is considerably higher than the one of the MS, i.e. the former surface is more abundant in 2M-rings than the MS, a trend that can be understood directly from the production process of the two types of surfaces. For the FS, both the Si and esSi fractions decrease in a linear manner with Na2O content showing that on the surface the Si atoms are readily replaced by Na atoms. The graph also demonstrates that the Si concentration in the MS depends very weakly on the Na2O content. The only exception is for the Na-poor compositions in that one observes drastic decrease in the concentration of Si at the surface if one goes from pure silica to a glass with 5% Na2O. This result is directly related to the fact that the MS is created in the liquid state which allows more Na to diffuse to the surface and thus to reorganize the surface structure by reducing the concentration of Si atoms and hence the local stress.
The ratio between the fractions of esSi and Si on the two types of surface are plotted in Fig. 6(b). One recognizes that for the FS over 60% of Si atoms are in the 2M-ring structures and this ratio slightly increases with increasing Na2O content. The MS, by contrast, only has a negligible fraction of esSi on the surface, except for silica for which around 30% of Si are esSi. We mention here that the FS was generated by fast cracking ( m/s [49]) at room temperature and therefore one can expect that only very little reconstruction of the fracture surface has occurred after the crack has passed.
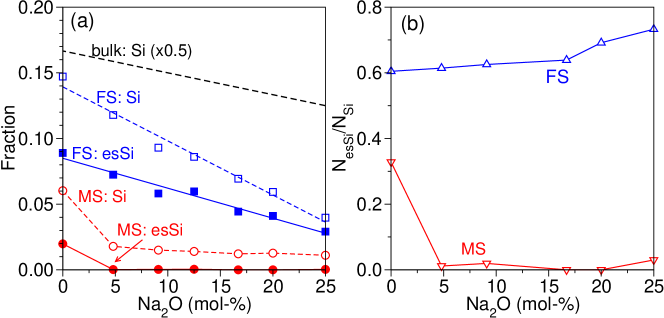
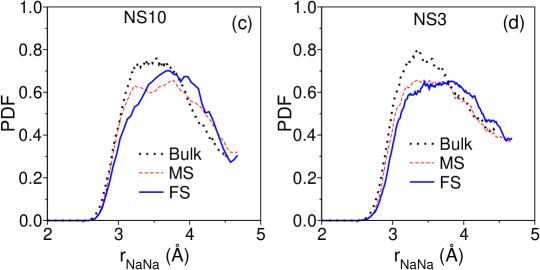
Figure 7 shows the distributions of the nearest neighbor distances for the Na-O () and Na-Na () pairs. For Na-O, panels (a) and (b), one recognizes that the two curves for the surfaces are nearly identical, indicating that the relative arrangement of surface O and Na is independent of the nature of the surface, despite the fact that for the two surfaces the Na concentration is very different (see Fig. 9). Furthermore we note that the distributions of the distances for the two surfaces are narrower and peak at a smaller distance than the one of the bulk. This finding indicates that the most probable Na-O bond length on the surfaces is slightly smaller than the typical value found in the bulk. The rationale is that on the surfaces the atoms have less constraints, and thus the Na and O atoms are more likely to form bonds that are energetically more favorable.
For the Na-Na distance, panels (c) and (d), one notices that also here the distributions for the two surfaces are very similar but that now these distributions are slightly broader than the one for the bulk. This observation might indicate that on the surface the Na arrangement (with respect to the Si-O network) is more disordered than in the bulk but it might also related to the increased local concentration of Na atoms.
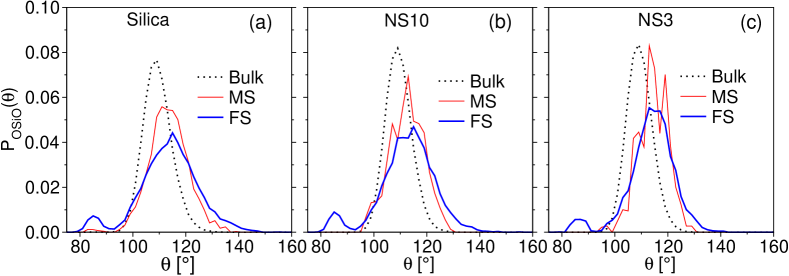
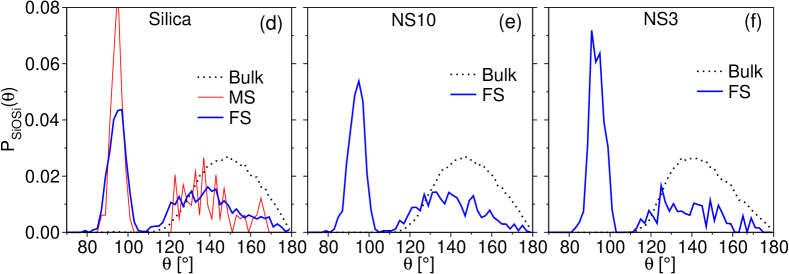
Figure 8 shows the bond angle distributions for O-Si-O and Si-O-Si linkages. (Links are defined via the first minimum in the corresponding radial distribution function.) For O-Si-O, panels (a-c), one sees that the curves for the surfaces have a peak at the intra-tetrahedral angle 109 which is broader than the one of the bulk. For the FS this peak is the widest, showing that the structure of this surface has the strongest disorder. A further feature to be noticed is the peak at , notably for the FS curves. This peak is another signature of the 2M-rings, in addition to the distance Å, Figs. 5(d-f). The presence of these 2M-rings can also be seen in the distribution of the (inter-tetrahedral) Si-O-Si angle, Figs. 8(d-f), in that one finds a marked peak at . In fact this peak is the dominant one for the FS, while it is completely absent in the bulk sample, showing that the 2M-rings are very important structural motifs for the FS. (Note that for NS10 and NS3 we do not show this distribution for the MS since the quasi-absence of Si atoms makes that the distribution is very noisy.) The abundance of the 2M-rings has also the consequence that the peak found in the bulk system at around , stemming from rings of size 5-7, [63] is shifted to smaller angles and is reduced significantly in intensity.
Having discussed some of the structural properties of the surfaces for three compositions we now focus on how the surface composition depends on the Na concentration of the sample. From panel (a) of Fig. 9 one recognizes that for the MS the Na concentration is significantly higher than the value in the bulk (dashed line), showing that the MS is significantly enriched in sodium. Interestingly we find that the Na2O dependence of this concentration closely tracks the one of the bulk (the lines are basically parallel). This means that once the Na2O concentration of the glass surpasses a certain amount (around 5%) the surface becomes enriched in Na and increasing the Na2O concentration does not lead to a modification of the structure beyond the trivially expected amount. For the FS we find a different behavior in that increasing Na2O gives rise to a (linear) increase in the Na concentration but this time with a slope that is higher than the one of the bulk. As a consequence, the Na fraction in the FS gradually approaches the one of the MS as the Na2O concentration is increased. The same qualitative trends are observed for the concentration of oxygen: Both type of surfaces have a O concentration that is higher than the one in the bulk but now the one for the MS is closer to the bulk curve than the FS.
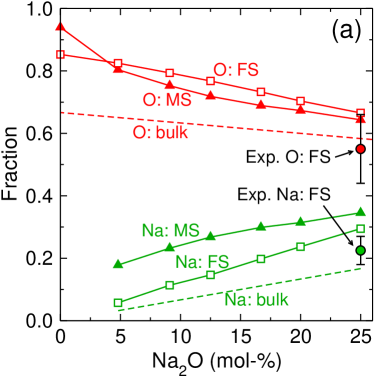
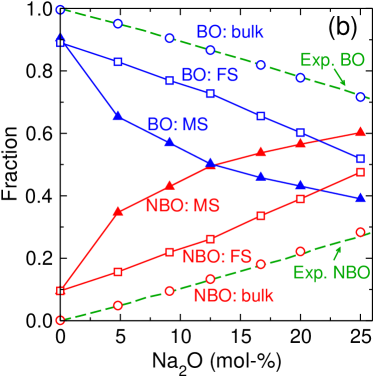
Also included in Fig. 9(a) are the experimental data for the FS of NS3 as measured by LEIS, [23] which shows the enrichment of Na in the surface layer, in quantitative agreement with our results. The experimental value for the O concentration is compatible with our results, but due to the relatively large error bars of the experiment data one cannot draw strong conclusions.
For the oxygen atoms one can distinguish between bridging (BO, bonded to two Si) and nonbridging oxygen (NBO, bonded to only one Si) and their fractions are depicted in Fig. 9(b). We see that, for the bulk glasses, these concentrations show a linear dependence on the Na2O content and that for all compositions our data are in excellent agreement with the results of XPS and nuclear magnetic resonance (NMR) studies. [64, 65, 66] We observe that both type of surfaces are more abundant in NBO than the bulk, and that this enrichment is more pronounced for the MS. The concentration of NBO on the surface is directly related to the abundance of Na: More Na on the surface results in the breaking of Si-O-Si linkage thus creating more dangling Si-O- bonds, i.e. more NBO.
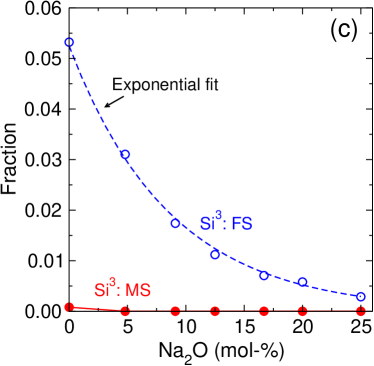
Figure 9(c) shows the fraction of under-coordinated (3-fold) Si, Si3, a typical structural defects on glass surfaces. We note that the concentration of Si3 is nearly zero for the MS. In contrast to this, the FS has a non-negligible amount of Si3 and its concentration shows an exponential dependence on Na2O concentration. The presence of Si3 on the FS is due to the fact that the glass was fractured at room temperature with a crack velocity on the order of 103 m/s, i.e. dynamic fracture. [49, 67] Since at this the glass structure is practically frozen, the structural damage caused by the fracture can hardly be healed, leaving some Si atoms under-coordinated. The fact that the fraction of Si3 depends on the Na concentration demonstrates the crucial role of Na in reducing and repairing the structural damages during fracture.
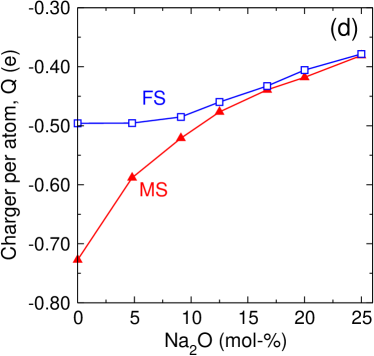
Using the surface compositions, we have further calculated for the surfaces the per-atom atomic charge , which is defined by
| (3) |
where and are the fraction and charge of atom species (), respectively. Figure 9(d) shows that both the MS and FS are negatively charged, and that the negativity is more pronounced for the MS than for the FS. With increasing Na2O concentration diminishes significantly. These observations are related to the fact that there are more oxygen ions on the surface than is expected from the stochiometry, thus giving rise to a local charge imbalance. With increasing Na concentration, sodium atoms will propagate to the surface to compensate the negative charges, rationalizing the decrease of with increasing Na2O concentration, although even for the highest concentrations we consider the surface charge remains significantly negative. The charge dependence on the sodium content is stronger for the MS than for the FS since the former is better equilibrated and hence the sodium atoms have a higher probability to reach this surface, in agreement with the higher Na fraction found in the MS (Fig. 9a).
III.3 Depth profiles
Having defined the outermost surface layer we can now investigate how the composition of the sample changes as a function of the depth , i.e. over what distance the presence of the surface affects the properties of the glass sample. Note that in the following we define this distance as the length of the shortest path from a given atom to any atom on the surface and thus represents the surface monolayer.
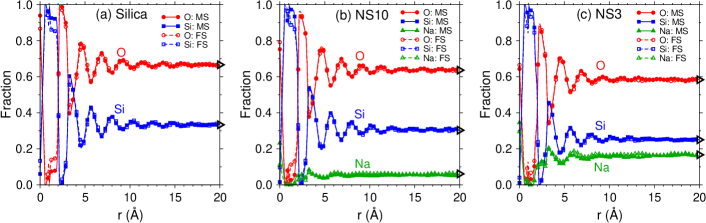
Figures 10(a-c) show the concentration profiles of various atomic species as a function of for the two types of surfaces. These graphs demonstrate that for these three compositions the curves for the FS and MS are very similar if exceeds 2-3 Å, while noticable differences are seen at smaller distances. With increasing , the oxygen concentration drops very quickly if reaches 1 Å while the concentration of Si increases strongly. This signals that the atomic layer right below the surface is dominated by silicon atoms, in agreement with previous studies. [41, 42, 62] The differences between the curves for the MS and FS become invisible for distances Å, i.e. beyond this distance the density profiles do not depend on how the surface has been created. If is increased further, the elemental concentrations approach the value in the bulk (marked by triangles on the right ordinate) and for distances around 20 Å the curves reach the bulk values within 1% deviation. Note that for the systems containing sodium, panels (b) and (c), the decay of the Na profiles is faster than the one for Si and O, a result that is related to the high mobility of the Na atoms which allows this species to screen quickly the perturbations generated by the surface.
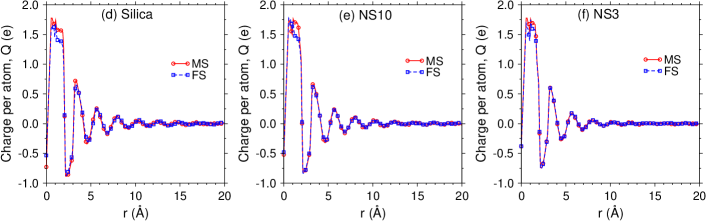
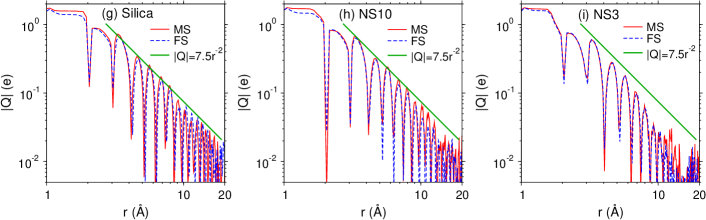
Figures 10(d-f) show the dependence of the per-atom atomic charge, defined in Eq. (3), for the two surfaces. As increases, one finds alternating peaks/valleys, a result that is directly related to the variation of atomic fractions shown in panels (a-c). In addition, we notice that the charge fluctuations seem to decay faster if the Na content in the glass is increased. To understand better the dependence of , we have replotted the data on log-log (Figs. 10(g-i)) and semi-log (Figs. 10(j-l)) scales. (Note that now we plot the absolute value of .) These graphs allow to recognize that, within the noise of the data, the charge at intermediate and large distances is independent of the type of surface, despite the fact that the charge on the first layer is more negative for the MS than for the FS, see Fig. 9(d). For the case of silica, panel (g), we find that the decay is nicely descibed by a power-law with an exponent -2. If one adds a bit of sodium, NS10 in panel (h), the signal at intermediate range is compatible with the same power-law, but for distances larger than 8 Å one spots deviations. For systems with high sodium content, NS3 in panel (i), the power-law is no longer a good description for the decay.
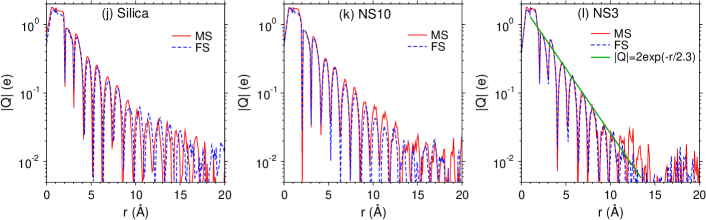
The log-linear plot in panel (j) confirms that for silica the decay of is slower than an exponential. With the addition of Na, NS10 in panel (k), the decay becomes faster but within the limited range of the data it is not possible to identify the functional form of the decay. However, for the case of NS3, panel (l), things become clearer in that the signal can be nicely described by a straight line, i.e. the decay is an exponential with a decay length Å. Hence we can conclude from these graphs that the addition of sodium transforms the power-law decay observed in silica into an exponential decrease, i.e. the network modifier is able to restore the charge balance already at short distances (about 10 Å).
III.4 Vibrational properties
The quantities discussed so far to characterize the surface are closely related to its structure. In real experiments it is, however, not easy to access this type of information since, e.g., scattering techniques are hampered by a lack of scattering volume or spatial resolution. As a consequence one often relies on spectroscopic techniques to investigate surface properties since such measurements allow to pick up a signal even if the probe volume is small. In order to make a connection of the structural properties with the spectroscopic properties of the samples, we discuss in the present section its vibrational features.
Although simulations using classical potentials have often difficulties to give a reliable description of the vibrational spectra, [68] the potential used in the present work has been found to be able to reproduce well the vibrational features of soda-silicate glasses in the bulk. [52, 63] Therefore it can be expected that this potential gives also reasonable values for the vibrational frequencies of the atoms close to the surface.
To calculate the vibrational density of states (VDOS), , of the system we have quenched the glasses to 5 K. Since the samples were already at 300 K, i.e. well below their glass transition temperature, this quench can be done with a high cooling rate without affecting the . At this low temperature the motion of the atoms can be considered to be harmonic and hence the VDOS can be obtained by calculating the time Fourier transform of the velocity-autocorrelation function: [69]
| (4) |
where is the frequency, is the number of atoms, is the Boltzmann constant, and and are respectively the mass and velocity of atom at time . This way to calculate has the advantage that it is computationally inexpensive and also allows the decomposition of the VDOS into various species (atoms, groups of atoms, etc.) by considering on the right hand side of Eq. (4) the corresponding terms.
Figure 11 shows the frequency dependence of the VDOS, normalized to unity, for three glass compositions. For the case of bulk SiO2, dotted line in panel (a), it has been documented that the broad band with cm-1 is due to bending and rocking modes of O with respect to Si, whereas the high-frequency band with cm-1 originates from the (symmetric/asymmetric) stretching vibrations within the [SiO4] units. [70, 71, 72] For the MS one finds that the high frequency band has the same shape as the one of the bulk, but it is shifted to somewhat lower frequencies, showing that the presence of the surface makes the intra-tetrahedral vibrations a bit softer, likely due to the fact that there are less (effective) constraints on the atoms, but also because of the presence of NBO (see below). The bands at around 500 cm-1 and 720 cm-1 have a lower intensity than the ones in the bulk and below we will see that this is due to the increased number of NBO. [73] This enhanced concentration of NBO is also the reason for the increase of the peak at around 100 cm-1 since in this frequency range one has significant contributions from the rotation of [SiO4] units. [72] For the FS we see that the gap in at around 850 cm-1 starts to fill up since, see below, in this range of the edge sharing BO have a significant contribution to . The band at high frequencies has less structure than the one for the bulk or the MS, a result that is related to the increased disorder in the tetrahedral units. The rest of the spectrum is qualitatively similar to the one for the MS, except that the peak at around 100 cm-1 is shifted to even lower frequencies since the structural units at the surface have a decreased connectivity.
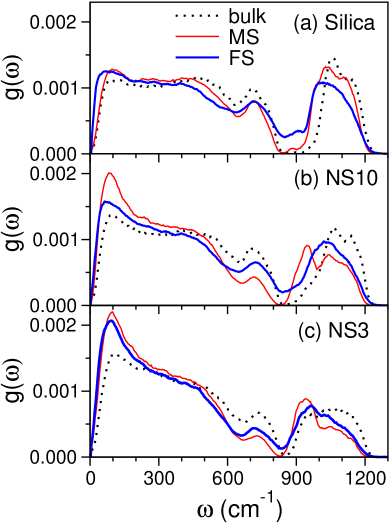
For the bulk glasses containing Na, Figs. 11(b) and (c), we note firstly that the intensities of the main bands at intermediate and high frequencies are reduced with respect to the ones in silica. In contrast to this, one observes the presence of a pronounced peak at cm-1 the intensity of which increases with increasing Na concentration. This peak is related to the vibrational modes of the Na atoms. [74] For the surfaces this low-frequency peak is significantly higher than the one for the bulk, in agreement with the fact discussed above that the surfaces have higher concentration of Na and NBO (Fig. 9). The increase of Na content also leads to a substantial reduction of the peak at around cm-1, since the presence of Na reduces the number of corner-sharing bridging oxygen atoms (see below). For the high frequency band we recognize that the presence of a surface leads to a significant change in the shape of the peaks, excitations that are related to complex Si-O and Si-NBO motions. [73, 74]
In order to understand in a more quantitative manner the reason for these modifications it is useful to decompose the VDOS into the contributions of the various structural elements. Figures 12(a) and (b) present the various partial VDOS for the FS of the silica glass. The structural elements we consider are the edge-sharing and corner-sharing BO (esBO and csBO, respectively), the edge-sharing and corner-sharing silicon atoms (esSi and csSi, respectively) as well as the NBO. (For the sake of clarity, these five partials are shown separately in panels (a) and (b).) Also included in the graphs are the total VDOS (the same as shown in Fig. 11 but here it is normalized with respect to the number of atoms). The total VDOS is the weighted sum of the partials, with weights that are stated next to each curve. From these distributions one recognizes that around 950 cm-1 the NBO as well as the esBO have a sharp peak. This rationalizes thus the observation that in Fig. 11(a) the high frequency band of the FS is shifted to lower frequency with respect to the bulk system. The disappearance of the gap at around 850 cm-1 can now be explained by a signal in the VDOS of the esBO since these 2M-rings have a marked peak at cm-1 (panel a). We mention that experimental studies have reported that the presence of 2M-rings on the surface of -cristobalite generate two strong infrared bands at 888 and 908 cm-1. [30, 32, 35] The vibrational fingerprint of 2M-ring found in our simulations is thus in excellent agreement with these experimental findings. To the best of our our knowledge this is the first time the vibrational signature of the 2M-ring structure is correctly predicted from classical simulations. The fact that we did not observe a double peak might be attributed to the disordered structure of glass. (The vibrational spectra of glass are generally broader than their crystalline counterparts. Since the two characteristic peaks for 2M-rings are very close to each other, it is likely that they merge together to form a broader band in the case of glass.)
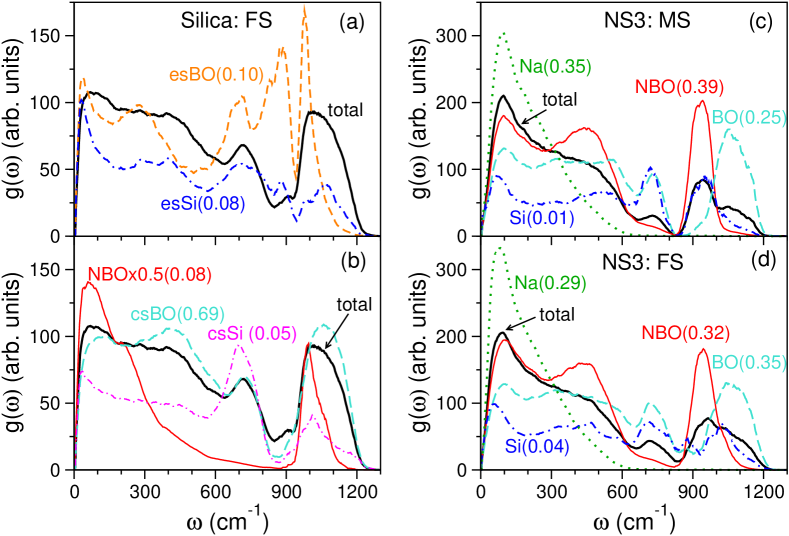
Furthermore, we note that the 2M-rings affect also the total spectrum at lower frequencies. The spectrum for the csBO have a peak at around 420 cm-1 (Fig. 11b) while for the esBO this peak is shifted to around 300 cm-1, which rationalizes the different shape of the total VDOS in this frequency range (see Fig. 11a). Panel (b) also shows that the NBO have a marked peak at around 80 cm-1. This feature explains thus why the total VDOS for the FS has an enhanced intensity at low frequencies with respect to the bulk sample.
We show in Figs. 12(c) and (d) the partial VDOS for the MS and FS of the Na-containing NS3 glass. For both systems we find that the Na VDOS has a pronounced peak at small frequencies, in qualitative agreement with previous simulation results of bulk systems. [74] Note that for the FS this peak is somewhat higher than the one for the MS. This is likely due to the fact that for the MS the local Na concentration is higher than for the FS, thus allowing environments of the Na atoms that are more diverse and hence a peak that is broader. Furthermore we see that the curves for the NBO have a pronounced peak at cm-1 while the one for BO have a strong contibution at cm-1. These two peaks explain thus the observed double peak structure in NS3 in the high frequency band of the NS3 system having a surface, see Fig. 11(c).
Finally we note that for the FS we can also detect a small peak at cm-1 in the VDOS for the Si and BO, panel (d), while this feature is absent in the spectra for the MS. These peaks are related to the 2M-rings of the surface which are present on the FS but not on the MS (see Fig. 6). So this peak is able to tell whether a surface has been generated from a quench of the melt or the fracture of a glass sample.
IV Summary and Conclusions
In this work we have probed how the properties of glass surfaces depend on the composition of the system and the type of surface considered (melt-formed surface or fracture surface). By analyzing the surface monolayer we have found that, independent of the Na2O concentration, there are significant differences between the MS and FS; the latter have quite a few structural defects such as two-membered rings and under-coordinated Si while the former have none, except for the case of silica. This shows that, for the MS, the annealing of the structure as made possible by the high-temperature equilibration and slow cooling allows to avoid these energetically unfavorable structures, if Na are present. Also the composition of the first atomic layer depends on the type of sample considered in that the elemental concentrations of the FS show almost a linear dependence on Na2O content in the glass, whereas the ones for the MS behave very differently. Both the MS and FS are negatively charged. For the glasses with low Na2O concentration, this charge is relatively large but its negativity decreases with increasing Na2O content. This effect can be expected to be important for the chemical reactivity of the surface since local Na fluctuations will result in local fluctuations in the charge.
Since the presence of the surface creates a gradient in the composition we have probed how these fluctuations depend on the type of surface and the glass composition. Surprisingly, we find that beyond the second atomic layer below the surface, i.e. Å, there is no noticeable difference between the compositional fluctuations measured in the FS and MS systems. We emphasize, however, that this result does not mean that the structure of the glass farther than, say, a few Å from the surface is independent of the way the surface was generated. Interestingly, the functional form for the decay of the elemental concentration depends on the Na2O concentration in the sample: For low Na2O concentration it is a power-law while for high concentration one finds an exponential decay. The slower (power-law) decay indicates the high local frustration of the system which permits only a gradual healing of the structural perturbation due to the presence of free surface.
The vibrational density of states show that the systems with free surfaces have on average atomic vibrations at lower frequencies than the one found in the bulk glass. By analyzing the partial VDOS we show that this softening of the atomic vibrations is due to the increased number of NBO close to the surface and also to the higher concentration of Na atoms. Interestingly we find in the spectrum of the FS a weak but clear signal of the two-membered rings at the frequency of cm-1, while no such signal exists for the MS. This result therefore permits to use spectroscopic methods to decide whether or not a given surface has been generated from a fracture process.
V Acknowledgements
We thank H. Jain for discussions. Z.Z. acknowledges financial support by China Scholarship Council (NO. 201606050112). W.K. is member of the Institut Universitaire de France. This work was granted access to the HPC resources of CINES under the allocation A0050907572 attributed by GENCI (Grand Equipement National de Calcul Intensif).
Data Availability Statement: The data that support the findings of this study are available from the corresponding author upon reasonable request.
References
- [1] James E. Shelby. Introduction to glass science and technology. Royal Society of Chemistry, 2005.
- [2] Kurt Binder and Walter Kob. Glassy materials and disordered solids: An introduction to their statistical mechanics. World Scientific, 2011.
- [3] Arun K Varshneya. Fundamentals of inorganic glasses. Elsevier, 2013.
- [4] LL Hench and David E Clark. Physical chemistry of glass surfaces. J. Non-Cryst. Solids, 28(1):83–105, 1978.
- [5] Carlo G Pantano. Glass surfaces. Rev. Solid State Sci., 3:379–408, 1989.
- [6] Hans Bach. Advanced surface analysis of silicate glasses, oxides and other insulating materials: a review. J. Non-Cryst. Solids, 209(1-2):1–18, 1997.
- [7] PL Bocko, PM Fenn, LR Morse, and F Okamoto. Surface chemistry and microstructure of flat panel display substrates. SID 91 Digest, 675, 1991.
- [8] Tania Dey and Daragh Naughton. Cleaning and anti-reflective (ar) hydrophobic coating of glass surface: a review from materials science perspective. J. Sol-Gel Sci. Technol., 77(1):1–27, 2016.
- [9] Kai Zheng, Martin Kapp, and Aldo R Boccaccini. Protein interactions with bioactive glass surfaces: a review. Appl. Mater. Today, 15:350–371, 2019.
- [10] Ted L. Anderson. Fracture mechanics: Fundamentals and applications, Fourth Edition. CRC Press, 2017.
- [11] Marc André Meyers and Krishan Kumar Chawla. Mechanical behavior of materials. Cambridge University Press, 2008.
- [12] Matteo Ciccotti. Stress-corrosion mechanisms in silicate glasses. J. Phys. D, 42(21):214006, November 2009.
- [13] C.L. Rountree, S. Prades, D. Bonamy, E. Bouchaud, R. Kalia, and C. Guillot. A unified study of crack propagation in amorphous silica: Using experiments and simulations. J. Alloys Compd., 434:60–63, May 2007.
- [14] Prabhat K. Gupta, Daryl Inniss, Charles R. Kurkjian, and Qian Zhong. Nanoscale roughness of oxide glass surfaces. J. Non-Cryst. Solids, 262(1-3):200–206, February 2000.
- [15] T. Sarlat, A. Lelarge, E. Søndergård, and D. Vandembroucq. Frozen capillary waves on glass surfaces: an AFM study. Eur. Phys. J. B, 54(1):121–126, November 2006.
- [16] D. Bonamy, L. Ponson, S. Prades, E. Bouchaud, and C. Guillot. Scaling Exponents for Fracture Surfaces in Homogeneous Glass and Glassy Ceramics. Phys. Rev. Lett., 97(13), September 2006.
- [17] Laurent Ponson, Daniel Bonamy, and Elisabeth Bouchaud. Two-dimensional scaling properties of experimental fracture surfaces. Phys. Rev. Lett., 96(3):035506, 2006.
- [18] Sheldon M. Wiederhorn, Jose M. López-Cepero, Jay Wallace, Jean-Pierre Guin, and Theo Fett. Roughness of glass surfaces formed by sub-critical crack growth. J. Non-Cryst. Solids, 353(16-17):1582–1591, June 2007.
- [19] Jean-Pierre Guin and Sheldon Wiederhorn. Fracture of Silicate Glasses: Ductile or Brittle? Phys. Rev. Lett., 92(21):215502, May 2004.
- [20] D. Bonamy and E. Bouchaud. Failure of heterogeneous materials: A dynamic phase transition? Phys. Rep., 498(1):1–44, January 2011.
- [21] Sheldon M. Wiederhorn, Theo Fett, Jean-Pierre Guin, and Matteo Ciccotti. Griffith Cracks at the Nanoscale. Int. J. Appl. Glass Sci., 4(2):76–86, June 2013.
- [22] J. F. Kelso, Carlo G. Pantano, and S. H. Garofalini. A comparison of ion scattering spectra and molecular dynamics simulations at the surface of silicate glasses. Surf. Sci. Lett., 134(3):L543–L549, 1983.
- [23] Rui M. Almeida, Ray Hickey, Himanshu Jain, and Carlo G. Pantano. Low-Energy Ion Scattering spectroscopy of silicate glass surfaces. J. Non-Cryst. Solids, 385:124–128, February 2014.
- [24] Rui M. Almeida, Himanshu Jain, and Carlo G. Pantano. Low-Energy Ion-Scattering Spectroscopy of Modified Silicate Glasses. J. Am. Ceram. Soc., 99(4):1259–1265, April 2016.
- [25] Cody V Cushman, Philipp Brüner, Julia Zakel, Cameron Dahlquist, Brandon Sturgell, Thomas Grehl, Barry M Lunt, Joy Banerjee, Nicholas J Smith, and Matthew R Linford. Low energy ion scattering (leis) of as-formed and chemically modified display glass and peak-fitting of the al/si leis peak envelope. Appl. Surf. Sci., 455:18–31, 2018.
- [26] Edda Rädlein and Günther Heinz Frischat. Atomic force microscopy as a tool to correlate nanostructure to properties of glasses. J. Non-Cryst. Solids, 222:69–82, 1997.
- [27] J-F Poggemann, A Goss, G Heide, E Rädlein, and GH Frischat. Direct view of the structure of a silica glass fracture surface. J. Non-Cryst. Solids, 281(1-3):221–226, 2001.
- [28] J-F Poggemann, G Heide, and GH Frischat. Direct view of the structure of different glass fracture surfaces by atomic force microscopy. J. Non-Cryst. Solids, 326:15–20, 2003.
- [29] GH Frischat, J-F Poggemann, and G Heide. Nanostructure and atomic structure of glass seen by atomic force microscopy. J. Non-Cryst. Solids, 345:197–202, 2004.
- [30] BA Morrow and IA Cody. Infrared studies of reactions on oxide surfaces. 5. lewis acid sites on dehydroxylated silica. J. Phys. Chem., 80(18):1995–1998, 1976.
- [31] Terry A Michalske and BC Bunker. Slow fracture model based on strained silicate structures. J. Appl. Phys, 56(10):2686–2693, 1984.
- [32] BC Bunker, DM Haaland, KJ Ward, TA Michalske, WL Smith, J Steve Binkley, CF Melius, and CA Balfe. Infrared spectra of edge-shared silicate tetrahedra. Surf. Sci., 210(3):406–428, 1989.
- [33] Lawrence H Dubois and Bernard R Zegarski. Bonding of alkoxysilanes to dehydroxylated silica surfaces: a new adhesion mechanism. J. Phys. Chem., 97(8):1665–1670, 1993.
- [34] Lawrence H Dubois and Bernard R Zegarski. Reaction of alkoxysilane coupling agents with dehydroxylated silica surfaces. J. Am. Chem. Soc., 115(3):1190–1191, 1993.
- [35] A Grabbe, TA Michalske, and WL Smith. Strained siloxane rings on the surface on silica: their reaction with organosiloxanes, organosilanes, and water. J. Phys. Chem., 99(13):4648–4654, 1995.
- [36] Albert Rimola, Dominique Costa, Mariona Sodupe, Jean-François Lambert, and Piero Ugliengo. Silica Surface Features and Their Role in the Adsorption of Biomolecules: Computational Modeling and Experiments. Chem. Rev., 113(6):4216–4313, June 2013.
- [37] Mengguo Ren, Lu Deng, and Jincheng Du. Bulk, surface structures and properties of sodium borosilicate and boroaluminosilicate nuclear waste glasses from molecular dynamics simulations. Journal of Non-Crystalline Solids, 476:87–94, 2017.
- [38] Thiruvilla S Mahadevan and Jincheng Du. Hydration and reaction mechanisms on sodium silicate glass surfaces from molecular dynamics simulations with reactive force fields. J. Am. Ceram. Soc., 103(6):3676–3690, 2020.
- [39] BP Feuston and SH Garofalini. Topological and bonding defects in vitreous silica surfaces. J. Chem. Phys., 91(1):564–570, 1989.
- [40] Stephen H Garofalini. Molecular dynamics computer simulations of silica surface structure and adsorption of water molecules. Journal of Non-Crystalline Solids, 120(1-3):1–12, 1990.
- [41] Alexandra Roder, Walter Kob, and Kurt Binder. Structure and dynamics of amorphous silica surfaces. J. Chem. Phys., 114(17):7602–7614, 2001.
- [42] M. Rarivomanantsoa, P. Jund, and R. Jullien. Classical molecular dynamics simulations of amorphous silica surfaces. J. Phys. Condens. Matter, 13(31):6707, 2001.
- [43] Jincheng Du and Alastair N. Cormack. Molecular dynamics simulation of the structure and hydroxylation of silica glass surfaces. J. Am. Ceram. Soc., 88(9):2532–2539, 2005.
- [44] Davide Ceresoli, Marco Bernasconi, Simonetta Iarlori, Michele Parrinello, and Erio Tosatti. Two-membered silicon rings on the dehydroxylated surface of silica. Phys. Rev. Lett., 84(17):3887, 2000.
- [45] Narottam P. Bansal and Robert H. Doremus. Handbook of glass properties. Orlando: Academic Press, 1986.
- [46] Alexander Fluegel. Global Model for Calculating Room-Temperature Glass Density from the Composition. J. Am. Ceram. Soc., 90(8):2622–2625, 2007.
- [47] Ruth Knoche, Donald B. Dingwell, F. A. Seifert, and Sharon L. Webb. Non-linear properties of supercooled liquids in the system \chNa2O-SiO2. Chem. Geol., 116(1-2):1–16, 1994.
- [48] Pascal Richet and Yan Bottinga. Glass transitions and thermodynamic properties of amorphous \chSiO2, NaAlSinO2n+2 and \chKAlSi3O8. Geochim. Cosmochim. Acta, 48(3):453–470, 1984.
- [49] Zhen Zhang. Fracture, surface, and structure of silicate glasses: Insights from atomistic computer simulations. Doctoral dissertation, University of Montpellier, 2020.
- [50] Zhen Zhang, Simona Ispas, and Walter Kob. The critical role of the interaction potential and simulation protocol for the structural and mechanical properties of sodosilicate glasses. J. Non-Cryst. Solids, 632:119895, October 2020.
- [51] Alfonso Pedone, Gianluca Malavasi, M. Cristina Menziani, Ulderico Segre, and Alastair N. Cormack. Molecular Dynamics Studies of Stress-Strain Behavior of Silica Glass under a Tensile Load. Chem. Mater., 20(13):4356–4366, July 2008.
- [52] Siddharth Sundararaman, Liping Huang, Simona Ispas, and Walter Kob. New optimization scheme to obtain interaction potentials for oxide glasses. J. Chem. Phys., 148(19):194504, May 2018.
- [53] Shuichi Nosé. A unified formulation of the constant temperature molecular dynamics methods. J. Chem. Phys., 81(1):511–519, July 1984.
- [54] William G. Hoover. Canonical dynamics: Equilibrium phase-space distributions. Phys. Rev. A, 31(3):1695–1697, March 1985.
- [55] William G. Hoover. Constant-pressure equations of motion. Phys. Rev. A, 34(3):2499–2500, September 1986.
- [56] Steve Plimpton. Fast parallel algorithms for short-range molecular dynamics. J. Comput. Phys., 117(1):1–19, 1995.
- [57] Herbert Edelsbrunner and Ernst P. Mücke. Three-dimensional alpha shapes. ACM Trans. Graph., 13(1):43–72, 1994.
- [58] Alexander Stukowski. Computational analysis methods in atomistic modeling of crystals. JOM, 66(3):399–407, 2014.
- [59] Alexander Stukowski. Visualization and analysis of atomistic simulation data with OVITO–the Open Visualization Tool. Model. Simul. Mat. Sci. Eng., 18(1):015012, January 2010.
- [60] J. F. Kelso and C. G. Pantano. Spectroscopic examination of clean glass surfaces at elevated temperatures. J. Vac. Sci. Technol., 3(3):1343–1346, 1985.
- [61] Claus Mischler, Walter Kob, and Kurt Binder. Classical and ab-initio molecular dynamic simulation of an amorphous silica surface. Comput. Phys. Commun., 147(1-2):222–225, 2002.
- [62] Stéphanie Halbert, Simona Ispas, Christophe Raynaud, and Odile Eisenstein. Modelling the surface of amorphous dehydroxylated silica: the influence of the potential on the nature and density of defects. New J. Chem., 42(2):1356–1367, 2018.
- [63] Siddharth Sundararaman, Liping Huang, Simona Ispas, and Walter Kob. New interaction potentials for alkali and alkaline-earth aluminosilicate glasses. J. Chem. Phys., 150(15):154505, April 2019.
- [64] Boyd W Veal, DJ Lam, AP Paulikas, and WY Ching. Xps study of cao in sodium silicate glass. J. Non-Cryst. Solids, 49(1-3):309–320, 1982.
- [65] Hideki Maekawa, Takashi Maekawa, Katsuyuki Kawamura, and Toshio Yokokawa. The structural groups of alkali silicate glasses determined from 29si mas-nmr. J. Non-Cryst. Solids, 127(1):53–64, 1991.
- [66] H. Wayne Nesbitt, G. Micheal Bancroft, Grant S. Henderson, Ruby Ho, Kim Nicole Dalby, Y. Huang, and Z. Yan. Bridging, non-bridging and free (O2–) oxygen in \chNa2O-SiO2 glasses: An X-ray Photoelectron Spectroscopic (XPS) and Nuclear Magnetic Resonance (NMR) study. J. Non-Cryst. Solids, 357(1):170–180, 2011.
- [67] George D Quinn. On terminal crack velocities in glasses. Int. J. Appl. Glass Sci., 10(1):7–16, 2019.
- [68] Magali Benoit and Walter Kob. The vibrational dynamics of vitreous silica: Classical force fields vs. first principles. EPL, 60(2):269, 2002.
- [69] Martin T Dove and Martin T Dove. Introduction to lattice dynamics. Cambridge University Press, 1993.
- [70] Mark Wilson, Paul A Madden, Mahin Hemmati, and C Austen Angell. Polarization effects, network dynamics, and the infrared spectrum of amorphous \chSiO2. Phys. Rev. Lett., 77(19):4023, 1996.
- [71] Johannes Sarnthein, Alfredo Pasquarello, and Roberto Car. Origin of the high-frequency doublet in the vibrational spectrum of vitreous sio2. Science, 275(5308):1925–1927, 1997.
- [72] S. N. Taraskin and S. R. Elliott. Nature of vibrational excitations in vitreous silica. Phys. Rev. B, 56(14):8605–8622, October 1997.
- [73] N. Zotov, I. Ebbsjö, D. Timpel, and H. Keppler. Calculation of Raman spectra and vibrational properties of silicate glasses: Comparison between Na2Si4O9 and SiO2 glasses. Phys. Rev. B, 60(9):6383–6397, September 1999.
- [74] Dimitrios Kilymis, Simona Ispas, Bernard Hehlen, Sylvain Peuget, and Jean-Marc Delaye. Vibrational properties of sodosilicate glasses from first-principles calculations. Phys. Rev. B, 99(5):054209, February 2019.