The number of globular clusters around the iconic UDG DF44 is as expected for dwarf galaxies
Abstract
There is a growing consensus that the vast majority of ultra-diffuse galaxies (UDGs) are dwarf galaxies. However, there remain a few UDGs that seem to be special in terms of their globular cluster (GC) systems. In particular, according to some authors, certain UDGs exhibit large GC populations when compared to expectations from their stellar (or total) mass. Among these special UDGs, DF44 in the Coma cluster is one of the better-known examples. DF44 has been claimed to have a relatively high number of GCs, , for a stellar mass of only which would indicate a much larger dark halo mass than dwarfs of similar stellar mass. In this paper we revisit this number and, contrary to previous results, find assuming that the distribution of the GCs follows the same geometry as the galaxy. If we assume that the GCs around DF44 are distributed in a (projected) circularly symmetric way and, if we use a less strict criterion for the selection of the GCs, we find . Making use of the relation, this number of GCs suggests a dark matter halo mass of , a value which is consistent with the expected total mass for DF44 based on its velocity dispersion, km s-1. We conclude that the number of GCs around DF44 is as expected for regular dwarf galaxies of similar stellar mass and DF44 is not extraordinary in this respect.
keywords:
galaxies: clusters: individual (Coma) - galaxies: individual (DF44) (Coma) - galaxies: evolution - galaxies: structure - dark matter1 Introduction
The nature of very low surface brightness galaxies with large effective radii has been intensely debated in past years. Such objects were discovered in the 80s (Binggeli et al., 1985; Impey & Bothun, 1997; Dalcanton et al., 1997), but with new detailed observations have recently been dubbed "Ultra Diffuse Galaxies" (UDGs; van Dokkum et al., 2015a). The debate has focussed on the possible differences between UDGs and the general galaxy population with the same luminosity (i.e. dwarf galaxies111Historically, the term dwarf galaxy has referred to those galaxies that have a low total luminosity and a low central surface brightness in the -magnitude plane (see an extended discussion on Binggeli, 1994). This terminology has been independent of a galaxy’s extension and does not include the compact dwarf ellipticals (like M32). In this sense, an alternative name to UDGs would be “large dwarfs”, as already suggested in the 1980s (Sandage & Binggeli, 1984).) and, in particular, on the amount of dark matter these galaxies may possess. Are UDGs "normal" dwarf galaxies with relative little star formation activity in their central regions? Or, are UDGs a new type of galaxy with either surprisingly large amounts of dark matter for their stellar mass (see e.g. van Dokkum et al., 2016) or, on the contrary, very little dark matter (see e.g. van Dokkum et al., 2018; Trujillo et al., 2019; Emsellem et al., 2019; Müller et al., 2020)?
The vast majority of works point to UDGs having the properties of dwarf galaxies (see e.g. Beasley et al., 2016; Román & Trujillo, 2017; Venhola et al., 2017; Ruiz-Lara et al., 2018; Mancera Piña et al., 2019; Fensch et al., 2019) but with flatter light distributions (Chamba et al., 2020; Trujillo et al., 2020). This flatter light distribution could be caused either by tidal interactions (Collins et al., 2013; Rong et al., 2019), higher internal angular momentum (Amorisco & Loeb, 2016; Mancera Piña et al., 2020) or outflows (Di Cintio et al., 2017). However, some UDGs do not fit nicely into the categories of "normal" dwarf galaxies, as their dark matter content has been suggested to be very high. In particular, one of the better-known examples of such an extreme UDG is Dragonfly 44 (DF44; van Dokkum et al., 2016). This iconic galaxy, associated with the Coma galaxy cluster, has been claimed to have a dark matter halo comparable with that measured for the Milky Way (van Dokkum et al., 2016).
The first study of DF44 (van Dokkum et al., 2016, henceforth vD16) measured a high stellar velocity dispersion =47 km s-1 within the effective radius of the galaxy. By comparing to theoretical NFW profiles, vD16 suggested that DF44 harbours a dark matter halo as massive as 1012 M⊙. Considering the DF44 luminosity MV=-16.2 mag and a stellar mass , the authors of this paper claimed that DF44 resembles a ’failed’ Milky Way.
This conclusion was further supported by the assertion of an extensive number of globular clusters (GCs) in the vicinity of the galaxy (van Dokkum et al., 2017, henceforth vD17). In the absence of a dynamical estimation of the dark matter halo mass based on the kinematics of the GCs around the galaxy, the GC number count (NGC) can be used as a good proxy for regular galaxies (Spitler & Forbes, 2009; Harris et al., 2013; Hudson et al., 2014) and UDGs (Beasley et al., 2016; Beasley & Trujillo, 2016; Peng & Lim, 2016; Harris et al., 2017; Lim et al., 2018; Amorisco et al., 2018; Prole et al., 2019; Forbes et al., 2019).
Using HST data, vD17 measured NGC=74 GCs around DF44 which implies a mass for the dark matter halo of Mhalo=51011 M⊙ using the GC system mass – halo mass relations. This number decreases the original claim by the same group of NGC=94 (vD16) based on ground-based data. Later, van Dokkum et al. (2019, henceforth vD19), using spatially resolved stellar kinematics, reported a smaller velocity dispersion for DF44 (=33 km s-1, vD19) compared to the previous estimation (=47 km s-1, vD16). Using the new velocity dispersion, vD19 decreased by an almost an order of magnitude the amount of dark matter in the halo of DF44, from Mhalo=1012 M⊙ and M/L(<r1/2)=48 to Mhalo=1.61011 M⊙ and M/L(<r1/2)=26. However, the large number of GCs (75) remains in strong tension with the expected number according to the stellar mass of the object (we would expect 20 GCs for the stellar mass of DF44, if this galaxy follows the stellar mass – halo mass relation).
In this paper, we revisit the GC population of DF44 by exploring their spatial distribution, luminosity function, number count and average colour and we find a significantly lower number of GCs, making this galaxy appear more consistent with the general dwarf galaxy population. In this work, the distance to DF44 (100 Mpc), its absolute magnitude (MV=-16.2 mag) and velocity dispersion ( km s-1) are from vD17 and vD19. All the magnitudes and colours are expressed in the AB magnitude system (unless explicitly stated otherwise). Throughout this paper, we assumed the cosmological model with , and H0=70 km s-1 Mpc-1.
2 Data
DF44 imaging data was retrieved from the Hubble Space Telescope archive (HST Proposal 14643, PI: van Dokkum). This is the same dataset used by vD17. The data comprise three orbits in V606 with exposures ranging from 2200-2400s and one orbit in I814 with 2200s exposure time. V606 images were median combined using SWarp (Bertin et al., 2002) and the final amount of time in this band is 7280s. The depth of the images for point sources (5) are V606=28.4 mag and I814=26.8 mag.
The field of view of the WFC3 is 162″162″and pixel size is 0.0396″. Instrumental zero-points (AB/mag) were calculated using the PHOTFLAM and PHOTPLAM values as given in the data analysis handbook of the instrument (Gennaro, M., et al., 2018). The calculated zeropoint values for V606 and I814 are 26.10 mag and 25.14 mag respectively. Fig. 1 shows a colour composite image of DF44 combining V606 and I814 filters.

3 Analysis
3.1 Structural parameters of the DF44 galaxy
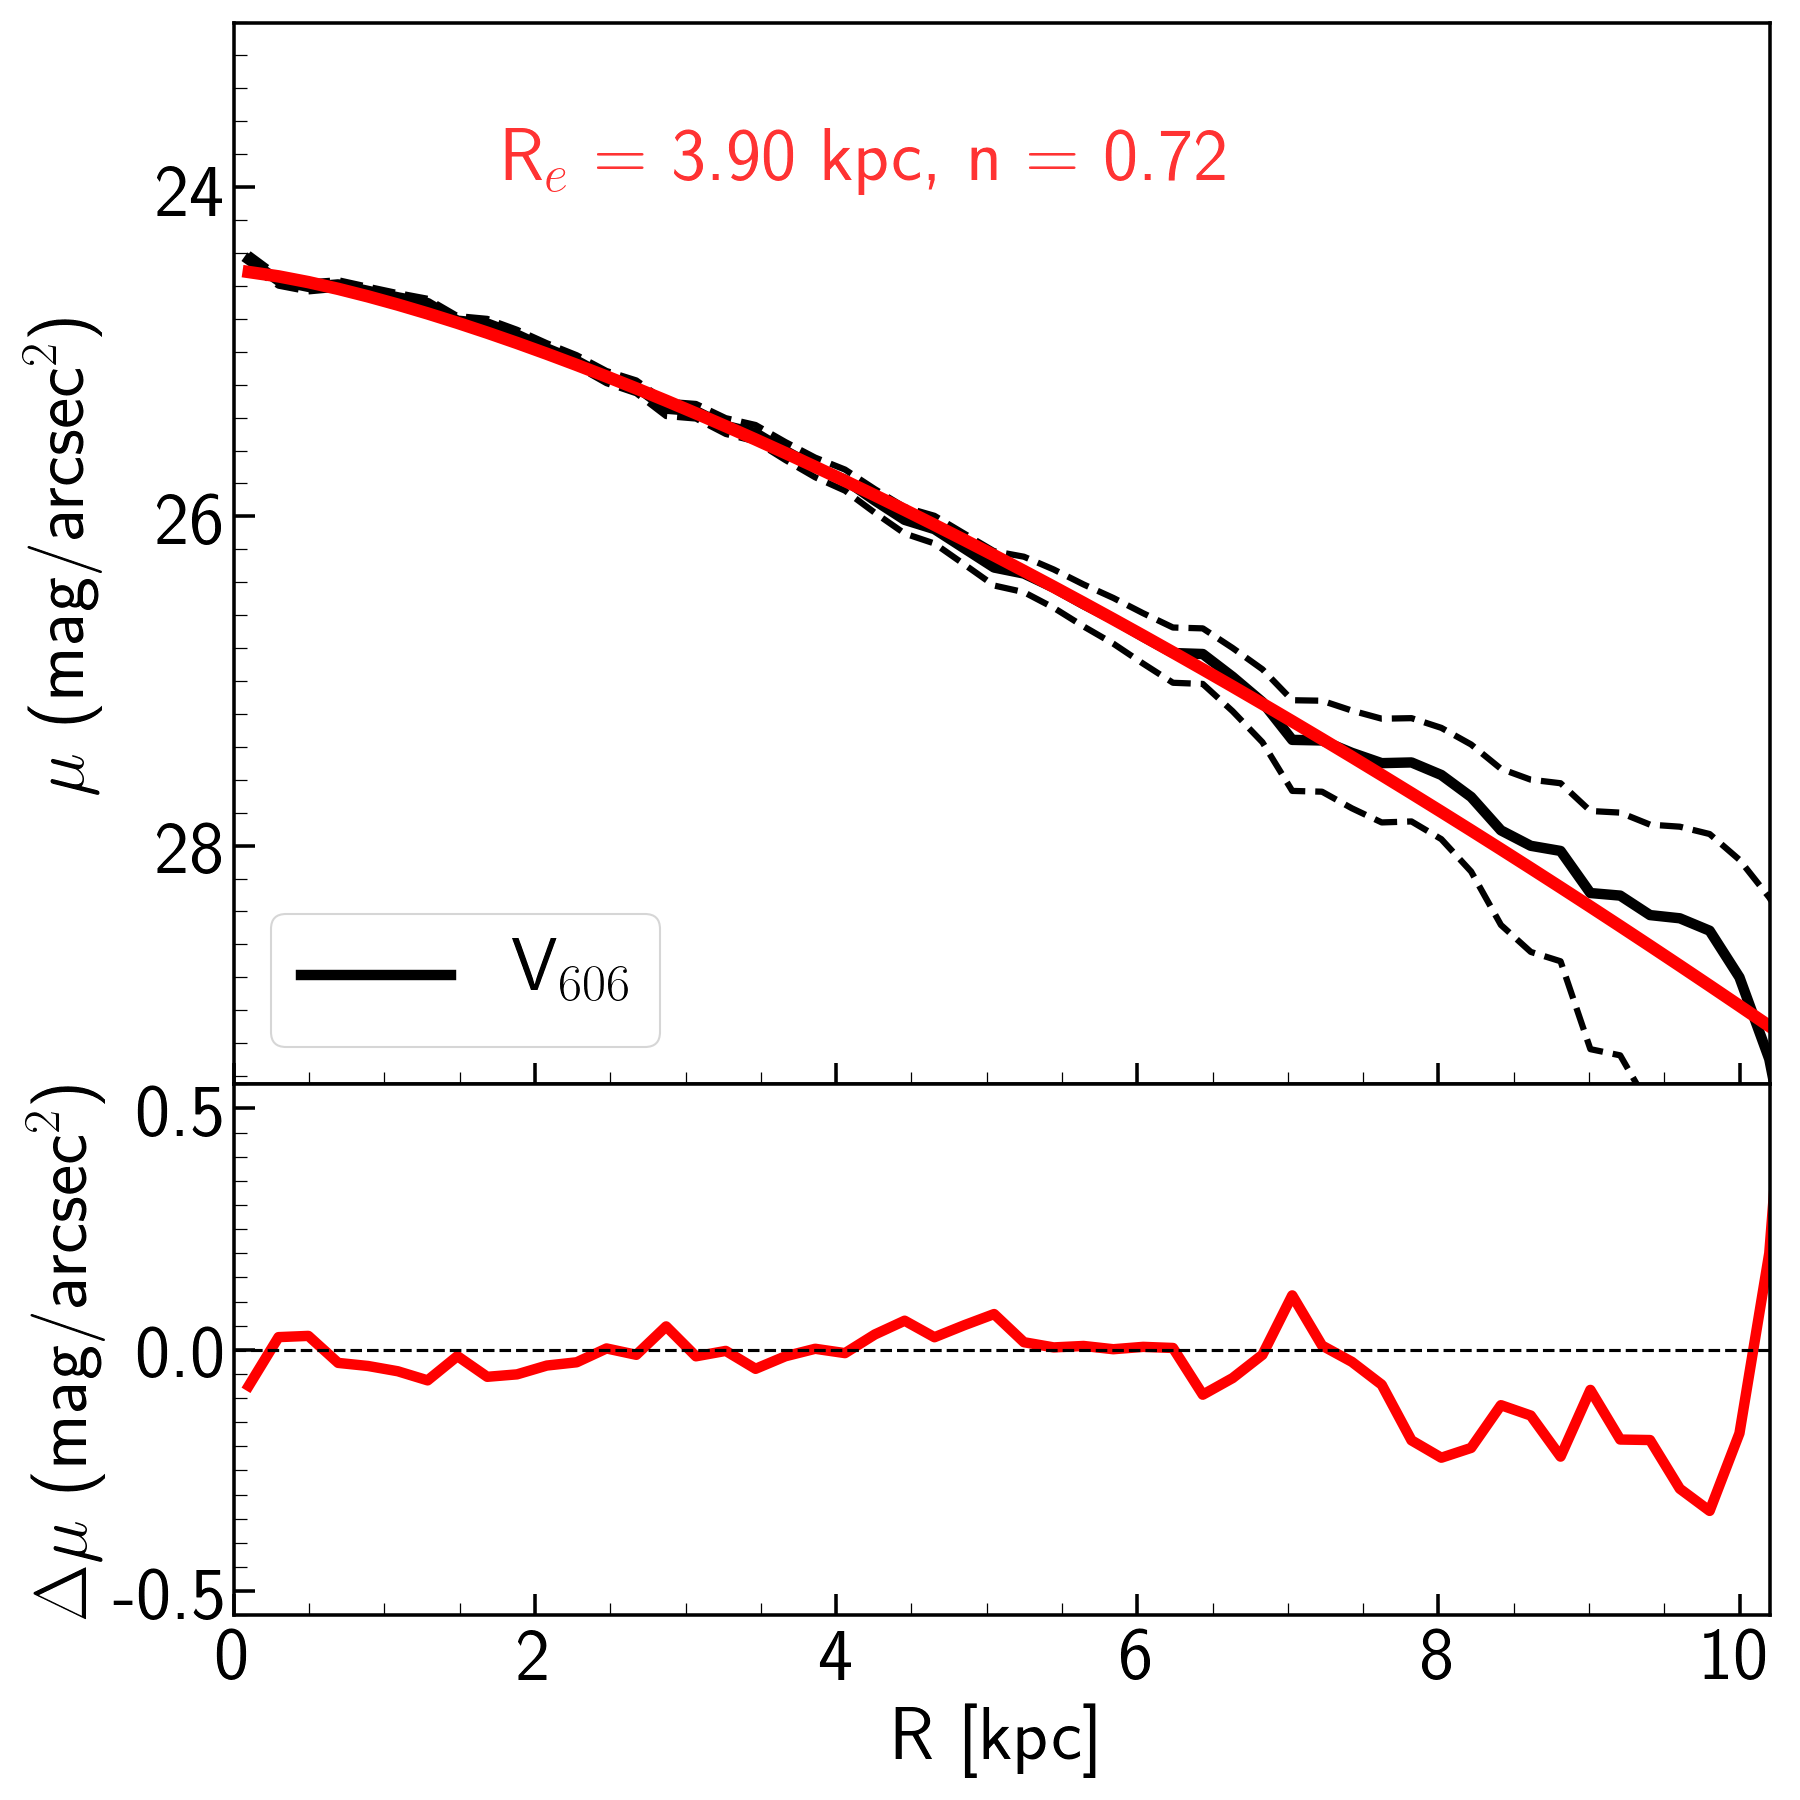
In order to extract the structural properties of DF44, we have used the code IMFIT (Erwin, 2015). We assumed, as vD17 did, that the galaxy is well described by a Sérsic model. The model was convolved with the point spread function (PSF) of the HST image. To conduct a proper fit, we have masked the background galaxies and the foreground stars in the images. Fig. 2 shows the observed light profile of the galaxy in the V606 band and the corresponding Sérsic fit. The structural properties of the galaxy are Re=3.90.7 kpc and Sérsic index n=0.720.14. The axis ratio is q=0.660.01 and the position angle PA=-26.40.7 (measured from North to East, counterclockwise).
The various published values of effective radius, Re, of DF44 have been estimated using different data and assumptions about the shape of its surface brightness profile. For instance, van Dokkum et al. (2015a) used CFHT imaging and assumed an exponential surface brightness profile for DF44 to get Re=4.6 kpc. Using Keck deep imaging, van Dokkum et al. (2015b) found Re=4.30.3 kpc using a single Sérsic component with n=0.890.06 and Re=4.1 kpc when two components are used for fitting DF44. Later, using Gemini deep data, van Dokkum et al. (2016) measured Re=4.30.2 kpc fitting a Sérsic model with n=0.85. Using the same data but this time calculating Re from the growth curve, Chamba et al. (2020) got Re=3.30.3 kpc. Finally, vD17 using the same HST dataset than the one we have used here found Re,vD17=4.7 kpc and nvD17=0.94222Uncertainties of Re and n are not provided in vD17.. A possible explanation for the different values of Re measured here and in vD17 involves the estimation of the local background around the galaxy, a slight change in which affects the determination of n, and ultimately, the value of Re.
3.2 Detection of globular cluster candidates
The detection of the GC candidates around DF44 was performed in the deepest image available: V606. SExtractor (Bertin & Arnouts, 1996) was used to extract all the sources from the V606 image to perform aperture photometry. First, a background model was made using a 3232 pixels median filter and subtracted from the final frame. This background subtraction removes the diffuse light of DF44 and improves the detection efficiency of compact objects in the vicinity of the galaxy (bottom panel in Fig. 3).
Three different techniques were used to explore the effect of the diffuse light subtraction on the catalogues of point-like sources we retrieved from the images, namely : i. unsharp masking, ii. median filtering and subtracting and iii. Sérsic fitting and subtracting the galaxy model. These three different methods produce the same catalogues of point-like sources down to V606=28.5 mag. We chose the median-filtered approach to assure that the removal of the diffuse light was done homogeneously throughout the entire image.


To characterize the objects in the image, we used SExtractor. Most of the SExtractor parameters were left to their default settings except for BACK_SIZE, DEBLEND_NTHRESH and DEBLEND_MINCONT whose values are shown in Table 1. To take into account the local variation of the background, including residuals from DF44 diffuse light subtraction, BACK_SIZE=32 was used (instead of the default value BACK_SIZE=64). Moreover, to avoid extracting the small features of background galaxies as sources, we adjusted DEBLEND_NTHRESH=2 and DEBLEND_MINCONT=0.02 (instead of the default values DEBLEND_NTHRESH=32 and DEBLEND_MINCONT=0.005). The same configuration parameters were used to extract sources in the I814 image.
| Parameter | Value |
|---|---|
| DETECT_MINAREA | 3.0 |
| DETECT_THRESH | 1.5 |
| ANALYSIS_THRESH | 1.5 |
| DEBLEND_NTHRESH | 2 |
| DEBLEND_MINCONT | 0.02 |
| BACK_TYPE | GLOBAL |
| BACK_SIZE | 32 |
| BACK_FILTERSIZE | 3 |
| PHOT_APERTURE | 4,8,30 |
The total magnitudes of the different sources were measured using aperture photometry. We estimated the aperture magnitudes of all the targets using SExtractor and PHOT_APERTURES=4 pixels (diameter). This was done in both bands (V606 and I814) and the magnitudes were aperture-corrected. The aperture correction values are 0.54 and 0.65 mag for V606 and I814, respectively. To estimate such aperture corrections we use a few bright, non-saturated, stars with magnitudes in the V606 band between 24 and 25.5 mag. For those stars, we calculate two different apertures: PHOT_APERTURES=4 pixels and 30 pixels. The above aperture corrections mostly corresponds to the amount of light between 4 to 30 pixels. However, beyond 30 pixels there is still some light that is hard to measure using stars with that signal-to-noise. For such reason, we add another 0.07 mag based on a prescription from the WFC3 instrument handbook333http://documents.stsci.edu/hst/wfc3/documents/handbooks/. After this, V606-I814 colours were calculated using the aperture corrected magnitudes.
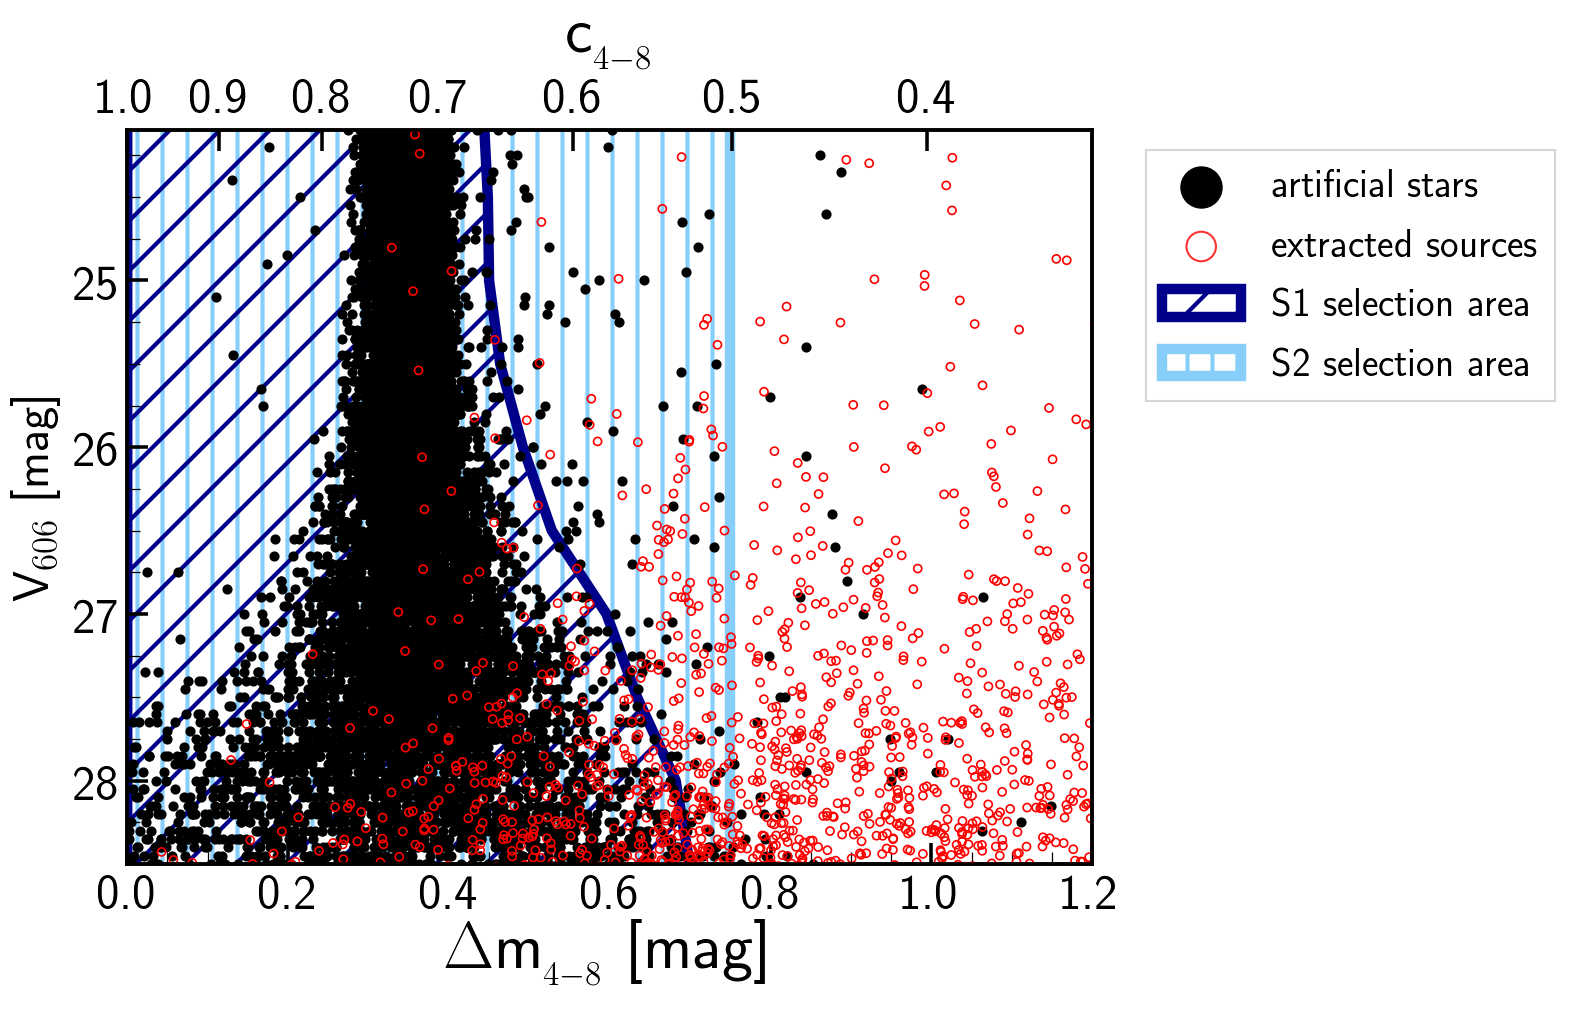
At the distance of the Coma cluster (100 Mpc), globular clusters are not resolved (Peng et al., 2011) and appear as compact as foreground stars. Therefore, to select GCs around DF44, as a first step, we measured the compactness of the detected objects and identified the compact sources. We took the difference between the two aperture magnitudes (of 4 and 8 pixels) to represents the compactness of the objects. In this paper, we denoted the magnitude difference (or compactness parameter) as m4-8. Compact objects, compare to more extended objects, display smaller values of m4-8.
To understand how the compactness parameter behaves across the field of view and for different magnitudes, we simulated more than 7500 artificial stars using TinyTim444http://www.stsci.edu/software/tinytim/ v7.0. This was done because of the lack of bright stars in the V606 frame. The artificial stars range in magnitude between 24 and 30. We simulated 128 artificial stars in 60 magnitude bins, randomly distributed on the detector. The TinyTim PSF models take into account many variables such as filter, optical and detector responses with the position on the detector and wavelength, focus, aberrations, geometric distortions and charge diffusion. Moreover, HST long exposures introduce a small displacement (jitter) and change in focus during exposures (berating). For the simulation, we started with jitter=5 mas and applied different values of de-focus between 1 and 10 m. The final value of de-focus=6 m was chosen to match the compactness of the artificial stars with the few bright stars observed in the field of view. After producing the artificial stars with TinyTim, Poisson noise was added to each mock star. We finally added them to the main frame (V606).
We explored whether our compactness values can be affected by the effect of the sub-pixel location of the PSFs and by the drizzling algorithm that is used to create the final science images. We found that the subpixel location of real PSFs has a small effect on the compactness parameter (0.01 mag). The effect of the drizzling algorithm is the following. When comparing the compactness of real sources in both drizzled and non-drizzled images, we found that the difference in compactness is compatible with zero on average. The scatter between the drizzled and non-drizzled compactness measurements is around 0.1 mag. We conclude that our compactness selection is robust in that sense.
We found that the compactness parameter m4-8 of the artificial stars varies between 0.3 and 0.4 and has an average value of 0.36. This value is consistent with the average compactness of the bright stars in the data. Next, we selected objects with compactness within 3 from the mean values of the artificial stars (for each magnitude bin) as compact sources. Fig. 4 shows m4-8 of all the observed sources and the mock stars as a function of their V606 magnitude. In this work, we have used the region enclosed by the dark blue contour as the selected area for defining our main sample of compact sources (sample S1).
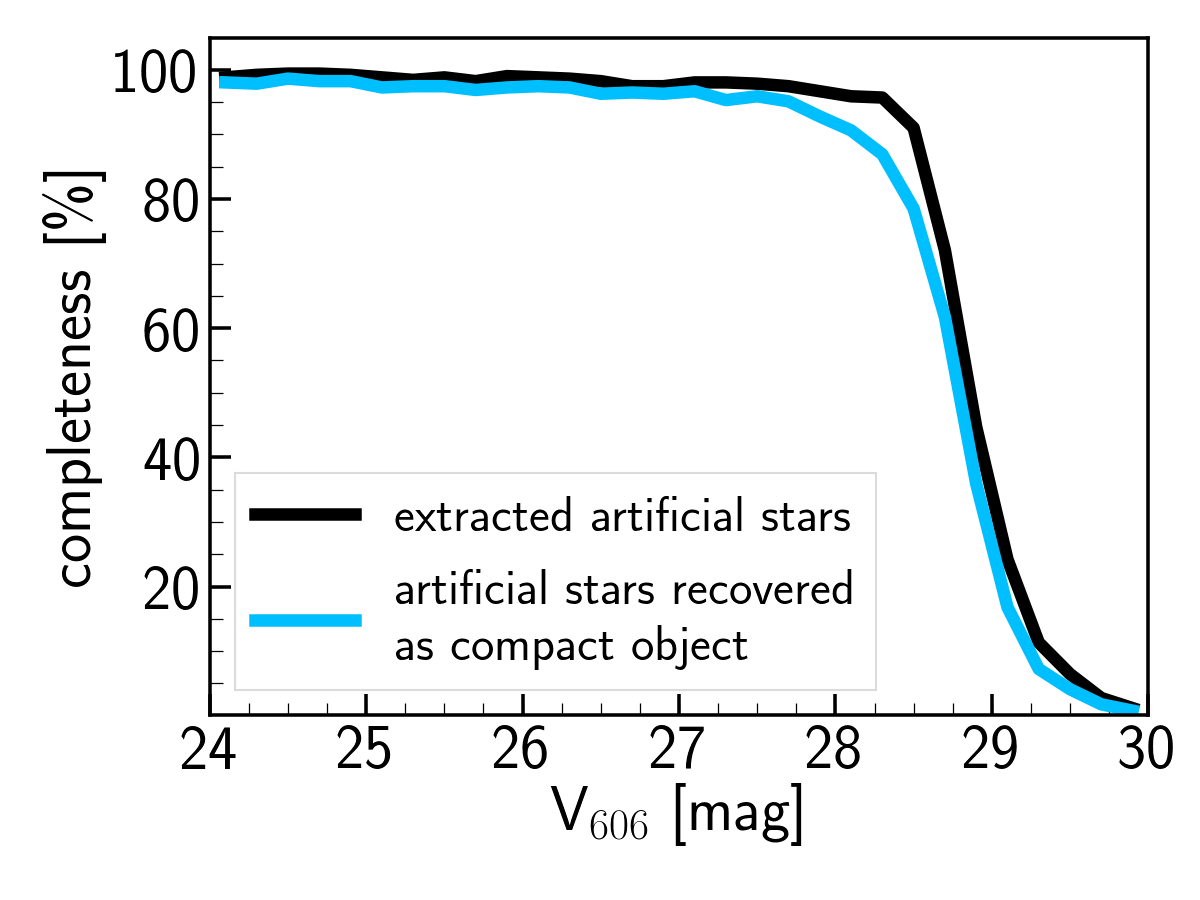
As is seen in Fig. 5, sample S1 is more than 90% complete up to magnitude V606=28.2 mag and more than 80% complete to magnitude V606=28.5 mag. As a further test to test our selection criteria, we have measured the ellipticities of the objects characterised as compact and extended. We find the average ellipticity of the brightest compact and extended sources (brighter than 26.0 mag) is 0.06 (=0.04) and 0.33 (=0.2) respectively.
To be able to compare our sample with that of vD17, we select another sample S2 following their selection criteria 0.5c4-81.0. The compactness parameter c4-8 is the flux ratio between two different apertures, 4 pixels and 8 pixels (according to vD17). The corresponding region in the V606 vs compactness map is also shown in Fig. 4. As can be seen in the figure, the S1 sample excludes a fraction of sources that are included in S2.
3.3 The distribution of globular clusters around DF44
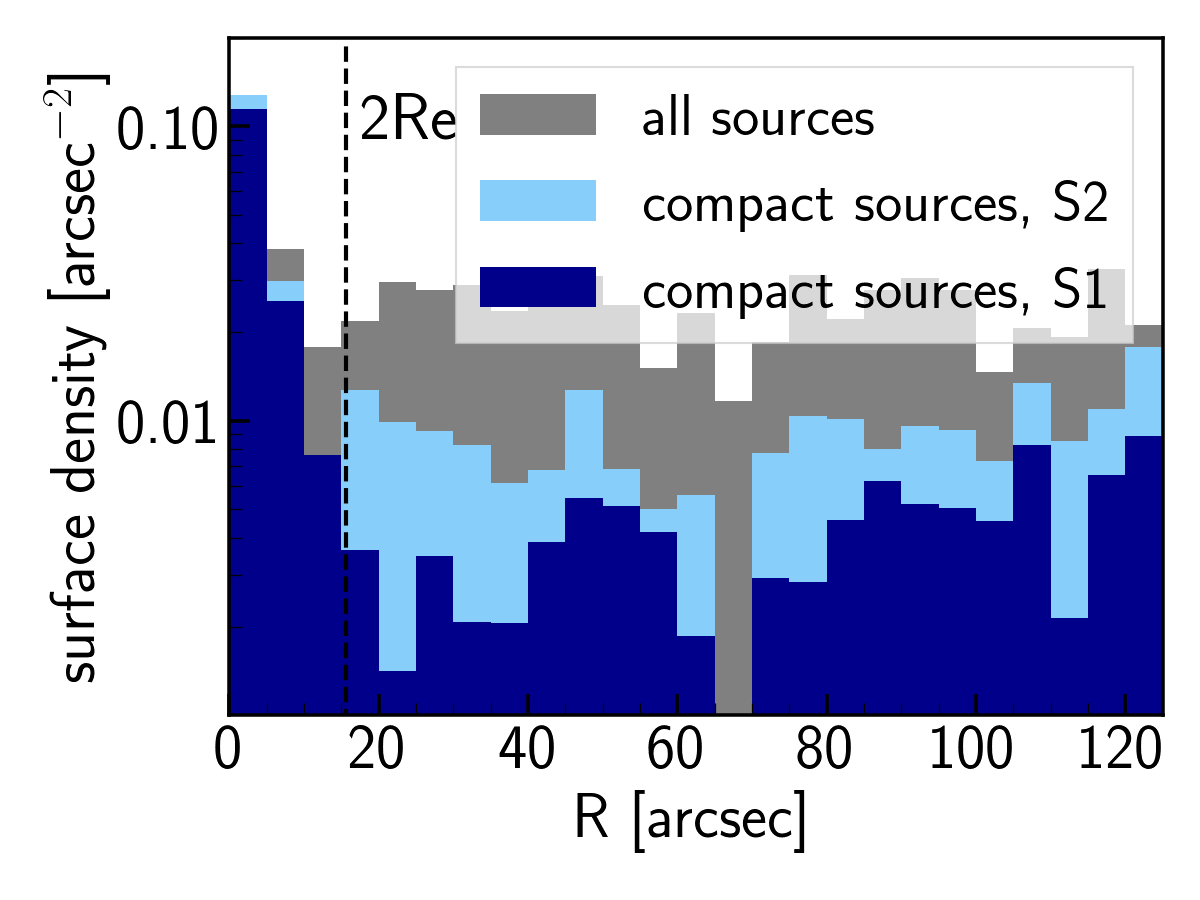
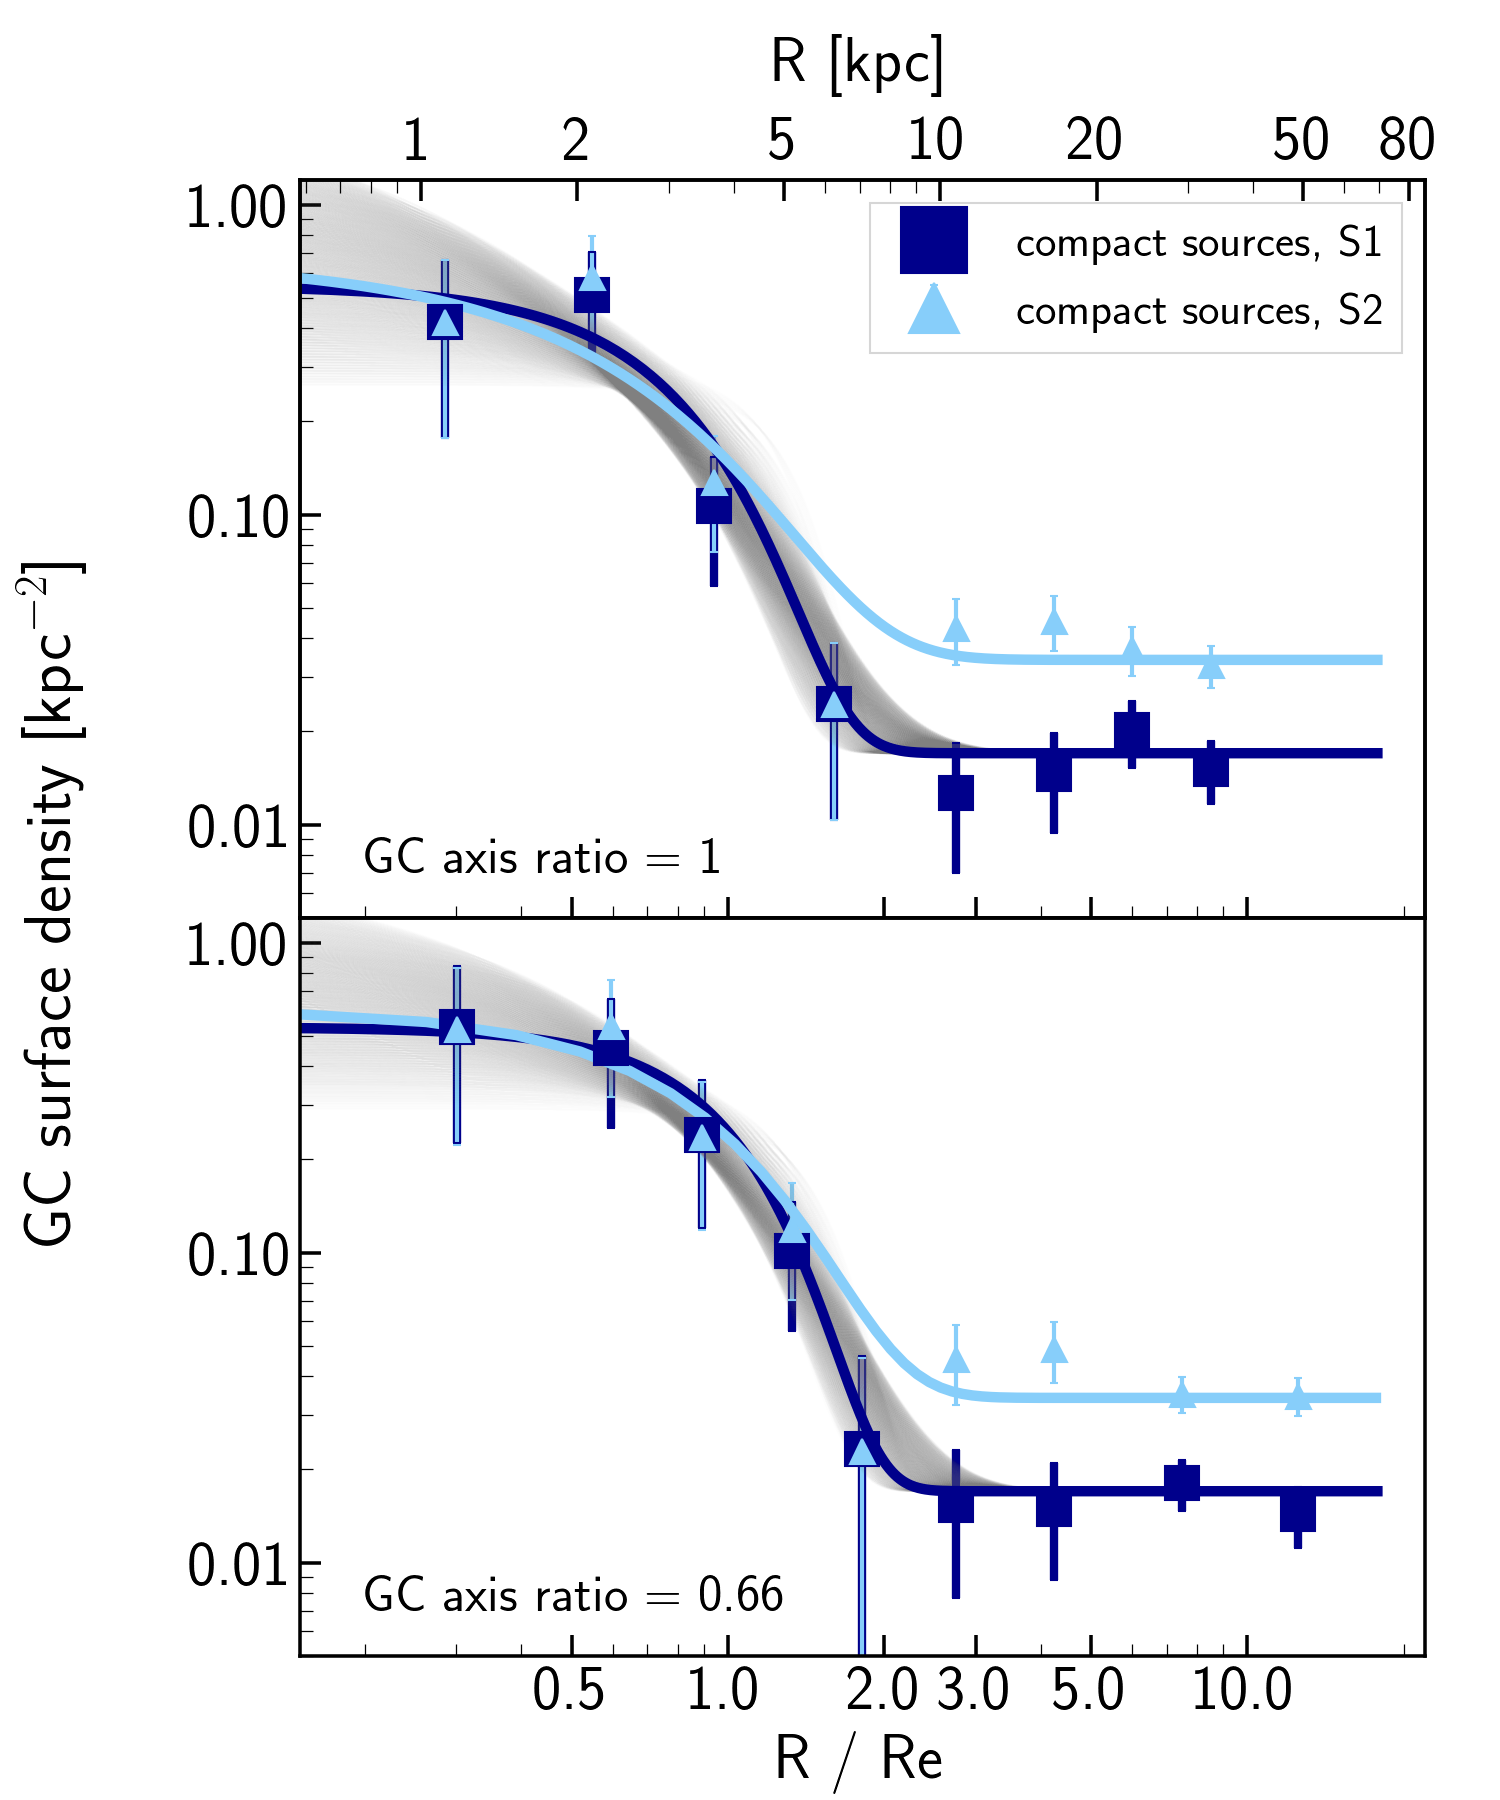
Once the selection of the compact sources of the image has been performed, we can explore how they are distributed around DF44. The surface density of the radial distribution of the compact sources is shown in Fig. 6. Here, we only show sources with V60628.0 mag. We plotted both the distributions of the compact sources selected in our main sample S1, and the equivalent sample done by vD17, S2. At a radial distance of equivalent to 2Re, both distributions detect a similar number of objects. However, due to the more relaxed selection criteria by vD17, beyond that distance the background density is much more important in S2 than in S1.
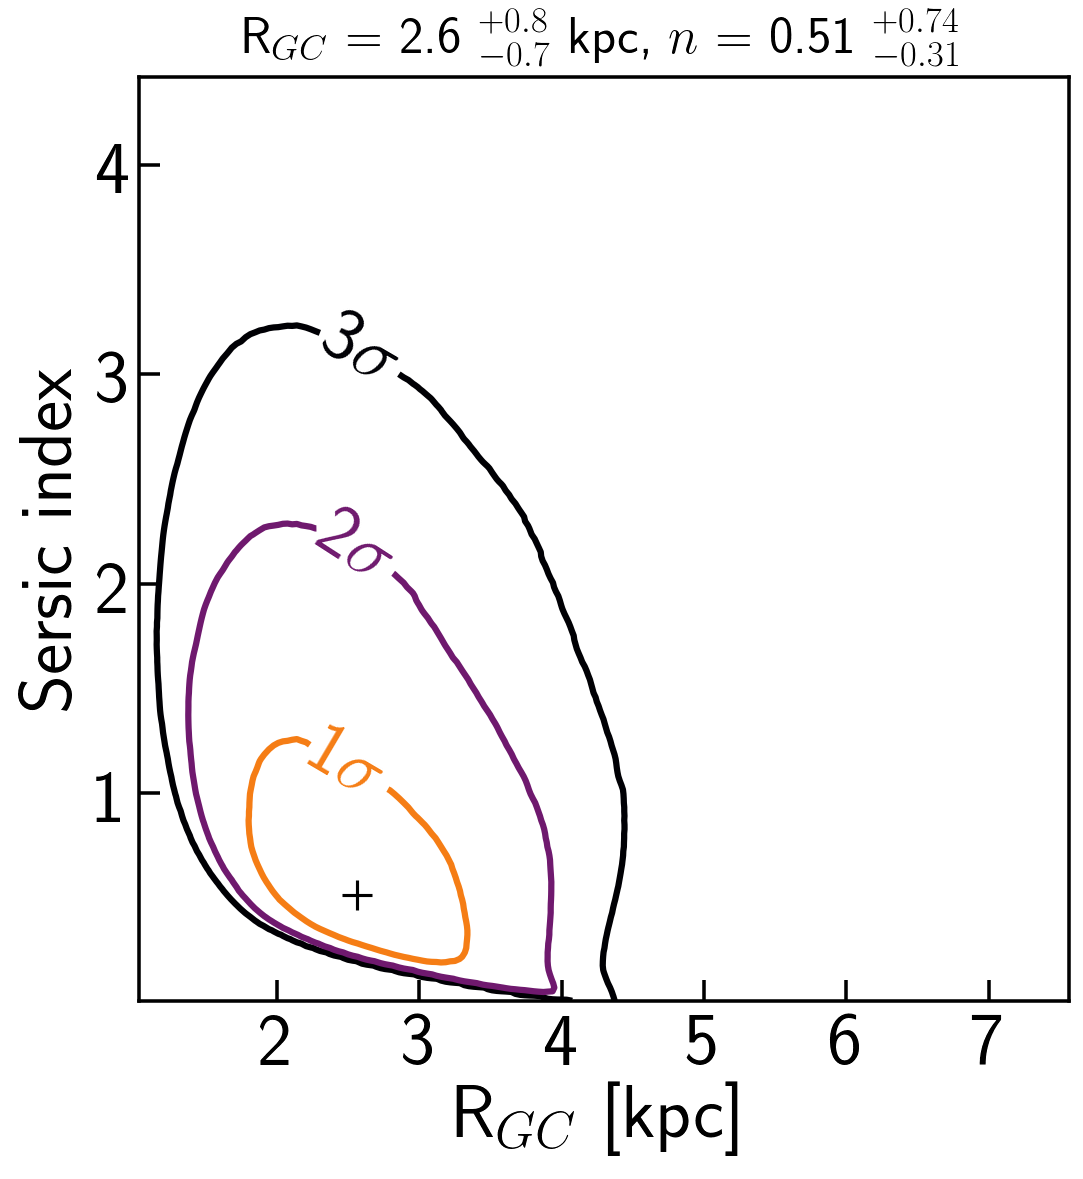
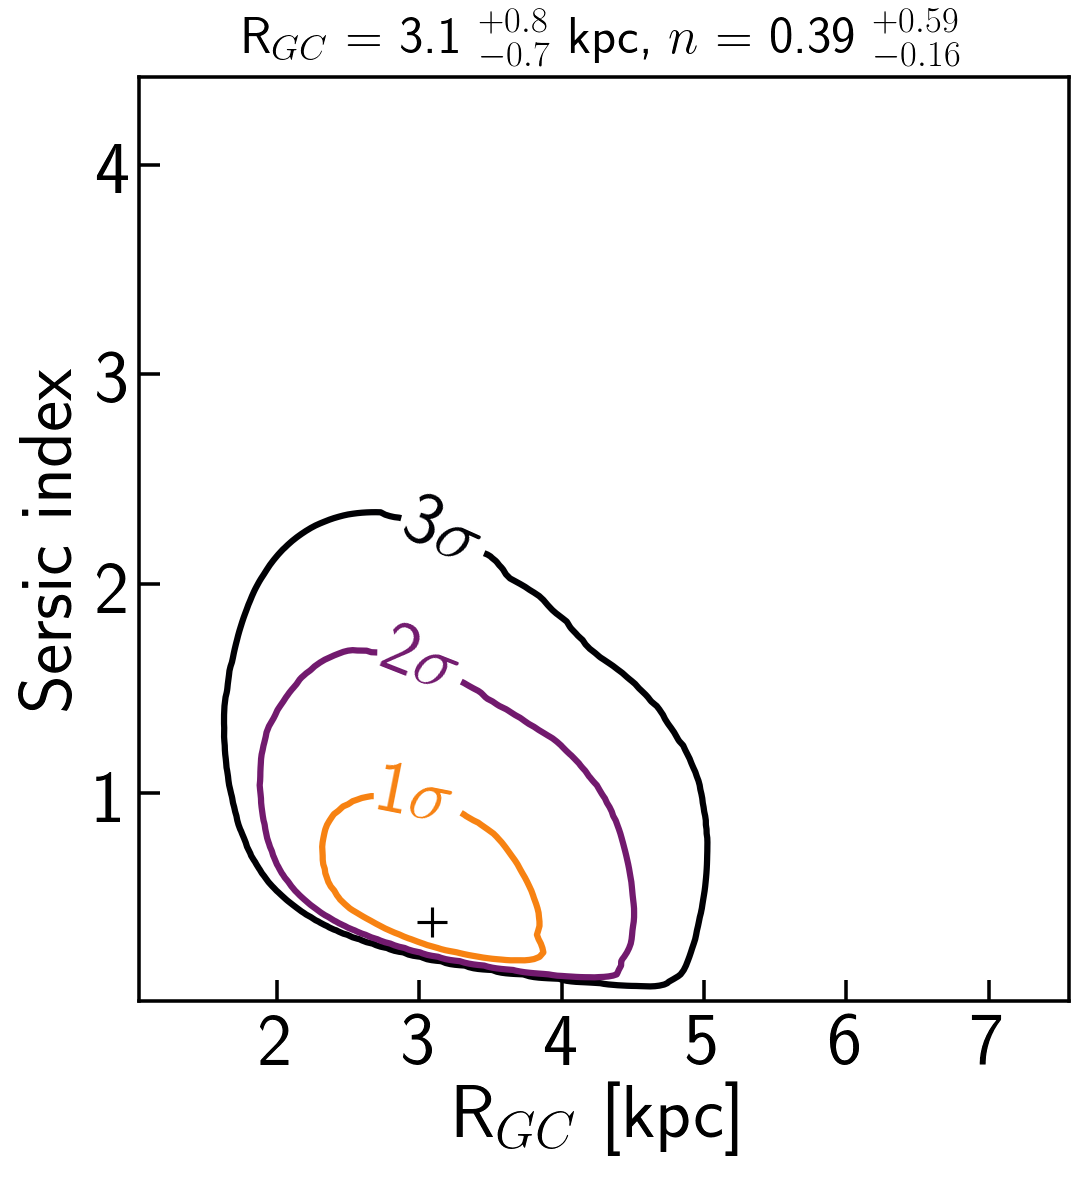
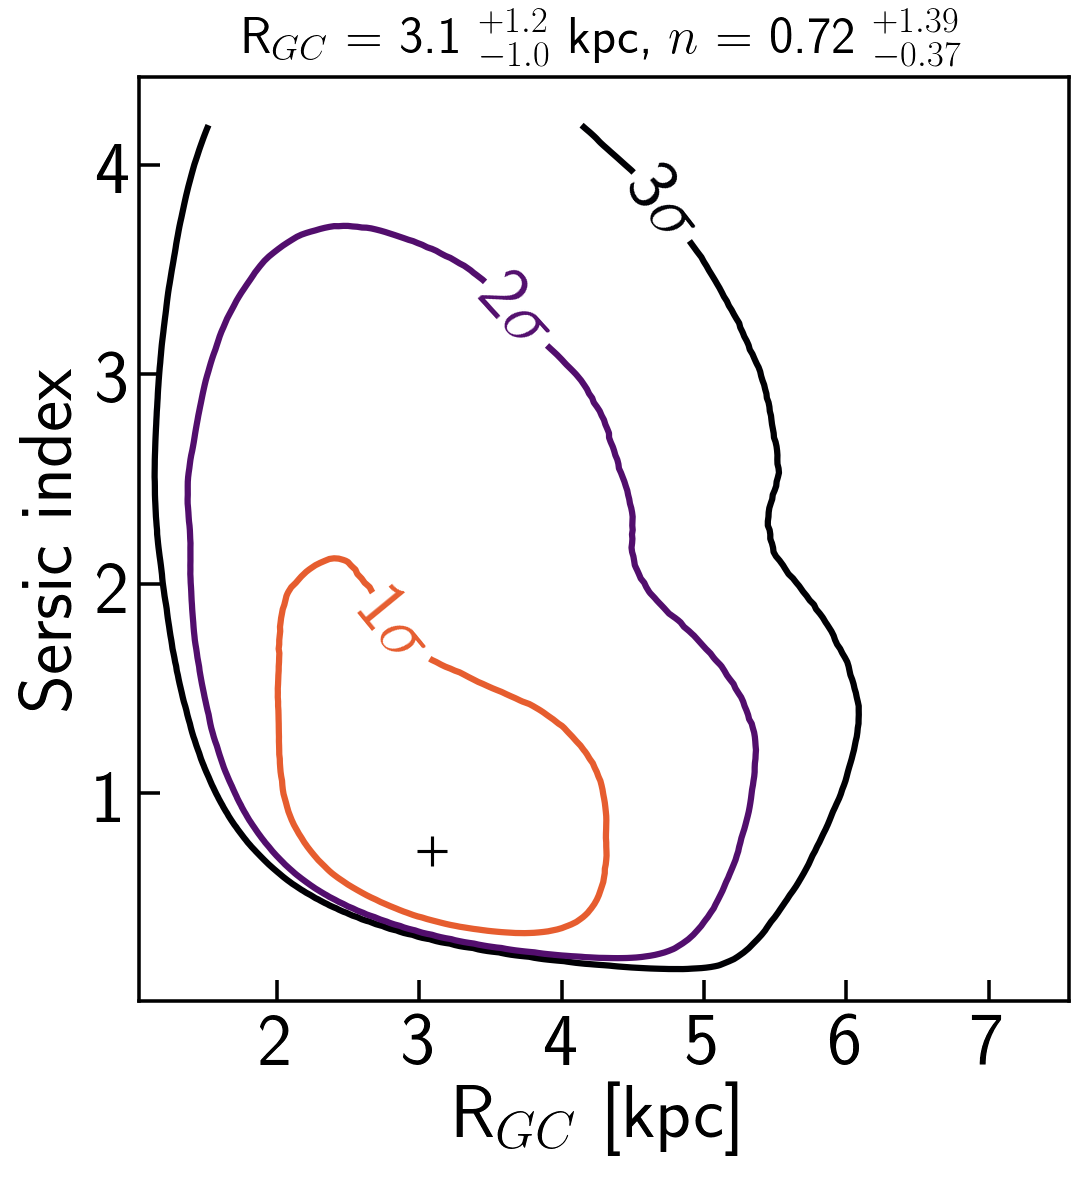
To further analyse the spatial distribution of the compact sources around DF44, we have explored the half-number radius RGC (i.e. the radius that contain half of the GC candidates around DF4) and the Sérsic index of the distributions. The low number (just a few dozens) of GC candidates suggests the need to use a likelihood estimation for these quantities. The likelihood equations for a Sérsic distribution are provided in the Appendix. Interestingly, for the RGC parameter, the maximum likelihood value can be estimated analytically following a simple prescription (see Eq. 12). We calculate the likelihood exploring a range for the parameters of 1 RGC 7 kpc and 0.05 n 4.2. We have calculated the likelihood maps for these two quantities for both sample S1 (the preferred one in this paper) and S2 (that created following vD17). In addition, we have assumed two different axis ratio distributions for the GC candidates. One assumes the GCs follow a circular distribution (i.e. q=1) while in the second we model a distribution with the same position angle and axis ratio as the underlying host galaxy (i.e. q=0.66). The contour maps are shown in Fig. 7.
| i. S1 sample, GC axis ratio = 1 | ii. S1 sample, GC axis ratio = 0.66 |
 |
 |
| iii. S2 sample, GC axis ratio = 1 | iv. S2 sample, GC axis ratio = 0.66 |
 |
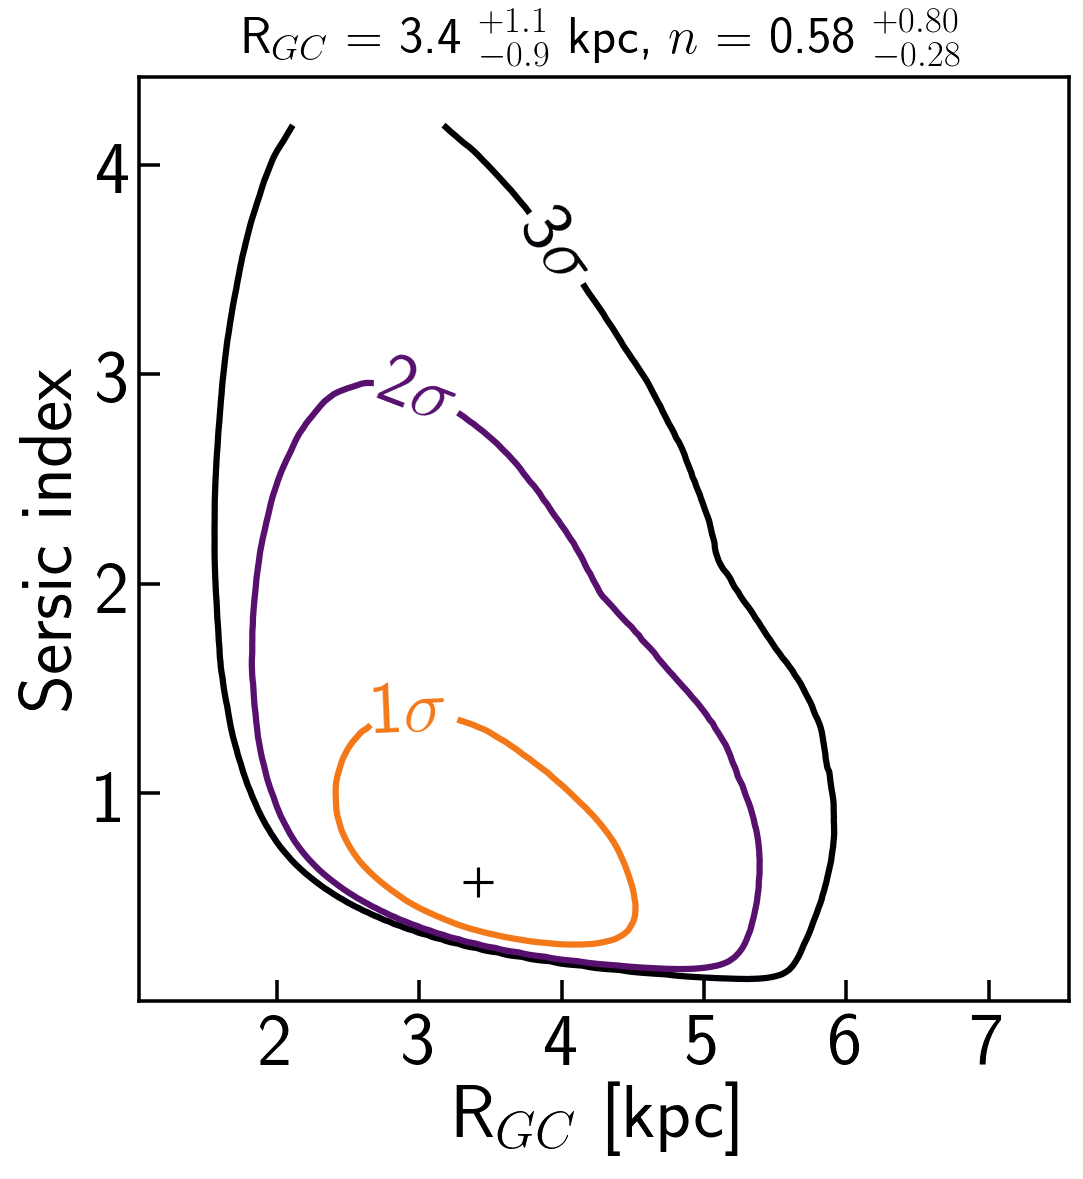 |
In order to produce the likelihood maps we first estimated the background contamination corresponding to samples S1 and S2. Backgrounds for S1 and S2 were estimated at radial distances from DF44 between 5Re to 10Re, and the values are 0.017 kpc-2 and 0.034 kpc-2 respectively. This corresponds to 5, 3, 11 and 7 contaminant objects inside a radius of 10 kpc (2.5Re) for S1 (q=1 and q=0.66) and S2 (q=1 and q=0.66) respectively. We also explore apertures from 2 to 3 Re to measure the background contamination and our results do not change. We randomly remove this quantity of compact sources inside 10 kpc when estimating the likelihood maps we provide in Fig. 7. This was done by following a Gaussian probability distribution whose peak is at the mean background values and whose sigma is given by the uncertainties in measuring the background (approximately 13% and 9% for S1 and S2). We conducted 4000 simulations.
The most likely values for RGC and n of the GC candidates distribution, together with their uncertainties, are provided in Table 2. In Fig. 8, we show the GC surface density radial distribution together with the most likely solution and the rest of the solutions with 1 uncertainty for sample S1. The parameters describing the distribution of GCs are more affected by the assumed axis ratio distribution than by the sample used (either S1 and S2). As expected, due to the lower background contamination, the parameters on sample S1 are better determined than for S2. Interestingly, the half-number value of the GC candidates555Throughout this paper, RGC refers to the RGC measured using the S1 sample and q=0.66 (same as their host galaxy) unless otherwise explicitly stated. (RGC=3.1 kpc) is compatible within the error bars to the effective radius of the light distribution of DF44 (Re=3.90.7 kpc). In other words, RGC/Re=0.8.
| Reference | (axis ratio) | sample | RGC [kpc] | |
| This work | 1.0 | S1 | ||
| 1.0 | S2 | |||
| 0.66 | S1 | |||
| 0.66 | S2 | |||
| vD17 | - | - | ||
| - | - | (fixed) |
In the left panel of Fig. 9 we plot the GC candidates of sample S1 (yellow circles) and the extra GC candidates that are contained in sample S2 (following the vD17 selection criteria). Except for a few GC candidates, the remaining objects are well within the light distribution of DF44 and follow a similar distribution. In the right panel of Fig. 9 we plot the location of the ellipse containing the half-number of GCs according to our analysis for sample S1 (yellow solid line) and DF44 half light ellipse (yellow dashed line). We also plot the ellipse containing the half-number of GCs according to vD17 (red solid line). The half-number radius RGC,vD17=1.5Re,vD17=7.05 kpc that was used by vD17 is not supported by the distribution of the GC candidates we detect. As we will show later on in the text, it is this significant difference in the estimation of RGC between vD17 and the present work which leads to a strong disagreement in the total number of GCs found by vD17 and ourselves.


3.4 Globular cluster luminosity function
With the GC candidates selected and their spatial distribution characterised, the next step is to calculate the total number of GCs (NGC) around DF44. To compute NGC we require knowledge of the GC luminosity function (GCLF) in DF44. This function can be approximated by a Gaussian distribution (Secker & Harris, 1993). The area of the distribution represents the total number of GCs. The peak of the distribution can be used as a standard candle and is only weakly dependent on host galaxy mass (e.g. Hanes, 1977; Rejkuba, 2012). This peak is located at MV=-7.5 mag (Johnson V filter and in the Vega system), which corresponds to mV = 27.5 mag at the distance of the Coma Cluster (Peng et al., 2011).
In order to transform the previous numbers from V(Vega) to V606(AB), we use the following assumptions. First, we assume that the GCs of DF44 are old (12 Gyr) and well described by simple stellar population models. From MILES models (Vazdekis et al., 2016), we get (V-I)(Vega)0.9 mag for a wide range of metallicities (-2Z-0.5). Next, we use the transformation provided by Harris (2018) to get the magnitude of the peak of the GCLF in V606(Vega):
| (1) |
Finally, we transform that value to the AB system by using the handbook of the WFC3 instrument (Gennaro, M., et al., 2018):
| (2) |
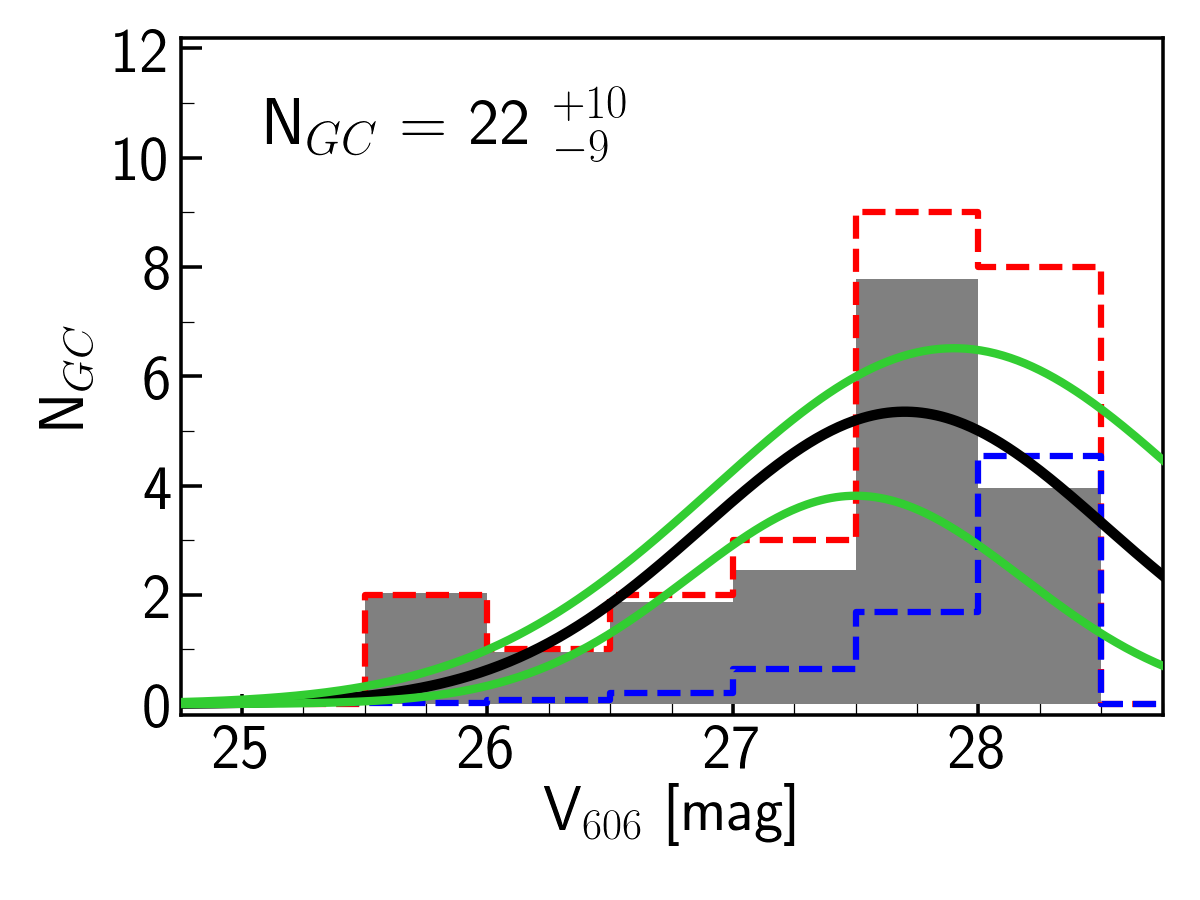
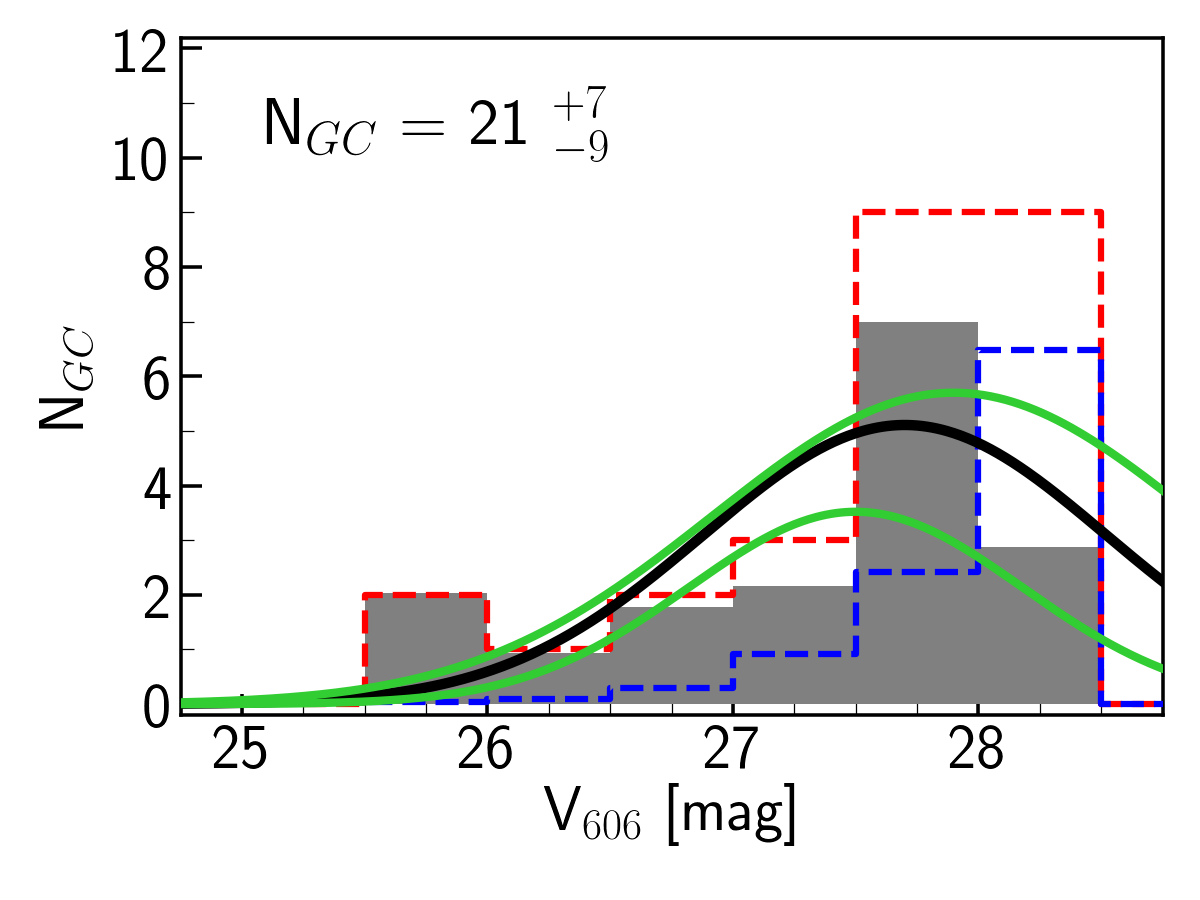
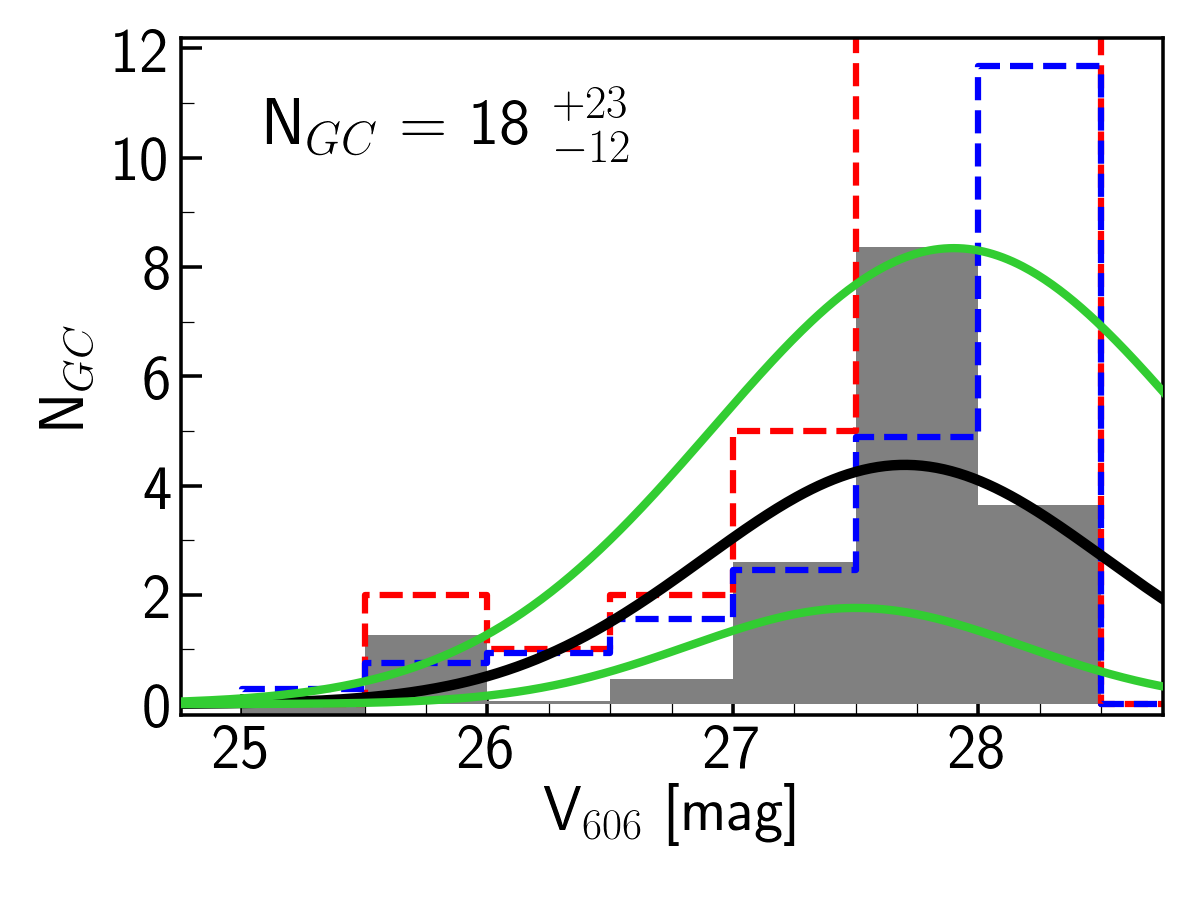
This give us a magnitude for the peak of the GCLF in the AB system of <V606>27.45 mag. In order to estimate NGC, we consider only the GC candidates inside R3RGC. We provide in Table 3 the catalogue of GC candidates for S1 and q=0.66. We use a radial distance of 3RGC as this radius encloses (for the Sérsic index value n0.7 describing the compact sources distribution around DF44) 99% of the expected objects (Trujillo et al., 2001). We plot the derived luminosity functions for different cases (S1 and S2 samples with q=1 and q=0.66) in Fig. 10. Together with the observed luminosity function (red dashed line), we show the background contribution to this function (blue dashed line). Background contamination for each luminosity function was estimated using the identified compact sources further than the radius 3RGC from DF44 in the image. This allows us to have a statistical significant correction of the background, particularly for the most luminous sources. The observed luminosity functions corrected by the background is shown in grey in Fig. 10. This corrected luminosity function has also been corrected for incompleteness down to magnitude V606=28.5 mag.
| RA | DEC | R | V606 | ell | V606-I814 | ||||
| ″ | mag | mag | mag | mag | - | mag | mag | ||
| (a) | (b) | (c) | (d) | (e) | (f) | (g) | (h) | (i) | (j) |
| 13h 00m 58.33s | +26d 58m 25.83s | 10.32 | 23.92 | 0.002 | 0.38 | 0.004 | 0.03 | 0.33 | 0.01 |
| 13h 00m 57.70s | +26d 58m 34.80s | 3.882 | 25.74 | 0.013 | 0.43 | 0.023 | 0.02 | 0.41 | 0.03 |
| 13h 00m 58.22s | +26d 58m 36.85s | 4.596 | 25.98 | 0.017 | 0.36 | 0.029 | 0.05 | 0.44 | 0.04 |
| 13h 00m 58.18s | +26d 58m 35.30s | 3.482 | 26.49 | 0.027 | 0.46 | 0.045 | 0.07 | 0.39 | 0.08 |
| 13h 00m 57.72s | +26d 58m 33.23s | 3.787 | 26.71 | 0.033 | 0.42 | 0.056 | 0.03 | 0.41 | 0.08 |
| 13h 00m 57.59s | +26d 58m 31.58s | 6.165 | 26.95 | 0.042 | 0.54 | 0.066 | 0.09 | 0.19 | 0.13 |
| 13h 00m 57.62s | +26d 58m 35.70s | 5.232 | 27.27 | 0.056 | 0.52 | 0.089 | 0.18 | 0.21 | 0.17 |
| 13h 00m 57.72s | +26d 58m 41.95s | 8.249 | 27.39 | 0.063 | 0.48 | 0.102 | 0.15 | 0.47 | 0.17 |
| 13h 00m 58.40s | +26d 58m 30.18s | 7.932 | 27.47 | 0.067 | 0.45 | 0.111 | 0.29 | 0.21 | 0.21 |
| 13h 00m 57.98s | +26d 58m 33.36s | 1.202 | 27.55 | 0.073 | 0.47 | 0.119 | 0.14 | 0.55 | 0.17 |
| 13h 00m 57.69s | +26d 58m 38.17s | 5.369 | 27.57 | 0.074 | 0.46 | 0.122 | 0.04 | 0.81 | 0.15 |
| 13h 00m 58.18s | +26d 58m 36.07s | 3.659 | 27.58 | 0.074 | 0.14 | 0.149 | 0.34 | — | — |
| 13h 00m 58.22s | +26d 58m 45.75s | 11.91 | 27.67 | 0.080 | 0.48 | 0.131 | 0.34 | — | — |
| 13h 00m 58.05s | +26d 58m 31.70s | 3.152 | 27.82 | 0.093 | 0.58 | 0.143 | 0.11 | — | — |
| 13h 00m 57.95s | +26d 58m 38.69s | 4.190 | 27.85 | 0.096 | 0.37 | 0.166 | 0.09 | — | — |
| 13h 00m 57.94s | +26d 58m 29.01s | 5.483 | 27.89 | 0.099 | 0.47 | 0.163 | 0.31 | 0.59 | 0.23 |
| 13h 00m 58.45s | +26d 58m 26.84s | 10.64 | 27.89 | 0.099 | 0.57 | 0.154 | 0.40 | — | — |
| 13h 00m 58.99s | +26d 58m 40.10s | 16.50 | 27.94 | 0.104 | 0.58 | 0.161 | 0.04 | — | — |
| 13h 00m 58.00s | +26d 58m 35.82s | 1.452 | 27.95 | 0.104 | 0.56 | 0.163 | 0.25 | — | — |
| 13h 00m 57.95s | +26d 58m 46.26s | 11.76 | 28.00 | 0.110 | 0.56 | 0.171 | 0.07 | — | — |
| 13h 00m 57.73s | +26d 58m 27.15s | 8.092 | 28.14 | 0.124 | 0.21 | 0.240 | 0.30 | — | — |
| 13h 00m 58.17s | +26d 58m 24.90s | 10.11 | 28.14 | 0.125 | 0.66 | 0.184 | 0.16 | — | — |
| 13h 00m 58.20s | +26d 58m 26.91s | 8.453 | 28.16 | 0.127 | 0.53 | 0.201 | 0.22 | — | — |
| 13h 00m 58.37s | +26d 58m 19.74s | 16.04 | 28.20 | 0.133 | 0.66 | 0.196 | 0.21 | — | — |
| 13h 00m 58.14s | +26d 58m 37.86s | 4.337 | 28.27 | 0.142 | 0.15 | 0.284 | 0.19 | — | — |
| 13h 00m 58.90s | +26d 58m 35.30s | 14.15 | 28.30 | 0.145 | 0.31 | 0.260 | 0.15 | — | — |
| 13h 00m 57.60s | +26d 58m 39.04s | 6.948 | 28.39 | 0.157 | 0.26 | 0.292 | 0.26 | — | — |
| 13h 00m 58.16s | +26d 58m 34.82s | 3.159 | 28.42 | 0.161 | 0.64 | 0.241 | 0.36 | — | — |
| i. S1 sample, GC axis ratio = 1 | ii. S1 sample, GC axis ratio = 0.66 |
 |
 |
| iii. S2 sample, GC axis ratio = 1 | iv. S2 sample, GC axis ratio = 0.66 |
 |
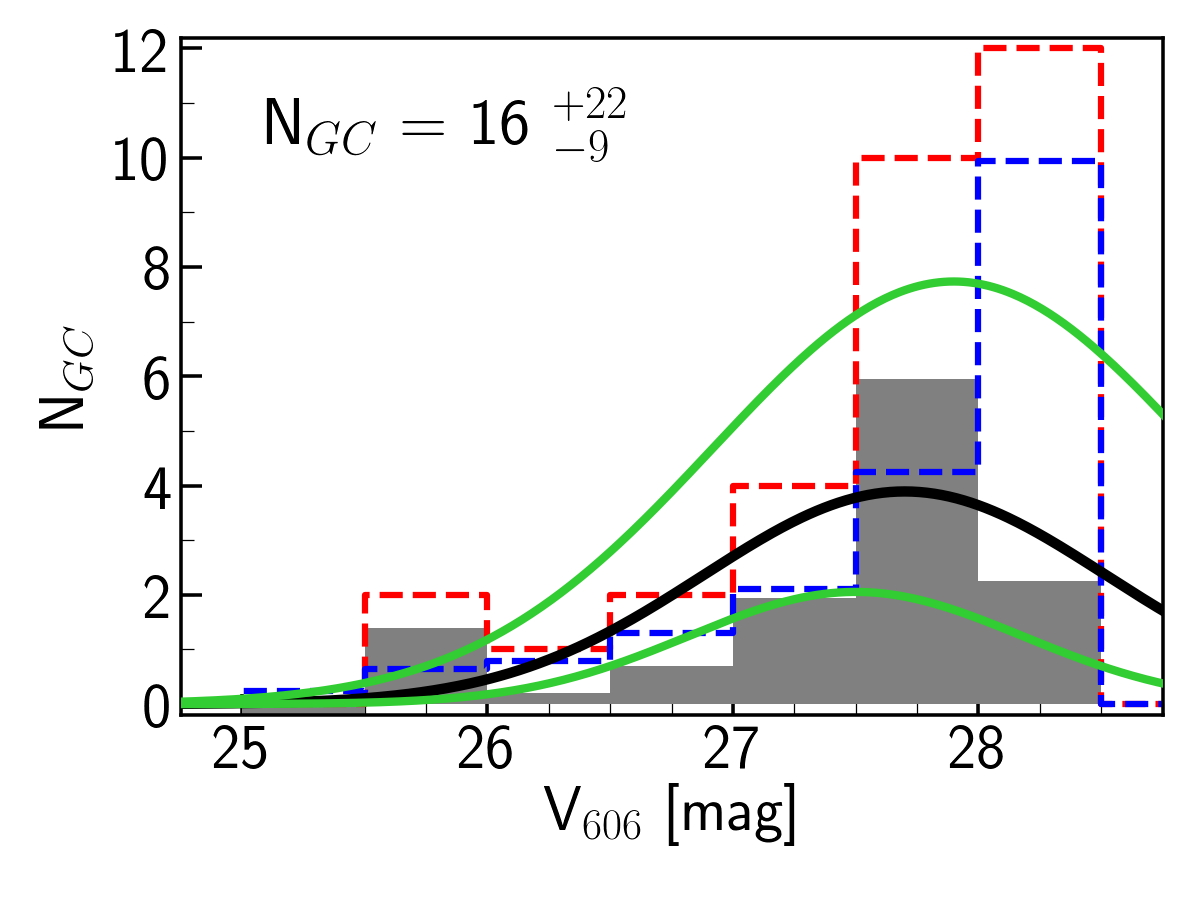 |
Once we have the GCLF corrected for background and incompleteness, we count all the GCs up to the location of the peak <V606>. This number is then multiplied by 2 to get the total number of GCs (NGC). For the location of the peak and the width of the GC distribution (), we use the numbers given by vD17 (i.e. <V606>=27.7 mag and =0.82). The total number of GCs is then all compact sources (background and incompleteness corrected) within R3RGC which are within the V606 magnitude range V606-3V606 <V606> multiplied by 2. To estimate the uncertainties on NGC we take into account the uncertainties on the number of observed compact sources within 3RGC and in the background, the uncertainty in RGC we have estimated above and also the uncertainties in <V606> and of the GCLF.
In Fig. 10 we show the Gaussian distributions corresponding to the number of GCs derived for each sample (black solid line) together with the Gaussian distributions compatible with the minimum and maximum number of GCs (within 1) compatible with the data (green lines). For all our samples and spatial configurations the total number of GCs is very modest. In particular, for our preferred sample S1 and spatial configuration q=0.66, NGC=21. This number is in stark contrast with the value reported by vD17: 7418. We will expand on this discrepancy in section 4.3.
3.5 The average colour of the population of GCs around DF44
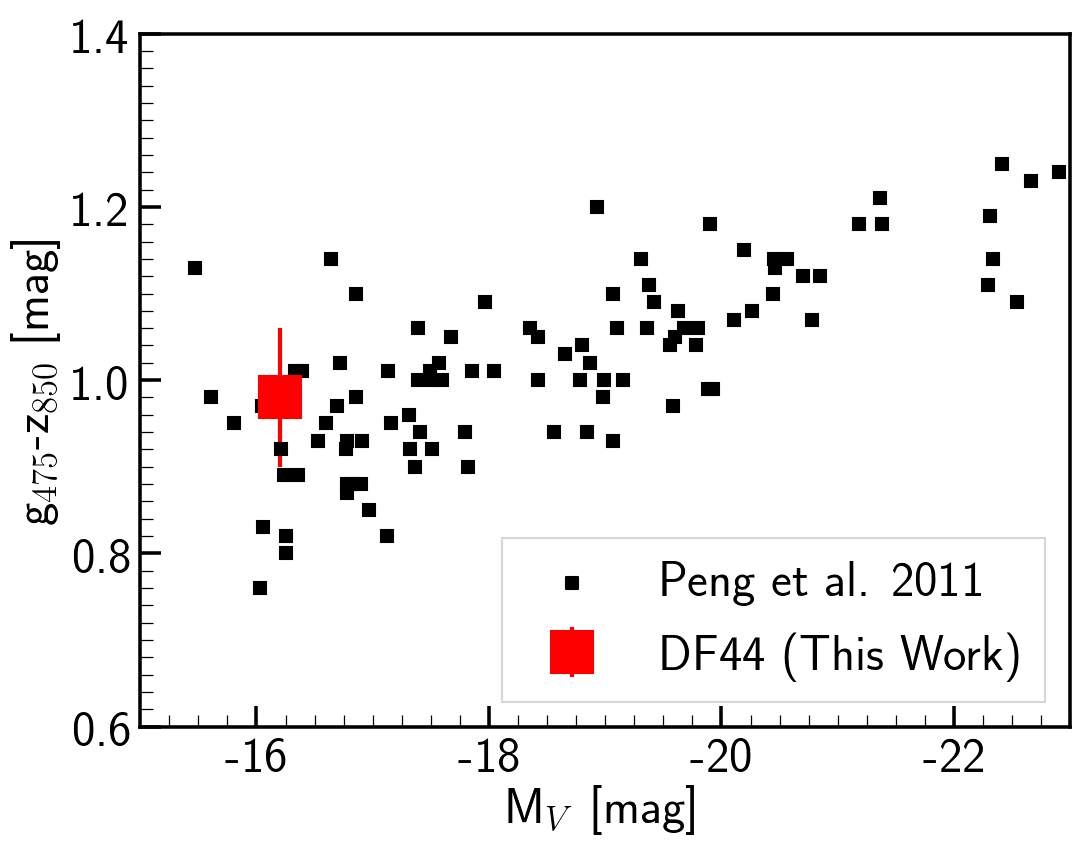
Another interesting exercise we can conduct on the GC population around DF44 is to estimate its average colour and compare it with other GC samples. Fig. 11 shows the average colour g475-z850 of the GC population of DF44 compared to other Coma Cluster galaxies (Peng et al., 2011). There is a clear trend between the average colour of the GCs and the total luminosity of their host galaxies.
To estimate the average colour g475-z850 of the GCs of DF44, we start using the observed colour V606-I814 = 0.400.04 mag. This value is obtained using the brightest (i.e. least affected by the background) GC candidates. We only used GCs with V60627.0 mag. This colour is also consistent with that given in vD17. The observed colour V606-I814 was transformed to g475-z850 using the following transformations: (i) g475-I814=V606-I8141.852+0.096 (Blakeslee et al., 2010) and (ii) g475-z850=g475-I8141.023+0.128 (Beasley & Trujillo, 2016). Consequently, we end up having an average colour g475-z814=0.980.08 for the GCs around DF44. This colour corresponds to a metallicity of [M/H]-0.9, using the photometric predictions of the MILES stellar population models (Vazdekis et al., 2016), for an old (12 Gyr) SSP. Fig. 11 shows that the average colour of the DF44 GCs are in perfect agreement with other galaxies in the Coma Cluster of similar luminosity.
4 Discussion
4.1 The halo mass of DF44 based on the GC population
We can use the total number of GCs to estimate the halo mass of DF44, considering that the total stellar mass contained in the GCs in a galaxy scales linearly with galaxy halo mass (see e.g. Harris et al., 2017). This observation has been shown to be particularly useful for inferring the halo masses of UDGs (Beasley et al., 2016). According to Harris et al. (2017), the relation between both masses is linked through the following equation: MGCs/Mhalo=3.910-5. With the total number of GCs (NGC=21) derived here, we have used the following approximation. We assume a GC mean mass =2105 M⊙ (Jordán et al., 2007), which is multiplied by NGC to get MGCs. This gives a total halo mass of Mhalo=1.11011M⊙.
This estimation for the mass of the halo of DF44 is in agreement (within the error bars) with that derived from the velocity dispersion of the stars of the galaxy (see Table 4), and removes the tension between the kinematic mass and the mass derived from the large number of DF44 GCs identified by vD17. Recently, a dwarf-like dark matter halo ( 1011M⊙) has been confirmed by Bogdan (2020).
| Ref | NGC | SN | Mhalo | Mass proxy | |
|---|---|---|---|---|---|
| (km s-1) | (M⊙) | ||||
| vD16 | 94 | 31.1 | 47 | 1.01012 | kinematics |
| vD17 | 74 | 24.5 | - | 5.01011 | GC number count |
| vD19 | - | - | 33 | 1.6 1011 | kinematics |
| This work | 21 | 7.0 | - | 1.11011 | GC number count |
4.2 DF44 GCs in comparison with other GC systems
As we reported in Sect. 3.5, the average colour of the GC population of DF44 is in excellent agreement with the expected colour for galaxies with similar luminosities. Another aspect to address is whether both the number of GCs and their specific frequencies fit well with other galaxies with similar characteristics. In Fig. 12 we explore this. We have used the compilation by Harris et al. (2013) which gives the number of GCs and their specific frequency against the luminosity of the galaxies in the V-band along with their central velocity dispersions. As stated before, we use for the total luminosity of DF44 (MV=-16.2 mag) and its velocity dispersion (=33 km s-1), the values reported by vD17 and vD19 respectively. Using these values, and with the number of GCs measured in this work, DF44 is within the observed the relations found for other galaxies.

Another property we can compare with other galaxies is the ratio between the half-number radius of GCs for DF44 compared to the effective radius Re of the host galaxy. We find that RGC/Re=0.8. This ratio is compared with other galaxies in Fig. 13 using the sample given in Forbes (2017). Unfortunately, this kind of work has not been conducted for galaxies with similar stellar masses to DF44 (with exception of DF17; Peng & Lim, 2016). Both UDGs share the property that RGC/Re2, something which is only observed for some nearby relatively massive galaxies, including our own Milky Way. It remains as an interesting exercise to fill the gap between the massive galaxies and the dwarf population in terms of the ratio between both radii to explore whether UDGs have an anomalously low spatial extension for their GCs or not.

4.3 Different estimates for the radial distribution of GCs lead to much smaller NGC than in vD17
The main result of this paper is that the number of GCs around DF44, NGC=21, is compatible with the number of GCs expected for galaxies with the luminosity and velocity dispersion of DF44 (see previous section). This results is in disagreement with the high value of GCs found by vD17 (NGC=74). What is the origin of this discrepancy?
We have explored whether the selection of GC candidates around DF44 based on different compactness criteria can explain the different values of NGC obtained by us and vD17. To do this, we estimated NGC using our sample S2 which uses the same selection criteria as vD17. We get NGC=18 (assuming a projected circular distribution for the GCs; q=1) and NGC=16 (assuming the GCs have the same axial distribution as DF44 itself; q=0.66). As expected, the larger background contamination in sample S2 increases the uncertainty in measuring NGC compared to sample S1. However, even considering the uncertainties, the maximum number of globular clusters is not larger than 40. This is around a factor of 2 smaller than the value reported by vD17.
vD17 indicate in their paper that their total number of GCs in DF44 is four times the number of observed GCs (contamination-corrected) within R1.5Re,vD17 and V60627.6 mag (i.e. NGC,obs=18.5). It is interesting to note that this number is already larger (around a factor of 2) than the values we find for the number of observed GCs to a similar radial distance and magnitude than vD17 (see e.g. our grey histograms in Fig. 10). This discrepancy is potentially significantly affected by the different background contamination corrections both works have applied. Unfortunately, we can not perform a direct comparison between our GC detections and vD17 since these data are not provided in vD17.
The rational for why vD17 multiplied by a factor of 4 their NGC,obs is as follows. First, vD17 multiply by 2 in order to correct for the number of GCs missed after the peak of the GCLF. We have also done this correction to our NGC values reported above. However, since our NGC,obs is a factor of 2 less than vD17, the discrepancy remains. Second, vD17 multiply again by another factor of 2 to account for GCs which are beyond their spatial selection criterion of R=1.5Re,vD17 (where Re,vD17=4.7 kpc according to vD17). This spatial selection criterion, R=1.5Re, corresponds to their RGC assuming GCs follow an exponential declining distribution from the center of the distribution. RGC for vD17 is 7 kpc. It is in this last correction where both works disagree fundamentally. While vD17 assumes an exponential distribution (as they do not measure the actual distribution of their GCs) we have measured this quantity. We find the GCs follow a Sérsic distribution with a Sérsic index (n0.5) significantly lower than an exponential. In addition, we have also measured RGC directly (without assuming an exponential distribution), finding a value of 2.5-3.5 kpc. In practical terms this means that there is not a significant number of GCs beyond 7 kpc.
To summarize, according to our measurements there is no need for multiply by another factor of 2 to correct for missing GCs at large radii. Our estimation of the total number of GCs is around a factor of 4 smaller than vD17. Half of the difference is easily explained by the correction that vD17 made for the spatial distribution of GCs that here we find is not necessary. The other half is due to a different background correction of their sample.
5 Conclusion
The existence of UDGs with relatively large numbers of GCs, when compared to the expectations based on their luminosity or dynamical mass, has remained a puzzle. The general properties of UDGs are consistent with them being the low surface brightness counterparts of regular dwarf galaxies. However, the existence of GC-rich UDGs has been an argument to support the idea that at least some of these galaxies could be intrinsically different from dwarfs. In this paper, we have explored this issue in detail by revisiting one of the most iconic UDGs, DF44 in the Coma cluster. DF44 has been claimed to have a dark matter halo similar in mass to that of the Milky Way, and could, therefore be a potential candidate "failed Milky Way" (vD16). More generally, such a massive halo would make DF44 an extreme outlier in stellar mass – halo mass relations (Beasley et al., 2016).
Through a detailed analysis of the GC candidates around this object, we have found a total number of GCs of only NGC=21, which is a factor of 4 lower than previous measurements (vD17). We believe that the vD17 assumption of a large RGC, based on the results in the literature for non-UDG galaxies, has led the authors to over-estimate NGC. The significant reduction in the number of GCs found in our work is in good agreement with the expectation for objects with similar central velocity dispersions (=33 km s-1; vD19). A smaller NGC resolves the strong tension with respect to previous claims about the amount of dark matter in the halos of these objects based either in their number of GCs or in their dynamical mass. In addition, we have found that the colour and specific frequency of DF44’s GCs is in agreement with galaxies of similar luminosities. Based on this analysis, we conclude that DF44 is compatible with being a "regular" low surface brightness dwarf galaxy and the need for a new class of galaxies to account for this type of object is not yet required.
Acknowledgements
We thank the referee for their detailed reading of our manuscript and for a number of excellent suggestions to improve the quality of the analysis. T.S., I.T., R.F.P and J.H.K. acknowledge financial support from the European Union’s Horizon 2020 research and innovation programme under Marie Skłodowska-Curie grant agreement No 721463 to the SUNDIAL ITN network.
M.A.B., I.T. and J.H.K. acknowledge support from the State Research Agency (AEI) of the Ministry of Science and Innovation and the European Regional Development Fund (FEDER) under the grant with reference PID2019-105602GB-I00 and AYA2016-77237-C3-1-P, from IAC projects P/300624 and P/300724, financed by the Ministry of Science and Innovation, through the State Budget and by the Canary Islands Department of Economy, Knowledge and Employment, through the Regional Budget of the Autonomous Community, and from the Fundación BBVA under its 2017 programme of assistance to scientific research groups, for the project "Using machine-learning techniques to drag galaxies from the noise in deep imaging". M.A.B. acknowledges support from the Severo Ochoa Excellence scheme (SEV-2015-0548).
Data Availability
The data underlying this article were retrieved from the Hubble Space Telescope archive (HST Proposal 14643, PI: van Dokkum) and it provides the reduced/drizzled frames by the standard HST pipeline. The softwares and packages that are used in this work, SExtractor, SWarp, TinyTim are publicly available. The catalogue of the Globular Cluster candidates around DF44 generated in this research is available in the article and in its online supplementary material.
References
- Amorisco & Loeb (2016) Amorisco N. C., Loeb A., 2016, MNRAS, 459, L51
- Amorisco et al. (2018) Amorisco N. C., Monachesi A., Agnello A., White S. D. M., 2018, MNRAS, 475, 4235
- Beasley & Trujillo (2016) Beasley M. A., Trujillo I., 2016, ApJ, 830, 23
- Beasley et al. (2016) Beasley M. A., Romanowsky A. J., Pota V., Navarro I. M., Martinez Delgado D., Neyer F., Deich A. L., 2016, ApJ, 819, L20
- Bertin & Arnouts (1996) Bertin E., Arnouts S., 1996, A&AS, 117, 393
- Bertin et al. (2002) Bertin E., Mellier Y., Radovich M., Missonnier G., Didelon P., Morin B., 2002, The TERAPIX Pipeline. p. 228
- Binggeli (1994) Binggeli B., 1994, in European Southern Observatory Conference and Workshop Proceedings. p. 13
- Binggeli et al. (1985) Binggeli B., Sandage A., Tammann G. A., 1985, AJ, 90, 1681
- Blakeslee et al. (2010) Blakeslee J. P., et al., 2010, ApJ, 724, 657
- Bogdan (2020) Bogdan A., 2020, arXiv e-prints, p. arXiv:2009.07846
- Chamba et al. (2020) Chamba N., Trujillo I., Knapen J. H., 2020, A&A, 633, L3
- Collins et al. (2013) Collins M. L. M., et al., 2013, ApJ, 768, 172
- Dalcanton et al. (1997) Dalcanton J. J., Spergel D. N., Gunn J. E., Schmidt M., Schneider D. P., 1997, AJ, 114, 635
- Di Cintio et al. (2017) Di Cintio A., Brook C. B., Dutton A. A., Macciò A. V., Obreja A., Dekel A., 2017, MNRAS, 466, L1
- Emsellem et al. (2019) Emsellem E., et al., 2019, A&A, 625, A76
- Erwin (2015) Erwin P., 2015, ApJ, 799, 226
- Fensch et al. (2019) Fensch J., et al., 2019, A&A, 625, A77
- Forbes (2017) Forbes D. A., 2017, MNRAS, 472, L104
- Forbes et al. (2019) Forbes D. A., Gannon J., Couch W. J., Iodice E., Spavone M., Cantiello M., Napolitano N., Schipani P., 2019, A&A, 626, A66
- Gennaro, M., et al. (2018) Gennaro, M., et al. 2018, WFC3 Data Handbook, Version 4.0, (Baltimore: STScI)
- Hanes (1977) Hanes D. A., 1977, MNRAS, 180, 309
- Harris (2018) Harris W. E., 2018, AJ, 156, 296
- Harris et al. (2013) Harris W. E., Harris G. L. H., Alessi M., 2013, ApJ, 772, 82
- Harris et al. (2017) Harris W. E., Blakeslee J. P., Harris G. L. H., 2017, ApJ, 836, 67
- Hudson et al. (2014) Hudson M. J., Harris G. L., Harris W. E., 2014, ApJ, 787, L5
- Impey & Bothun (1997) Impey C., Bothun G., 1997, ARA&A, 35, 267
- Jordán et al. (2007) Jordán A., et al., 2007, ApJS, 171, 101
- Lim et al. (2018) Lim S., Peng E. W., Côté P., Sales L. V., den Brok M., Blakeslee J. P., Guhathakurta P., 2018, ApJ, 862, 82
- Mancera Piña et al. (2019) Mancera Piña P. E., Aguerri J. A. L., Peletier R. F., Venhola A., Trager S., Choque Challapa N., 2019, MNRAS, 485, 1036
- Mancera Piña et al. (2020) Mancera Piña P. E., et al., 2020, arXiv e-prints, p. arXiv:2004.14392
- Müller et al. (2020) Müller O., et al., 2020, arXiv e-prints, p. arXiv:2006.04606
- Peng & Lim (2016) Peng E. W., Lim S., 2016, ApJ, 822, L31
- Peng et al. (2011) Peng E. W., et al., 2011, ApJ, 730, 23
- Prole et al. (2019) Prole D. J., et al., 2019, MNRAS, 484, 4865
- Rejkuba (2012) Rejkuba M., 2012, Ap&SS, 341, 195
- Román & Trujillo (2017) Román J., Trujillo I., 2017, MNRAS, 468, 4039
- Rong et al. (2019) Rong Y., et al., 2019, arXiv e-prints, p. arXiv:1907.10079
- Ruiz-Lara et al. (2018) Ruiz-Lara T., et al., 2018, MNRAS, 478, 2034
- Sandage & Binggeli (1984) Sandage A., Binggeli B., 1984, AJ, 89, 919
- Secker & Harris (1993) Secker J., Harris W. E., 1993, AJ, 105, 1358
- Spitler & Forbes (2009) Spitler L. R., Forbes D. A., 2009, MNRAS, 392, L1
- Trujillo et al. (2001) Trujillo I., Graham A. W., Caon N., 2001, MNRAS, 326, 869
- Trujillo et al. (2019) Trujillo I., et al., 2019, MNRAS, 486, 1192
- Trujillo et al. (2020) Trujillo I., Chamba N., Knapen J. H., 2020, MNRAS, p. 226
- Vazdekis et al. (2016) Vazdekis A., Koleva M., Ricciardelli E., Röck B., Falcón-Barroso J., 2016, MNRAS, 463, 3409
- Venhola et al. (2017) Venhola A., et al., 2017, A&A, 608, A142
- van Dokkum et al. (2015a) van Dokkum P. G., Abraham R., Merritt A., Zhang J., Geha M., Conroy C., 2015a, ApJ, 798, L45
- van Dokkum et al. (2015b) van Dokkum P. G., et al., 2015b, ApJ, 804, L26
- van Dokkum et al. (2016) van Dokkum P., et al., 2016, ApJ, 828, L6
- van Dokkum et al. (2017) van Dokkum P., et al., 2017, ApJ, 844, L11
- van Dokkum et al. (2018) van Dokkum P., et al., 2018, Nature, 555, 629
- van Dokkum et al. (2019) van Dokkum P., et al., 2019, ApJ, 880, 91
Appendix A Likelihood of the Sérsic function
In this Appendix we describe the Likelihood function associated to a distribution of globular clusters following a spatial configuration dictated by a Sérsic law. We assume the globular clusters are located around the host with an elliptical symmetry. We consider the center of the distribution (x0, y0), the position angle () and the axis ratio q to be known. With such assumption, the distance of each globular cluster to the center of the distribution can be described by:
| (3) |
with
| (4) | |||
| (5) |
The Sérsic distribution probability density function is:
| (6) |
with n the Sérsic index and RGC the effective radius of the globular cluster distribution. bn satisfies (2n,bn)=1/2(2n) with and the complete and incomplete gamma functions respectively.
In our case, the parameters of the Likelihood function are =(RGC,n). For a dataset of size N (i.e. for a number of globular clusters equal to N), the probability of our observation can be represented by L(R1,R2,…,RN|). From probability theory, we know that the probability of multiple independent events all happening is termed the joint probability, therefore we can write our Likelihood as:
| (7) |
For convenience, we work using the log Likelihood function:
| (8) |
A bit of algebra shows that:
| (9) | |||||
A.1 Maximum Likelihood Estimation for RGC
In the case of RGC, the maximum likelihood value can be estimated analytically relatively simply. To get this value we calculate LL/RGC=0. Using Eq. 9, we get:
| (10) |
From that equation we obtain:
| (11) |
Finally, applying LL/RGC=0, we get the following solution of the maximum likelihood value for RGC:
| (12) |