Discovery of a near-infrared bar and a pseudobulge in the collisional ring galaxy Cartwheel
Abstract
We report the discovery of a bar, a pseudobulge and unresolved point source in the archetype collisional ring galaxy Cartwheel using careful morphological analysis of a near-infrared (NIR) Ks band image of excellent quality (seeing=0.42″) at the ESO archive. The bar is oval-shaped with a semi-major axis length of 3.23″ (2.09 kpc), with almost a flat light distribution along it. The bulge is almost round (ellipticity=0.21) with an effective radius of 1.62″ (1.05 kpc) and a Sersic index of 0.99, parameters typical of pseudobulges in late-type galaxies. The newly discovered bar is not recognisable as such in the optical images even with more than a factor of two higher spatial resolution of the Hubble Space Telescope, due to a combination of its red colour and the presence of dusty features. The observed bar and pseudobulge most likely belonged to the pre-collisional progenitor of the Cartwheel. The discovery of a bar in an archetype collisional ring galaxy Cartwheel is the first observational evidence to confirm the prediction that bars can survive a drop-through collision along with the morphological structures like a central bulge (pseudo).
keywords:
galaxies: bulges — galaxies: structure — infrared: galaxies — galaxies: evolution — galaxies: photometry — galaxies: individual1 Introduction
The Cartwheel has been the subject of multiwavelength studies due to its unusual morphology (Zwicky, 1941; Fosbury & Hawarden, 1977), and often has been considered as the archetype of the class of collisional ring galaxies. These galaxies are a relatively small fraction of all galaxies that have undergone a recent interaction (Madore et al., 2009) and are believed to be formed by head-on collisions of two galaxies in which an intruder galaxy passes through the centre or close the center of a rotating disk of a larger galaxy, in the process creating an outwardly propagating density wave in the larger galaxy (Lynds & Toomre, 1976; Theys & Spiegel, 1976; Appleton et al., 1996). As the expanding wave moves outwards, it triggers star formation (SF) in a circular ring. SF eventually stops once the wave moves forward and leaves behind an ageing stellar population in its wake (Higdon, 1996; Appleton & Marston, 1997; Korchagin et al., 2001). The H image of the Cartwheel suggests that most of the current SF is taking place in 29 star-forming complexes in the ring (Higdon, 1996), each complex containing several compact knots at the spatial resolution of the Hubble Space Telescope (HST). The ring is elliptical in shape, with a semi-major axis length of 23 kpc and axis ratio of 0.75. The center of the ellipse is shifted from the nucleus by 6.5 kpc. Non-thermal radio emission from the ageing population has been detected in narrow radial spokes that extend to around 4 kpc inside the current ring (Mayya et al., 2005).
The Cartwheel has a very noticeable inner ring, which in theoretical studies have been discussed as the second ring (Appleton & Struck-Marcell, 1996). The ratio of the first ring to second ring radii of 4.2 is in qualitative agreement with the analytical theory of collisional ring galaxies (Struck, 2010). However, unlike the outer ring, the inner ring is gas-poor with very little presence of HI (Higdon, 1996) and H (Amram et al., 1998), and SF (Charmandaris & Mirabel, 1997). CO molecular line corresponding to an H2 mass M⊙ is detected from the central parts, including the inner ring, which is found to be expanding at a velocity of 68.94.9 km s-1 (Higdon et al., 2015). However, the detected CO gas in the central region is of low excitation, suggesting weak star-forming activity (Horellou et al., 1995). Low SF rate of the inner ring has put some doubt on its interpretation of as post-collisional structure, and it could as-well be of pre-collisional origin.
Struck et al. (1996) speculated the presence of a faint bar inside the ring along with a “D-shaped” structure from the HST observations. However, their data do not conclusively confirm the bar. In a more recent paper, Struck (2010) analysed this structure as a possible third ring. Numerical simulations of an intruder falling into a barred galaxy expect the bar to survive (Athanassoula et al., 1997).
However, a comprehensive analysis of the central part in the Cartwheel to look for pre-collisional structures, especially a bar, is still lacking. The presence of a ring, and dust lanes does make it difficult to explore. At the same time, it should be noted that the the presence of a ring in the central region may possibly indicate the presence of a barlike structure as stellar bars are often observed encircled by a ring structure (Sandage, 2005) and such bars are more likely to be weak in nature (Buta et al., 2005).
Observational confirmation of the bar would unambiguously prove the survival of pre-collisional structures in the central part of the Cartwheel. With this purpose, we carried out a careful structural analysis of the region inside the inner ring of the Cartwheel using Near-infrared (NIR) data. In this paper, we present the results of this study. The paper is organised as follows. Section 2 describes the data. The analysis of the central region of Cartwheel and results are described in section 3. Section 4 is devoted to discussion and conclusions. We use a distance of 133 Mpc to the galaxy from NED111The NASA/IPAC Extragalactic Database (NED) is operated by the Jet Propulsion Laboratory, California Institute of Technology, under contract with the National Aeronautics and Space Administration., which corresponds to a recessional velocity of 9050 km s-1 (Amram et al., 1998) for the cosmological parameters used in NED (, and ). The scale for this distance is 646 pc arcsec-1.
2 Data
The Near-infrared (NIR) observations are known to reveal stellar bars that are not seen in the optical images, the best example of such a case is the bar of the dusty starburst M82 (e.g. Telesco & Gezari, 1992). The reason for this is that NIR wavelengths probe older stellar populations and are less affected by dust extinction and the presence of young stars due to recent star formation (Eskridge et al., 2000; Jarrett et al., 2003; Menéndez-Delmestre et al., 2007). These facts and the speculation by Struck et al. (1996) motivated us to look for a bar in the Cartwheel using NIR wavelengths. For this purpose, we used the excellent quality -band images available in the ESO data archive222http://archive.eso.org/eso/eso_archive_main.html.
The data we used belong to program ID 66.B-0666(B) in the ESO data archive, which were taken at the VLT-U1 telescope using the ISAAC instrument in year 2000. An image created from this dataset has been recently used to overlay the CO map in Higdon et al. (2015), has not been used yet for a detailed structual analysis. The dataset included on and off-field (sky) images of Cartwheel, images of a standard star, in addition to dark and flat images. The band images used here were taken on three separate runs in 2000: October 15, October 18 and November 7. Table 1 gives the observational log with columns 1 to 5 taken from the image headers and the last column directly measured on the image. The dataset included 31 dithered images pointed at the object and 29 dithered images to sky fields on the north, south, east and west of the Cartwheel field. Each object and sky image was formed respectively by co-adding 27 and 18 exposures of 4 seconds each. This resulted in a total exposure time of 3348 seconds on the Cartwheel. Airmass during all the observations remained between 1.0–1.3, and seeing between 0.35 to 0.69″, with a median seeing of 0.4″. Each image covered a field of view of 150″150″ at an image scale of 0.147″/pixel. Sky was stable to within 0.05 magnitude throughout the three runs as judged from the variation of aperture magnitude of the in-field stars. The data were photometrically calibrated using the observations of NIR standard star S294-D333https://www.eso.org/sci/observing/tools/standards/IRstandards/Photometric.html (K=10.5960.004 from Persson et al., 1998), which were carried out during the November run. The standard star dataset included 5 images, each a co-add of 6 exposures of 1.773 seconds each. Using this standard star, we get a zero point of 24.160.04. This zero point is close to 24.210.06 obtained using 2MASS magnitudes of 2 in-frame stars of 14.3 mag.
| File name | Exposure | RA | DEC | AM | Seeing |
|---|---|---|---|---|---|
| (1) | (2) | (3) | (4) | (5) | (6) |
| ISAAC.2000-10-15T06:04:09.091 | 4.027 | 0:37:40.829 | 33:42:59.04 | 1.178 | 0.36 |
| ISAAC.2000-10-15T06:11:32.064 | 4.027 | 0:37:41.506 | 33:43:00.12 | 1.198 | 0.46 |
| ISAAC.2000-10-15T06:14:30.998 | 4.027 | 0:37:40.891 | 33:42:53.28 | 1.207 | 0.41 |
| ISAAC.2000-10-15T06:21:52.070 | 4.027 | 0:37:41.100 | 33:43:02.64 | 1.230 | 0.41 |
| ISAAC.2000-10-15T06:24:53.078 | 4.027 | 0:37:41.369 | 33:42:53.64 | 1.239 | 0.39 |
| ISAAC.2000-10-15T06:32:14.064 | 4.027 | 0:37:40.373 | 33:42:54.72 | 1.265 | 0.40 |
| ISAAC.2000-10-15T06:35:14.035 | 4.027 | 0:37:41.282 | 33:43:03.36 | 1.275 | 0.35 |
| ISAAC.2000-10-18T05:43:36.077 | 4.027 | 0:37:40.939 | 33:42:59.76 | 1.156 | 0.40 |
| ISAAC.2000-10-18T05:50:59.050 | 4.027 | 0:37:40.750 | 33:42:53.28 | 1.174 | 0.49 |
| ISAAC.2000-10-18T05:53:58.070 | 4.027 | 0:37:41.162 | 33:43:00.12 | 1.182 | 0.58 |
| ISAAC.2000-10-18T06:01:15.082 | 4.027 | 0:37:40.454 | 33:42:53.28 | 1.203 | 0.46 |
| ISAAC.2000-10-18T06:04:14.016 | 4.027 | 0:37:40.373 | 33:43:00.48 | 1.211 | 0.37 |
| ISAAC.2000-10-18T06:11:32.064 | 4.027 | 0:37:41.378 | 33:42:52.92 | 1.234 | 0.40 |
| ISAAC.2000-10-18T06:14:30.998 | 4.027 | 0:37:41.273 | 33:43:03.36 | 1.244 | 0.38 |
| ISAAC.2000-10-18T06:27:29.981 | 4.027 | 0:37:40.260 | 33:42:57.96 | 1.291 | 0.42 |
| ISAAC.2000-10-18T06:37:48.086 | 4.027 | 0:37:41.244 | 33:42:57.96 | 1.332 | 0.69 |
| ISAAC.2000-11-07T02:27:30.038 | 4.027 | 0:37:40.930 | 33:43:00.84 | 1.014 | 0.40 |
| ISAAC.2000-11-07T02:34:52.061 | 4.027 | 0:37:40.399 | 33:42:56.16 | 1.016 | 0.41 |
| ISAAC.2000-11-07T02:37:50.995 | 4.027 | 0:37:41.496 | 33:42:58.68 | 1.017 | 0.41 |
| ISAAC.2000-11-07T02:45:11.030 | 4.027 | 0:37:41.544 | 33:43:06.96 | 1.020 | 0.44 |
| ISAAC.2000-11-07T02:48:10.051 | 4.027 | 0:37:41.246 | 33:43:16.68 | 1.022 | 0.49 |
| ISAAC.2000-11-07T02:55:27.062 | 4.027 | 0:37:41.549 | 33:43:21.00 | 1.026 | 0.55 |
| ISAAC.2000-11-07T02:58:26.083 | 4.027 | 0:37:42.036 | 33:43:18.48 | 1.028 | 0.49 |
| ISAAC.2000-11-07T03:06:55.066 | 4.027 | 0:37:40.939 | 33:42:59.76 | 1.035 | 0.40 |
| ISAAC.2000-11-07T03:14:15.101 | 4.027 | 0:37:40.375 | 33:42:59.76 | 1.041 | 0.36 |
| ISAAC.2000-11-07T03:17:14.035 | 4.027 | 0:37:41.153 | 33:43:04.08 | 1.044 | 0.35 |
| ISAAC.2000-11-07T03:24:37.008 | 4.027 | 0:37:40.666 | 33:43:06.24 | 1.052 | 0.37 |
| ISAAC.2000-11-07T03:27:35.078 | 4.027 | 0:37:41.230 | 33:42:54.00 | 1.055 | 0.36 |
| ISAAC.2000-11-07T03:34:57.965 | 4.027 | 0:37:41.462 | 33:43:01.92 | 1.064 | 0.42 |
| ISAAC.2000-11-07T03:37:57.072 | 4.027 | 0:37:40.320 | 33:42:54.72 | 1.068 | 0.38 |
| ISAAC.2000-11-07T03:45:18.058 | 4.027 | 0:37:41.398 | 33:43:06.96 | 1.079 | 0.37 |
Notes on columns: (1) File name in the ESO data archive formed as a combination of instrument (ISAAC) followed the starting universal time in standard fits keyword format. (2) Each exposure consists of co-addition of 27 frames of 4 second each. (3–4) The equitorial coordinates of the telescope pointing. (5) AIRMASS at the start of each observation. (6) Seeing measured using a star in each frame.
We followed the standard NIR image reduction techniques, that included preparing master dark images and flat images. Exposure time matched dark images are subtracted from individual flat-field, Cartwheel and sky images. Dark-subtracted flat-field images for each run are combined using median algorithm, which were normalized by the median count of the combined image. Individual dark-subtracted Cartwheel and sky frames are divided by the normalized flat-field. The resulting sky frames are then combined using median algorithm, which is then subtracted from each Cartwheel image. Each of the resulting 31 Cartwheel images were visually checked to be of good quality by displaying them on a ds9 monitor. We selected 10 non-saturated stars in the field, which we used to measure the seeing and photometric quality of each individual image, in addition to getting relative shifts to facilitate registering the dithered images. Astrometrically registered images were combined using the median algorithm. We measured a Full Width at Half Maximum (FWHM) of 0.43″ for the Point Spread Function (PSF) in the combined image. We also generated a combined image of 7 images with the best seeing, which resulted in an image of FWHM=0.39″. We recall that the images with the highest spatial resolution available for the Cartwheel are from the HST/WFPC2 camera in the F450W and F814W-band which have a PSF of 0.17″ FWHM, hence 2.3–2.6 times better than our images.
The entire data reduction was carried out using the tasks in IRAF444IRAF is distributed by the National Optical Astronomy Observatories, which are operated by the Association of Universities for Research in Astronomy, Inc., under cooperative agreement with the National Science Foundation., as described in Barway et al. (2005). The images were astrometrised using the coordinates of 2MASS stars in the image with the help of tasks ccmap and wregister. The final image is displayed in Figure 1.
3 Identifying bar in Cartwheel
Bars can be identified using various criteria listed in literature (Eskridge et al., 2000; Whyte et al., 2002; Menéndez-Delmestre et al., 2007; Laurikainen et al., 2005; Weinzirl et al., 2009). Morphological classification of galaxies, including the inference of a bar, has been carried out historically by visual inspection of images (de Vaucouleurs, 1963). Even in the current digital era, classification by eye continues to be the most powerful tool (Buta, 2013). Using the SDSS imaging survey, a visual morphological classification of galaxies is carried out as a part of the Galaxy Zoo projects (Lintott et al., 2008; Willett et al., 2013) in which citizen scientists were asked to give detailed information about the visual appearance of galaxies along with features such as bars in the galaxies. These bar classifications were used in several Galaxy Zoo studies of barred galaxies to investigate the role of bars to understand the formation and evolution scenarios of galaxies (Masters et al., 2012; Skibba et al., 2012; Kruk et al., 2018).
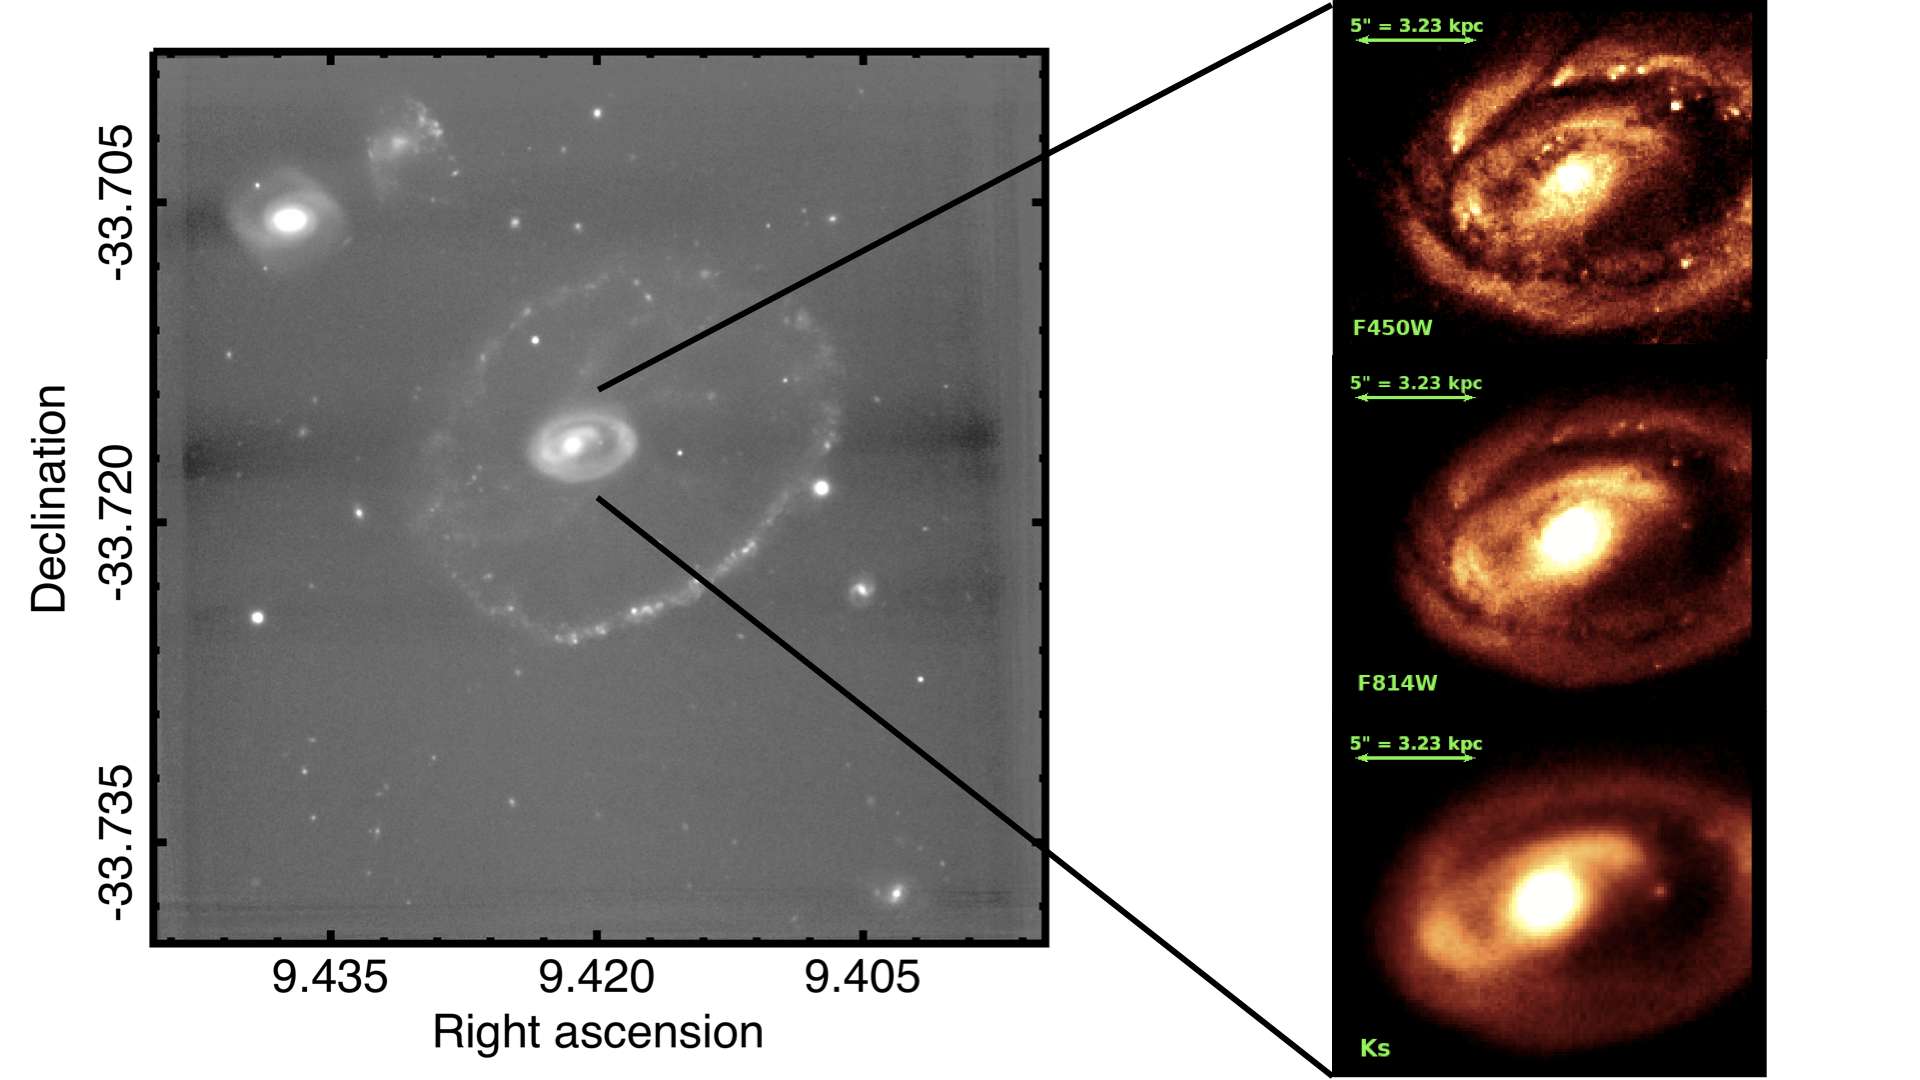
We show the Ks band image of the Cartwheel in the left panel of Figure 1. The right panel shows a close-ups of the central part showing only the inner ring in HST/WFPC2 F450W (top panel) and F814W (middle panel), in addition to that in the Ks band (bottom panel). The images have been displayed with suitable intensity scaling so as to allow a direct visual apreciation of the prominant features in the central region. A diagonal linear structure (bar) and a central bright component, which is a candidate either for an unresolved nucleus or a bulge, are clearly noticeable in the Ks band image. On the other hand, in the optical bands the bar is not apparent, in spite of more than a factor of two higher spatial resolution offered by the HST. Instead, the most prominant feature is a spiral-like structure that seems to emerge from the south-east end of the bar, almost at 90∘ to it. This spiral feature continues north-ward but bends again sharply towards the north-west end of the bar, merging with a short spiral feature emerging from the opposite end of the bar. This overall morphology is the “D-shaped” structure pointed out by Struck et al. (1996). These authors had also noted the presence of a network of dust lanes including large cometary structures in the inner ring, which all can be seen in the optical images, especially in the F450W band. The spiral is seen in the Ks-band image, but at a lesser contrast than the bar, whereas all the dust-related structures are absent in the near infrared image.
3.1 Ellipse fitting
The most widely used quantitative technique to identify a bar is the ellipse-fitting method. The bars are features where the position angle (PA) of the isophotes remains constant and the ellipticity (; and are the semi-major and minor axes, respectively) increases steadily to a global maximum (Wozniak et al., 1995; Marinova & Jogee, 2007; Barazza et al., 2008; Aguerri et al., 2009). Also, the ellipticity of the bar is directly a measure of the strength of the bar (Erwin, 2005). This criterion is based on the work done by Athanassoula (1992) who showed that in the bar region, the bar-supporting orbits (also known as the x1 family of orbits) can be modelled by concentric ellipses with a constant position angle as a function of the semi-major axis. Sometimes the second criterion also used in which the ellipticity drops by 0.1 coupled with the change in position angle at the region of the transition from bar to disc as at this point there is a transition from highly eccentric x1 orbits at the bar end to the more circular orbits near the disc (Marinova & Jogee, 2007; Jogee et al., 2004). For our work, we use the former criterion as in the inner region of Cartwheel, it is non-trivial to identify the transition from bar to disc region due to the presence of the inner ring and the spiral arm.
We used the ellipse-fitting task ELLIPSE in the STSDAS package available in IRAF to fit the part interior to the inner ring of HST-WFPC2 optical and Ks-band images. Following Barway et al. (2005), we started the fitting few arcseconds from the centre of the Cartwheel and stopped at the isophotes where the rings start appearing. We have identified the stars, bad pixels and other hidden features etc. during the first round of fitting and masked in the subsequent run. All the parameters, including the centre of the ellipse, were allowed to vary during the fitting. As the majority of the inner region of the Cartwheel contains complex dust features, accurate estimation of the initial values of ELLIPSE task parameters was not possible. To minimize the error in this estimate, we first carried out isophote fitting for Ks band image which is least affected by dust compared with optical images. The parameters thus determined were used in the second run and the above described ellipse-fitting procedure was repeated. The same parameters were used to fit ellipses to the isophotes in optical bands. We repeated the fitting process with different starting major-axis lengths and different forms of sampling to check the stability of the extracted parameters. This fitting procedure gives the ellipticity, position angle and the mean intensity (surface brightness) along the major axis for the best-fit ellipse, as a function of the semimajor-axis length.
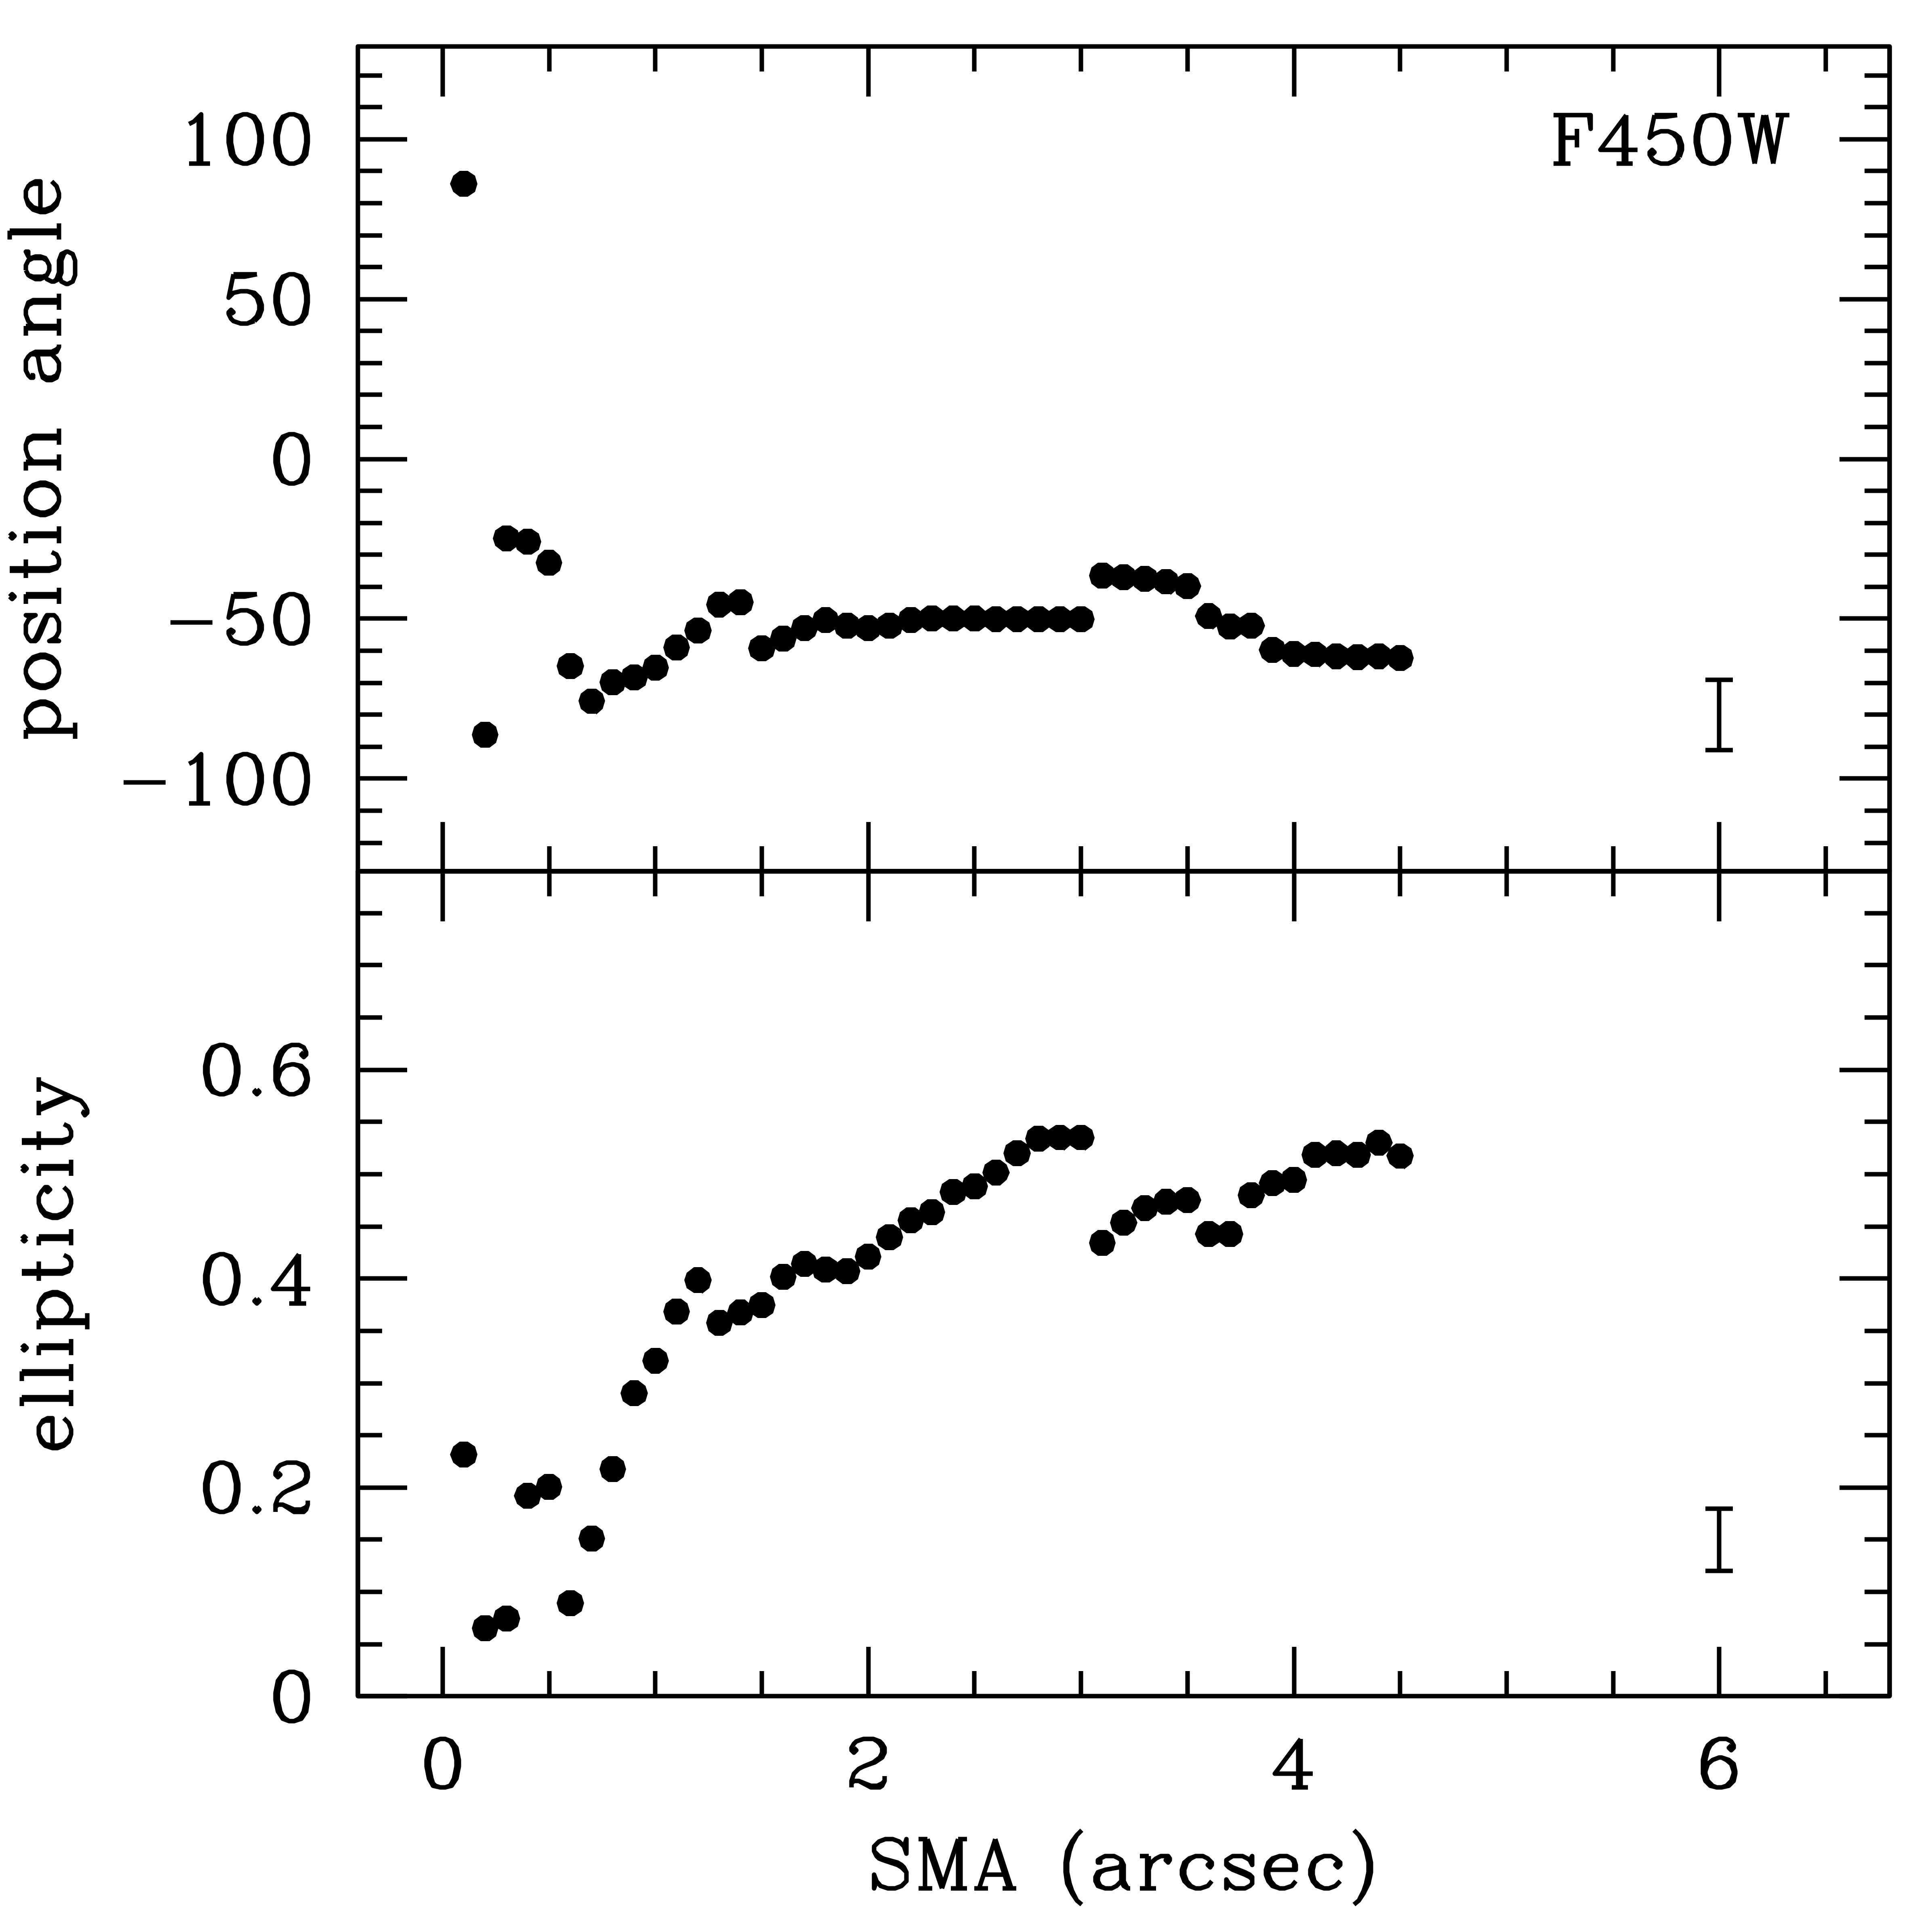
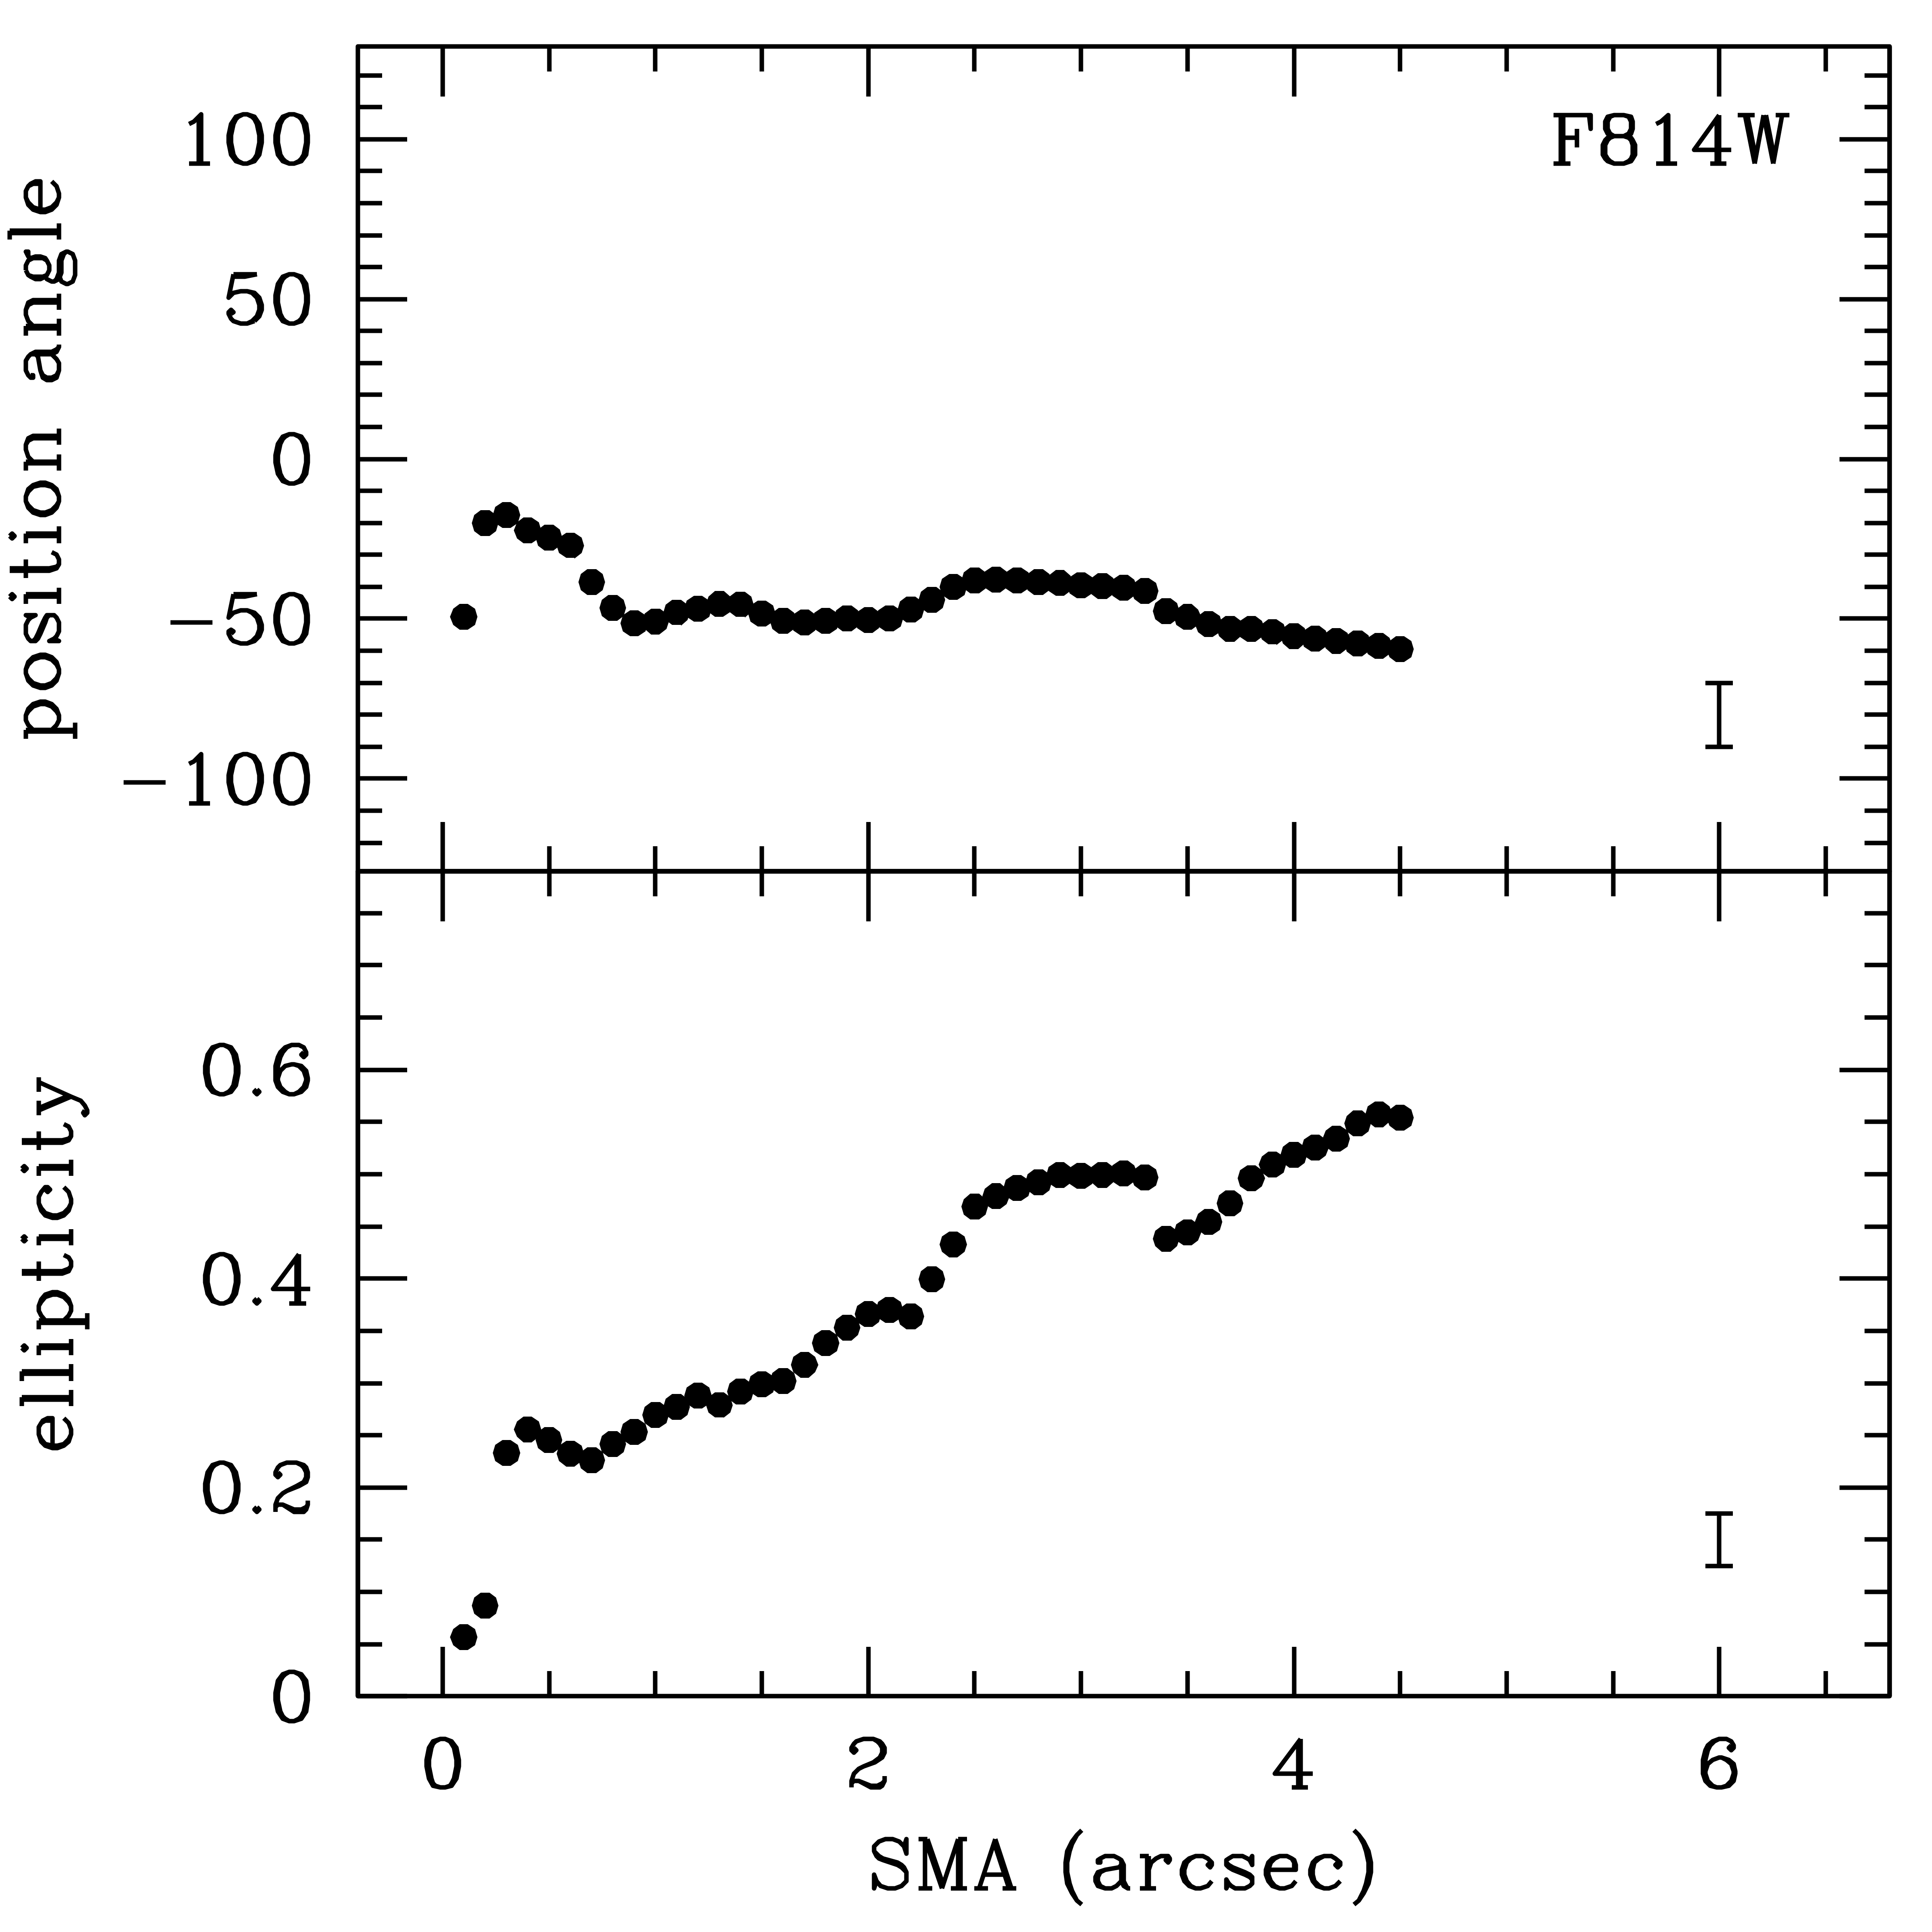
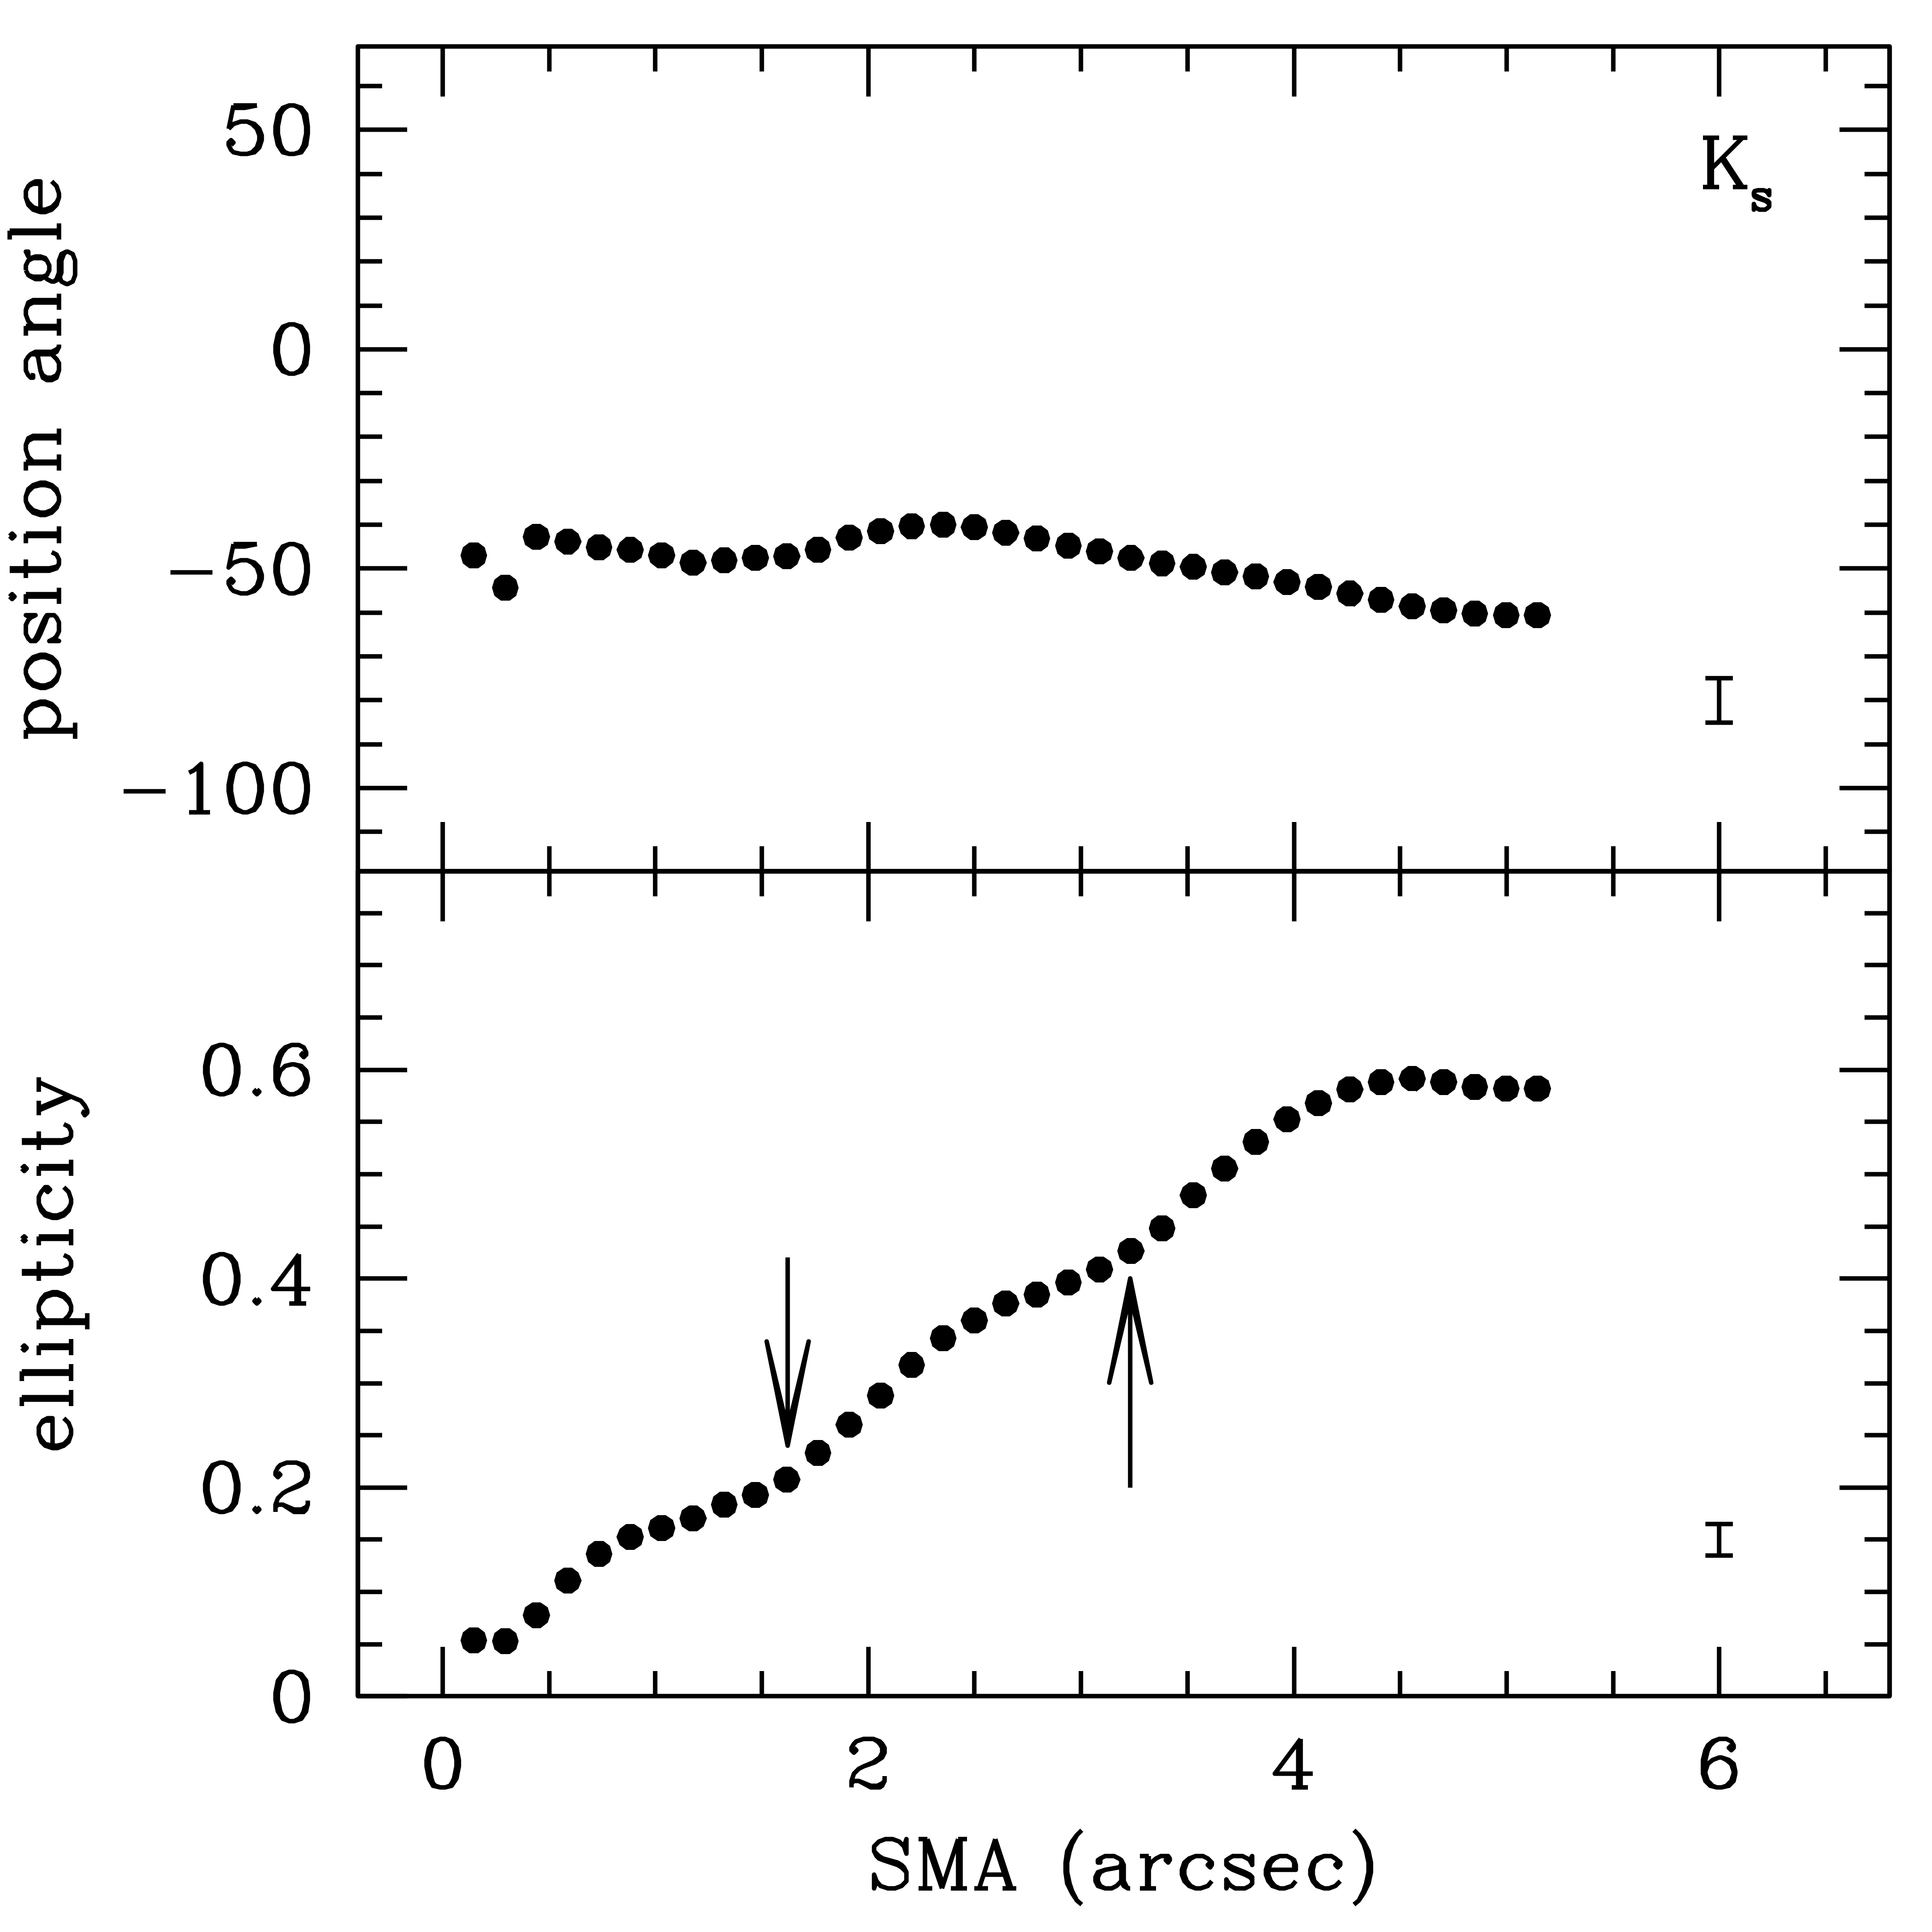
In Figure 2, we show the position angle (top panel) and ellipticity (bottom panel) for HST WPC2 F450W (left), F814W (middle) and Ks (right) band images. The position angle and ellipticity profiles for F450W and F814W is rather disturbed with several breaks in the profiles. This is due to the presence of dust in the inner region of Cartwheel which causes the departure of the isophotes from the best-fit ellipse. Therefore, the position angle and ellipticity profiles from F450W and F814W band images do not help to identify bar. However, the dust hardly affects the morphology of the Ks-band image giving us a smooth position angle and ellipticity profiles that we use to characterise the bar.
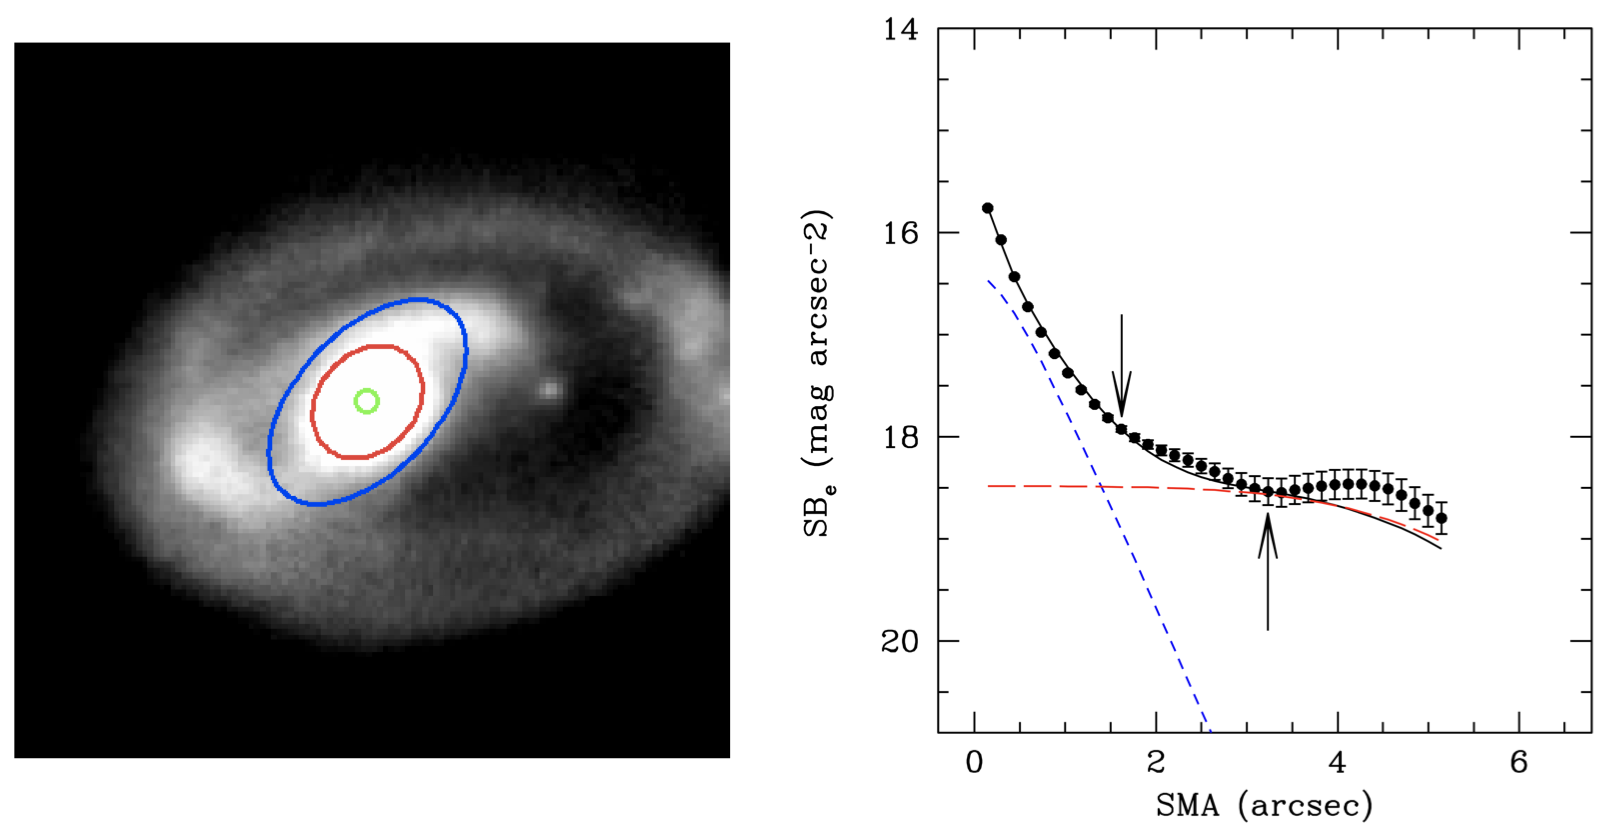
The isophotes are nearly circular in the centre upto 0.29″, which indicates the presence of an unresolved central component — a nucleus. Beyond this point ellipticity gradually increases with very little variation in the position angle. Both the ellipticity and the position angle show a simultaneous change at 1.62″(1.05 kpc; shown by the downward pointing arrow), indicating the presence of a central bulge-like component. The position angle continues to vary, albeit rather little, all along the plotted semi-major axis length of 5″. The gradually increasing ellipticity shows a tendency to flatten at 3.2″(2.09 kpc; shown by the upward pointing arrow). Such a behaviour is the characteristic signature of a bar (Menéndez-Delmestre et al., 2007). In some cases, prominent spiral arms starting at the two ends of the bar can cause ellipticitity to keep rising beyond the end of the bar. These spiral arms also increase the radial region of a nearly constant position angle as seen in the position angle profile. Visual examination of the image suggests a spiral-like structure emerging from both sides of the bar at this radius. Thus, the bar ends at 3.2″ (2.09 kpc) and the ellipticity increase beyond this point is due to the contamination from the spiral arm. This strategy used by us to measure the length of the bar is consistent with the often-adopted method of measuring the bar length in normal galaxies as the point where the ellipticity profile reaches a maximum (Erwin, 2005; Gadotti et al., 2007; Laurikainen et al., 2007). In the left panel of Figure 3, we superpose the ellipses corresponding to the nucleus, bulge and the bar on the -band image. The ellipses corresponding to the bulge and bar enclose very well the visually identifiable morphology of these components.
Another important bar characteristic apart from "bar length" is a ‘strength’ of a bar. There are various methods adopted in the literature to determine the bar strength such as maximum ellipticity of the isophotal ellipticity profile (Marinova & Jogee, 2007; Aguerri et al., 2009; Herrera-Endoqui et al., 2015), using bar torques (Buta & Block, 2001), the maximum amplitude of the m = 2 Fourier mode (Athanassoula & Misiriotis, 2002; Laurikainen et al., 2005) or two-dimensional fast Fourier transform (FFT) method (Garcia-Gómez et al., 2017). Abraham & Merrifield (2000) introduced the parameter to derive the bar strength, that uses the axial ratio of the bar. The parameter has a value between zero (unbarred) to close to unity (strong bar) and can be used to identify weak and strong bars as a function of galaxy morphology. We have adopted the modified form of parameter as given in Aguerri et al. (2009)
| (1) |
where the ellipticity () is derived from the maximum value of the ellipticity profile along the bar, which usually happens at the end of the bar. We determined =0.43 for the Cartwheel bar which gives the =0.36, a value typically found for late-type spiral galaxies with strong bar (Aguerri et al., 2009). The bar length and strength that we find for Cartwheel is also similar for the late-type galaxies reported by Díaz-García et al. (2016) using the 3.6 imaging from the Spitzer Survey of Stellar Structure in Galaxies ().
We would like to point out that measuring the length or ellipticity of a bar in galaxies is a non-trivial task as the surface brightness profile gets affected at the end of the bar by several known morphological sub-structures such as dust lane, spiral arm, ring etc. (Erwin, 2005) along with deprojection effects. For a careful characterization of a bar, it is important to deproject the galaxy image to face on to have reliable measurements of length and ellipticity of the bar. However, deprojection techniques systematically introduce uncertainty in the measurements of bar length and ellipticity if the parameters used are derived incorrectly (Gadotti et al., 2007; Zou et al., 2014). To deproject a galaxy image the techniques employed in the literature use the following parameters — position angle of the 25 mag arcsec-2 isophote in the B-band and the inclination angle of the disc of the galaxy (i) to the plane of the sky. In many galaxies, these parameters are difficult to measure and the Cartwheel is no exception due to its collisional origin and the presence of sub-structures mentioned above. We, therefore, do not apply depoejection for measuring the length and ellipticity of the Cartwheel bar.
| ELLIPSE | GALFIT | |||||||
| PA | re | n | b/a | PA | ||||
| kpc | 1-b/a | ∘ | kpc | ∘ | ||||
| Bar | 2.09 | 0.43 | 48 | 2.61 | 0.23 | 0.60 | 57 | 9.70 |
| Bulge | 1.05 | 0.21 | 47 | 0.56 | 0.99 | 0.72 | 45 | 9.17 |
3.2 Two-dimensional image decomposition
In order to obtain a completely independent measure of the central component, and the bar, we adopted the technique of two-dimensional decomposition of galaxy light in our Ks band image using the GALFIT (Peng et al., 2002) 2D decomposition code. The GALFIT uses the fast Marquardt-Levenberg algorithm to minimise the between the observed image and the PSF-convolved sum of a variety of model components. Parameters of the model with the minimum are considered optimal values. A GALFIT run requires the following inputs: an input image, a mask image, a PSF image and a configuration file containing a description of the model to be fitted. The PSF was obtained by identifying foreground stars in the Ks band image and by fitting Gaussian using the PSF task available in the DAOPHOT package within IRAF. The mask image is created using the IRAF ELLIPSE task. We modelled both the bulge and the bar using the Sersic function (Sérsic, 1963). The central point source was modelled as an unresolved point source convolved with the PSF used for GALFIT fitting, thus there is no prescribed analytical functional form and the only parameter fitted by the GALFIT is total magnitude.
The resulting surface brightness profiles are shown in the right panel of Figure 3. The parameters of these fits are compared to that obtained by the ellipse fitting in Table 2. The central component fitted as unresolved point source has a total magnitude of 17.66. The bulge component has a Sersic index of , and a effective radius of 0.56 kpc (0.89″), whereas the second Sersic component has a much flatter light distribution () and is longer, and represents the bar. Sersic index of corresponds to an exponential profile, and hence the bulge in the Cartwheel is an exponential bulge. The axis ratio and the PA of the two components are in agreement with those derived for these two components using the ellipse fits. Gadotti (2011) has found that the bar length (obtained from isophotal semi-major axis length) is well correlated with bar effective radius . However, in the Cartwheel, kpc obtained from GALFIT is larger than the bar length (2.09 kpc) obtained by ellipse fitting, which was expected given the interference from the spiral structure, which was not modelled in the GALFIT. We will use the semi-major axis measured from ellipse fitting as the bar length, henceforth. The parameter from Table 2 indicates that the bar is somewhat oval shaped. The Sersic index much lower than 1 suggests that the intensity varies very little along the bar. Also, the results given in Table 2 for the two Sersic functions we used, corresponding to bar and bulge, indicate that the bulge is less massive than the bar. The mass of the individual components is obtained using M/L of 0.6 in band (McGaugh & Schombert, 2014). Note that we have not applied reddening corrections due to Galactic extinction as it is negligible in the Ks band.
The errors estimated on the recovered parameters by GALFIT takes into account only the poisson noise due to the source brightness, which is small as compared to real errors due to possible PSF variation in the image, correlated noise due to parameter degeneracy, and most importantly the errors in estimating the sky background which is one of the main sources of errors (Peng et al., 2010). Apart from these, the unmodelled spiral arms cause additional uncertainties on the recovered parameters. As it is non-trivial to estimate the errors due to all these factors, in Table 2, we present values without their corresponding errors. Notwithstanding, GALFIT has been useful to confirm the presence of a bar and bulge that we find from ellipse fitting analysis. For a detailed discussion on error estimation using GALFIT, we recommend the reader to Kruk et al. (2018) and Vika et al. (2013).
4 Discussion and conclusions
In spite of a lot of interest in the Cartwheel, the morphology of its host galaxy is still under deliberation. From our analysis of NIR Ks band images presented in the previous sections, we conclude that that Cartwheel has an oval-shaped bar, a pseudobulge and an unresolved nucleus.
The derived bar length and bar strength suggest that the discovered bar is a strong bar. The fundamental question that needs to answered is whether these structures formed after the collision or were they already there at the time of the collision? Mapelli & Moore (2008) carried out N-body simulations of collisional ring galaxies to address questions regarding the long-term fate of these galaxies. They found the outer ring such as that of the Cartwheel is formed 100-200 Myr after the collision. The ring would continue to expand and eventually fade to form Giant Low Surface Brightness (GLSBs) galaxies after 0.5–1.0 Gyr of age. These simulations also predict the formation of a stellar bar triggered by the galaxy interaction which can be long-lived (age1 Gyr) and present in the GLSB phase. Malin 1, a well known barred GLSB galaxy, is an example of such a case (Barth, 2007). The collision that formed the Cartwheel ring happened 300 Myr ago (Wolter et al., 2019), and hence the observed bar would not have had time to form after the collision. Thus the observed strong bar in the Cartwheel was existing at the time of collision. Hence, the pre-collisional Cartwheel had a morphology of a barred late-type spiral galaxy with a small pseudobulge and a large disk.
The Cartwheel clearly shows a strong negative colour gradient (Marcum et al., 1992). Though a negative colour gradient is expected from an ageing population in the inner parts, the observed colour gradient can be quantitatively explained only if there is substantial contribution from the pre-collisional disc of old stars (Korchagin et al., 2001). The old stellar population was reported by Fosbury & Hawarden (1977) from spectroscopic observations by detecting the late-type stellar absorption lines in the observed spectrum. The study of colour modelling by Vorobyov & Bizyaev (2001) indicate that the pre-collision Cartwheel was a late-type spiral in which the old stellar components were embedded in an extended gaseous disc.
The old pre-collisional stellar components of the Cartwheel are likely made up of a bar and an exponential bulge in the centre and a stellar disc extended over the entire size of the Cartwheel. Our finding suggests that the Cartwheel hosts a small exponential bulge which can be classified as pseudobulge given that the Sersic index (Fisher & Drory, 2008). Barazza et al. (2008) show that a significant fraction of barred late-type spiral galaxies host pseudobulges. Thus pseudobulges are common in late-type spiral galaxies. These type of bulges are believed to arise from disc material via secular evolution (Kormendy & Kennicutt, 2004) induced either by bars or spiral structure (Combes & Elmegreen, 1993; Athanassoula, 2005). It has been observed that typically pseudobulges have younger stellar populations. However, it is not abnormal to have old pseudobulges in late-type spiral galaxies (Carollo et al., 2007), for example, if by some mechanism the star formation in a galaxy is quenched after the formation of a pseudobulge, such bulge would quickly resemble inactive and old.
Many simulation studies show that the disc instabilities can lead to forming bars over a large range of disc masses that are stable for a long time. This also implies that bars are robust stellar structures, hence once formed, it is hard to destroy them (Combes & Sanders, 1981; Pfenniger & Norman, 1990; Shen & Sellwood, 2004; Bournaud et al., 2005; Debattista et al., 2006). The fraction of gas present in disc plays a major role in the formation and evolution of bars as shown by Athanassoula et al. (2013). Strong bars are difficult to form in gas-rich disc galaxies compared to gas-poor ones. The fact that redder and gas-poor spiral galaxies have significantly increased bar fraction (Masters et al., 2012) points towards a scenario in which the secular evolution of disc galaxies is driven by the growth of bars thus making the bar an important component for the evolution of galaxies.
A stellar bar helping the formation of a pseudobulge during secular evolution is another possibility. As shown in Table 2 the bar in Cartwheel is massive compared to pseudobulge. This emphasises the fact that if pseudobulges are formed through disc instabilities through bars then on average pseudobulges are significantly less massive compared to bar for typical disc galaxies (Gadotti, 2011). Thus it is likely that the pre-collision Cartwheel was a barred late-type (later than SBc) spiral galaxy with a small pseudobulge, and possibly a large disc. The bar and the pseudobulge have survived the collision.
Cartwheel as an archetype collisional ring galaxy has been the subject of many simulation studies. In these simulations, it has been shown using some impact parameters how the morphology and star formation history of disc galaxy can be changed due to head-on collision by the intruder galaxy and produce ring structure (Theys & Spiegel, 1977; Struck-Marcell & Lotan, 1990; Hernquist & Weil, 1993; Horellou & Koribalski, 2003; Mapelli & Moore, 2008; Mapelli & Mayer, 2012; Fiacconi et al., 2012; Renaud et al., 2018). The formation mechanisms of collisional ring galaxies are well constrained in these simulation studies given that the time scale to develop a ring morphology and its lifespan is short compared to the Hubble time-scale. However, simulations that address the impact of such collisions on the survival of central morphological components are rare.
Do bars survive in a collission that produces ring galaxies? This question was addressed by Athanassoula et al. (1997) in their N-body simulation study to create the rings in galactic disks by infalling small companions. They found that the bar survives the interaction, and slowly grows fatter developing into an oval structure. A small ring surrounds the bar, which expands and detaches the bar, forming an arm at one side of the bar (see their Figure 18). The observed HST-D morphology surrounding the bar resembles very much the results of their simulation. They further found that depending on the position of the impact, the bar shows an offset from the centre of mass of the galaxy (central bulge in our case). The photometric centre of our oval-shaped bar is shifted by 1.04″ with respect to the bulge, a characteristic similar to that predicted in the N-body simulations. Using such N-body/SPH numerical simulations the dynamical effects of the interaction between an initially barred galaxy and a small companion was studied by Berentzen et al. (2003) and they found that the interactions can produce nuclear and circumnuclear disks (maybe a pseudobulge), offset bars and tidal arms connected to the end of the bar. Based on the simulation results from Berentzen et al. (2003) the fate of the bar in Cartwheel can be determined by the impact position and it can be hypothesised that in Cartwheel there may have been an impact on the bar such that the tidal force exerted on the bar during the impact does not disrupt the bar structure much and the stellar bar survived the impact. In other words, it is well known that the stellar bars are more robust structure and cannot be destroyed easily. Stellar bars can be weakened or destroyed in minor mergers, or by growing central mass concentration (CMC) or under the dynamical influence of Super Massive Blackholes (SMBHs) over long time scale (several gigayears) (Berentzen et al., 2003; Shen & Sellwood, 2004; Athanassoula et al., 2005, 2013). This means that the head-on or off-axis collisions into the disc of the target galaxy by an intruder or companion galaxy that caused the star-formating ring are insufficient to destroy any pre-existing stellar bar.
Our discovery of the bar in the Cartwheel, makes Cartwheel the first collisionally formed ring galaxy where a bar has been detected. Wong et al. (2006) reported that the partial or C-shaped star-forming ring morphology observed in NGC 922 which has an off-centred star-forming bar is a result of the slightly off-axis drop-through collision of a companion dwarf galaxy. This collision has enhanced the star formation in the ring and the central part of NGC 922. Pellerin et al. (2010) reported many young star clusters of ages of less than 7 Myr and Hα emission in the partial or C-shaped star-forming ring. However, the morphology of NCG 922 suggests it to be far from a classical collisional ring galaxy.
The question of whether the bar was pre-existing or formed after the collision can be addressed directly through spatially resolved study of stellar populations in the bar region, using data from Integral Field Spectroscopy (IFS) such as MUSE. Wolter et al. (2019) find super solar metallicity for the central region, suggesting that the central structures were existing before the collision. The discovery of bar in the Cartwheel also paves way to carry out near infrared (NIR) imaging observations of other collisional ring galaxies.
Large populations of collisional ring galaxies are expected at high redshift due to higher rates of collisions and mergers. However, not many of them are discovered yet (see e.g. Elmegreen & Elmegreen, 2006). Recently, Yuan et al. (2020) has reported a discovery of a collisional ring galaxy at a redshift of , which presents a new insight on ring formation and the evolution of disc galaxies in the early Universe. They reported a possible large bar (similar to the size of Milky Way’s bar) embedded in a giant disc. Studies such as this would give insight on the survival of bars under violent gas accretion events (Sheth et al., 2012; Kraljic et al., 2012). James Webb Space Telescope (JWST) in the mid-IR wavelengths would be ideal to carry out such studies (D’Onghia et al., 2008).
To summarise this work, the discovery of bar and pseudobulge in Cartwheel puts impetus to include bars in future numerical and theoretical studies of collisional ring galaxies. The bar in Cartwheel is a strong and robust structure that survived the collision and remained unaffected by the impact. Thus, collisional ring galaxies provide opportunities for the study of a new, less explored aspect of bar evolution both observationally and theoretically.
Acknowledgements
We thank Ivanio Puerari for his comments on an earlier version of this manuscript. We thank the anonymous referee whose insightful comments have improved both the content and presentation of this paper. This research has made use of the NASA/IPAC Extragalactic Database (NED), which is operated by the Jet Propulsion Laboratory, California Institute of Technology (Caltech) under contract with NASA. We acknowledge the usage of the HyperLeda database (http://leda.univ-lyon1.fr). This research has made use of the services of the ESO Science Archive Facility and based on observations collected at the European Southern Observatory under ESO programme 66.B-0666(B).
References
- Abraham & Merrifield (2000) Abraham R. G., Merrifield M. R., 2000, AJ, 120, 2835
- Aguerri et al. (2009) Aguerri J. A. L., Méndez-Abreu J., Corsini E. M., 2009, A&A, 495, 491
- Amram et al. (1998) Amram P., Mendes de Oliveira C., Boulesteix J., Balkowski C., 1998, A&A, 330, 881
- Appleton & Marston (1997) Appleton P. N., Marston A. P., 1997, AJ, 113, 201
- Appleton & Struck-Marcell (1996) Appleton P. N., Struck-Marcell C., 1996, Fundamentals Cosmic Phys., 16, 111
- Appleton et al. (1996) Appleton P. N., Struck-Marcell C., Bransford M. A., Charmandaris V., Marston A. P., Borne K., Lucas R., 1996, in Bender R., Davies R. L., eds, IAU Symposium Vol. 171, New Light on Galaxy Evolution. p. 337
- Athanassoula (1992) Athanassoula E., 1992, MNRAS, 259, 328
- Athanassoula (2005) Athanassoula E., 2005, MNRAS, 358, 1477
- Athanassoula & Misiriotis (2002) Athanassoula E., Misiriotis A., 2002, MNRAS, 330, 35
- Athanassoula et al. (1997) Athanassoula E., Puerari I., Bosma A., 1997, MNRAS, 286, 284
- Athanassoula et al. (2005) Athanassoula E., Lambert J. C., Dehnen W., 2005, MNRAS, 363, 496
- Athanassoula et al. (2013) Athanassoula E., Machado R. E. G., Rodionov S. A., 2013, MNRAS, 429, 1949
- Barazza et al. (2008) Barazza F. D., Jogee S., Marinova I., 2008, ApJ, 675, 1194
- Barth (2007) Barth A. J., 2007, AJ, 133, 1085
- Barway et al. (2005) Barway S., Mayya Y. D., Kembhavi A. K., Pand ey S. K., 2005, AJ, 129, 630
- Berentzen et al. (2003) Berentzen I., Athanassoula E., Heller C. H., Fricke K. J., 2003, MNRAS, 341, 343
- Bournaud et al. (2005) Bournaud F., Combes F., Semelin B., 2005, MNRAS, 364, L18
- Buta (2013) Buta R. J., 2013, Galaxy Morphology. p. 1, doi:10.1007/978-94-007-5609-0_1
- Buta & Block (2001) Buta R., Block D. L., 2001, ApJ, 550, 243
- Buta et al. (2005) Buta R., Vasylyev S., Salo H., Laurikainen E., 2005, AJ, 130, 506
- Carollo et al. (2007) Carollo C. M., Scarlata C., Stiavelli M., Wyse R. F. G., Mayer L., 2007, ApJ, 658, 960
- Charmandaris & Mirabel (1997) Charmandaris V., Mirabel F., 1997, in Hadjidemetrioy J. D., Seiradakis J. H., eds, Joint European and National Astronomical Meeting. p. 185
- Combes & Elmegreen (1993) Combes F., Elmegreen B. G., 1993, A&A, 271, 391
- Combes & Sanders (1981) Combes F., Sanders R. H., 1981, A&A, 96, 164
- D’Onghia et al. (2008) D’Onghia E., Mapelli M., Moore B., 2008, MNRAS, 389, 1275
- Debattista et al. (2006) Debattista V. P., Mayer L., Carollo C. M., Moore B., Wadsley J., Quinn T., 2006, ApJ, 645, 209
- Díaz-García et al. (2016) Díaz-García S., Salo H., Laurikainen E., 2016, A&A, 596, A84
- Elmegreen & Elmegreen (2006) Elmegreen D. M., Elmegreen B. G., 2006, ApJ, 651, 676
- Erwin (2005) Erwin P., 2005, MNRAS, 364, 283
- Eskridge et al. (2000) Eskridge P. B., et al., 2000, AJ, 119, 536
- Fiacconi et al. (2012) Fiacconi D., Mapelli M., Ripamonti E., Colpi M., 2012, MNRAS, 425, 2255
- Fisher & Drory (2008) Fisher D. B., Drory N., 2008, AJ, 136, 773
- Fosbury & Hawarden (1977) Fosbury R. A. E., Hawarden T. G., 1977, MNRAS, 178, 473
- Gadotti (2011) Gadotti D. A., 2011, MNRAS, 415, 3308
- Gadotti et al. (2007) Gadotti D. A., Athanassoula E., Carrasco L., Bosma A., de Souza R. E., Recillas E., 2007, MNRAS, 381, 943
- Garcia-Gómez et al. (2017) Garcia-Gómez C., Athanassoula E., Barberà C., Bosma A., 2017, A&A, 601, A132
- Hernquist & Weil (1993) Hernquist L., Weil M. L., 1993, MNRAS, 261, 804
- Herrera-Endoqui et al. (2015) Herrera-Endoqui M., Díaz-García S., Laurikainen E., Salo H., 2015, A&A, 582, A86
- Higdon (1996) Higdon J. L., 1996, ApJ, 467, 241
- Higdon et al. (2015) Higdon J. L., Higdon S. J. U., Martín Ruiz S., Rand R. J., 2015, ApJ, 814, L1
- Horellou & Koribalski (2003) Horellou C., Koribalski B., 2003, Ap&SS, 284, 499
- Horellou et al. (1995) Horellou C., Casoli F., Combes F., Dupraz C., 1995, A&A, 298, 743
- Jarrett et al. (2003) Jarrett T. H., Chester T., Cutri R., Schneider S. E., Huchra J. P., 2003, AJ, 125, 525
- Jogee et al. (2004) Jogee S., et al., 2004, ApJ, 615, L105
- Korchagin et al. (2001) Korchagin V., Mayya Y. D., Vorobyov E., 2001, ApJ, 554, 281
- Kormendy & Kennicutt (2004) Kormendy J., Kennicutt Robert C. J., 2004, ARA&A, 42, 603
- Kraljic et al. (2012) Kraljic K., Bournaud F., Martig M., 2012, ApJ, 757, 60
- Kruk et al. (2018) Kruk S. J., et al., 2018, MNRAS, 473, 4731
- Laurikainen et al. (2005) Laurikainen E., Salo H., Buta R., 2005, MNRAS, 362, 1319
- Laurikainen et al. (2007) Laurikainen E., Salo H., Buta R., Knapen J. H., 2007, MNRAS, 381, 401
- Lintott et al. (2008) Lintott C. J., et al., 2008, MNRAS, 389, 1179
- Lynds & Toomre (1976) Lynds R., Toomre A., 1976, ApJ, 209, 382
- Madore et al. (2009) Madore B. F., Nelson E., Petrillo K., 2009, ApJS, 181, 572
- Mapelli & Mayer (2012) Mapelli M., Mayer L., 2012, MNRAS, 420, 1158
- Mapelli & Moore (2008) Mapelli M., Moore B., 2008, Astronomische Nachrichten, 329, 948
- Marcum et al. (1992) Marcum P. M., Appleton P. N., Higdon J. L., 1992, ApJ, 399, 57
- Marinova & Jogee (2007) Marinova I., Jogee S., 2007, ApJ, 659, 1176
- Masters et al. (2012) Masters K. L., et al., 2012, MNRAS, 424, 2180
- Mayya et al. (2005) Mayya Y. D., Bizyaev D., Romano R., Garcia-Barreto J. A., Vorobyov E. I., 2005, ApJ, 620, L35
- McGaugh & Schombert (2014) McGaugh S. S., Schombert J. M., 2014, AJ, 148, 77
- Menéndez-Delmestre et al. (2007) Menéndez-Delmestre K., Sheth K., Schinnerer E., Jarrett T. H., Scoville N. Z., 2007, ApJ, 657, 790
- Pellerin et al. (2010) Pellerin A., Meurer G. R., Bekki K., Elmegreen D. M., Wong O. I., Knezek P. M., 2010, AJ, 139, 1369
- Peng et al. (2002) Peng C. Y., Ho L. C., Impey C. D., Rix H.-W., 2002, AJ, 124, 266
- Peng et al. (2010) Peng C. Y., Ho L. C., Impey C. D., Rix H.-W., 2010, AJ, 139, 2097
- Persson et al. (1998) Persson S. E., Murphy D. C., Krzeminski W., Roth M., Rieke M. J., 1998, AJ, 116, 2475
- Pfenniger & Norman (1990) Pfenniger D., Norman C., 1990, ApJ, 363, 391
- Renaud et al. (2018) Renaud F., et al., 2018, MNRAS, 473, 585
- Sandage (2005) Sandage A., 2005, ARA&A, 43, 581
- Sérsic (1963) Sérsic J. L., 1963, Boletin de la Asociacion Argentina de Astronomia La Plata Argentina, 6, 41
- Shen & Sellwood (2004) Shen J., Sellwood J. A., 2004, ApJ, 604, 614
- Sheth et al. (2012) Sheth K., Melbourne J., Elmegreen D. M., Elmegreen B. G., Athanassoula E., Abraham R. G., Weiner B. J., 2012, ApJ, 758, 136
- Skibba et al. (2012) Skibba R. A., et al., 2012, MNRAS, 423, 1485
- Struck (2010) Struck C., 2010, MNRAS, 403, 1516
- Struck-Marcell & Lotan (1990) Struck-Marcell C., Lotan P., 1990, ApJ, 358, 99
- Struck et al. (1996) Struck C., Appleton P. N., Borne K. D., Lucas R. A., 1996, AJ, 112, 1868
- Telesco & Gezari (1992) Telesco C. M., Gezari D. Y., 1992, ApJ, 395, 461
- Theys & Spiegel (1976) Theys J. C., Spiegel E. A., 1976, ApJ, 208, 650
- Theys & Spiegel (1977) Theys J. C., Spiegel E. A., 1977, ApJ, 212, 616
- Vika et al. (2013) Vika M., Bamford S. P., Häußler B., Rojas A. L., Borch A., Nichol R. C., 2013, MNRAS, 435, 623
- Vorobyov & Bizyaev (2001) Vorobyov E. I., Bizyaev D., 2001, A&A, 377, 835
- Weinzirl et al. (2009) Weinzirl T., Jogee S., Khochfar S., Burkert A., Kormendy J., 2009, ApJ, 696, 411
- Whyte et al. (2002) Whyte L. F., Abraham R. G., Merrifield M. R., Eskridge P. B., Frogel J. A., Pogge R. W., 2002, MNRAS, 336, 1281
- Willett et al. (2013) Willett K. W., et al., 2013, MNRAS, 435, 2835
- Wolter et al. (2019) Wolter A., Consolandi G., Longhetti M., Land oni M., Bianco A., 2019, in Oskinova L. M., Bozzo E., Bulik T., Gies D. R., eds, IAU Symposium Vol. 346, IAU Symposium. pp 297–306, doi:10.1017/S1743921319001157
- Wong et al. (2006) Wong O. I., et al., 2006, MNRAS, 370, 1607
- Wozniak et al. (1995) Wozniak H., Friedli D., Martinet L., Martin P., Bratschi P., 1995, A&AS, 111, 115
- Yuan et al. (2020) Yuan T., et al., 2020, arXiv e-prints, p. arXiv:2005.11880
- Zou et al. (2014) Zou Y., Shen J., Li Z.-Y., 2014, ApJ, 791, 11
- Zwicky (1941) Zwicky F., 1941, Hydrodynamics and the Structure of Stellar Systems. p. 137
- de Vaucouleurs (1963) de Vaucouleurs G., 1963, ApJS, 8, 31