An application of a solar-type dynamo model for Eridani
Abstract
During the last decade, the relation between activity cycle periods with stellar parameters has received special attention. The construction of reliable registries of activity reveals that solar type stars exhibit activity cycles with periods from few years to decades and, in same cases, long and short activity cycles coexist suggesting that two dynamos could operate in these stars. In particular, Eridani is an active young K2V star (0.8 Gyr), which exhibits a short and long-term chromospheric cycles of 3 and 13-yr periods. Additionally, between 1985 and 1992, the star went through a broad activity minimum, similar to the solar Maunder Minimum-state.
Motivated by these results, we found in Eridani a great opportunity to test the dynamo theory. Based on the model developed in Sraibman & Minotti (2019), in this work we built a non linear axisymmetric dynamo for Eridani. The time series of the simulated magnetic field components near the surface integrated in all the stellar disc exhibits both the long and short-activity cycles with periods similar to the ones detected from observations and also time intervals of low activity which could be associated to the broad Minimun. The short activity cycle associated to the magnetic reversal could be explained by the differential rotation, while the long cycle is associated to the meridional mass flows induced by the Lorentz force. In this way, we show that a single non-linear dynamo model derived from first principles with accurate stellar parameters could reproduce coexisting activity cycles.
keywords:
stars: activity – stars:magnetic fields – stars: individual: Eridani-HD 22049 .1 Introduction
Stellar activity cycles, similar to the solar one, have been observed in several solar-type stars Baliunas et al. (1995); Messina & Guinan (2002); Gomes da Silva et al. (2014) and even in few dM stars Díaz et al. (2007); Buccino et al. (2011, 2014); Ibañez Bustos et al. (2019).
The dynamo is the most accepted theory to model the mean magnetic field in cyclic late F to early M stars (e.g. Durney & Robinson (1982); Lorente & Montesinos (2005)). Driven by differential rotation (-effect) and turbulent convection (-effect) in the stellar interior, this model predicts a strong correlation between activity and rotation. The dynamo was first invoked to model solar magnetic activity (e.g. Parker (1955, 1963); Steenbeck & Krause (1969)). However, the physical origin of solar activity is more complex than the one suggested by these earlier models (e.g. Choudhuri et al. (1995); Dikpati & Charbonneau (1999); Jouve & Brun (2007); Rempel (2006); Passos et al. (2014, 2015); Miesch & Teweldebirhan (2016); Hazra & Choudhuri (2017); Lemerle & Charbonneau (2017)).
The Mount Wilson survey has provided relevant works which document the relation between stellar activity: level of activity, cycle period, etc. and fundamental stellar parameters: mass, rotation period, luminosity, age, convection, etc. (e.g. Noyes et al. (1984); Soderblom et al. (1991); Soon et al. (1993); Donahue et al. (1996); Brandenburg et al. (1998); Saar & Brandenburg (1999)). In particular, Brandenburg et al. (1998) selected a set of cyclic stars with well-determined rotation and activity periods. They explored the non-dimensional relationships between the activity cycle period , the rotational period with different parameters. These relations reveal two different sequences, called the A-branch, as primarily active stars belong to this branch, and the I-branch for the inactive stars which crowd this sequence. Both parallel branches with positive slopes are separated by a factor of 6 in diagrams. Furthermore, Saar & Brandenburg (1999) expanded this previous work for further active and older stars. They confirmed the bimodal distribution observed in Brandenburg et al. (1998) for stars older than 0.1 Gyr and detected that the most active stars populate a third branch with negative slope, called superactive. In particular, they detected that a set of young stars older than 1 Gyr of the active and inactive group present activity cycles in both sequences. The long cycle falls on the A-branch, while the short cycle, considered as a secondary cycle, on the inactive (I) branch. A possible interpretation to this bimodal distribution is that the -effect is an increasing function of magnetic field strength on the active and inactive branches (known as anti-quenching -effect), while for larger magnetic fields the quenching effect is present as observed in the superactive branch Saar & Brandenburg (1999).
Böhm-Vitense (2007) explored the relation between and for a set of dF and dG of the sample analyzed in Saar & Brandenburg (1999) and Lorente & Montesinos (2005). The advantage of the - diagram is that it only depends on observational measurements, independent of stellar models. Two sequences (active and inactive) as first suggested in Brandenburg et al. (1998) are evident in this diagram. A tentative interpretation provided by Böhm-Vitense (2007) is that a dynamo operating near the surface could be generating the longer cycle, while a a second dynamo operating in the deep convection zone could be responsible for the shorter one. She also suggests that both dynamos could work simultaneously, responsible for the co-existing long and short activity cycles detected in several stars Saar & Brandenburg (1999); Metcalfe et al. (2013); Flores et al. (2017); Egeland et al. (2015). Strugarek et al. (2018) addresses the two-branches subject with stellar dynamo models. They performed 3D MHD simulations varying the rotation rate and luminosity of a set of modeled solar-like convective envelopes. They detected both primary and secondary cycles on experiments, when the local Rossby number () is lower than 1. However, recently Boro Saikia et al. (2018) expanded the sample analyzed by Böhm-Vitense (2007), including stars with less precisely determined activity cycles. They concluded that stars can lie in the region intermediate between the active and inactive branch, putting in doubt a bimodal distribution.
Furthermore, Böhm-Vitense (2007)’s work brings up the controversial fact that the Sun lies between both branches in diagram. Recently, Brandenburg et al. (2017) compiled all new and previous observations of stellar activity and confirmed that long and short stellar cycles tend to fall on one of two universal branches and concluded that all stars younger than 2.3 Gyr are capable of exhibiting simultaneously longer and shorter cycle periods. Furthermore, the Sun does not lie between this new two branches.
To interpret the solar activity in a stellar context, van Saders et al. (2016) analyzed Kepler photometric data which allow them to build a reliable rotation-age relation for stars older than the Sun, where they found that beyond middle-age the efficiency of magnetic braking is dramatically reduced. Combining these data with chromospheric activity indicators, Metcalfe et al. (2016) show that the activity level continues to decrease with a smooth evolution of the rotation rate. Therefore, they conclude that the Sun could be in a transitional evolutionary phase which place it between both active and inactive branches. They suggest that the Sun might represent a special case of stellar dynamo theory. However, Strugarek et al. (2017) normalized Böhm-Vitense (2007)’s diagram with the stellar luminosity and observed that the Sun fit the same trend that solar-type stars. Therefore, these observations reinstate the Sun to the status of an ordinary solar-type star. The discussion is still open, without certainties on whether the Sun is in a transitional phase or not.
In particular, Eridani (HD 22049) is an active young K2V star (0.8 Gyr), which has been characterized as an exoplanet host star (e.g. Anglada-Escudé & Butler (2012)). Eridani is one of the nearest and brightest stars in the sky, extensively observed, thus it provides an opportunity to constrain stellar dynamo theory. In this sense, Metcalfe et al. (2013) built a registry of activity of 45-year span for this star by combining the Mount Wilson indexes obtained from different observatories. This time-series is a unique registry of stellar activity, beyond the Sun. It shows two coexisting 3-year and 13-year activity cycles and a broad activity minimum between 1985 and 1992 that resembles a Maunder minimum-like state. Both activity cycle periods detected belong to the active and inactive branches of Bohm-Vitense’s diagram. All these facts make Eridani an ideal target to test the dynamo theory.
To take a different approach to this discussion, we apply the dynamo model developed in Sraibman & Minotti (2019) to the active cool star Eridani and we analyzed if a solar-type dynamo model could reproduce both activity cycles reported by Metcalfe et al. (2013).
In section §2, we review the main characteristic of the dynamo model employed in this work. In section §3, we show the magnetic field maps derived from this model and, also, the evolution of the coefficient and the induced meridional velocity field. In section §4 we analyze the long-term magnetic activity of this star through a magnetic activity proxy defined in this work and summarize our main conclusions.
2 A non-linear dynamo model
Here we consider a 2-D axisymmetric dynamo model coupled with dynamic equations describing the back reaction of the magnetic field on the mass flow. The model, developed, and tested for the case of the Sun, in Sraibman & Minotti (2016, 2019), determines the and diffusivity tensors in terms of the large-scale fields, using a novel technique for deriving large-scale equations directly from the original equations, employing only first principles (Minotti (2000)). This technique leads to the separation of the problem into three scales: large scales resolved by the numerical procedure, intermediate scales whose dynamic effect on the resolved scales is modeled by the mentioned technique, and microscales that are described separately by simpler models.
The stellar parameters of Eridani were obtained from Gai et al. (2008). These data were employed in the stellar model developed by Eggleton (1971) to compute the density in the stellar interior, the tachocline depth and width. To do so, we employed the public code EZ Web111http://www.astro.wisc.edu/ townsend/.
One of the main ingredients of our model is the parametrization of the differential rotation. In particular, the surface differential rotation period of Eridani has already been determined from MOST222Microvariability and Oscillations of STars microsatellite photometric data in Croll et al. (2006):
| (1) |
where = 11.20 days, = and is the latitude.
We assume a solar-type differential rotation in the convective layer given by:
| (2) |
where is the rotation of the core (), is the tachocline width(=0.05), is the tachocline radius in Eridani (see Fig. 1) and is the error function.
The tachocline radius and its width were derived with the Eggleton (1971)’s model, these values are closed to ones derived by Gai et al. (2008) from asteroseismic observations. The rotation of the core is proportional to the solar one considering the relation between the solar and stellar rotation periods and radii.
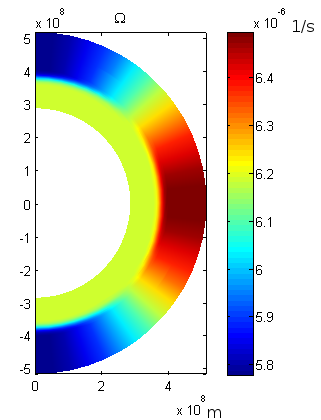
In Sraibman et al. (2017), we first built a kinematic dynamo model with the parameters above for Eridani based on Sraibman & Minotti (2016), but we could only reproduce the short cycle. In the present work we adopt the model developed in Sraibman & Minotti (2019), where magnetic feedback on the mass flow was included.
In Sraibman et al. (2017) the coefficient was derived in terms of the radial cylindrical component of the mean vorticity :
| (3) |
where , is spherical polar angle, is the large-scale length ( for Eridani) and is an adjustable constant between 0 and 1.
In Sraibman & Minotti (2019) the coefficient is composed of two main additive contributions and :
| (4) |
where the base contribution to comes from the differential rotation, for the axisymmetric case considered:
| (5) |
with given by Eq. 2.
The term is related to the vorticity component of the flow generated by the feedback effect:
| (6) |
with given by
where the -axis coincides with the direction of the stellar rotational axis, and are the average velocity field components in the radial cylindrical direction and the z-direction respectively.
3 Results
We perform a simulation of more than 1500 yrs starting with zero meridional velocity and a small dipolar magnetic field (0.01 nT). We discard the first 200 yrs of simulation during which the magnetic field reaches the permanent regime.
In Fig. 2 and Fig. 3 we plot the components of the magnetic field derived from the model described. The top and middle panels show the poloidal components as function of latitude and time just below the surface, and just above the tachocline, respectively. The bottom panel presents the toroidal component as function of latitude and time at and at .
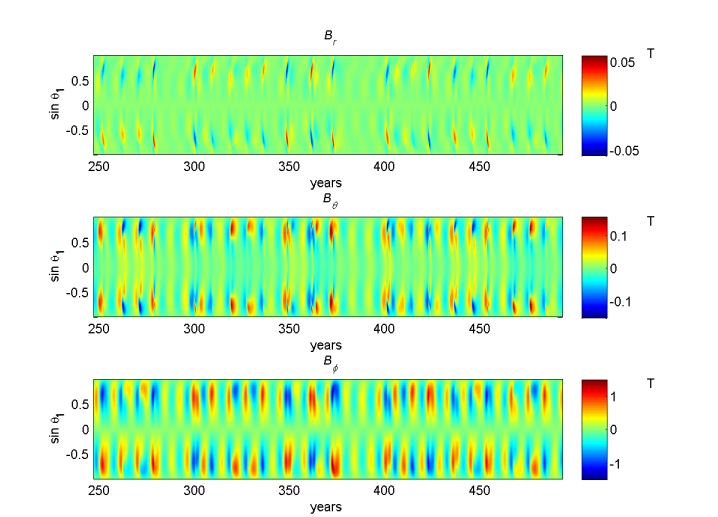
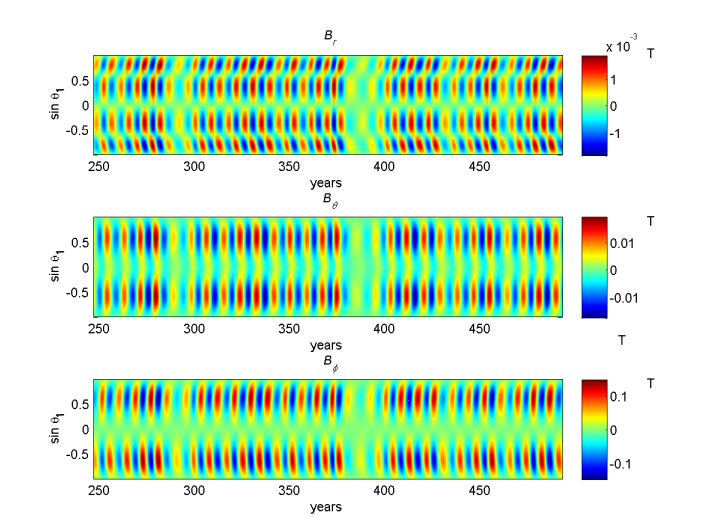
The large-scale magnetic field presents a topology similar to the solar one. In particular, the amplitude of just above the tachocline is about 10 T, and 0.1 T near the surface. Also, near the tachocline the toroidal field shows a shift of its maximum magnitude from middle latitudes towards the poles as the cycle advances, and the radial field also shows a poleward migration at high latitudes (Fig. 3). Additionally, there is a phase lag between the maxima (and equivalently of the minima) of and leading to a negative correlation between them, consistent with a solar-type dynamo (see Charbonneau (2010)).
From visual inspection, we see the polarity reversals in the toroidal components of the magnetic field every 4 years, approximately, and also that the amplitude of each component is modulated with a decadal periodic signal. This decadal variation is more evident in the radial component in the upper panel in Fig. 2, where we see consecutive maxima at 262 and 271.5 years or at 437 and 446.5 years. Furthermore, a time interval of very low activity, similar to grand minima, are present in all the magnetic field components between 286 and 300 years and between 383 and 400 years.
To quantify this variation, we search for a magnetic proxy derived from the simulated magnetic fields. To do so, we followed the well-known long-term analysis performed from solar observations (see Hathaway (2015) and references therein). For instance, several researchers consider the entire solar magnetic field on the solar disk to be a proxy for the generation of solar irradiance (Ball et al. (2012)) or as the main proxy defining the whole picture of the solar activity as observed both in time and in latitudes (Zharkova et al. (2012)). In fact, the solar activity cycle is reflected in both the poloidal and toroidal magnetic field components (Choudhuri et al. (2007); Charbonneau (2010); Shepherd et al. (2014)). In this sense, we define an activity index in terms of the projection along the line of sight of the three components of the magnetic field near the surface (Fig. 2), integrated over the stellar surface (taking also into account the projection along the line of sight of the surface element):
| (7) |
where ; , with the angle between the axis and the direction of observation and is the polar angle. Following Croll et al. (2006) we take for Eridani, 30. The function , given by
| (8) |
takes account of the projection along the line of sight of the area element.
We remark that is not a unique activity indicator to perform this analysis. In particular, the Stokes profile is proportional to this index and it can be closely related to the magnetic features observed in the stellar surface.
In Fig. 4 we plot the resulting time series of the index. We observe a short-term activity cycle modulated by a longer one and a broad minimum of 25 year length at yr, while the short activity cycle is still present. Similarly, a decay of activity of only 13-year length is also observed between 286 and 299 yr. Since this is a 2D model, we do not observe signs of rotational modulation in the time series. Nevertheless in real observations of activity proxies, short-term variations due to stellar rotation and instrumental noise are also present in the series.
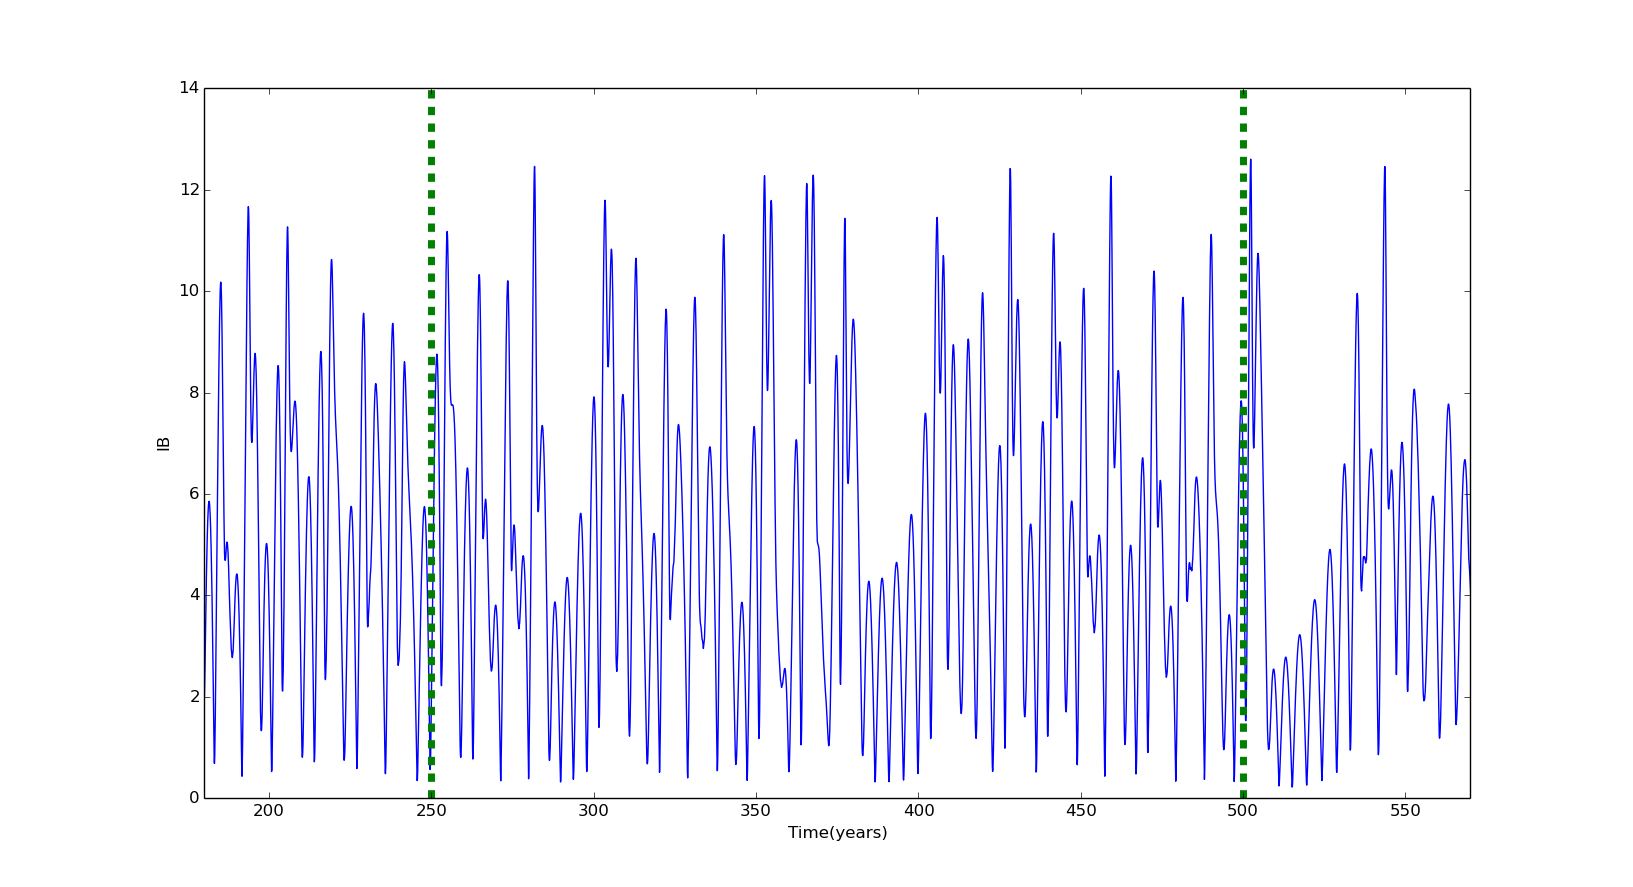
To properly quantify the variations of the index, we analyzed the full series with the GLS periodogram (Zechmeister & Kürster (2009)).
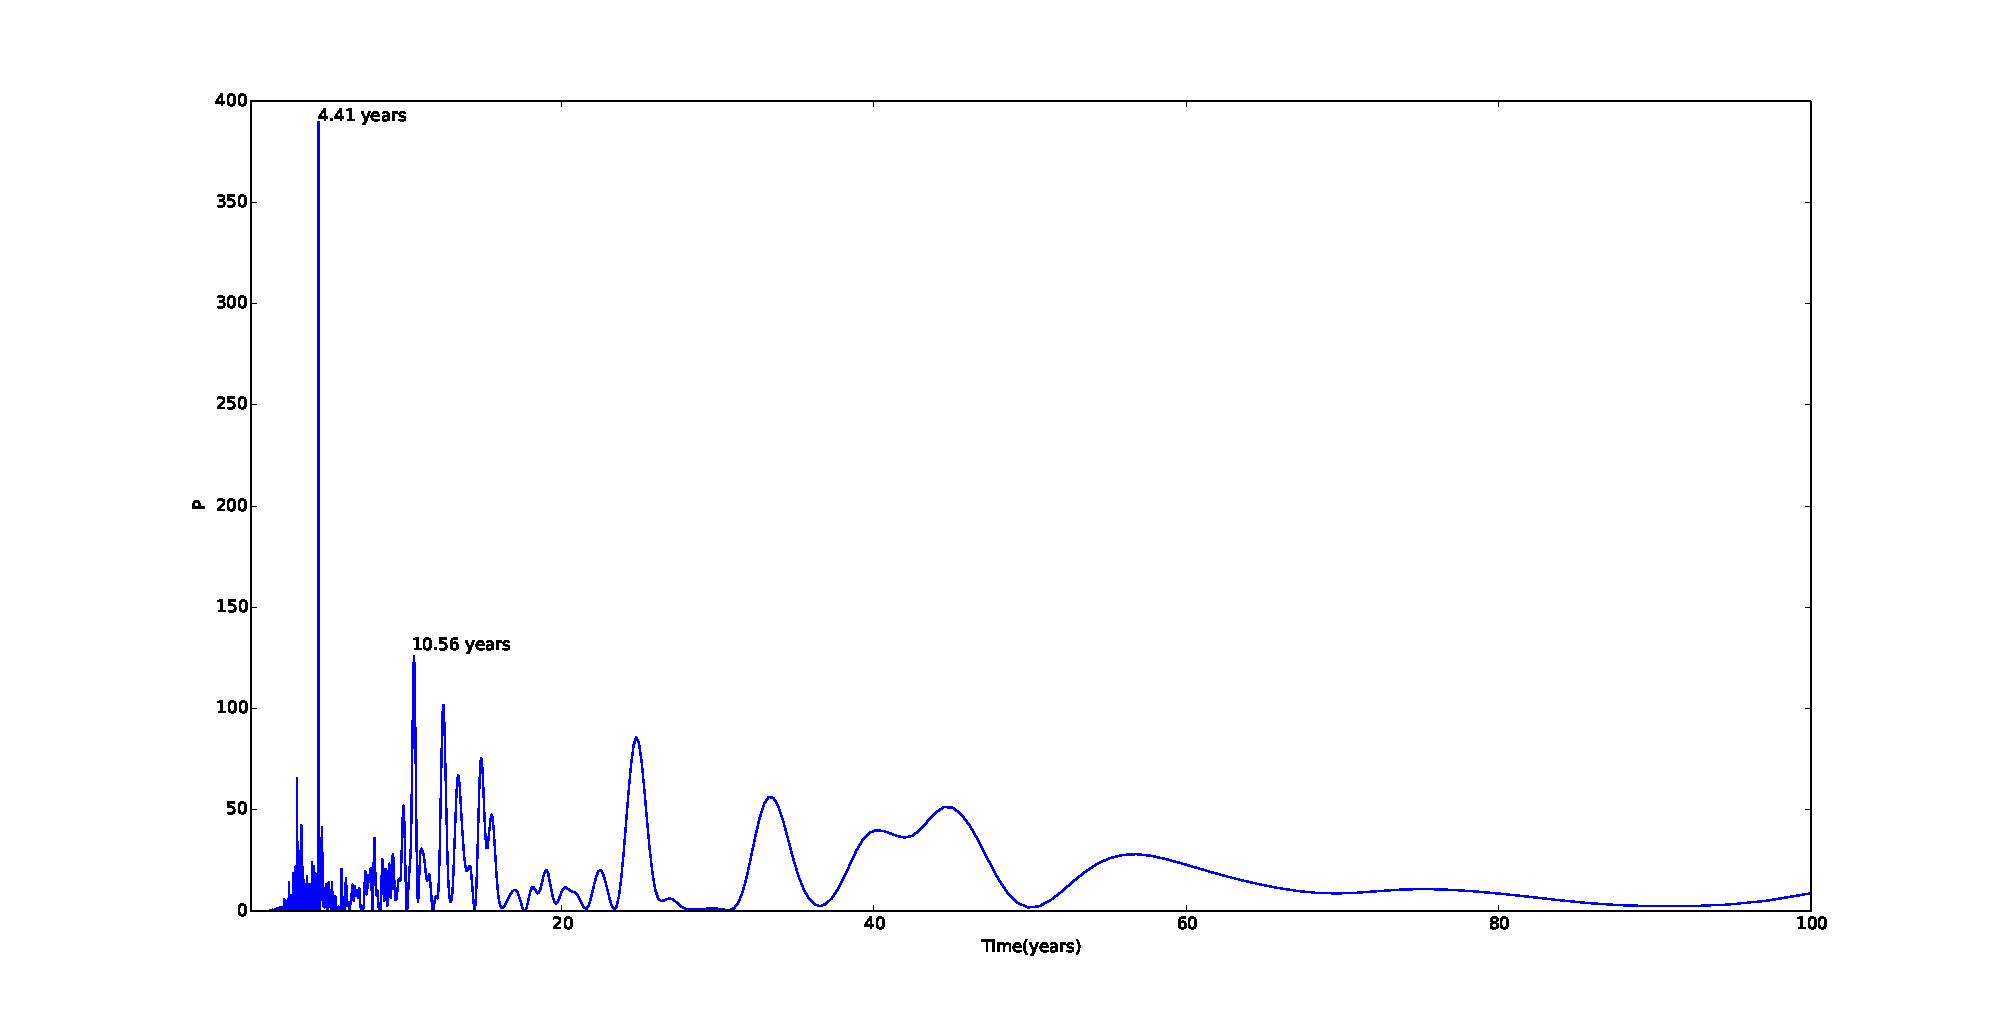
In Fig. 5 we detected the most significant peak at 4.41 years and another significant peak at 10.56 years. All these periodic patterns are also observed in the -effect. As mentioned above the -effect is proportional to the cylindrical radial component of the vorticity of the flow. The contribution comes from the differential rotation, while the induced meridional flow contributes the part (see Eq.4 and Eq. 6).
In Fig. 6 we plot both components ( ) of the coefficient in the stellar interior as function of time at latitude 30 where the first spots usually emerge during the solar cycle. The coefficient is constant in time (see Eq. 4) and located mainly about the tachocline, while the -coefficient varies in time (see Eq. 6) and has its higher magnitude near the surface. We remark that for Eridani both coefficients are of the same order of magnitude. A decadal cyclic pattern, similar to the longer activity cycle, is observed in the intensity of the coefficient, most evident in the stellar surface. Furthermore, in Fig. 6 this pattern is interrupted in the intervals between 281 and 298 years and between 374 and 400 years, this long decay of the coefficient seems to be correlated with the broad minimum also observed in the -series at 286-299 years the intervals and 375-400 years respectively .

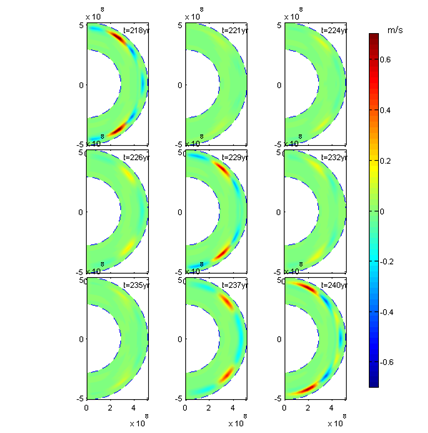
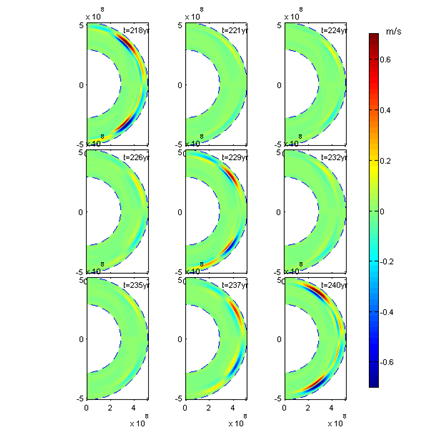
In Fig. 7 we plot the radial and poloidal (i.e. ) components of the induced meridional velocity during 22 years, with a a 2.5-yr sampling. We selected an arbitrary time, t=218 yr, after a few hundred years of simulated time. Both components of the meridional flow are not null near the surface and each pattern presents a decadal cyclical variation .
In particular, near the maxima (), the radial component indicates downstream flows near the equator and at low latitudes, and upstream flows at middle latitudes in both hemispheres, a behaviour opposite to the solar case.
Given both the radial and poloidal components, we reconstruct a unique cell of clockwise (counterclockwise) circulation in the northern (southern) hemisphere, contrary to the solar case (e.g. González Hernández et al. (2006); Hathaway & Rightmire (2010); Sraibman & Minotti (2019)). Furthermore, during maxima, a second cell is also present near the poles with counterclockwise and clockwise circulation at northern and southern hemispheres, respectively.
4 Discussion
During the last decade, high-cadence observations, which allow the detection of short activity cycles (e.g. Metcalfe et al. (2010); Mittag et al. (2019)), the assembly of different stellar activity measurements, which allows to build long reliable activity series (e.g. Metcalfe et al. (2013); Egeland et al. (2017); Soon et al. (2019)) and advances in time-series techniques (e. g. Zechmeister & Kürster (2009); Mortier et al. (2015); Olspert et al. (2018)) have led to a revision of the magnetic activity in solar-type stars.
Many of these works have paid special attention to the relation between stellar activity cycles and the stellar rotation rate (e.g. Böhm-Vitense (2007); Oláh et al. (2009); Barnes & Kim (2010); Metcalfe et al. (2016)). One of the most attractive points is that, given a stellar rotation period, the activity cycle period could be distributed in two distinct branches, as first invoked in Brandenburg et al. (1998).
The analysis and discussion on this bimodal distribution have been addressed either from observations, dynamo models or statistical analysis (e.g. Metcalfe et al. (2016); Metcalfe & van Saders (2017); See et al. (2016); Brandenburg et al. (2017); Strugarek et al. (2017, 2018); Boro Saikia et al. (2018)).
In this work, we take a new approach to this discussion. We built a non-linear axisymmetric dynamo model of a single K2V star Eridani. The fact that Eridani has been widely observed by different programs allows Metcalfe et al. (2013) to build one of the most reliable and extended registry of stellar activity. The analysis of this series reveals two simultaneous activity cycles of 3- and 13-year period and a broad minimum of activity of 7 year-length which resembles the solar Maunder Minimum. All these features make Eridani a unique star to analyze both simultaneous activity cycles from the point of the dynamo theory. Furthermore, several stellar parameters of Eridani are well-determined from accurate observations. The stellar surface differential rotation derived in Croll et al. (2006) and the internal structure obtained from seismic analysis in Gai et al. (2008), both from MOST photometry, allow us to obtain precise parameters for our dynamo model, based on the model developed in Sraibman & Minotti (2019) for the Sun.
We derived the large-scale magnetic field geometry of the young active K dwarf Eridani over decades. To compare our simulations with magnetic field observations, we should remark that the visible magnetic field of our model is composed by the simulated and components at the surface as the model does not include the emergence mechanism of the toroidal component to the stellar surface. In this sense both components projected along the line of sight and averaged over the stellar surface reaches maxima between 0.022 and 0.027 T and also exhibits a short cyclic variation, in agreement with Lehmann et al. (2015). Furthermore, the mean T and T which are of the same of order of the magnetic field derived by Jeffers et al. (2014) from ZDI observations.
Nevertheless, to properly compare the evolution of the simulated magnetic fields with the Mount Wilson series built in Metcalfe et al. (2013), we defined an index of activity related to the line-of-sight component of the total magnetic field near the surface, integrated in the full disc. The resulting time-series, analyzed with a periodogram technique, reveals a short activity cycle 4-year period coexisting with a longer one of 11 years, in agreement with Metcalfe et al. (2013). Furthermore, the model also reproduces low stellar activity phases, similar to the one registered between 1985 and 1992 by the authors. Nevertheless, the simulated short activity cycle is still present during the activity minima, but it seems to be absent in the observations.
Our model reveals that the short activity cycle could be reproduced with an axisymmetric dynamo model without feedback, outlined in Sraibman et al. (2017) and in Sraibman & Minotti (2016) for the solar case. This short cycle associated to the toroidal magnetic fields reversals is driven by the differential rotation. In the present work we found that the long activity cycle and the activity minima are related to the meridional mass flows induced by the Lorentz force. This last phenomenon is evident near the stellar surface in the simulated meridional velocity component and the -effect.
While Böhm-Vitense (2007) assigns the long cycle to a dynamo operating near the surface and the short cycle to a second co-existing dynamo near the tachocline and Brandenburg et al. (2017) concluded that all stars younger than 2.3 Gyr sustain both dynamos, we found that a single non-linear axisymmetric dynamo could reproduce both long and short activity cycles. In agreement with the former works our model reveals that the long activity cycle of the young star Eridani (0.8 Gyr) is evident in the stellar surface (See Fig. 6 and Fig. 7) and the short activity cycle in the bottom of the convection zone.
Furthermore, our simulations on this particular star reproduce the field magnitudes obtained from a global MHD model developed in Strugarek et al. (2018) for a grid of stellar parameters. Also the same study suggests that stars with Rossby number between 0.25 and 1 could present a short and long coexisting activity cycles, and Eridani is in this range with a (See et al. (2016)).
Therefore we conclude that a complete non-linear axisymmetric dynamo model, as the one presented in this work could be a reasonable approximation of a realistic dynamics of the stellar magnetic field in solar-type stars. Given accurate stellar parameters, this model is a useful tool to analyze their long-term activity. In particular, it could reproduce both the long and short activity cycles in Eridani with results similar to those of previous works.
Acknowledgements
We acknowledge the Consejo Nacional de Investigaciones Científicas y Técnicas (CONICET) and the University of Buenos Aires for institutional support.
Data Availability
The data underlying this article will be shared on reasonable request to the corresponding author.
References
- Anglada-Escudé & Butler (2012) Anglada-Escudé G., Butler R. P., 2012, ApJS, 200, 15
- Baliunas et al. (1995) Baliunas S. L., et al., 1995, ApJ, 438, 269
- Ball et al. (2012) Ball W. T., Unruh Y. C., Krivova N. A., Solanki S., Wenzler T., Mortlock D. J., Jaffe A. H., 2012, A&A, 541, A27
- Barnes & Kim (2010) Barnes S. A., Kim Y.-C., 2010, ApJ, 721, 675
- Böhm-Vitense (2007) Böhm-Vitense E., 2007, ApJ, 657, 486
- Boro Saikia et al. (2018) Boro Saikia S., et al., 2018, A&A, 616, A108
- Brandenburg et al. (1998) Brandenburg A., Saar S. H., Turpin C. R., 1998, ApJ, 498, L51
- Brandenburg et al. (2017) Brandenburg A., Mathur S., Metcalfe T. S., 2017, ApJ, 845, 79
- Buccino et al. (2011) Buccino A. P., Díaz R. F., Luoni M. L., Abrevaya X. C., Mauas P. J. D., 2011, AJ, 141, 34
- Buccino et al. (2014) Buccino A. P., Petrucci R., Jofré E., Mauas P. J. D., 2014, ApJ, 781, L9
- Charbonneau (2010) Charbonneau P., 2010, LRSP, 7, 3
- Choudhuri et al. (1995) Choudhuri A. R., Schussler M., Dikpati M., 1995, A&A, 303, L29
- Choudhuri et al. (2007) Choudhuri A. R., Chatterjee P., Jiang J., 2007, Phys. Rev. Lett., 98, 131103
- Croll et al. (2006) Croll B., et al., 2006, ApJ, 648, 607
- Díaz et al. (2007) Díaz R. F., González J. F., Cincunegui C., Mauas P. J. D., 2007, A&A, 474, 345
- Dikpati & Charbonneau (1999) Dikpati M., Charbonneau P., 1999, ApJ, 518, 508
- Donahue et al. (1996) Donahue R. A., Saar S. H., Baliunas S. L., 1996, ApJ, 466, 384
- Durney & Robinson (1982) Durney B. R., Robinson R. D., 1982, ApJ, 253, 290
- Egeland et al. (2015) Egeland R., Metcalfe T. S., Hall J. C., Henry G. W., 2015, ApJ, 812, 12
- Egeland et al. (2017) Egeland R., Soon W., Baliunas S., Hall J. C., Henry G. W., 2017, in Nandy D., Valio A., Petit P., eds, IAU Symposium Vol. 328, Living Around Active Stars. pp 329–337 (arXiv:1704.02388), doi:10.1017/S1743921317004173
- Eggleton (1971) Eggleton P. P., 1971, MNRAS, 151, 351
- Flores et al. (2017) Flores M. G., Buccino A. P., Saffe C. E., Mauas P. J. D., 2017, MNRAS, 464, 4299
- Gai et al. (2008) Gai N., Bi S.-L., Tang Y.-K., 2008, Chinese J. Astron. Astrophys., 8, 591
- Gomes da Silva et al. (2014) Gomes da Silva J., Santos N. C., Boisse I., Dumusque X., Lovis C., 2014, A&A, 566, A66
- González Hernández et al. (2006) González Hernández I., Komm R., Hill F., Howe R., Corbard T., Haber D. A., 2006, ApJ, 638, 576
- Hathaway (2015) Hathaway D. H., 2015, Living Reviews in Solar Physics, 12, 4
- Hathaway & Rightmire (2010) Hathaway D. H., Rightmire L., 2010, Sci, 327, 1350
- Hazra & Choudhuri (2017) Hazra G., Choudhuri A. R., 2017, MNRAS, 472, 2728
- Ibañez Bustos et al. (2019) Ibañez Bustos R. V., Buccino A. P., Flores M., Martinez C. I., Maizel D., Messina S., Mauas P. J. D., 2019, MNRAS, 483, 1159
- Jeffers et al. (2014) Jeffers S. V., Petit P., Marsden S. C., Morin J., Donati J. F., Folsom C. P., 2014, A&A, 569, A79
- Jouve & Brun (2007) Jouve L., Brun A. S., 2007, A&A, 474, 239
- Lehmann et al. (2015) Lehmann L. T., Künstler A., Carroll T. A., Strassmeier K. G., 2015, Astronomische Nachrichten, 336, 258
- Lemerle & Charbonneau (2017) Lemerle A., Charbonneau P., 2017, ApJ, 834, 133
- Lorente & Montesinos (2005) Lorente R., Montesinos B., 2005, ApJ, 632, 1104
- Messina & Guinan (2002) Messina S., Guinan E. F., 2002, A&A, 393, 225
- Metcalfe & van Saders (2017) Metcalfe T. S., van Saders J., 2017, Sol. Phys., 292, 126
- Metcalfe et al. (2010) Metcalfe T. S., Basu S., Henry T. J., Soderblom D. R., Judge P. G., Knölker M., Mathur S., Rempel M., 2010, ApJ, 723, L213
- Metcalfe et al. (2013) Metcalfe T. S., et al., 2013, ApJ, 763, L26
- Metcalfe et al. (2016) Metcalfe T. S., Egeland R., van Saders J., 2016, ApJ, 826, L2
- Miesch & Teweldebirhan (2016) Miesch M. S., Teweldebirhan K., 2016, AdSpR, 58, 1571
- Minotti (2000) Minotti F. O., 2000, PhRvE, 61, 429
- Mittag et al. (2019) Mittag M., Schmitt J. H. M. M., Hempelmann A., Schröder K. P., 2019, A&A, 621, A136
- Mortier et al. (2015) Mortier A., Faria J. P., Correia C. M., Santerne A., Santos N. C., 2015, A&A, 573, A101
- Noyes et al. (1984) Noyes R. W., Hartmann L. W., Baliunas S. L., Duncan D. K., Vaughan A. H., 1984, ApJ, 279, 763
- Oláh et al. (2009) Oláh K., et al., 2009, A&A, 501, 703
- Olspert et al. (2018) Olspert N., Lehtinen J. J., Käpylä M. J., Pelt J., Grigorievskiy A., 2018, A&A, 619, A6
- Parker (1955) Parker E. N., 1955, ApJ, 122, 293
- Parker (1963) Parker E. N., 1963, ApJ, 138, 226
- Passos et al. (2014) Passos D., Nandy D., Hazra S., Lopes I., 2014, A&A, 563, A18
- Passos et al. (2015) Passos D., Charbonneau P., Miesch M., 2015, ApJL, 800, L18
- Rempel (2006) Rempel M., 2006, ApJ, 647, 662
- Saar & Brandenburg (1999) Saar S. H., Brandenburg A., 1999, ApJ, 524, 295
- See et al. (2016) See V., et al., 2016, MNRAS, 462, 4442
- Shepherd et al. (2014) Shepherd S. J., Zharkov S. I., Zharkova V. V., 2014, ApJ, 795, 46
- Soderblom et al. (1991) Soderblom D. R., Duncan D. K., Johnson D. R. H., 1991, ApJ, 375, 722
- Soon et al. (1993) Soon W. H., Baliunas S. L., Zhang Q., 1993, ApJ, 414, L33
- Soon et al. (2019) Soon W., Velasco Herrera V. M., Cionco R. G., Qiu S., Baliunas S., Egeland R., Henry G. W., Charvátová I., 2019, MNRAS, 483, 2748
- Sraibman & Minotti (2016) Sraibman L., Minotti F., 2016, MNRAS, 456, 3715
- Sraibman & Minotti (2019) Sraibman L., Minotti F., 2019, Sol. Phys., 294, 14
- Sraibman et al. (2017) Sraibman L., Buccino A. P., Minotti F., 2017, Boletin de la Asociacion Argentina de Astronomia La Plata Argentina, 59, 19
- Steenbeck & Krause (1969) Steenbeck M., Krause F., 1969, Astronomische Nachrichten, 291, 49
- Strugarek et al. (2017) Strugarek A., Beaudoin P., Charbonneau P., Brun A. S., do Nascimento J. D., 2017, Science, 357, 185
- Strugarek et al. (2018) Strugarek A., Beaudoin P., Charbonneau P., Brun A. S., 2018, ApJ, 863, 35
- Zechmeister & Kürster (2009) Zechmeister M., Kürster M., 2009, A&A, 496, 577
- Zharkova et al. (2012) Zharkova V. V., Shepherd S. J., Zharkov S. I., 2012, MNRAS, 424, 2943
- van Saders et al. (2016) van Saders J. L., Ceillier T., Metcalfe T. S., Silva Aguirre V., Pinsonneault M. H., García R. A., Mathur S., Davies G. R., 2016, Nature, 529, 181