Helium-rich Superluminous Supernovae from the Zwicky Transient Facility
Abstract
Helium is expected to be present in the massive ejecta of some hydrogen-poor superluminous supernovae (SLSN-I). However, until now only one event has been identified with He features in its photospheric spectra (PTF10hgi, Quimby et al. 2018). We present the discovery of a new He-rich SLSN-I, ZTF19aawfbtg (SN2019hge) at . This event has more than 10 optical spectra at phases from to days relative to the peak, most of which match well with that of PTF10hgi. Confirmation comes from a near-IR spectrum taken at days, revealing He I features with P-Cygni profiles at 1.083 and 2.058 m. Using the optical spectra of PTF10hgi and SN2019hge as templates, we examined 70 other SLSNe-I discovered by ZTF in the first two years of operation and found five additional SLSNe-I with distinct He-features. The excitation of He I atoms in normal core collapse supernovae requires non-thermal radiation, as proposed by previous studies. These He-rich events cannot be explained by the traditional 56Ni mixing model because of their blue spectra, high peak luminosities and long rise timescales. Magnetar models offer a possible solution since pulsar winds naturally generate high energy particles, potential sources of non-thermal excitation. An alternative model is interaction between the ejecta and a dense H-poor CSM, which may be supported by observed undulations in the light curves. These six SLSNe-Ib have relatively low-peak luminosities (rest-frame ).
1 Introduction
Stars more massive than end their lives as core-collapse supernovae (CC SNe (Jones et al., 2013). The observational properties of CC SNe are quite diverse, with much of this variety owing to variations in the mass loss history of the progenitor stars. Hydrogen-rich CC SNe (Type II) result from massive stars that retain their hydrogen envelopes up until the time of explosion, and show hydrogen features in their spectra. Hydrogen-poor CC SNe (Type I) originate from massive stars that have lost most or all of their H envelopes prior to explosion. These include SNe IIb (some H & He), SNe Ib (no H, some He), and SNe Ic (no H, no He) (Filippenko, 1997).
While it is not necessarily a surprise that helium is present within the envelopes of hydrogen-poor SN progenitors, the conditions necessary to produce observable helium features in SN spectra are not always easy to produce, and detections of helium in SNe Ib/IIb have motivated many theoretical calculations. For example, the He I transition is between energy levels of and . To reach these excited states from the ground state () requires at least 20.9 eV of energy, corresponding to a temperature of K. As noted by, e.g. Dessart et al. (2012) and Lucy (1991), -ray photons from 56Ni decay can produce high-energy electrons via Compton scattering. These non-thermal electrons are a source of heat, critical for powering the light curve, as well as a source of non-thermal excitation and ionization for the production of optical He I lines observed in SNe Ib/IIb. This requires the transport of 56Ni from the inner ejecta to the outer layer where helium material is located. Thus the concept of the 56Ni “mixing” is important for SNe Ib/IIb (Dessart et al., 2012).
Since the discovery of the first superluminous supernova more than fifteen years ago (SLSN; Quimby et al., 2007), more than 200 such events have been identified. A large fraction of low- events are from two wide-area transient surveys: the Palomar Transient Factory (PTF; Law et al., 2009) and the Zwicky Transient Facility (ZTF; Graham et al., 2019; Bellm et al., 2019). SLSNe are times more luminous than normal CC SNe and often maintain these luminosities for months, requiring additional power beyond what can be provided by the decay of radioactive material (Quimby et al., 2011; Kasen & Bildsten, 2010; Yan et al., 2015; Woosley, 2017). As with normal CC SNe, SLSNe are broadly categorized into two classes based on their spectrum around maximum light: hydrogen poor (SLSN-I) and hydrogen rich (SLSN-II) (Gal-Yam, 2012).
Although hydrogen-poor SLSNe-I normally do not show hydrogen features in their spectra, a small fraction ( %) show intermediate-width H emission (several 1000 km s-1) at days post-peak, presumably produced by ejecta interaction with H-rich circumstellar material (CSM) (Yan et al., 2015, 2017a). These cases suggest that the loss of the progenitor’s hydrogen envelope must have occurred shortly before the explosions. The implication is that some helium is likely in the ejecta because there is not enough time to completely strip-off all of the helium. However, SLSN-I spectral observations have not revealed the presence of helium, with one exception. Quimby et al. (2018) carried out a comprehensive spectral analysis of the entire PTF SLSN-I sample, and identified one event, PTF10hgi, with a clear detection of He I at km s-1. This event also shows probable H with a broad P-Cygni profile with a velocity of 10000 km s-1 at days, suggesting that the event could be classified as a SLSN-IIb. The presence of H is further supported by a blended emission feature of [O I] and H in the spectrum at days. (SN2012il was proposed to have a He I 1.08m feature by Inserra et al. (2013), however Quimby et al. (2018) pointed out that this feature is unlikely to be He I, but may be broad nebular H emission.)
ZTF has been operating for over two years, and we have been systematically monitoring the data stream to search for and spectroscopically confirm new SLSNe, resulting in over 100 new SLSN discoveries to date (Lunnan et al. 2019; Perley et al. in prep; Chen et al. in prep) and a large accompanying spectral dataset. Here we examine this dataset, aiming to address if there are other He-rich SLSN-I similar to PTF10hgi. If such a population of events exists, further study of these events may shed light on the question of how helium atoms are excited and ionized, with important implications for the physical nature of SLSNe-I.
This paper is organized as follows. §2.1 and §2.2 present the optical and near-IR spectra for SN2019hge (ZTF19aawfbtg). §3 discusses the sample of SLSN-Ib/IIb events. The paper concludes (§4) with a discussion of the key results and their implications. Throughout the paper, all magnitudes are in the AB system unless explicitly noted otherwise. We adopt the CDM cosmology with H km s-1 Mpc-1, and (Planck Collaboration et al., 2018).
2 Classification of SN2019hge (ZTF19aawfbgt) as a SLSN-Ib
2.1 Optical Spectra
Optical spectra of SN2019hge were obtained at to days from the -band peak using the low resolution () Spectral Energy Distribution Machine (SEDM; Blagorodnova et al., 2018) and the Double Beam Spectrograph (DBSP; Oke & Gunn, 1983) on the Palomar 60 inch and 200 inch telescope respectively, as well as the Low Resolution Imaging Spectrometer (LRIS; Oke et al., 1995) on the Keck I telescope. An observing log for all optical spectra of ZTF19aawfbtg presented here is in Table 1. Spectral reductions were performed using the SEDM pipeline and the pyraf-dbsp and LPipe packages (Rigault et al., 2019; Bellm & Sesar, 2016; Perley, 2019). Narrow H and [O II] 3727 emission lines from the host galaxy establish the redshift as . The supernova is at the edge of a face-on spiral galaxy with an estimated stellar mass of from the SED fitting of broad band photometry provided by SDSS, PS1, 2MASS and unWISE. This mass is larger than that of a typical SLSN-I host (Perley et al., 2016; Lunnan et al., 2014; Leloudas et al., 2015; Schulze et al., 2018).
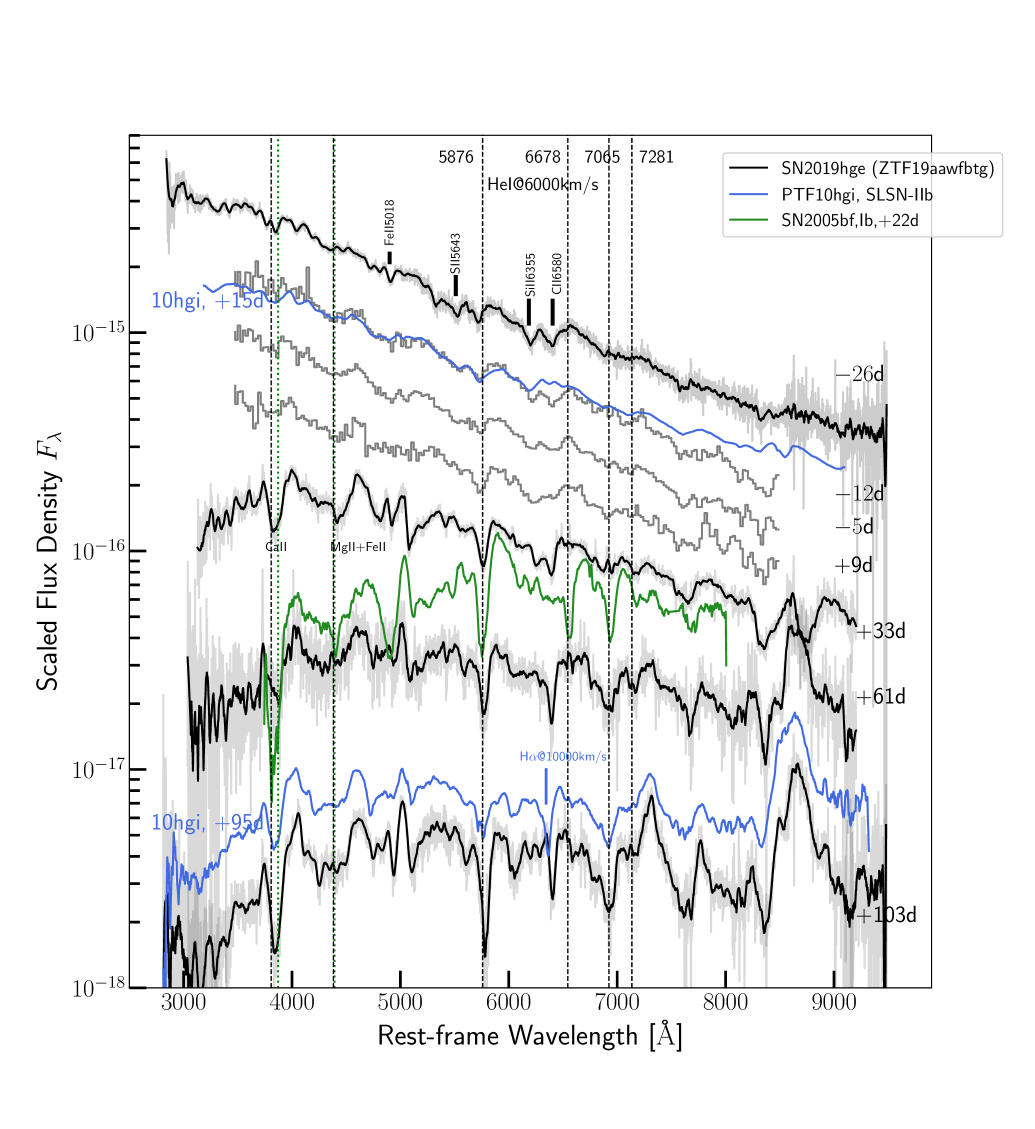
We applied Superfit (Howell et al., 2013) with the enhanced SLSN spectral templates from Quimby et al. (2018) to our data. We find that for the spectra at phases later than days, all five of the top matches returned by Superfit are with PTF10hgi. Superfit, like all spectral template matching software, can produce ambiguous classifications when the supernova features are weak. Thus, we also manually analysed these spectra to and establish individual spectral line identifications. Figure 1 compares the spectra of SN2019hge with those of PTF10hgi and the low luminosity Type Ib SN 2005bf (Folatelli et al., 2006). There are many similarities between these three events, in particular the four He I features at 5876, 6678, 7065 and 7281 Å blue-shifted with a velocity of km s-1. We do not consider He I as the primary classification lines because of strong contamination from Ca II (H+K lines) and Mg II . Of the four He features in Figure 1, He I is strong with a well defined absorption profile; however, it could have some contamination from Na I . The other three features are weak, but He I is well isolated. Therefore, the key to identify He-rich events is the presence of multiple He features, as demonstrated in the classification of normal SNe Ib/IIb (Modjaz et al., 2014).
PTF10hgi has He I and H velocities of 7000, and 10,000 km s-1 respectively, making it a SLSN-IIb (Quimby et al., 2018). In SN2019hge, hydrogen features are not as clear. In Figure 1, we marked the two features blueward of He I as C II and Si II . If these were H, the velocity would be either too low ( km s-1) or too high ( km s-1). We thus conclude that SN2019hge is a H-poor and He-rich event. This classification was also noted by Prentice et al. (2019) reporting SN 2019hge as Type IIb based on their optical spectra.
2.2 Near-IR spectral confirmation of helium in SN2019hge
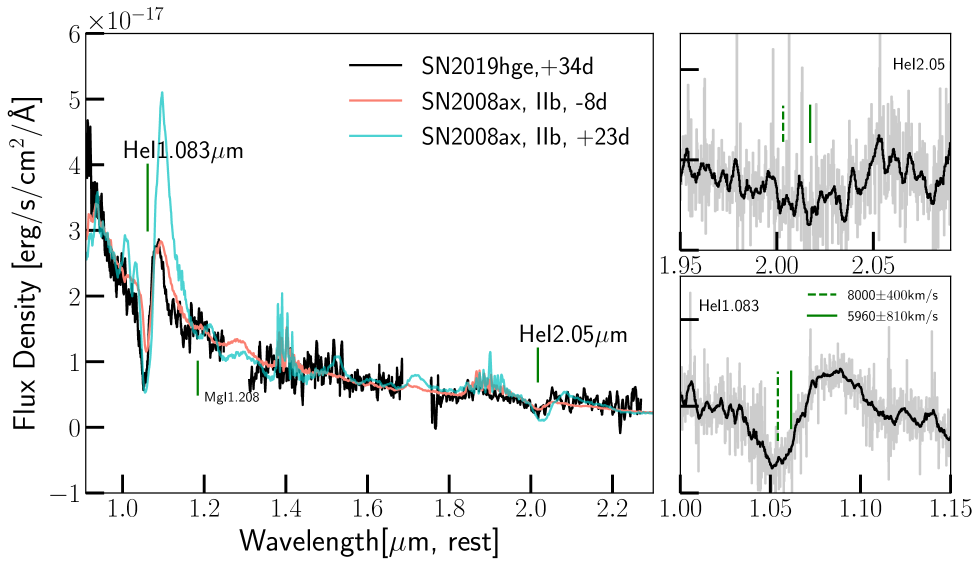
SN2019hge was observed at days with the Near-Infrared Echellette Spectrometer (NIRES; Wilson et al., 2004), a prism cross-dispersed near-infrared spectrograph mounted on the Keck 2 telescope. This spectrograph has a resolution of and simultaneously covers the YJHK bands with a wavelength range of m. The spectra were reduced with Spextool and Xtellcor written by Cushing et al. (2004); Vacca et al. (2003). The data is shown in Figure 2, where the prominent feature at m is likely He I 1.08303 m with P-Cygni profile. This is confirmed by the presence of He I 2.05813 m, a relatively isolated line. For comparison, we also plot the near-IR spectra of SN 2008ax, a SN IIb at and days from the -band peak (Taubenberger et al., 2011). In Figure 2, we shift the spectra of SN 2008ax to a velocity of 6000 km s-1. The match between SN2019hge and SN2008ax is very clear, including weak Mg I 1.1828,1.2083 m doublet. The relative strength of the 1.08 and 2.05m features for SN2019hge is similar to that of SN2008ax at days.
Assuming the minimum near 1.08m is due to the P-Cygni profile of He I 1.08303 m, the implied velocity is 8000 km s-1, as marked in green dashed vertical lines in the two panels in Figure 2. Similarly, the He I 2.05813 m P-Cygni profile gives a velocity of 6000 km s-1, consistent with that derived from He I at a similar phase of day. It is possible that near-IR He I lines could have higher velocities than the optical He I lines because of their lower excitation. The lower velocity of He I m could be due to its weaker and noisier feature. An alternative explanation is that He I m could be blended with C I m at 6000 km s-1, which would broaden and shift the minimum to shorter wavelengths. C I features are also present in the optical spectra at similar phases. The strong m features in normal SNe Ib/Ic could have contributions from He I, C I, Mg II and Si I (Hunter et al., 2009; Taubenberger et al., 2011). However, unlike SNe Ib, normal SNe Ic do not have He I m (Taubenberger et al., 2011).
If hydrogen is present in the ejecta, Pa at 1.0941 m would imply a velocity of 11,000 km s-1. Although this velocity is higher as expected, the presence of Pa is not corroborated by H and H in the optical spectra. In summary, the optical and near-IR spectra suggest that SN2019hge is a He-rich event.
3 A sample of He-rich SLSN-I from ZTF
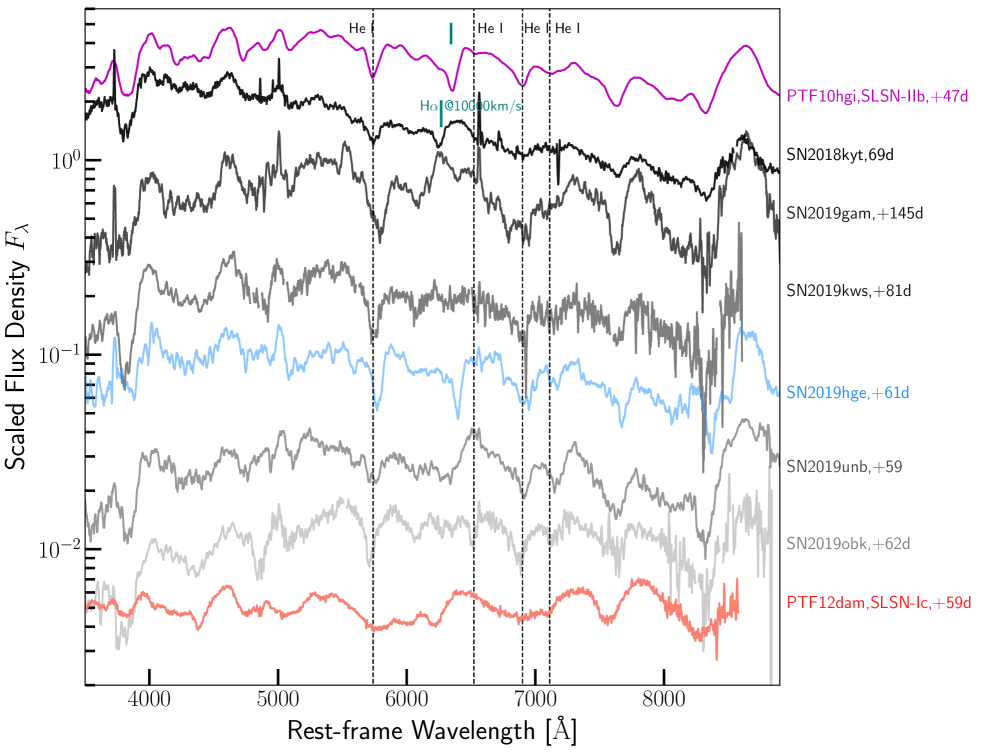
Assuming that optical spectra of PTF10hgi and SN2019hge can be used as templates to classify SLSN-Ib/IIb, we search for additional sources among the ZTF SLSNe-I discovered during the first two years of the survey. Figure 3 displays the spectra of six SLSNe-I which are matched well with that of PTF10hgi, including SN2019hge. For these six ZTF events, their post-peak spectra are all matched with that of PTF10hgi among the top 5 ranks when we run Superfit. For each of the six events, at least 3 matches from Superfit are PTF10hgi at various phases, while the remaining 1 or 2 matches are other SLSN-I templates, such as PTF10nmn or PTF11rks. For example, for ZTF19acgjpgh, 4 out of 5 matches are PTF10hgi. All 5 matches are PTF10hgi for ZTF19aawfbtg.
Figure 3 compares these six events with PTF12dam (Quimby et al., 2018), an archetypal SLSN-I. Near Å (He I), PTF12dam does not show a distinctive absorption feature, but a smooth and wide trough suggesting a blend of many lines. This is in contrast with the strong, narrow, and well defined absorption features at 5876 Å detected in the six ZTF events. More importantly, three other He I lines at 6678, 7065 and 7281 Å are also present, albeit with various strengths. Considering that He-rich material in SN2019hge is confirmed by its near-IR spectrum, we conclude that the other five events are good SLSN-Ib/IIb candidates. In Figure 3, we note that SN2018kyt (ZTF18acyxnyw) may have H at km s-1, a He-rich event with a potentially small amount of H, similar to PTF10hgi.
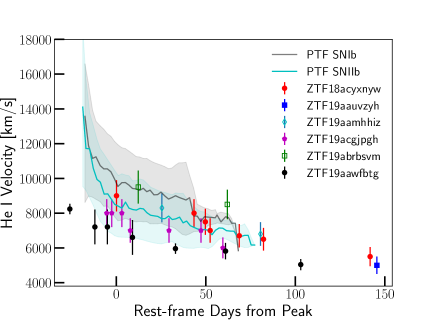
If the feature at 5876 Å is indeed blue-shifted He I, we can measure the outflowing velocity as well as the velocity dispersion by fitting a Gaussian profile to each feature. Figure 4 shows the He I velocities as a function of time. The velocities slow down roughly linearly with time, decreasing by 3000 km s-1 over 125 days. For comparison, Figure 4 also illustrates that the He I velocities in normal SNe Ib and IIb can drop from 14,000 km s-1 to 7000 - 6000 km s-1 in less than 90 days, a much more rapid evolution than what is seen in our He-rich SLSN-I sample. Finally, the He I line velocity dispersion, i.e. the line width, is km s-1 and remains roughly constant over the same period of time. This is much less than the bulk velocity, explaining the narrow appearance of He I line. Finally, Liu et al. (2016) found that that for normal SNe Ib, their He I and lines have similar strength. This is not the case for our events, where the 6676 lines are on average weaker. This again suggests a different excitation mechanism from normal SNe Ib.
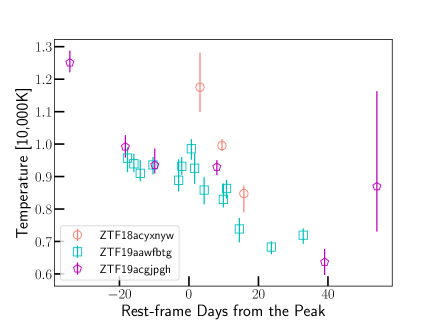
In addition, four of these six He-rich events have Swift UV photometry, and the blackbody temperatures are measured from fitting the broad band UV + optical spectral energy distributions with a modified blackbody function of , where Å, and and are derived from the fit (details in Chen et al. in prep). The rationale for this function is to take into account various degrees of SED suppression at far to near-UV due to metal line blanketing, as seen in the HST far-UV spectra of SLSN-I (Yan et al., 2017b, 2018). Figure 5 shows vs. phases, illustrating that at pre-peak early phases, can reach as high as 12,000 K, commonly seen among SLSN-I (Quimby et al., 2011; Inserra et al., 2013; Nicholl et al., 2017; Chen et al., 2017). The He I features appear at phases when is lower temperatures, around K.
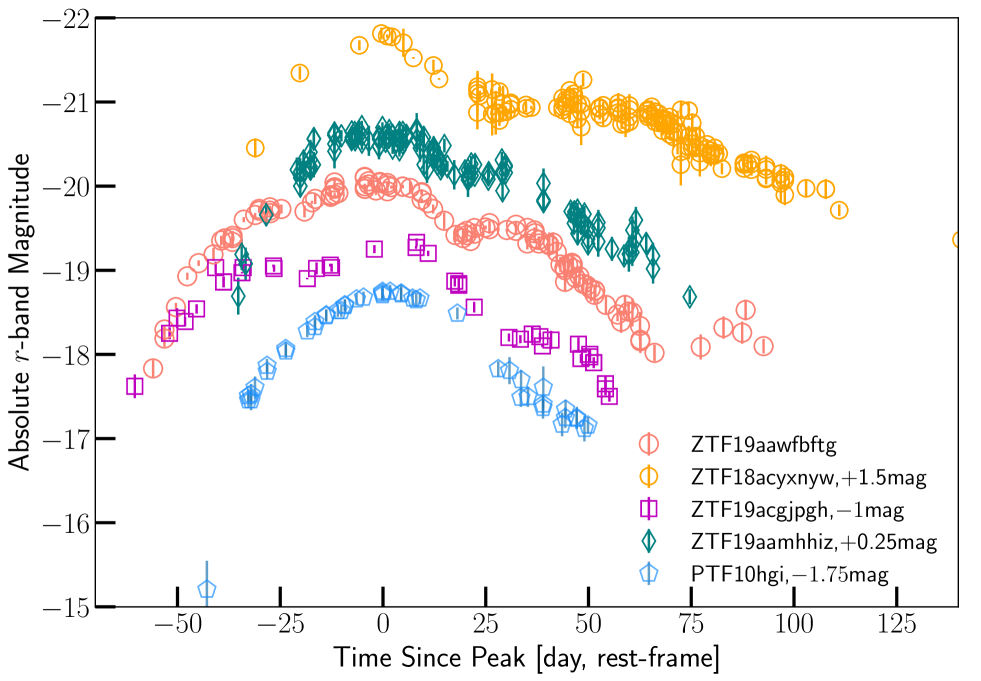
Two outstanding features of this sample are shown by the light curves (LC) of the five events with good phase coverage from this sample, as in Figure 6. Here the LCs were constructed using the ZTF forced photometry utility 111http://web.ipac.caltech.edu/staff/fmasci/ztf/forcedphot.pdf and additional code from Yao et al. (2019) based on the reference subtracted images from the ZTF image reduction pipeline (Masci et al., 2019). The first notable feature is the prominent LC undulations in four of the six ZTF events (the other two have poor LC coverage). The physical interpretation of this behavior is not clear and there are multiple potential explanations, such as interaction or change in opacity. The second notable feature is the relatively low peak luminosity: all events are in the range of to absolute magnitude, for a sample of slow evolving SLSNe-I with rising time scales of days. Table 2 lists the name, coordinate, redshift () and -band absolute peak magnitude (Mg). Extinction and K-corrections have been applied. This is in contrast to a much wider range of luminosity, to mag, normally occupied by SLSNe-I. Finally, we note that the host galaxies of these seven He-rich events include both low mass dwarf galaxies and massive ones (), but within the range expected for SLSNe-I (Lunnan et al., 2014; Perley et al., 2016; Schulze et al., 2018).
4 Discussion and conclusions
The main result of this paper is the discovery of a sample of He-rich SLSN-Ib/IIb, all of which are luminous () and slow evolving with very large ejecta masses. Based on these six ZTF events, the percentage of He-rich events among ZTF SLSNe-I is %. This is just an observed fraction of SLSN-I. Detailed calculations of the volumetric rates including incompleteness are outside the scope of this paper and will be discussed in a separate publication.
Helium is expected to be present in the ejecta of some massive stars if the stripping of the outer envelopes is incomplete. The detection of late-time, broad H emission in several PTF SLSNe-I (Yan et al., 2015, 2017a) has provided the first evidence that some massive stars lost their H-envelope shortly ( a few decades) before the supernova explosion, and never had enough time to also lose their helium layers. The fraction of SLSNe-I with late-time H emission is roughly 10-30% (Yan et al., 2017a).
Our result has important implications for both the mass loss history of progenitor stars as well as the power mechanism of SLSNe-I. Because the He I excitation energy is high, non-thermal excitation is required to produce observable helium features. For normal SNe Ib/IIb, non-thermal excitation is achieved by “mixing” which transports 56Ni from the interior to the outer parts of ejecta (Lucy, 1991; Dessart et al., 2012). This solution is unlikely to work for these SLSN-Ib because having 56Ni as the sole power source would require extremely large 56Ni masses, given the observed LCs with high peak luminosities and long rise timescales. Furthermore, Fe-group elements from 56Ni decay will produce significant line blanketing in the UV/optical, leading to red spectra, in contrast to our observations (Figure 1). This argument also rules out the pair-instability supernova model (PISN; Woosley et al., 2007). For SLSNe-I, central engine models such as a magnetar or black hole fall-back offer a natural source of high energy particles from either pulsar wind or outflow from accretion disk. These outflow winds will interact with the inner regions of ejecta, producing shocks and X-rays. There are two spectral formation models for SLSN-I. One by Mazzali et al. (2016) assumes X-rays from shocks driven by magnetar wind as a source of non-thermal excitation. The other by Dessart (2019) adopts a sustained magnetar energy injection profile (spatial). Both models are able to explain the hallmark O II absorption features at 3500 - 4500Å (Quimby et al., 2011) and even produce He I Å. However, both models do not deal with the dynamic processes of magnetar wind propagating through the ejecta. So the details of how magnetar energy is transported and thermalized to the outer layers are not understood. Furthermore, X-ray emission has not been detected from SLSNe-I (except one peculiar case) and current limits (Margutti et al., 2018) do not support the idea that shock interaction is an important energy source (Mazzali et al., 2016). The recent 3D magnetar simulation by Chen et al. (2020) has examined the dynamical processes, suggesting that Rayleigh-Taylor instability can quickly drive Ni and Fe to the outer layers. However, their work does not include simulated spectra. It is likely that Fe-group elements will make the spectra too red. Finally, ejecta-CSM interaction is a possible solution. The observed LC undulations from our sample may support this scenario. However, the LC undulations could also be related to the ejecta clumpiness and changes in opacity.
An important question is why only a small fraction of SLSN-I have He I features. Is the fraction of progenitors retaining some helium at the time of the explosion intrinsically small? If true, this would suggest very efficient mass loss mechanisms. If massive stars are mostly in binaries, stripping by the secondary accretion is certainly more efficient than wind mass loss. An alternative scenario is that most SLSN-I progenitors have helium, but only a small fraction show He features in their spectra, either due to lack of excitation energy, or other peculiar physical conditions. Future modeling work may address this question.
Another spectral feature worth noting is that the early phase spectra of these events are blue continuum dominated without obvious O II absorption features (most notably, at d for SN2019hge and d for PTF10hgi). This cannot be explained by low temperatures: the early phase temperatures are clearly very high (Figure 5). Spectral smearing due to high velocity is also unlikely to provide a complete explanation because spectra taken post-peak all show narrow features with relatively low velocities (Figure 1 & 3). Like He I features, the formation of O II absorption requires not only sufficient excitation energy to produce ionized O+, but also is affected by other factors, such as density and ionization parameter. However, the existing models have not provided clear physical explanations for why sometimes He I and O II absorption features are formed and sometimes they are not.
References
- Bellm & Sesar (2016) Bellm, E. C., & Sesar, B. 2016, pyraf-dbsp: Reduction pipeline for the Palomar Double Beam Spectrograph
- Bellm et al. (2019) Bellm, E. C., Kulkarni, S. R., Graham, M. J., et al. 2019, PASP, 131, 018002
- Blagorodnova et al. (2018) Blagorodnova, N., Neill, J. D., Walters, R., et al. 2018, PASP, 130, 035003
- Chen et al. (2020) Chen, K.-J., Woosley, S. E., & Whalen, D. J. 2020, ApJ, 893, 99
- Chen et al. (2017) Chen, T. W., Nicholl, M., Smartt, S. J., et al. 2017, A&A, 602, A9
- Cushing et al. (2004) Cushing, M. C., Vacca, W. D., & Rayner, J. T. 2004, PASP, 116, 362
- De Cia et al. (2018) De Cia, A., Gal-Yam, A., Rubin, A., et al. 2018, ApJ, 860, 100
- Dessart (2019) Dessart, L. 2019, A&A, 621, A141
- Dessart et al. (2012) Dessart, L., Hillier, D. J., Waldman, R., et al. 2012, MNRAS, 426, L76
- Filippenko (1997) Filippenko, A. 1997, ARA&A, 35, 309
- Folatelli et al. (2006) Folatelli, G., Contreras, C., Phillips, M. M., et al. 2006, ApJ, 641, 1039
- Gal-Yam (2012) Gal-Yam, A. 2012, Science, 337, 927
- Graham et al. (2019) Graham, M. J., Kulkarni, S. R., Bellm, E. C., et al. 2019, PASP, 131, 078001
- Howell et al. (2013) Howell, D. A., Kasen, D., Lidman, C., et al. 2013, ApJ, 779, 98
- Hunter et al. (2009) Hunter, D. J., Valenti, S., Kotak, R., et al. 2009, A&A, 508, 371
- Inserra et al. (2013) Inserra, C., Smartt, S., Jerkstrand, A., et al. 2013, ApJ, 770, 128
- Jones et al. (2013) Jones, S., Hirschi, R., Nomoto, K., et al. 2013, ApJ, 772, 150
- Kasen & Bildsten (2010) Kasen, D., & Bildsten, L. 2010, ApJ, 717, 245
- Kasliwal et al. (2019) Kasliwal, M. M., Cannella, C., Bagdasaryan, A., et al. 2019, PASP, 131, 038003
- Law et al. (2009) Law, N. M., Kulkarni, S. R., Dekany, R. G., et al. 2009, PASP, 121, 1395
- Leloudas et al. (2015) Leloudas, G., Schulze, S., Krühler, T., et al. 2015, MNRAS, 449, 917
- Liu et al. (2016) Liu, Y.-Q., Modjaz, M., Bianco, F. B., & Graur, O. 2016, ApJ, 827, 90
- Lucy (1991) Lucy, L. B. 1991, ApJ, 383, 308
- Lunnan et al. (2014) Lunnan, R., Chornock, R., Berger, E., et al. 2014, ApJ, 787, 138
- Lunnan et al. (2019) Lunnan, R., Yan, L., Perley, D. A., et al. 2019, arXiv, arXiv:1910.02968
- Margutti et al. (2018) Margutti, R., Chornock, R., Metzger, B. D., et al. 2018, ApJ, 864, 45
- Masci et al. (2019) Masci, F. J., Laher, R. R., Rusholme, B., et al. 2019, PASP, 131, 018003
- Mazzali et al. (2016) Mazzali, P. A., Sullivan, M., Pian, E., et al. 2016, MNRAS, 458, 3455
- Modjaz et al. (2014) Modjaz, M., Blondin, S., Kirshner, R. P., et al. 2014, AJ, 147, 99
- Nicholl et al. (2017) Nicholl, M., Berger, E., Margutti, R., et al. 2017, ApJ, 845, L8
- Oke & Gunn (1983) Oke, J. B., & Gunn, J. E. 1983, ApJ, 266, 713
- Oke et al. (1995) Oke, J. B., Cohen, J. G., Carr, M., et al. 1995, PASP, 107, 375
- Perley (2019) Perley, D. A. 2019, PASP, 131, 084503
- Perley et al. (2016) Perley, D. A., Quimby, R. M., Yan, L., et al. 2016, ApJ, 830, 13
- Planck Collaboration et al. (2018) Planck Collaboration, Aghanim, N., Akrami, Y., et al. 2018, arXiv, arXiv:1807.06209
- Prentice et al. (2019) Prentice, S. J., Maguire, K., Skillen, K., et al. 2019, Transient Name Server AstroNote, 74, 1
- Quimby et al. (2007) Quimby, R. M., Aldering, G., Wheeler, J. C., et al. 2007, ApJ, 668, L99
- Quimby et al. (2011) Quimby, R. M., Kulkarni, S. R., Kasliwal, M. M., et al. 2011, Nature, 474, 487
- Quimby et al. (2018) Quimby, R. M., De Cia, A., Gal-Yam, A., et al. 2018, ApJ, 855, 2
- Rigault et al. (2019) Rigault, M., Neill, J. D., Blagorodnova, N., et al. 2019, A&A, 627, A115
- Schulze et al. (2018) Schulze, S., Krühler, T., Leloudas, G., et al. 2018, MNRAS, 473, 1258
- Taubenberger et al. (2011) Taubenberger, S., Navasardyan, H., Maurer, J. I., et al. 2011, MNRAS, 413, 2140
- Vacca et al. (2003) Vacca, W. D., Cushing, M. C., & Rayner, J. T. 2003, PASP, 115, 389
- Wilson et al. (2004) Wilson, J. C., Henderson, C. P., Herter, T. L., et al. 2004, Society of Photo-Optical Instrumentation Engineers (SPIE) Conference Series, Vol. 5492, Mass producing an efficient NIR spectrograph, ed. A. F. M. Moorwood & M. Iye, 1295
- Woosley (2017) Woosley, S. E. 2017, ApJ, 836, 244
- Woosley et al. (2007) Woosley, S. E., Blinnikov, S., & Heger, A. 2007, Nature, 450, 390
- Yan et al. (2018) Yan, L., Perley, D. A., De Cia, A., et al. 2018, ApJ, 858, 91
- Yan et al. (2015) Yan, L., Quimby, R., Ofek, E., et al. 2015, ApJ, 814, 108
- Yan et al. (2017a) Yan, L., Lunnan, R., Perley, D. A., et al. 2017a, ApJ, 848, 6
- Yan et al. (2017b) Yan, L., Quimby, R., Gal-Yam, A., et al. 2017b, ApJ, 840, 57
- Yao et al. (2019) Yao, Y., Miller, A. A., Kulkarni, S. R., et al. 2019, ApJ, 886, 152
| Obs.date | Phaseb | tel/instr | Exp.Time | ||
|---|---|---|---|---|---|
| days | seconds | Å | |||
| 2019-07-02 | -26 | Keck/LRIS | 300 | 3100 - 10000 | 1000 |
| 2019-07-18 | -12 | P60/SEDM | 1800 | 3900 - 9000 | 100 |
| 2019-07-26 | -5 | P60/SEDM | 1800 | 3900 - 9000 | 100 |
| 2019-08-10 | +9d | P60/SEDM | 2250 | 3900 - 9000 | 100 |
| 2019-09-06 | +33 | P200/DBSP | 900 | 3300 - 9800 | 956 |
| 2019-10-06 | +61 | P200/DBSP | 900 | 3300 - 9800 | 956 |
| 2019-11-21 | +103 | Keck/LRIS | 500 | 3900 - 9000 | 1000 |
Note. — a: All spectral observations were taken using parallactic angles. b: Phase is the rest-frame days from the -band peak in Julian date of 2458695.72. c: Spectral resolution is estimated around 7000Å.
| Name | IAU Name | RA | DEC | Mg | |
|---|---|---|---|---|---|
| PTF10hgi | … | 16:37:47.04 | +06:12:32.3 | 0.0985 | -20.2a |
| ZTF18acyxnyw | SN2018kyt | 12:27:56.23 | +56:23:35.6 | 0.108 | -20.18 |
| ZTF19aamhhiz | SN2019kws | 14:15:04.46 | +50:39:06.8 | 0.1977 | -20.17 |
| ZTF19aauvzyh | SN2019gam | 10:19:18.32 | +17:12:42.6 | 0.1235 | …b |
| ZTF19aawfbtg | SN2019hge | 22:24:21.20 | +24:47:17.1 | 0.0866 | -19.85 |
| ZTF19acgjpgh | SN2019unb | 09:47:57.02 | +00:49:36.0 | 0.0635 | -20.13 |
| ZTF19abrbsvm | SN2019obk | 22:33:54.08 | -02:09:42.3 | 0.1656 | -19.82 |
Note. — a: The number is from De Cia et al. (2018). b: No data within 100 days around the peak.