The SUrvey for Pulsars and Extragalactic Radio Bursts V:
Recent Discoveries and Full Timing Solutions
Abstract
The SUrvey for Pulsars and Extragalactic Radio Bursts ran from 2014 April to 2019 August, covering a large fraction of the southern hemisphere at mid- to high-galactic latitudes, and consisting of 9-minute pointings taken with the 20-cm multibeam receiver on the Parkes Radio Telescope. Data up to 2017 September 21 have been searched using standard Fourier techniques, single-pulse searches, and Fast Folding Algorithm searches. We present 19 new discoveries, bringing the total to 27 discoveries in the programme, and we report the results of follow-up timing observations at Parkes for 26 of these pulsars, including the millisecond pulsar PSR J14214409; the faint, highly-modulated, slow pulsar PSR J16461910; and the nulling pulsar PSR J13374441. We present new timing solutions for 23 pulsars, and we report flux densities, modulation indices, and polarization properties.
keywords:
pulsars: general – surveys – methods: data analysis – methods: observational1 Introduction
The Parkes Radio Telescope has been a prolific instrument in the search for pulsars over the decades. The Parkes southern Sky Survey was conducted at Parkes using a 70-cm receiver and discovered 101 pulsars (see, e.g., Bailes et al., 1994; Lorimer et al., 1995) including the bright, nearby millisecond pulsar (MSP), PSR J04374715 (Johnston et al., 1993). With the advent of the 13-beam receiver at Parkes (Staveley-Smith et al., 1996) and large bandwidth analogue filterbanks, the Parkes Multibeam Pulsar Survey (Manchester et al., 2001) was able, between 1998 and 2003, to search a wide unexplored parameter space and discovered over 800 pulsars111From the ATNF pulsar catalogue (https://www.atnf.csiro.au/research/pulsar/psrcat/), including from re-processing; e.g., Mickaliger et al. 2018. within 5 degrees of the Galactic plane (Morris et al., 2002; Kramer et al., 2003; Hobbs et al., 2004; Faulkner et al., 2004; Lorimer et al., 2006). Later, the High Time Resolution Universe (HTRU-S) survey, carried out between 2008 and 2014, employed higher time and frequency resolution in an all-sky survey with the Parkes multibeam to discover over 200 further pulsars and 10 Fast Radio Bursts (FRBs; Keith et al., 2010; Bates et al., 2011; Burke-Spolaor et al., 2011; Thornton et al., 2013; Champion et al., 2016; Petroff et al., 2019).
HTRU-S was directly followed by another major southern hemisphere survey, SUPERB “The SUrvey for Pulsars and Extragalactic Radio Bursts” (Keane et al., 2018, hereafter Paper I). SUPERB also used the Parkes multibeam receiver, and observations were conducted between April 2014 and August 2019. The primary goals of SUPERB included the real-time discovery of FRBs and pulsars and improving upon previous surveys in the region. SUPERB observed each pointing for 9.3 minutes, compared with 4.5 minutes for the high-latitude (“hilat”) portion of HTRU-S (Keith et al., 2010), and the pointings were tessellated such that the most sensitive central beam of the instrument was placed at positions of the less sensitive “outer-ring” pointings of HTRU-S. The pointings were additionally offset by half a half-power beamwidth so that some points previously at the half-power point in HTRU-S hilat observations were on-axis for SUPERB and vice-versa. Finally, SUPERB increased the chances of detecting intermittent pulsars and RRATs by observing pointings multiple times (the actual number of observations per position varied widely, averaging observations per position excluding singly-observed pointings).
Throughout the last two decades, in the era of the multibeam surveys at Parkes, the radio frequency interference (RFI) environment has worsened with time. Progress is made in this (and other) regards by repeated re-processing of these archival data as new RFI mitigation and search algorithms are developed. This has been done successfully in the past (Eatough et al., 2009; Keith et al., 2009; Knispel et al., 2013; Morello et al., 2014; Morello et al., 2019) and we expect the same will be true for SUPERB. Decreasing the discovery lag for pulsars is an important step for enabling large-volume surveys such as will be performed with the Square Kilometer Array (SKA; Keane et al. 2014). In addition, finding pulsars in real-time is crucial for studies of intermittent pulsars and RRATs, which may be visible for only a short time and benefit from rapid follow-up for confirmation and immediate study.
Paper I described the survey parameters in detail and presented the first pulsars discovered in the survey until January 2016222https://sites.google.com/site/publicsuperb/discoveries. The 6 FRBs discovered to date in SUPERB data were described by Keane et al. (2016), Bhandari et al. (2018a), and (Bhandari et al., 2018b), and their polarization properties in Caleb et al. (2018). Morello et al. (2020b) presented the discovery of a particularly noteworthy pulsar with a spin period of 12 seconds, PSR J22513711, as it raises interesting questions concerning the diversity of the pulsar population and pulsar evolution and emission models.
In this paper, we report the discovery of an additional 19 pulsars, bringing the total number of SUPERB discoveries to 27, and present new timing solutions for 23 of these pulsars. Our sample includes a nulling pulsar, PSR J13374441; an MSP in a wide, eccentric orbit, PSR J14214409; and a faint, highly-modulated 4.8-second pulsar, PSR J16461910, which exhibits RRAT-like emission. A second MSP, PSR J13064035, remains unsolved due to insufficient detections, possibly due to eclipsing in this redback system. We further present integrated profiles together with polarization properties and compare the emission properties of our sample with the known Galactic population.
In Section 2.1, we describe the methodology used to collect the pulsar data and present our discoveries. In Section 2.2, we report the results of the follow-up timing observations including the timing parameters, the flux density measurements and the effects of scintillation, and the polarization properties of the pulsars. We discuss in more detail the most noteworthy pulsars in our sample in Section 3, and conclude in Section 4.
2 Observations and Data Analysis
2.1 Survey and Pulsar Follow-up Observations
Paper I describes the overall set-up of the survey; here, we summarise those aspects most relevant to the results of our analysis. In this publication, we consider survey data collected up to 2017 September 21. 22,007 observations (285,983 independent pointings) were performed up to that date, of which 21,182 observations (275,296 pointings) have been thoroughly searched and inspected for pulsar candidates, including follow-up observations of various sources. After accounting for repeated pointings, a total of 224,899 sky positions were observed up to 2017 September 21 (% of planned pointings according to Paper I). After the cut-off date, processing is not complete due in part to the migration from the gSTAR supercomputer to the new OzSTAR333http://supercomputing.swin.edu.au/ cluster at Swinburne University of Technology.
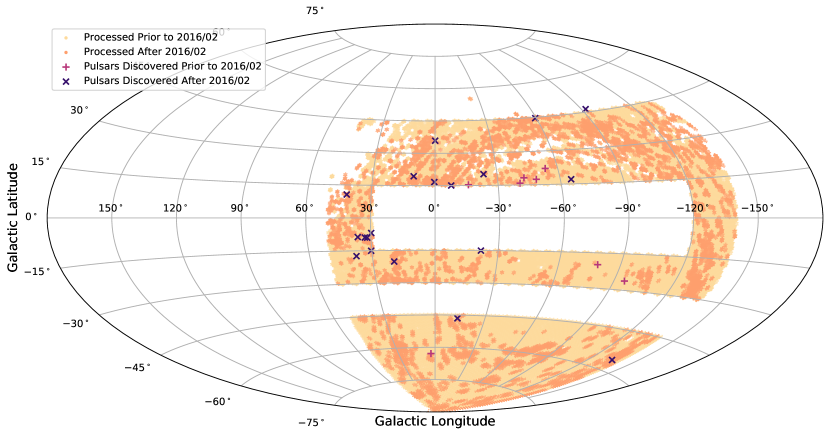
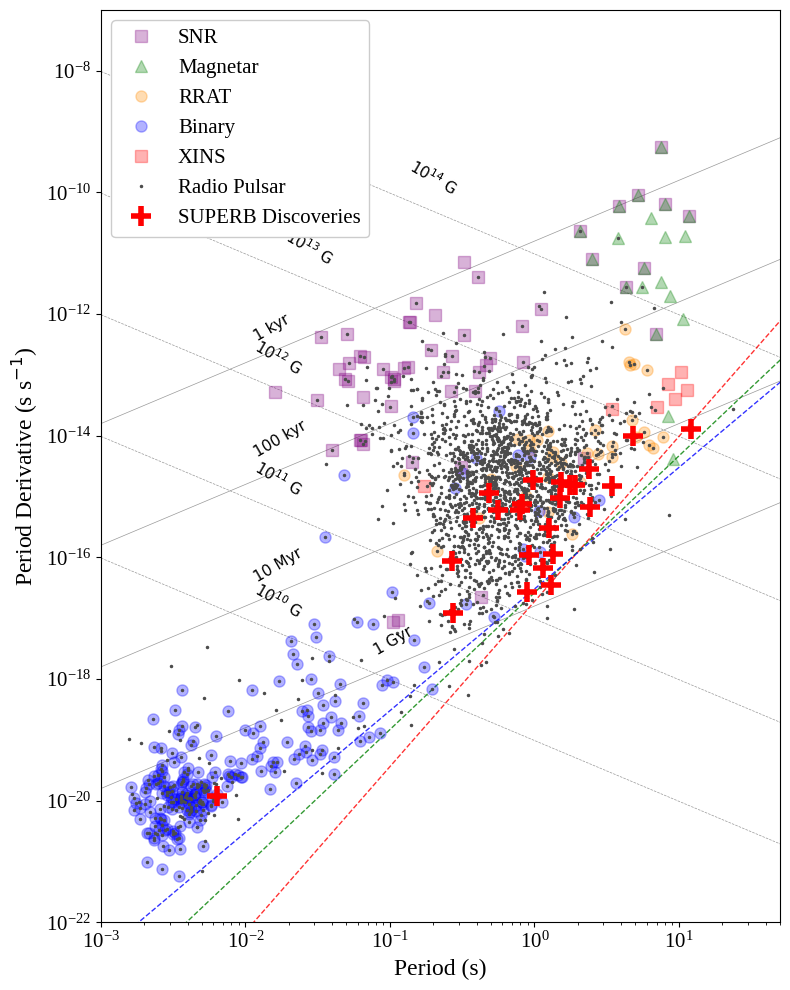
SUPERB observations (Parkes observing programmes P858 and P892, PI Keane) cover the survey region shown in Fig. 1, covering most of the sky with or , and , and excluding the region covered by the intermediate latitude part of HTRU-S. Of the 27 pulsars discovered by SUPERB through 2017 September, 24 have full timing solutions with significant period derivatives and are highlighted in Fig. 2. The timing programme described herein focused on the 26 pulsars excluding PSR J22513711.
We note that four of the pulsars included in this work were previously published in Paper I, with different names based on their discovery parameters. We list these here for reference:
-
•
PSR J07506846 – previously J074968
-
•
PSR J13374441 – previously J133744
-
•
PSR J14064233 – previously J140542
-
•
PSR J16043142 – previously J160431
Standard SUPERB observations use only the Berkeley-Parkes-Swinburne-Recorder (BPSR) with the HI-Pulsar Signal Recorder (HIPSR; Price et al. 2016) to record data at 64 s time resolution and 0.78 MHz frequency resolution. To achieve higher phase resolution, follow-up timing observations were made with the CASPER Parkes Swinburne Recorder444http://astronomy.swin.edu.au/pulsar/?topic=caspsr (CASPSR) and the Digital Filterbank Mark \@slowromancapiv@ (DFB4), using the discovery DM and period to fold the data, with frequency resolutions of 0.78 and 0.5 MHz for CASPSR and DFB4, respectively. These back-ends are described in Table 1 (see also Sarkissian et al., 2011). We additionally recorded data from all 13 beams using the BPSR backend while observing the pulsars, enabling further searches for FRBs and pulsars simultaneously. Typical survey pointings are 560 s, while observations of known FRB positions, to search for possible repeats, vary in length up to a few hours. PSRs J19210510 and J19230408 were discovered in outer beams of such follow-up observations. PSR J19230408 was additionally detected (at very low significance) in the original 560-second observation at that position, and PSR J19210510 was detected (not in a blind search) in an earlier 560-second observation.
| Receiver | Backend | Centre Freq. | Bandwidth | Dates |
|---|---|---|---|---|
| (MHz) | (MHz) | (MJD) | ||
| MB | CASPSR | 1382 | 340 | 58044-58405 |
| BPSR | 1382 | 340 | 57116-58405 | |
| DFB4 | 1369 | 256 | 58044-58405 | |
| UWL | Medusa | 2350 | 3300 | 58468 |
| CASPSR | 724 | 64 | 58468 | |
| DFB4 | 1369 | 256 | 58468 |
Using the Green II supercomputing cluster located at Swinburne University, the observations were automatically processed through a set of pipelines for detecting FRBs and pulsars. As described in Paper I, the main pipelines use a periodicity search and a single-pulse detector. The output of these pipelines from the data through to 2016 February was published in Paper I. Additionally, an experimental, large-scale Fast Folding Algorithm (FFA; Staelin 1969) search was tested on the SUPERB data, revealing 11 additional pulsars in the data through 2016 February. This pipeline was not fully developed at the time and was run on only a subset of the data; completion of the pipeline and search is anticipated in the near future (Morello et al., 2020a, submitted). All promising candidates identified by the various pipelines were allocated time (as part of the survey programme) for confirmations as soon after discovery as practicable. Those that were detected in multiple observations were thereafter considered confirmed discoveries, after checking the public lists of discoveries by other ongoing surveys. Follow-up observations for this paper targeted all SUPERB discoveries, excluding PSR J14214409 which was observed substantially in the MSP and Binary Pulsar observing programme at Parkes, P789 (PI Spiewak).
Timing observations, as part of the P892 observing programme (PI Keane), began in 2017 October but were ended early in 2018 October when the Multibeam receiver was removed from the Parkes focus cabin to enable observations of Voyager 2 as it passed through the heliopause (Richardson et al., 2019). In 2018 December, we requested and were allocated 4 hours of Parkes Director’s Time to observe 8 pulsars with the Ultra-Wideband Low (UWL; Hobbs et al. 2020) receiver using the Medusa backend, with the intention of further constraining pulsar dispersion measures (DMs) and spectral indices555UWL observations, in fold-mode, were made at 1.0 MHz frequency resolution on 2018 December 16.. For the five pulsars successfully detected with the UWL, the constraints on DM were consistent with those from timing using the 20-cm data (using sub-banded times of arrival (ToAs)), and spectral indices were not significantly constrained, primarily due to low biasing the detections to the – 2 GHz range.
Although most of the pulsars discovered in this survey were originally detected in 560-second pointings, the integration times for follow-up timing have varied from 5 to 60 minutes, depending on the brightness and emission/scintillation timescale of each source. In total, we performed approximately 190 hours of follow-up timing in the P892 programme for the 26 sources in this paper (including two observations of PSR J14214409).
In order to improve the positions of some pulsars (and thereby reduce the integration time required to detect the pulsar signal), we performed “gridding” observations (see, e.g., Morris et al., 2002) of all pulsars requiring less than minutes of integration time. Our procedure was simply to offset the central beam (beyond the half-power point for the beam, but less than the beam separation) in Right Ascension and Declination, for a total of 5 pointings including the initial position. The CASPSR data were then reduced in the same manner as the regular timing observations (summarised below), and the resulting values were fit by a 2-dimensional Gaussian with a full-width-half-maximum (FWHM) of matching that of the central beam of the Parkes Multibeam receiver. Due to scintillation or low detections, the positions derived for most pulsars had large uncertainties and those for only 3 pulsars were used in further observations. These positions were, in fact, closer to the true positions (found through timing) than the discovery positions, with improvements of 1.2 – 4.1 arcmin ( 10 – 30 percent of the beam FWHM) in position accuracy.
2.2 Data Analysis
The processing of the pulsar timing data, using primarily the coherently de-dispersed CASPSR data, was done via a script to ensure consistency and efficiency. The script used system calls to various psrchive routines666http://psrchive.sourceforge.net/ (van Straten et al., 2012), including psrsh commands for RFI excision, pac for polarization and flux density calibration, and psrflux for calculation of flux density values. We additionally observed the standard noise diode for polarization calibration and used observations of Hydra A (primarily from other Parkes projects, such as P456, with permission) for flux density calibration. From the processed data, analytic templates were created from the brightest observation, or the sum of the 5 brightest observations for fainter sources. We formed pulse times of arrival (ToAs) using pat with the Fourier domain with Markov Chain Monte Carlo algorithm (van Straten, 2006), after fully integrating the frequency and polarization channels, with sub-integration lengths varying between 1 and 15 minutes (optimised for per sub-integration). We additionally used sub-banded ToAs (typically with 4 frequency channels per sub-integration) to verify DM values. We used the tempo2 software package777https://bitbucket.org/psrsoft/tempo2/src/master/ (Hobbs et al., 2006) for all timing and used Barycentric Coordinate Time (TCB) units and the DE421 planetary ephemeris model (Folkner et al., 2009).
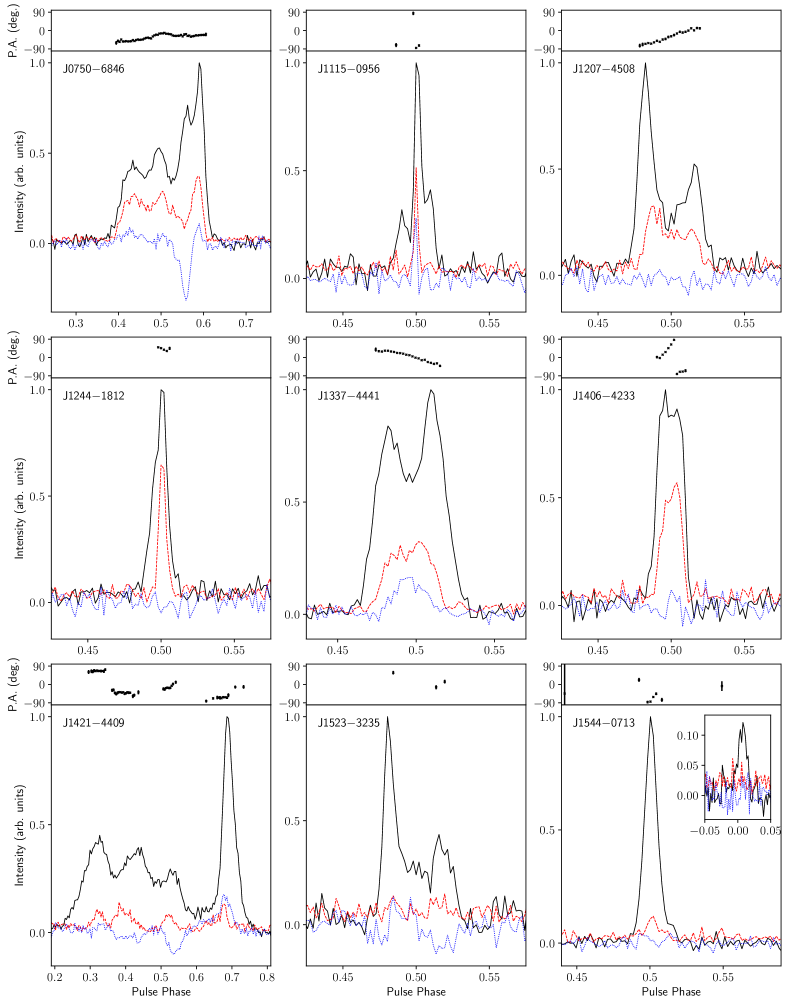
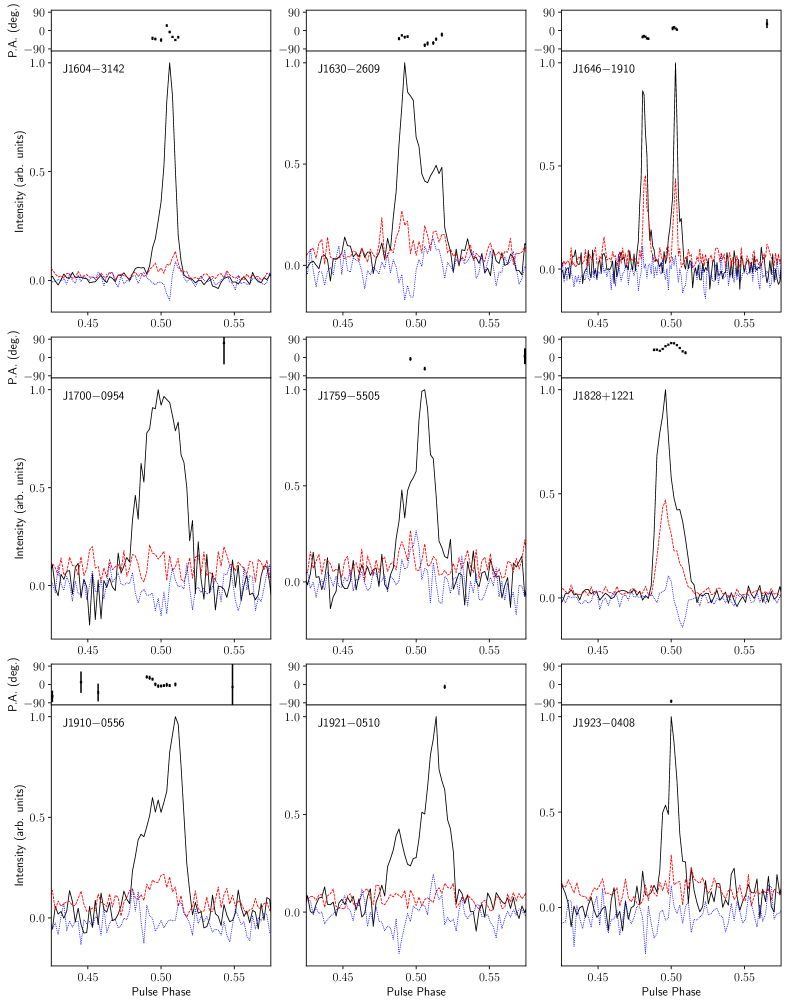
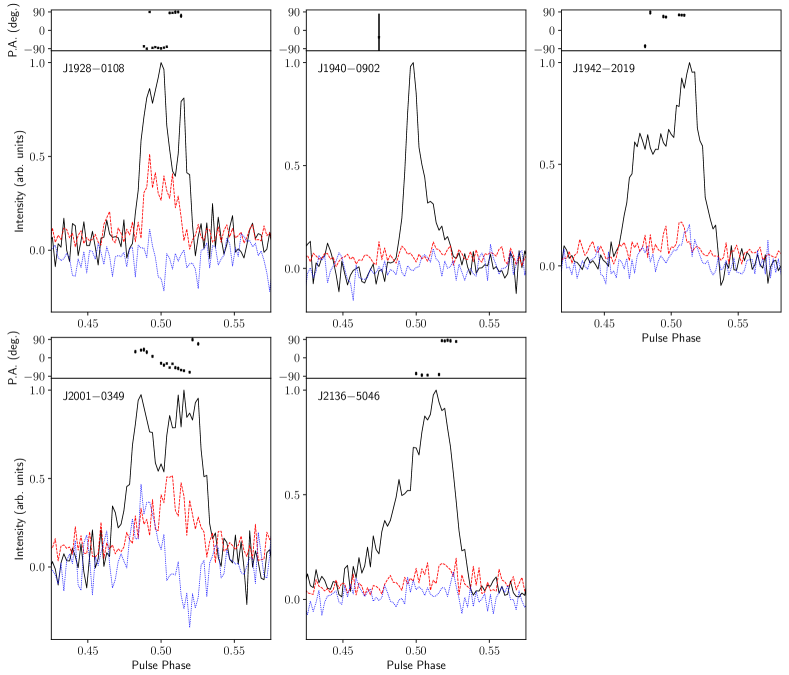
For most of the pulsars, observations with BPSR prior to 2017 October were available and suitable for inclusion in the timing, serving to increase the time span. These data were first folded using dspsr (van Straten & Bailes, 2011) before being processed in the same manner as described above. Templates generated from CASPSR data were used to measure ToAs from the BPSR data. The fitting of timing models had to account for phase jumps between different back-ends, which were not fixed to known values but fit using routine simultaneous observations. We also processed DFB4 data where necessary to replace missing CASPSR observations (as these were recorded simultaneously when possible), and polarization-calibrated DFB4 data were used to produce the pulsar profiles, which are shown in Figures 7–9. Where possible, CASPSR data were preferred over DFB4 data for the timing analyses due to the coherent de-dispersion (which improves the time resolution for MSPs like PSR J14214409) and shorter sub-integrations in the raw data (allowing more precise excision of RFI).
The timing solutions and additional parameters, including polarization properties and flux density measurements, are described in Tables 2 and 3. We measured the flux density of each sub-integration (frequency-integrated to the central frequency of 1382 MHz) and analysed the distributions to determine the median flux density, , in addition to the modulation indices, (using the mean flux density, not the median value). All flux density values have been corrected for position offsets, which vary from 2 to 8 arcmin, using a Gaussian beam correction (see, e.g., Ray et al., 2011). We note that the sub-integrations varied in length from 1 to 15 minutes, affecting our sampling of the scintillation structure, and that all pulsars in our sample should be in the “strong” regime of scintillation. All flux density distributions were limited to exclude sub-integrations where except PSR J13374441, for which we excluded to exclude the nulling behaviour.
| Pulsar | Right | Declination | Period | Period | Reference | Data | r.m.s. | Number |
|---|---|---|---|---|---|---|---|---|
| Ascension | Derivative | Epoch | Span | (Weighted) | of ToAs | |||
| (J2000; h:m:s) | (J2000; d:m:s) | (; s) | (; s s-1) | (MJD) | (yr) | (ms) | ||
| J07506846 | 07:50:35.85(2) | 68:46:33.81(10) | 0.91521580361(7) | 0.1096(7) | 56839 | 3.41 | 1.33 | 85 |
| J11150956* | 11:15:27.361(5) | 09:56:53.1(2) | 1.31089402030(2) | 0.0347(3) | 57317 | 2.94 | 0.527 | 54 |
| J12074508* | 12:07:19.26(2) | 45:08:09.1(4) | 1.769827846(2) | 1.56(2) | 56936 | 1.03 | 1.59 | 186 |
| J12441812* | 12:44:25.78(5) | 18:12:16.2(9) | 3.4253237068(2) | 1.483(12) | 57828 | 1.61 | 1.43 | 46 |
| J13374441 | 13:37:27.749(10) | 44:41:42.3(2) | 1.25751149260(3) | 0.3031(5) | 56933 | 3.49 | 0.878 | 58 |
| J14064233 | 14:06:04.79(3) | 42:33:20.6(3) | 2.4367954316(2) | 0.681(2) | 56846 | 2.94 | 1.56 | 58 |
| J15233235* | 15:23:37.70(3) | 32:35:42.1(5) | 1.5048345580(2) | 0.953(9) | 57934 | 1.25 | 1.38 | 76 |
| J15440713* | 15:44:23.527(2) | 07:13:59.02(12) | 0.484129803194(3) | 1.13663(7) | 57317 | 2.94 | 0.126 | 32 |
| J16043142 | 16:04:36.546(2) | 31:42:06.4(2) | 0.883890454005(11) | 0.0265(2) | 57177 | 2.68 | 0.218 | 29 |
| J16302609* | 16:30:28.99(3) | 26:09:47(3) | 1.91241975129(15) | 1.570(2) | 57214 | 3.22 | 2.16 | 88 |
| J16461910* | 16:46:18.66(11) | 19:10:14(8) | 4.817735830(5) | 10.03(14) | 57823 | 1.03 | 4.31 | 111 |
| J17000954* | 17:00:03.228(12) | 09:54:43.2(8) | 0.81731160245(4) | 0.7520(6) | 57199 | 3.27 | 1.15 | 39 |
| J17595505* | 17:59:34.16(2) | 55:05:30.9(2) | 0.3733921257(2) | 0.439(2) | 57000 | 1.03 | 0.495 | 50 |
| J1828+1221* | 18:28:22.161(9) | +12:21:20.9(2) | 1.52829508058(5) | 1.746(2) | 57734 | 1.76 | 0.557 | 29 |
| J19100556* | 19:10:16.523(7) | 05:56:29.9(4) | 0.55760924800(3) | 0.5961(4) | 57325 | 2.91 | 0.811 | 42 |
| J19210510* | 19:21:29.45(2) | 05:10:10.8(7) | 0.79425387952(6) | 0.6025(13) | 57325 | 2.91 | 2.47 | 119 |
| J19230408* | 19:23:10.96(3) | 04:08:19.4(8) | 1.14926937103(3) | 0.068(13) | 57745 | 2.78 | 4.91 | 163 |
| J19280108* | 19:28:18.93(2) | 01:08:55.7(4) | 2.3657140252(4) | 2.80(2) | 57983 | 1.12 | 1.47 | 179 |
| J19400902* | 19:40:54.530(8) | 09:02:18.0(7) | 0.97846813844(9) | 1.8790(14) | 57410 | 3.25 | 1.24 | 137 |
| J19422019* | 19:42:50.34(8) | 20:19:23(7) | 0.275132723562(8) | 0.0123(2) | 57392 | 2.73 | 0.959 | 68 |
| J20010349* | 20:01:53.31(3) | 03:49:43.5(15) | 1.34472401604(13) | 0.112(2) | 57383 | 2.76 | 4.37 | 75 |
| J21365046* | 21:36:57.593(9) | 50:46:56.08(10) | 0.267322318335(10) | 0.0869(4) | 57812 | 1.59 | 0.876 | 91 |
| Pulsar | DM | Distance | Distance | RM | Linear | Circular | Modulation | Median Flux | Radio | FWHM |
|---|---|---|---|---|---|---|---|---|---|---|
| (ymw16) | (ne2001) | Fraction | Fraction | Index | Density | Luminosity | ||||
| (pc cm-3) | (kpc) | (kpc) | (rad m-2) | (%) | (%) | (; mJy) | (mJy kpc2) | (; ms) | ||
| J07506846 | 53.8(4) | 0.29 | 2.2 | 31(2) | 41(3) | 10(4) | 188.5(9) | |||
| J11150956 | 16.1(2) | 1.1 | 0.68 | 9(10) | 15(4) | 8(4) | 17(1) | |||
| J12074508 | 84.5(5) | 2.6 | 3.1 | 64(5) | 38(3) | – | 73(2) | |||
| J12441812 | 15.5(10) | 1.1 | 0.69 | 4(5) | 35(4) | – | 43(3) | |||
| J13374441 | 97.1(4) | – | 3.6 | 28(2) | 27(3) | 7(3) | 77(1) | |||
| J14064233 | 79.7(8) | 6.8 | 2.6 | 68(3) | 44(3) | – | 45(2) | |||
| J14214409 | 54.642(3) | 2.1 | 1.6 | 21(4) | 9(3) | 11(3) | 0.22(2) | |||
| J15233235 | 72.3(9)a | 8.0 | 2.6 | – | 6(4) | 11(4) | 93(1) | |||
| J15440713 | 30.73(12) | 2.6 | 1.3 | 21(14) | 12(3) | – | 6.1(4) | |||
| J16043142 | 58.3(2) | 2.9 | 1.7 | 37(14) | 15(3) | 6(3) | 7.8(9) | |||
| J16302609 | 76.6(13) | 5.3 | 2.3 | – | 17(4) | 7(4) | 52(2) | |||
| J16461910 | 55(6) | 2.1 | 1.6 | 10(4) | 38(4) | – | b | 132(5) | ||
| J17000954 | 64.1(11) | 0.22 | 2.3 | – | – | – | 33.5(8) | |||
| J17595505 | 63.0(3) | 3.1 | 1.7 | – | 13(4) | 11(4) | 10.2(4) | |||
| J1828+1221 | 69.1(4) | 3.8 | 2.9 | 83(3) | 42(3) | 7(3) | 28.4(15) | |||
| J19100556 | 88.3(7) | 3.8 | 2.7 | 75(20) | 19(4) | – | 15.2(5) | |||
| J19210510 | 96.6(7)a | 5.6 | 3.2 | – | 6(4) | 8(4) | 32.6(8) | |||
| J19230408 | 35(3) | 1.2 | 1.5 | – | 8(5) | – | 14.6(11) | |||
| J19280108 | 125.8(8) | 9.7 | 4.4 | 15(13) | 30(4) | – | 65(2) | |||
| J19400902 | 42.3(5) | 1.9 | 1.7 | – | – | – | 18.2(9) | |||
| J19422019 | 59.9(3) | 5.0 | 2.2 | 17(20) | 11(4) | 5(3) | 16.9(3) | |||
| J20010349 | 67(3) | 6.0 | 2.9 | 79(11) | 34(4) | 13(4) | 83(1) | |||
| J21365046 | 23.3(3) | 2.2 | 0.95 | 24(18) | 11(3) | – | 11.0(3) |
-
a
PSRs J15233235 and J19210510 were also detected in the Green Bank North Celestial Cap (GBNCC) pulsar survey at 350 MHz with DM values of 73.3(3) and 97.5(2) pc cm-2, respectively (McEwen et al., 2020).
-
b
The flux density and modulation index of PSR J16461910 were derived from the single-pulse distribution described in Section 3.1.
3 Individual Pulsars of interest
This survey, which repeats observing pointings and is therefore more sensitive to faint scintillating sources and intermittent or nulling pulsars than previous surveys, has revealed four new pulsars with detection fraction888The detection fraction is here defined as the number of observations in which the pulsar was detected at divided by the total number of observations of the source. No correction has been made for the offset of the beam before the pulsar position was determined. percent. The observation times for each source have been adjusted to minimise non-detections due to scintillation. Two of these sources, PSRs J16461910 and J062155 have been classified as RRATs, being only (or most significantly) detected via their single pulses.
3.1 PSR J16461910
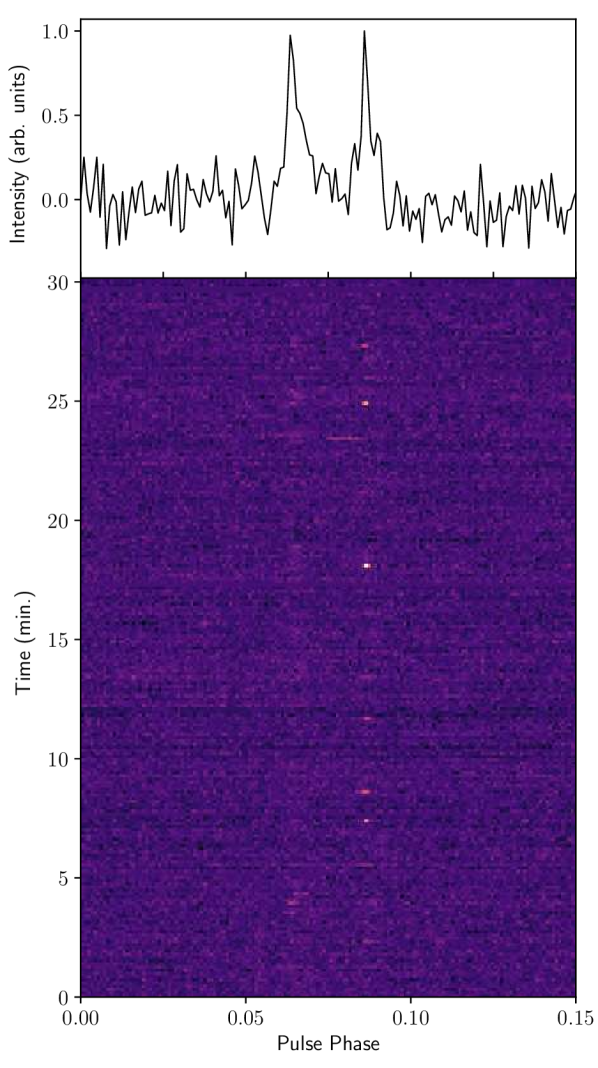
PSR J16461910 was initially discovered in the single-pulse pipeline showing 3 pulses in 560 seconds. It was not detected in the periodicity search, something that is not uncommon for long-period radio-emitting neutron stars with broad pulse amplitude distributions (Keane & McLaughlin, 2011). Upon further observation, and the detection of more pulses, the -s pulse period was identified, enabling folding of available data to look for any lower level periodic emission and a more in-depth assessment of the pulse amplitude distribution. Follow-up observations with 1800-s integrations showed the average phase-folded flux density to be sub-threshold in % of observations even with the deeper pointings, but bright single pulses could be seen in the majority of observations.
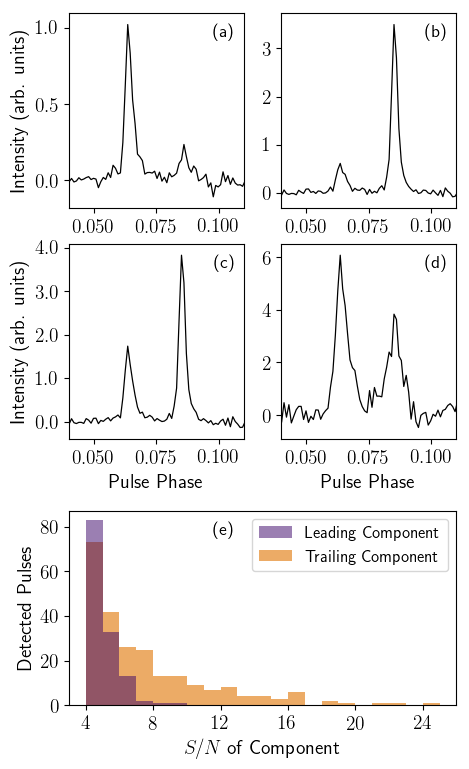
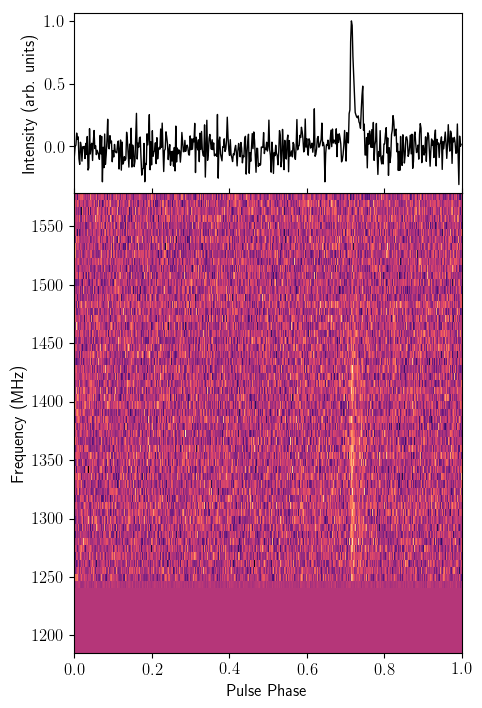
Fig. 3 shows an example 30-minute observation, recorded with the CASPSR system, which has a fixed sub-integration length of 8 s. This is not ideal for this pulsar, as each sub-integration contains 1.66 periods; this only minimally affects detectability but can skew emission statistics. The of the integrated profile of all BPSR observations summed together is , in a total of 13.0 hours, corresponding to a phase-averaged flux density of mJy, using the reported SEFD for the CASPSR/BPSR observing system from Jankowski et al. (2018) and after correcting for the offset from the pulsar position. We further estimated the modulation index from the values per sub-integration, calculated in the limited phase range , selecting only sub-integrations with and with the peak value in the expected ranges for the two components (as described below). The modulation index, , is similar to those of the other SUPERB pulsars (listed in Table 3) but likely reflects intrinsic variations in the emission rather than effects of the interstellar medium, since we calculate this using single-pulse sub-integrations. We note that the values of single pulses shown in Fig. 4 imply a single-pulse flux density of up to Jy for the trailing component (up to Jy for the leading component).
A closer inspection of the single-pulse sub-integrations from all observations of PSR J16461910 reveals the nature of the pulsar as a faint source with bright single pulses. We examined the single-pulse sub-integrations of the total 13.15 hours of observations (13.0 hours after removing RFI-contaminated sub-integrations) and identified the sub-integrations with detectable pulses according to the following criteria: A) calculated with an on-pulse region in the phase range 0.059–0.07 (the leading component) or 0.08–0.093 (the trailing component) and off-pulse in the phase range 0.0–0.15, excluding the component region; B) width of the candidate pulse bin; and C) visual inspection to remove remaining RFI and spurious detections. Fig. 4 shows four selections of the data (out of 9734 sub-integrations, with 1% deleted due to RFI): The top two panels show the integrated profiles for the sub-integrations selected only for the presence of each component, excluding the sub-integrations in which both components are detected. The middle-left panel shows the integrated profile for all sub-integrations with either or both components detected. The middle-right panel shows the remaining sub-integrations, with neither component detected above the threshold, showing both components have significant sub-threshold emission. In the bottom panel of Fig. 4, the histograms of for each component are approximately log-normal, with a larger number of bright pulses from the trailing component. From these statistics, assuming the emission of bright pulses is independent and random, we estimate an average of 1 pulse with every 26 rotations ( seconds).
3.2 PSR J1337–4441
PSR J13374441 is a 1.3-second pulsar that is observed to null on timescales of minutes, as noted in Paper I. As shown in Fig. 7, the pulsar has a double-peaked profile with significant linear and circular polarization. With a DM of 97.1 pc cm-3, the ymw16 electron density model estimates a distance of kpc, indicating the model does not account for the observed DM along the line-of-sight (the maximum DM along the line-of-sight is given as 95.56 pc cm-3). The ne2001 model, however, yields a distance of only 3.6 kpc. Clearly the distance to this pulsar is highly uncertain. Nevertheless, we use this lower value when calculating the radio luminosity in Table 3 but caution that it could be significantly higher. The pulsar, when not nulled, is bright (median mJy), and has a modulation index of 0.45 (after integrating to 64-second sub-integrations and excluding sub-integrations where ).
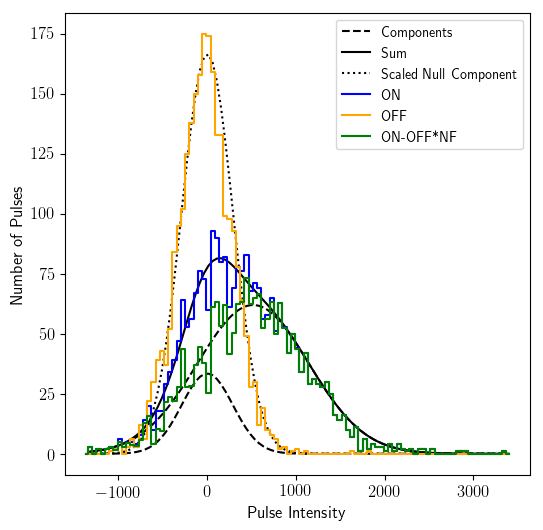
To determine the nulling fraction of this pulsar, we implemented the Gaussian mixture method from Kaplan et al. (2018), using hours of BPSR observations, folded using the timing ephemeris to produce single-pulse sub-integrations, which were then integrated by a factor of 7 to improve . The measured pulse intensities, summed over the given phase ranges, are calculated for each sub-integration for the on-pulse (phase range 0.45–0.55 as shown in Fig. 7) and off-pulse (90∘ from the on-pulse region) regions. The Gaussian mixture method fits two Gaussian components to the on-pulse intensity distribution: one of the components models the nulls and the other the detected pulses. The component modelling the nulls is then scaled to the amplitude of the off-pulse intensity distribution, giving the nulling fraction as the ratio of the amplitudes. We show the distributions of measured pulse intensities and the Gaussian model in Fig. 5. The nulling fraction was found to be , and a Kolmogorov–Smirnov test comparing the model fit to the on-pulse intensity distribution returned a value of 0.013, corresponding to a -value of 0.8, indicating no evidence to reject the null hypothesis that the data were sampled from the best-fit distribution. For each sub-integration, the probability of nulling was also calculated, and we use this to estimate the nulling timescale by determining numbers of successive pulses with nulling probabilities greater than 62% of the maximum.999The maximum null probability varies depending on the per sub-integration. The threshold of 62% was selected based on fig. 1 from Kaplan et al. (2018), and the results were compared with a by-eye estimation and found to be reliable. We find that the null lengths are pulse periods on average (39 seconds) and range from 7 to pulse periods, or a few seconds to minutes. The longest null confirmed by eye was approximately 8 minutes. We note that the pulsar was too faint to use single-pulse sub-integrations, and the data was integrated by a factor of 7 to ensure significant signal in each sub-integration. Therefore, the nulling fraction is an underestimate of the true value, and the estimation of the nulling timescale is insensitive to nulls of less than 7 pulse periods. The lengths of the observations included in this analysis range between 270 and 1200 s, so we are likewise insensitive to nulls of longer timescales, but the presence of emission in every available observation does not support the possibility of long nulls being common.
3.3 Improved timing solution for PSR J14214409
One of the two MSPs found in SUPERB, J14214409, is a 6.4-ms pulsar with a likely white dwarf companion in a 30.7-day orbit (Paper I). The pulsar has continued to be observed regularly at Parkes in a separate programme (P789, PI Spiewak), and now has approximately 3 times as many ToAs extending over a baseline of 5.1 years. This yields a significantly improved timing solution, in particular a significant proper motion measurement and a 4- detection of the time derivative of the semi-major axis, lt-s s-1. Using the improved proper motion measurements, we re-derive the transverse velocity and account for the Shklovskii effect on the period derivative (Shklovskii, 1970), resulting in an estimated intrinsic period derivative of s s-1 as compared to the observed period derivative of s s-1. We also derive an upper limit on the contribution from the orbital period derivative, . Additionally, with a single observation with the UWL, we were able to significantly improve upon the previous DM value. The pulsar signal was faint across most of the 3.3 GHz band, but we formed ToAs from 10 frequency channels from 700 MHz to 1340 MHz and derived the new value of 54.642(3) pc cm-2, assuming no profile evolution across the band. The improved ephemeris and derived parameters are given in Table 4 (polarization parameters are provided in Table 3) and the pulse profile and position angle sweep are shown in Fig. 7.
| Parameter | Value |
|---|---|
| Right Ascension (J2000) (h:m:s) | 14:21:20.96387(5) |
| Declination (J2000) (d:m:s) | 44:09:04.553(1) |
| Period, (s) | 0.0063857288383424(1) |
| Period derivative, (s s-1) | |
| Period epoch (MJD) | 57775.4 |
| DM (pc cm-3) | 54.642(3) |
| Proper motion in RA (mas yr-1) | 11.6(4) |
| Proper motion in Dec (mas yr-1) | 7.9(8) |
| Binary model | ELL1 |
| Orbital period, (d) | 30.74645342(3) |
| (s s-1) | |
| Semi-major axis, (lt-s) | 12.706667(1) |
| (lt-s s-1) | |
| (MJD) | 57762.4168881(5) |
| Units | TCB |
| Solar System Ephemeris | DE421 |
| Data span (yr) | 5.1 |
| Weighted RMS residual (s) | 6.61 |
| Number of ToAs | 333 |
| Additional Parameters | |
| 8.5 | |
| (mas yr-1) | 14.0(6) |
| (km s-1) | 140(30) |
| (s s-1) | |
| Eccentricity, | |
| (deg) | 37.3(8) |
| Mass function (M⊙) | 0.002330190(7) |
| Min. companion mass (M⊙) | 0.1757 |
| (at GHz; ms) | 2.72(2) |
3.4 Unsolved objects: J032629, J062155, J13064035
Three pulsars remain unsolved after completion of timing observations due to insufficient detections, and these are summarised in Table 5 and are described below.
The FFT search pipeline revealed in early 2017 a candidate with a period of 0.7679 s and a DM of 37 pc cm-3, PSR J032629 (see Fig. 6). The source was immediately re-observed three times, for a total of 32 minutes in close succession, and was detected in each observation with 10–20. The source was also detected in a blind search with the FFA pipeline in earlier observations. However, in 15 hours of follow-up during the regular timing programme, no emission was detected, indicating the source is likely intermittent with a nulling fraction of 0.9.
PSR J062155 was discovered in a single-pulse search in early 2015 (Paper I) with a DM of 23 pc cm-3, but the period has not been determined. A total of 6 pulses (with 10–30) have been detected at the position of PSR J062155 with similar widths and DMs, out of a total of hours, with no pulses detected with 10 (above the threshold of 6.5). The minimum separation of the detected pulses is seconds.
| Pulsar | RA | Declination | Period | DM |
|---|---|---|---|---|
| (J2000; h:m:s) | (J2000; d:m:s) | (ms) | (pc cm-3) | |
| J032629 | 03:26(2) | 28:50(7) | 767.903(6) | 32(4) |
| J062155 | 06:22(2) | 55:57(7) | – | 23 |
| J13064035 | 13:06:56.0(5) | 40:35:23(7) | 2.20453(2) | 34.95(6) |
In addition, PSR J13064035, a redback originally published as J130640 in Paper I, has not been solved. The pulsar has a rotational period (from the discovery observations) of 2.20453 ms and a DM of pc cm-3, and an orbital period of 26.3 hr (Paper I), which was confirmed via its optical and X-ray counterparts Linares 2018). Recently, Swihart et al. (2019) analysed optical data of the source and determined additional orbital parameters, including the minimum mass of the neutron star, . The 4 detections reported in Paper I correspond to orbital phases 0.6–0.8 based on the orbital parameters from Swihart et al. (2019). In this convention, the pulsar is on the far side at orbital phase 0.25. The source has been observed numerous times as part of the P892 and P789 programmes, but preliminary searches of the data have been largely unfruitful. An observing programme targeting optimal orbital phases when the pulsar is on the near side of the companion would help increase the detection fraction.
4 Discussion and Conclusions
The SUPERB programme has discovered 27 pulsars to date. The repetition of observations at the same position enables us to detect a significant number of RRATs, nulling pulsars, and intermittent pulsars, and faint pulsars with large modulation indices, like PSR J16461910. Continued searches of the data could potentially reveal several more such sources, in addition to ordinary pulsars in the remaining data.
4.1 Polarization
Figures 7–9 show the calibrated profiles and polarization position angle measurements for 23 pulsars. The polarization fractions (listed in Table 3) are consistent with those found for similar pulsars. In particular, Johnston & Kerr (2018) have examined the correlation between the spin-down luminosities, , and fraction of linear polarization for pulsars, including young pulsars. They find, in agreement with Weltevrede & Johnston (2008), that the linear polarization fractions of low- pulsars generally do not exceed 55%, with few exceptions. The SUPERB pulsars, with values ranging from to erg s-1, further confirm this apparent upper limit on the linear polarization distribution, with the highest measured value of 44%.
Additionally, 16 pulsars have Rotation Measures (RMs) determined using rmfit to fit the polarization position angle across the 256 MHz band of the DFB4 data (the fit for PSR J14214409 used the 320 MHz CASPSR data). The values were checked using the rmfit brute force method to find the peak linear polarization fraction as a function of RM. The measured RMs are not unusually high, with the largest RM/DM for PSR J1828+1221 corresponding to a line-of-sight average magnetic field strength of 1.47 G.
4.2 Detections in Other Surveys
Two of the pulsars discovered in SUPERB, PSRs J15233235 and J19210510, were detected in the GBNCC pulsar survey (McEwen et al. 2020; listed as J152433 and J192105B therein), as noted in Table 3. The GBNCC survey (Stovall et al., 2014) uses a central frequency of 350 MHz, thereby allowing a more precise measurement than ours of the DMs. For PSRs J15233235 and J19210510, the DMs resulting from the GBNCC survey are 73.3(3) and 97.5(2) pc cm-2, respectively, consistent at the 1- level with our measurements at 1400 MHz. Also, by using the radiometer equation to estimate the flux density from the measured of the detections, McEwen et al. (2020) derive flux density values () of 2.0(5) and 1.8(4) mJy, respectively. Combined with our measurements and assuming standard power-law spectra, the estimated spectral indices of PSRs J15233235 and J19210510 read and , both of which are consistent with the average power-law spectral index of the pulsar population (; Jankowski et al. 2018).
We also retrieved archival data from the HTRU hilat survey near the positions of our discoveries and folded the closest observations (within arcmin) using our finalised ephemerides. Of the 69 observations within 12 arcmin of the pulsar positions101010We excluded the unsolved sources from our search for HTRU hilat data, and PSR J1828+1221 was outside the region observed by HTRU, leaving 21 pulsars with hilat observations within 12 arcmin., 47 were available to us for folding111111The remaining 22 hilat observations were not accessible at the time of this analysis.. With a threshold of 8, we detected 9 SUPERB pulsars in the available hilat data: PSRs J11150956, J13374441 (2 detections), J14214409, J15440713 (2 detections), J16461910, J17000954, J17595505, J19210510, and J19422019. We note that the detections of PSRs J17000954 and J17595505 had , but the pulses appeared consistent with the width and shape of the signals from SUPERB data, and we then consider those genuine detections. We further note that a third observation of J15440713 appeared to have a signal with the correct characteristics but had .
In order to address the reasons for the non-detection of these pulsars in the HTRU hilat survey, we note that the latter survey has not been searched with an FFA so far (Morello et al., 2019), and that 6 out of the 9 pulsars above were indeed initially detected in SUPERB by using an FFA search. There are two likely causes to the superior sensitivity of the FFA in the SUPERB survey processing: firstly that the method is fully phase-coherent, as opposed to the standard FFT method that employs incoherent harmonic summing; secondly, that the low-frequency noise mitigation algorithms routinely employed in FFT search codes (so-called “spectral whitening”) have been shown to significantly reduce the sensitivity to longer period ( s) pulsars (e.g., Lazarus et al., 2015; Cameron et al., 2017; van Heerden et al., 2017; Parent et al., 2018). An in-depth theoretical comparison between the sensitivity of the FFA and the standard FFT method will be published soon (Morello et al., 2020a, submitted) along with an improved version of the FFA software that was used in the first SUPERB FFA search. Thus, a new search of the SUPERB data with this new software should enhance even more the sensitivity to long period and short duty cycle pulsars.
Data Availability
Data obtained in Parkes observing programmes P858, P892, and P789 are archived for long-term storage on the CASS/ANDS data server121212https://data.csiro.au/dap/public/atnf/pulsarSearch.zul. These data are publicly available 18 months from the day they are recorded. The data are recorded in sigproc filterbank format, a de facto standard for pulsar search data, and are converted to psrfits format for upload to the data server. Some reduced data products (pulsar ephemerides, ToAs, and polarization profiles) can be accessed directly from the Zenodo repository at https://doi.org/10.5281/zenodo.3900980.
Acknowledgements
The authors thank the anonymous referee and scientific editor for their detailed comments that significantly improved this manuscript. The authors acknowledge colleagues who contributed to the completion of the SUPERB survey and indirectly to this project, including Ramesh Bhat, Manisha Caleb, Wael Farah, and Andrew Jameson. This research was funded partially by the Australian Government through the Australian Research Council, grants CE170100004 (OzGrav) and FL150100148. FJ and VM acknowledge funding from the European Research Council (ERC) under the European Union’s Horizon 2020 research and innovation programme (grant agreement No. 694745). The Parkes radio telescope is part of the Australia Telescope National Facility which is funded by the Australian Government for operation as a National Facility managed by CSIRO. This work used the gSTAR national facility which is funded by Swinburne and the Australian Government’s Education Investment Fund. This work also used the OzSTAR national facility at Swinburne University of Technology. OzSTAR is funded by Swinburne University of Technology and the National Collaborative Research Infrastructure Strategy (NCRIS). This research made use of Astropy, a community-developed core Python package for Astronomy (Astropy Collaboration et al., 2013, 2018), the Scipy package (Virtanen et al., 2020), and the Matplotlib package (Hunter, 2007).
References
- Astropy Collaboration et al. (2013) Astropy Collaboration et al., 2013, A&A, 558, A33
- Astropy Collaboration et al. (2018) Astropy Collaboration et al., 2018, AJ, 156, 123
- Bailes et al. (1994) Bailes M., et al., 1994, ApJ, 425, L41
- Bates et al. (2011) Bates S. D., et al., 2011, MNRAS, 416, 2455
- Bhandari et al. (2018a) Bhandari S., et al., 2018a, MNRAS, 475, 1427
- Bhandari et al. (2018b) Bhandari S., et al., 2018b, The Astronomer’s Telegram, 12060, 1
- Burke-Spolaor et al. (2011) Burke-Spolaor S., et al., 2011, MNRAS, 416, 2465
- Caleb et al. (2018) Caleb M., et al., 2018, MNRAS, 478, 2046
- Cameron et al. (2017) Cameron A. D., Barr E. D., Champion D. J., Kramer M., Zhu W. W., 2017, MNRAS, 468, 1994
- Champion et al. (2016) Champion D. J., et al., 2016, MNRAS, 460, L30
- Chen & Ruderman (1993) Chen K., Ruderman M., 1993, ApJ, 402, 264
- Eatough et al. (2009) Eatough R. P., Keane E. F., Lyne A. G., 2009, MNRAS, 395, 410
- Faulkner et al. (2004) Faulkner A. J., et al., 2004, MNRAS, 355, 147
- Folkner et al. (2009) Folkner W. M., Williams J. G., Boggs D. H., 2009, Interplanetary Network Progress Report, 42-178, 1
- Hobbs et al. (2004) Hobbs G., et al., 2004, MNRAS, 352, 1439
- Hobbs et al. (2006) Hobbs G. B., Edwards R. T., Manchester R. N., 2006, MNRAS, 369, 655
- Hobbs et al. (2020) Hobbs G., et al., 2020, Publ. Astron. Soc. Australia, 37, e012
- Hunter (2007) Hunter J. D., 2007, Computing In Science & Engineering, 9, 90
- Jankowski et al. (2018) Jankowski F., van Straten W., Keane E. F., Bailes M., Barr E. D., Johnston S., Kerr M., 2018, MNRAS, 473, 4436
- Johnston & Kerr (2018) Johnston S., Kerr M., 2018, MNRAS, 474, 4629
- Johnston et al. (1993) Johnston S., et al., 1993, Nature, 361, 613
- Kaplan et al. (2018) Kaplan D. L., Swiggum J. K., Fichtenbauer T. D. J., Vallisneri M., 2018, ApJ, 855, 14
- Keane & McLaughlin (2011) Keane E. F., McLaughlin M. A., 2011, Bulletin of the Astronomical Society of India, 39, 333
- Keane et al. (2014) Keane E. F., et al., 2014, A Cosmic Census of Radio Pulsars with the SKA (arXiv:1501.00056)
- Keane et al. (2016) Keane E. F., et al., 2016, Nature, 530, 453
- Keane et al. (2018) Keane E. F., et al., 2018, MNRAS, 473, 116
- Keith et al. (2009) Keith M. J., Eatough R. P., Lyne A. G., Kramer M., Possenti A., Camilo F., Manchester R. N., 2009, MNRAS, 395, 837
- Keith et al. (2010) Keith M. J., et al., 2010, MNRAS, 409, 619
- Knispel et al. (2013) Knispel B., et al., 2013, ApJ, 774, 93
- Kramer et al. (2003) Kramer M., et al., 2003, MNRAS, 342, 1299
- Lazarus et al. (2015) Lazarus P., et al., 2015, ApJ, 812, 81
- Linares (2018) Linares M., 2018, MNRAS, 473, L50
- Lorimer et al. (1995) Lorimer D. R., et al., 1995, ApJ, 439, 933
- Lorimer et al. (2006) Lorimer D. R., et al., 2006, MNRAS, 372, 777
- Manchester et al. (2001) Manchester R. N., et al., 2001, MNRAS, 328, 17
- Manchester et al. (2005) Manchester R. N., Hobbs G. B., Teoh A., Hobbs M., 2005, AJ, 129, 1993
- McEwen et al. (2020) McEwen A. E., et al., 2020, ApJ, 892, 76
- Mickaliger et al. (2018) Mickaliger M. B., McEwen A. E., McLaughlin M. A., Lorimer D. R., 2018, MNRAS, 479, 5413
- Morello et al. (2014) Morello V., Barr E. D., Bailes M., Flynn C. M., Keane E. F., van Straten W., 2014, MNRAS, 443, 1651
- Morello et al. (2019) Morello V., et al., 2019, MNRAS, 483, 3673
- Morello et al. (2020a) Morello V., Barr E. D., Stappers B. W., Keane E. F., Lyne A. G., 2020a, arXiv e-prints, p. arXiv:2004.03701
- Morello et al. (2020b) Morello V., et al., 2020b, MNRAS, 493, 1165
- Morris et al. (2002) Morris D. J., et al., 2002, MNRAS, 335, 275
- Parent et al. (2018) Parent E., et al., 2018, ApJ, 861, 44
- Petroff et al. (2019) Petroff E., et al., 2019, MNRAS, 482, 3109
- Price et al. (2016) Price D. C., Staveley-Smith L., Bailes M., Carretti E., Jameson A., Jones M. E., van Straten W., Schediwy S. W., 2016, Journal of Astronomical Instrumentation, 5, 1641007
- Ray et al. (2011) Ray P. S., et al., 2011, ApJS, 194, 17
- Richardson et al. (2019) Richardson J. D., Belcher J. W., Garcia-Galindo P., Burlaga L. F., 2019, Nature Astronomy, 3, 1019
- Sarkissian et al. (2011) Sarkissian J. M., Carretti E., van Straten W., 2011, in Burgay M., D’Amico N., Esposito P., Pellizzoni A., Possenti A., eds, American Institute of Physics Conference Series Vol. 1357, American Institute of Physics Conference Series. pp 351–352, doi:10.1063/1.3615155
- Shklovskii (1970) Shklovskii I. S., 1970, Soviet Ast., 13, 562
- Staelin (1969) Staelin D. H., 1969, IEEE Proceedings, 57, 724
- Staveley-Smith et al. (1996) Staveley-Smith L., et al., 1996, Publ. Astron. Soc. Australia, 13, 243
- Stovall et al. (2014) Stovall K., et al., 2014, ApJ, 791, 67
- Swihart et al. (2019) Swihart S. J., Strader J., Chomiuk L., Shishkovsky L., 2019, ApJ, 876, 8
- Thornton et al. (2013) Thornton D., et al., 2013, Science, 341, 53
- Virtanen et al. (2020) Virtanen P., et al., 2020, Nature Methods, 17, 261
- Weltevrede & Johnston (2008) Weltevrede P., Johnston S., 2008, MNRAS, 391, 1210
- Yao et al. (2017) Yao J. M., Manchester R. N., Wang N., 2017, ApJ, 835, 29
- Zhang et al. (2000) Zhang B., Harding A. K., Muslimov A. G., 2000, ApJ, 531, L135
- van Heerden et al. (2017) van Heerden E., Karastergiou A., Roberts S. J., 2017, MNRAS, 467, 1661
- van Straten (2006) van Straten W., 2006, ApJ, 642, 1004
- van Straten & Bailes (2011) van Straten W., Bailes M., 2011, Publ. Astron. Soc. Australia, 28, 1
- van Straten et al. (2012) van Straten W., Demorest P., Oslowski S., 2012, Astronomical Research and Technology, 9, 237
Appendix A Integrated Pulse Profiles
We show the integrated profiles for each of the 23 solved pulsars with polarization properties including the polarization position angle (P.A.). All profiles except that of PSR J14214409 are from incoherently de-dispersed DFB4 data, but the DM smearing in any channel is negligible (PSR J14214409 was observed with coherent de-dispersion with CASPSR).