Control of Dendrites in Rechargeable Batteries using Smart Charging
Abstract
In this paper we develop a feed-back control framework for the real-time minimization of microstructures grown within the rechargeable battery. Due to quickening nature of the branched evolution, we identify the critical ramified peaks in the early stages and based on the state we compute the relaxation time for the concentration in those branching fingers. The control parameter is a function of the maximum curvature (i.e. minimum radius) of the branched microstructure, where the higher rate dendritic evolution would lead to the more critical state to be controlled. The charging time is minimized for generating the most packed microstructures and obtained results correlate closely with those of considerably higher charging time periods. The developed framework could be utilized as a smart charging protocol for the safe and sustainable operation the rechargeable batteries, where the branching of the microstructures could be correlated to the sudden variation in the current/voltage.
American University of Beirut, Riad El-Solh, Lebanon 1107 2020
Bahçeşehir University, 4 Çırağan Cad, Beşiktaş, Istanbul, Turkey 34353
California Institute of Technology, 1200 E California Blvd, Pasadena, CA 91125
1 Introduction
The modern era of wireless revolution and portable electronics demands the utilization of reliable intermittent renewables and long-lasting electrical energy storage facilities [1, 2]. As well, the growing demand for portable computational power as well as the introduction of electric vehicles demand novel and reliable high capacity energy storage devices. Despite such impressive growth of the need in the daily lifestyle, the underlying science remains to be developed. Rechargeable batteries, which retrieve/store energy from/within the chemical bonds, have proven the be the most reliable and cleanest resource of electrical energy for the efficient management of the power. [3, 4] Metallic electrodes such as lithium [5], sodium [6], magnesium [7], and zinc [8] are arguably highly attractive candidates for use in high-energy and high-power density rechargeable batteries. Lithium possess the lowest mass density () and the highest electropositivity ( vs SHE111: Standard Hydrogen Electrode, taken conventionally as the reference ()) which provides the highest gravimetric energy density and likely the highest voltage output, making it suitable for high-power applications such as electric vehicles [9, 10, 11]. Sodium has a lower cost and is more earth abundant and is operational for large-scale stationary energy storage applications [12]. Magnesium possess a high specific capacity and reactivity [13] whereas Zinc is earth-abundant, has low cost and high storage capacity [14].
During the charging, the fast-pace formation of microstructures with relatively low surface energy from Brownian dynamics, leads to the branched evolution with high surface to volume ratio [10]. The quickening tree-like morphologies could occupy a large volume, possibly reach the counter-electrode and short the cell. Additionally, they can also dissolve from their thinner necks during subsequent discharge period and form detached dead crystals, leading to thermal instability and capacity decay [15, 16]. The quickening tree-like morphologies could occupy a large volume, possibly reach the counter-electrode and short the cell. Additionally, they can also dissolve from their thinner necks during subsequent discharge period. Such a formation-dissolution cycle is particularly prominent for the metal electrodes due to lack of intercalation222Intercalation: diffusion into inner layer as the housing for the charge, as opposed to depositing in the surface., where the depositions in the surface is the only dominant formation mechanism versus the diffusion into the inner layers as the housing [17, 18] The growing amorphous crystals can pierce into the polymer electrolyte and short the cell afterwards, given their higher porosity, they could have mechanical properties comparable to the bulk form [19].
Previous studies have investigated various factors on dendritic formation such as current density [20], electrode surface roughness [21, 22], impurities [23], solvent and electrolyte chemical composition [24, 25], electrolyte concentration [26], utilization of powder electrodes [27] and adhesive polymers[28], temperature [29, 30], guiding scaffolds [31, 32], capillary pressure [33], cathode morphology [34] and mechanics [35, 36, 37, 38]. Some of conventional characterization techniques used include NMR [39] and MRI. [40] Recent studies also have shown the necessity of stability of solid electrolyte interphase (i.e. SEI) layer for controlling the nucleation and growth of the branched medium [41, 42] as well as pulse charging [43, 44, 45].
Earlier model of dendrites had focused on the electric field and space charge as the main responsible mechanism [46] while the later models focused on ionic concentration causing the diffusion limited aggregation (DLA). [47, 48, 49, 50] Both mechanisms are part of the electrochemical potential [51, 52], indicating that each could be dominant depending on the localizations of the electric potential or ionic concentration within the medium. Recent studies have explored both factors and their interplay, particularly in continuum scale and coarser time intervals, matching the scale of the experimental time and space [53]. Other simplified frameworks include phase field modeling [54, 55, 56] and analytical developments [57].
During charge period the ions accumulate at the dendrites tips (unfavorable) due to high electric field in convex geometry and at the same time tend to diffuse away to other less concentrated regions due to diffusion (favorable). Such dynamics typically occurs within the double layer (or stern layer [58]) which is relatively small and comparable to the Debye length. In high charge rates, the ionic concentration is depleted on the reaction sites and could tend to zero [50]; Nonetheless, our continuum-level study extends to larger scale, beyond the double layer region [59]
Dendrites instigation is rooted in the non-uniformity of electrode surface morphology at the atomic scale combined with Brownian ionic motion during electrodeposition. Any asperity in the surface provides a sharp electric field that attracts the upcoming ions as a deposition sink. Indeed the closeness of a convex surface to the counter electrode, as the source of ionic release, is another contributing factor. In fact, the same mechanism is responsible for the further semi-exponential growth of dendrites in any scale. During each pulse period the ions accumulate at the dendrites tips (unfavorable) due to high electric field in convex geometry and during each subsequent rest period the ions tend to diffuse away to other less concentrated regions (favorable). The relaxation of ionic concentration during the idle period provides a useful mechanism to achieve uniform deposition and growth during the subsequent pulse interval. Such dynamics typically occurs within the double layer (or stern layer [58]) which is relatively small and comparable to the Debye length. In high charge rates, the ionic concentration is depleted and concentration on the depletion reaches zero [50]; Nonetheless, our continuum-level study extends to larger scale, beyond the double layer region [53].
Pulse method has been qualitatively proved as a powerful approach for the prevention of dendrites [43], which has previously been utilized for uniform electroplating [60]. In the preceding publication we have experimentally found that the optimum rest period correlates well with the relaxation time of the double layer for the blocking electrodes which is interpreted as the RC time of the electrochemical system [61]. We have explained qualitatively how relatively longer pulse periods with identical duty cycles will lead to longer and more quickening growing dendrites. We developed coarse grained computationally affordable algorithm that allowed us reach to the experimental time scale (). We have developed theoretical limit the optimal minimization of the dendrites [45] and we have obtained the pulse charging parameters for individual curved peaks based on their curvature [59].
In this paper, we elaborate on the real-time controlling of the pulse charging parameters for the minimization of microstructures grown in the scales extending to the cell domain. We analyze the oscillatory behavior and the transition from initial to steady-state growth regimes.
2 Methodology
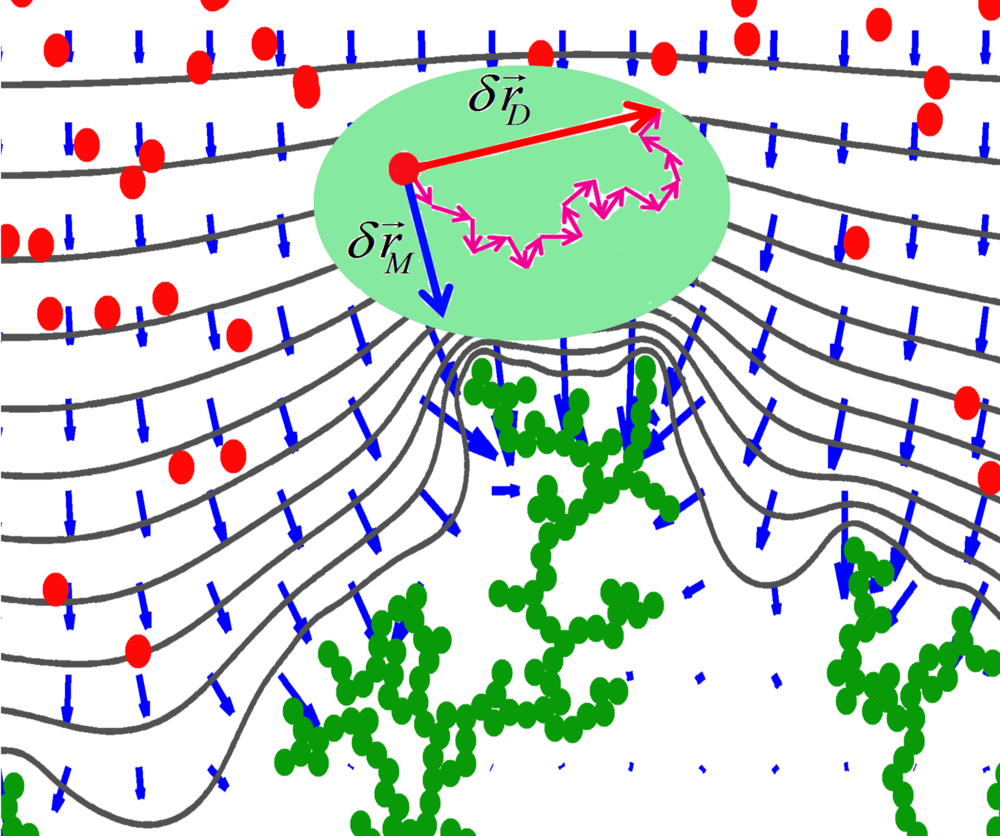

The electrochemical flux is generated either from the gradients of concentration () or electric potential (). In the ionic scale, the regions of higher concentration tend to collide and repel more and, given enough time, diffuse to lower concentration zones, following Brownian motion. In the continuum (i.e. coarse) scale, such inter-collisions could be added-up and be represented by the diffusion length as: [53] 333The diffusion coefficient is generally concentration dependent [44], due to electro-neutrality within the considerable space in the domain and we assume it is constant in the range considered.
| (1) |
where is diffusion displacement of individual ion, is the ionic diffusion coefficient in the electrolyte, is the coarse time interval 444 where is the inter-collision time, typically in the range of ., and is a normalized vector in random direction, representing the Brownian dynamics. The diffusion length represents the average progress of a diffusive wave in a given time, obtained directly from the diffusion relationship [62].
On the other hand, ions tend to acquire drift velocity in the electrolyte medium when exposed to electric field and during the given time their progress is given as:
| (2) |
where is the mobility of cations in electrolyte, is the local electric field. The voltage is obtained from the laplacian relationship in the domain as:
| (3) |
where the dendrite body is part of the boundary condition per see. The electric field is the gradient of electric potential as:
| (4) |
Therefore the total effective displacement with neglecting convection555Since Rayleigh number is highly dependent to the thickness (i.e. ), for a thin layer of electrodeposition we have and thus the convection is negligible. [63] would be:
| (5) |
as represented in the Figure 2. The pulse charging in its simplest form consists of trains of square active period , followed by a square rest interval in terms of current or voltage as shown in Figure 2. The period is the time lapse of a full cycle. Hence the pulse frequency is:
| (6) |
and the duty cycle represents the fraction of time in the period that the pulse is active :
| (7) |
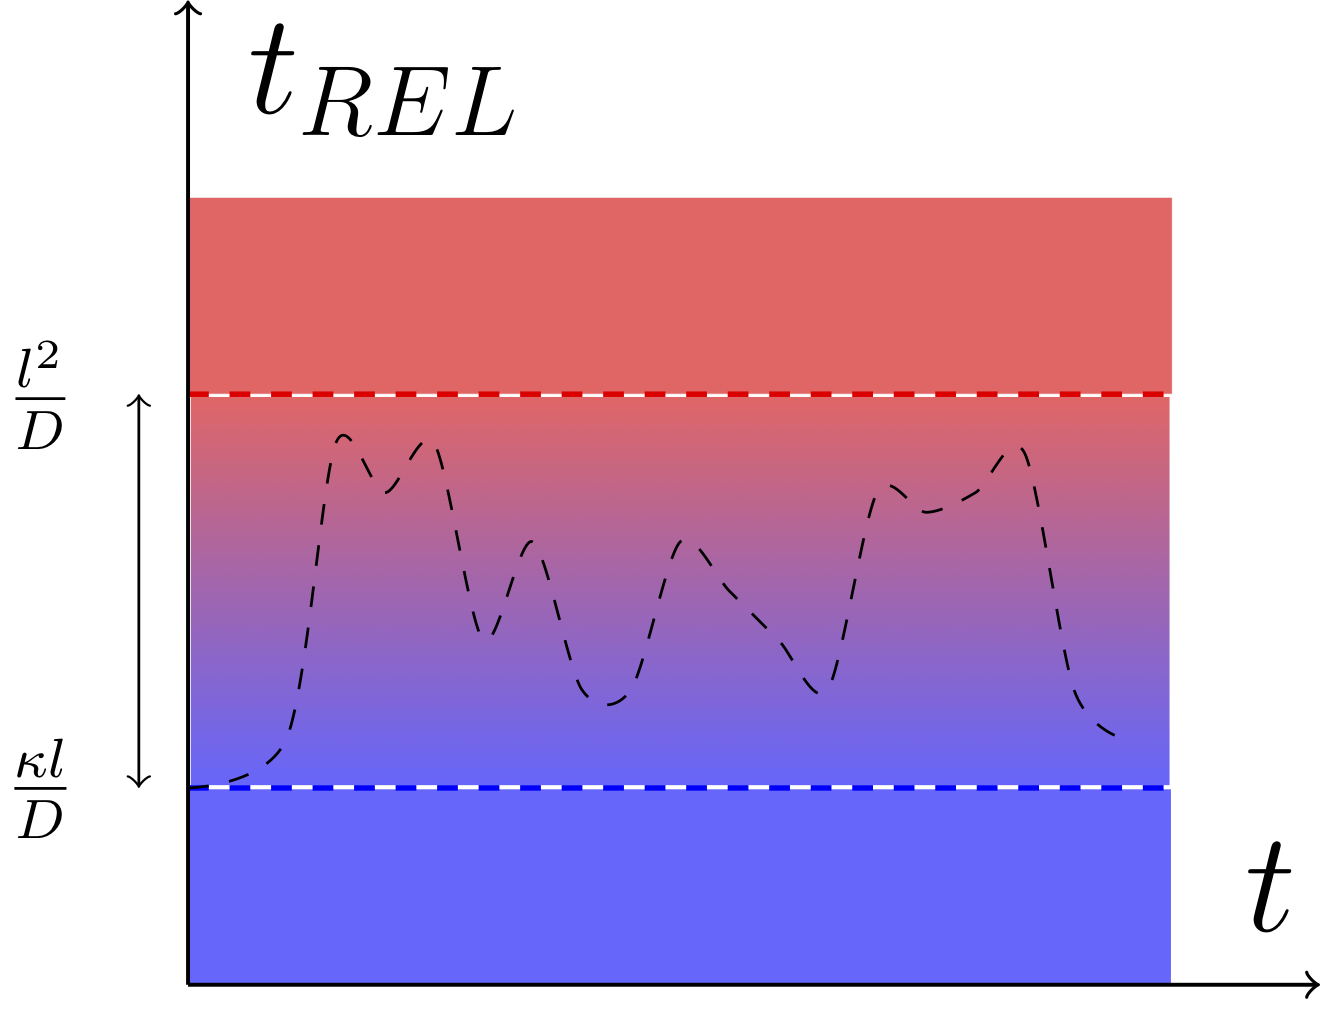
While the dendrites grow, due to random nature of the evolution of branches, they stick out randomly, which becomes a source for the quickening growth of the dendrite per see due to the concentration of electric field in the sharp interfaces as well as their closer proximity to the upcoming ions. The relaxation time allows the concentrated ions in the ramified peaks to dissipate away into the less concentrated areas and the concentration gradient is relaxed. The time required for the such relaxation depends on the curvature of the interface, where the higher curvature sites would require longer time for the concentration relaxation within the double layer region [59]. In fact such relaxation could occur for the larger interfacial double layer scale with the thickness of , spanning to the entire cell domain, requiring the most relaxation time for the highest curvature regions and least for the flat counterparts. From dimensional analysis the relaxation time of the double layer in the flat electrode is in the range of [64]and for the larger domain of the cell with the representative length of would scale up to , where as their geometric mean has been later considered as [61]. In fact the relaxation of the concentration depends highly to the curvature of the peaks and the entire growing interface possess a wide range of radius of curvature values , expanding from the flat surface to the highly-curved fingers as small as the atomic value, therefore:
| (8) |
Hence, the relaxation time for a randomly-growing interface with variation of curvature along the interfacial line, would vary as well. Hereby, we define the feedback relaxation time a curvature dependent function multiplied by the geometric mean time for the concentration relaxation (i.e. time) as:
| (9) |
As the interface grows from the initial flat state () to creating sharp fields (), the feedback relaxation time should adapt respectively based on the most critical state of the interface, which is the location of ionic concentration. Therefore the range of acceptable value for the feedback relaxation time should lie between the relaxation scale within the double layer to the scale of the cell domain. The variation of the feedback relaxation time occurs from it’s minimum value during the instigation, to it’s maximum value in the atomic scale. Therefore considering the relevant time-scales from beginning (flat) to the most ramified state (atomic sclae), from Equation 9one has:
| (10) |
Assuming the form of the control function an combination of linear and exponential terms as , from the boundary conditions in the Equation 11 one gets:
| (11) |
Thus the feedback relaxation time is obtained as:
| (12) |

The radius of curvature can be approximated via the contours of the iso-potential curvature of the electric field in the vicinity of electrodeposits, where it occurs typically within the double layer region of thickness . The corresponding line could be obtained locating magnitude of the isopotential contour matching with the electrode (). If represents the coordinates of the curvature line, the point of the minimum radius of curvature would address the most critical state, and requires higher dissipation of ionic concentration. The radius of curvature can be calculated from Equation 13 as:
| (13) |
This value is computed in real time and inserted into the feedback algorithm. In fact the curvature-dependent relaxation time provides a positive feedback for halting of the quickening dendrites, which is negative feedback for dendritic evolution. The Flowchart 4 represents the control loop representing the real-time computation of the curvature and the corresponding feedback relaxation time for the minimization of the dendritic branching. Figure 4 schematically represents such variation where the feedback relation time starts from the minimum value of in the flat surface and varies based on the measurement of the highest curvature of the tip given in the Equation 13.
The thickness of the double layer can be obtained from [61]:
where is the permittivity of the solvent, is Boltzmann constant, is the temperature, is the valence number, is the electron charge and is the average ambient electrolyte concentration.
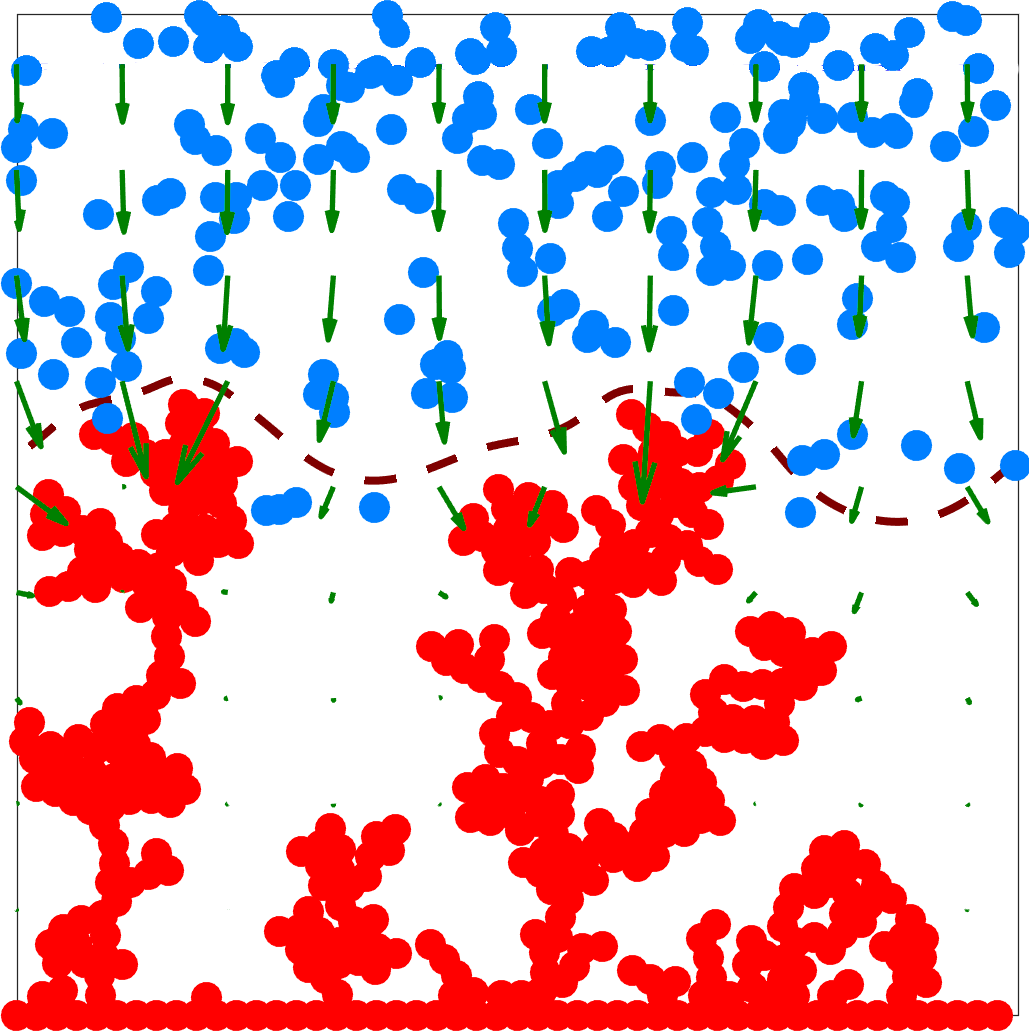
The computation was carried out based on the simulation parameters given in the Table 1. Figure 6 illustrates the resulted morphologies of the grown dendrites based on the applied relaxation time.
The density of the electro-deposits can easily be calculated from confining the atoms in a rectangle, the height of which spans to the highest dendrite coordinates . Therefore:
3 Results & Discussion


The mechanism used in the pulse charging works based on the relaxation of the ionic concentration in the dendritic tips. The formation of such gradient in the concentration is, in fact, the feedback for the quickening upcoming growth regime after the instigation and therefore the applied feedback relaxation time should effectively dissipate away the accumulated ions from the accumulated regions. In fact the sharper interfaces, which have been growing faster than the rest of the interface, have higher number of concentrated ions around them and therefore they are in the most critical state, which have been used for the computation of the feedback relaxation time.
In the larger scale since the electro-migration displacement (Eq. 2) scales with and the diffusion displacement (Eq. 1) scales with the square of time . During the pulse both electro-migration and diffusion are in action whereas during the rest period only diffusion is the main drive. Therefore since the average reach for electro-migration is higher than the sole-diffusion the range of reach in the rest period should in fact be competitive with the pulse period. Therefore:
| (14) |
and performing further, we get the maximum value of duty cycle for effective pulse charging:
| (15) |
where the duty cycle of the is the limiting value for the effective suppression of dendrites. The formation of local branches indicates that the concentration of ions in those specific sights is high and therefore those sites should be focus locations for the feedback relaxation time , which highly depends on the radius of curvature of the dendritic peaks [59]. For an individual ramified peak with the radius of curvature , the time required for the concentration relaxation within the double layer with the scale of is :
| (16) |
where is the diffusivity value for the ionic transport.
which in fact shows faster relaxation relative to the flat interface. For the larger scale, extending to the entire cell domain, the feedback relaxation time act on the uniformization of ionic concentration in the global range (i.e. ) . Therefore the scale of transport for the time and space would lead to the following comparison: :
| (17) |
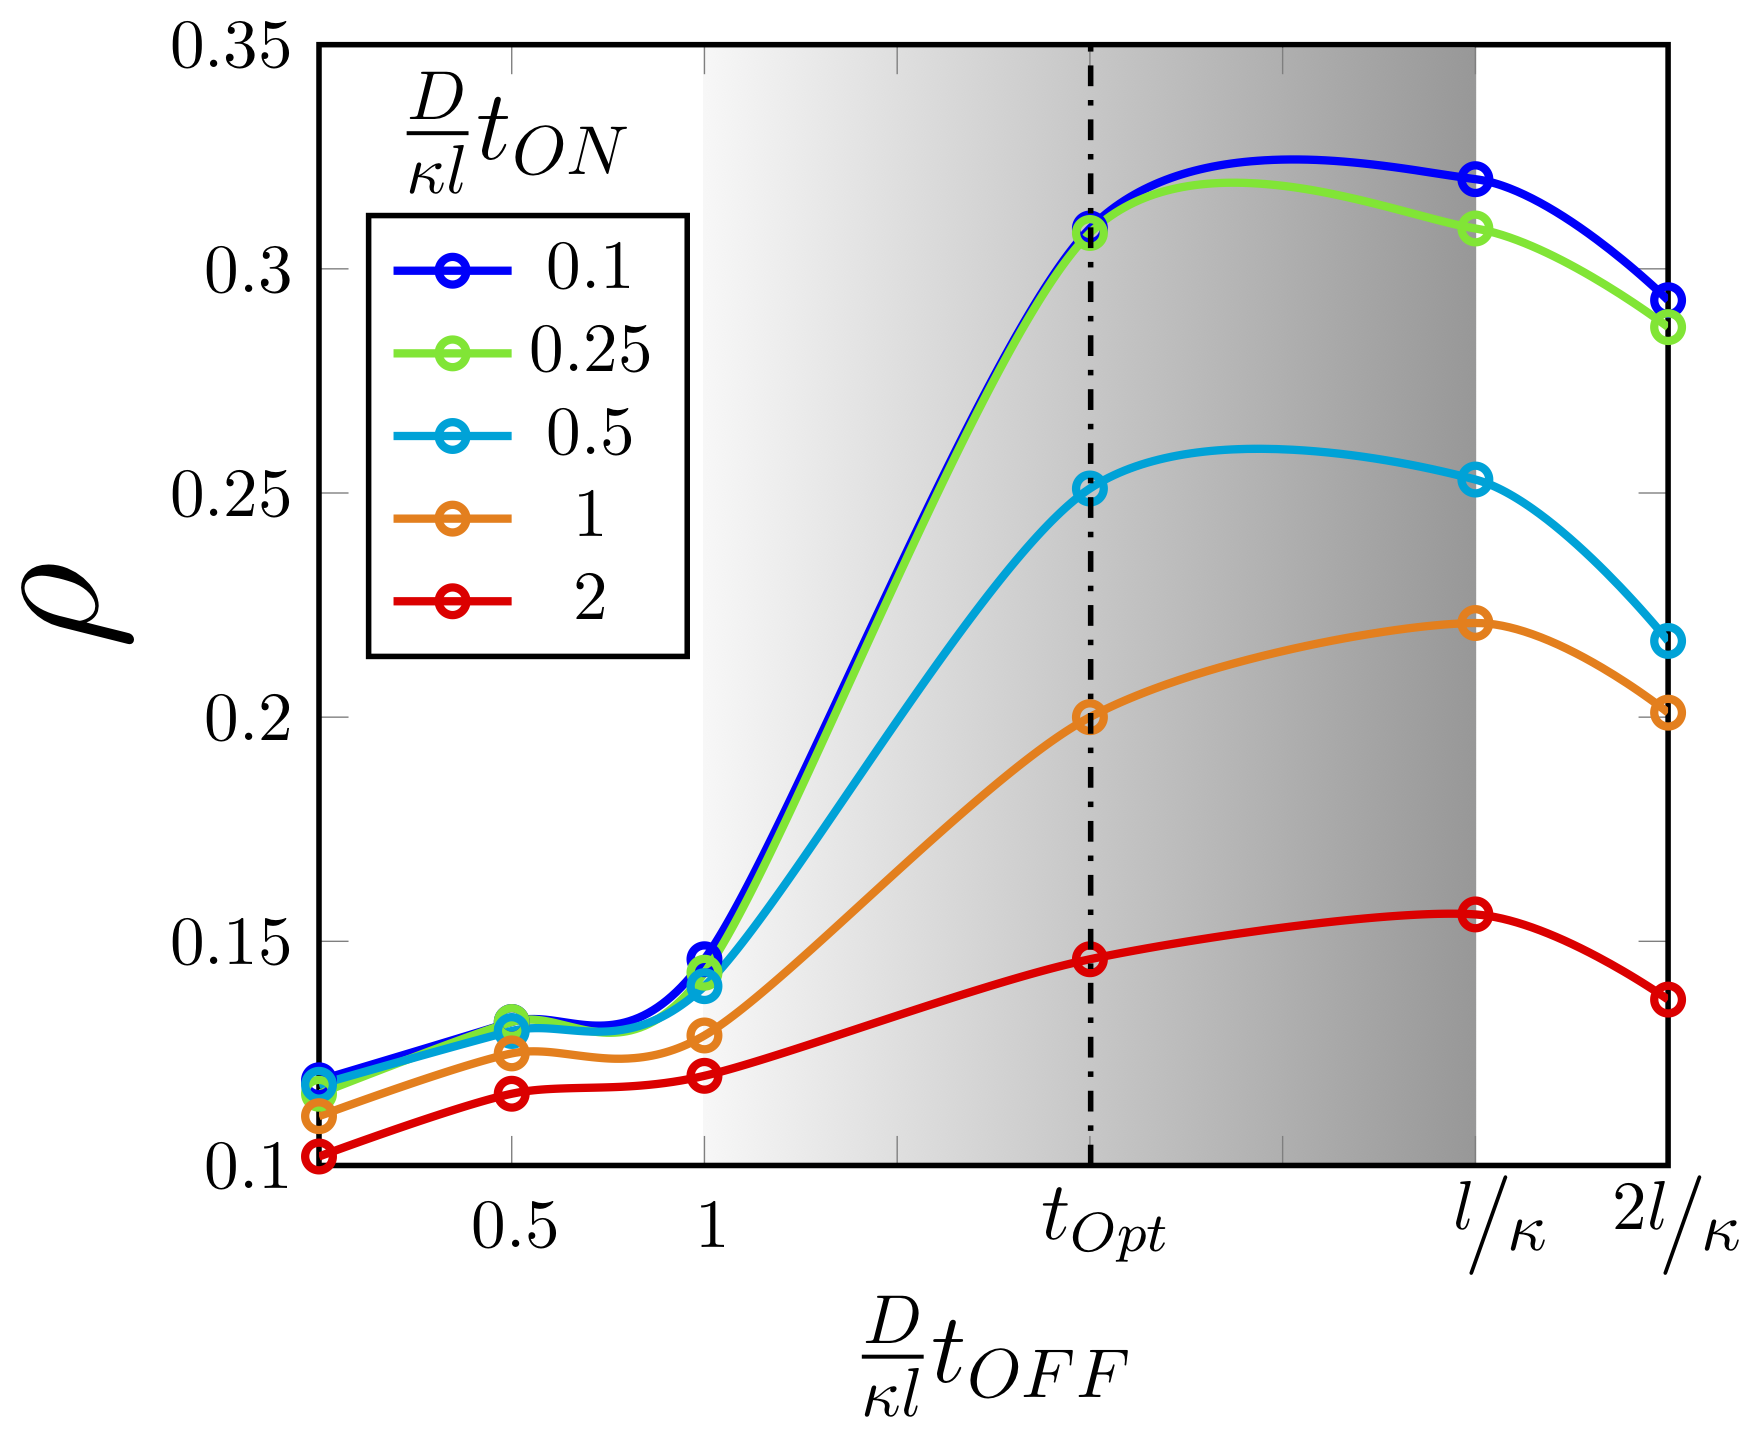
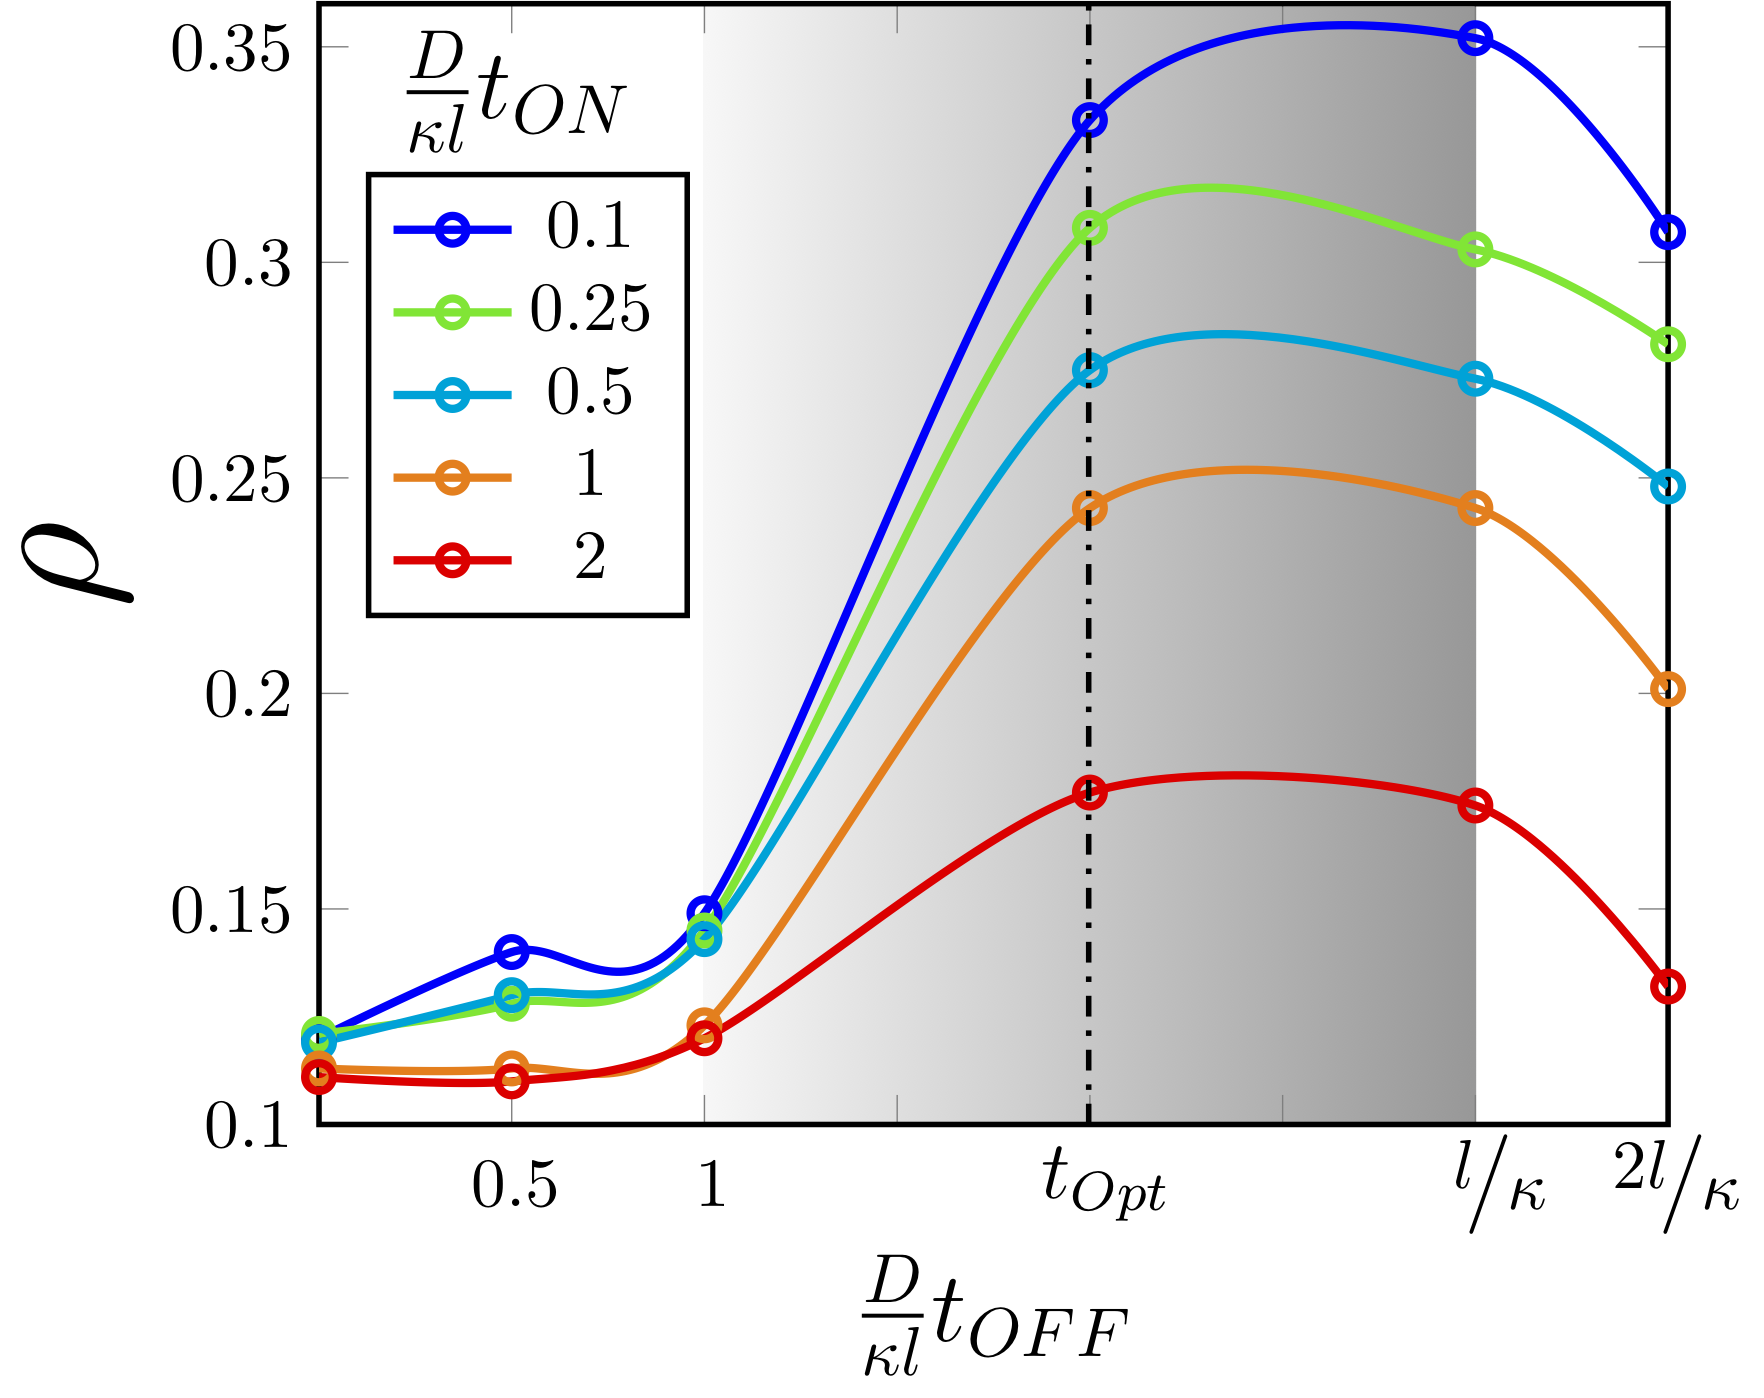
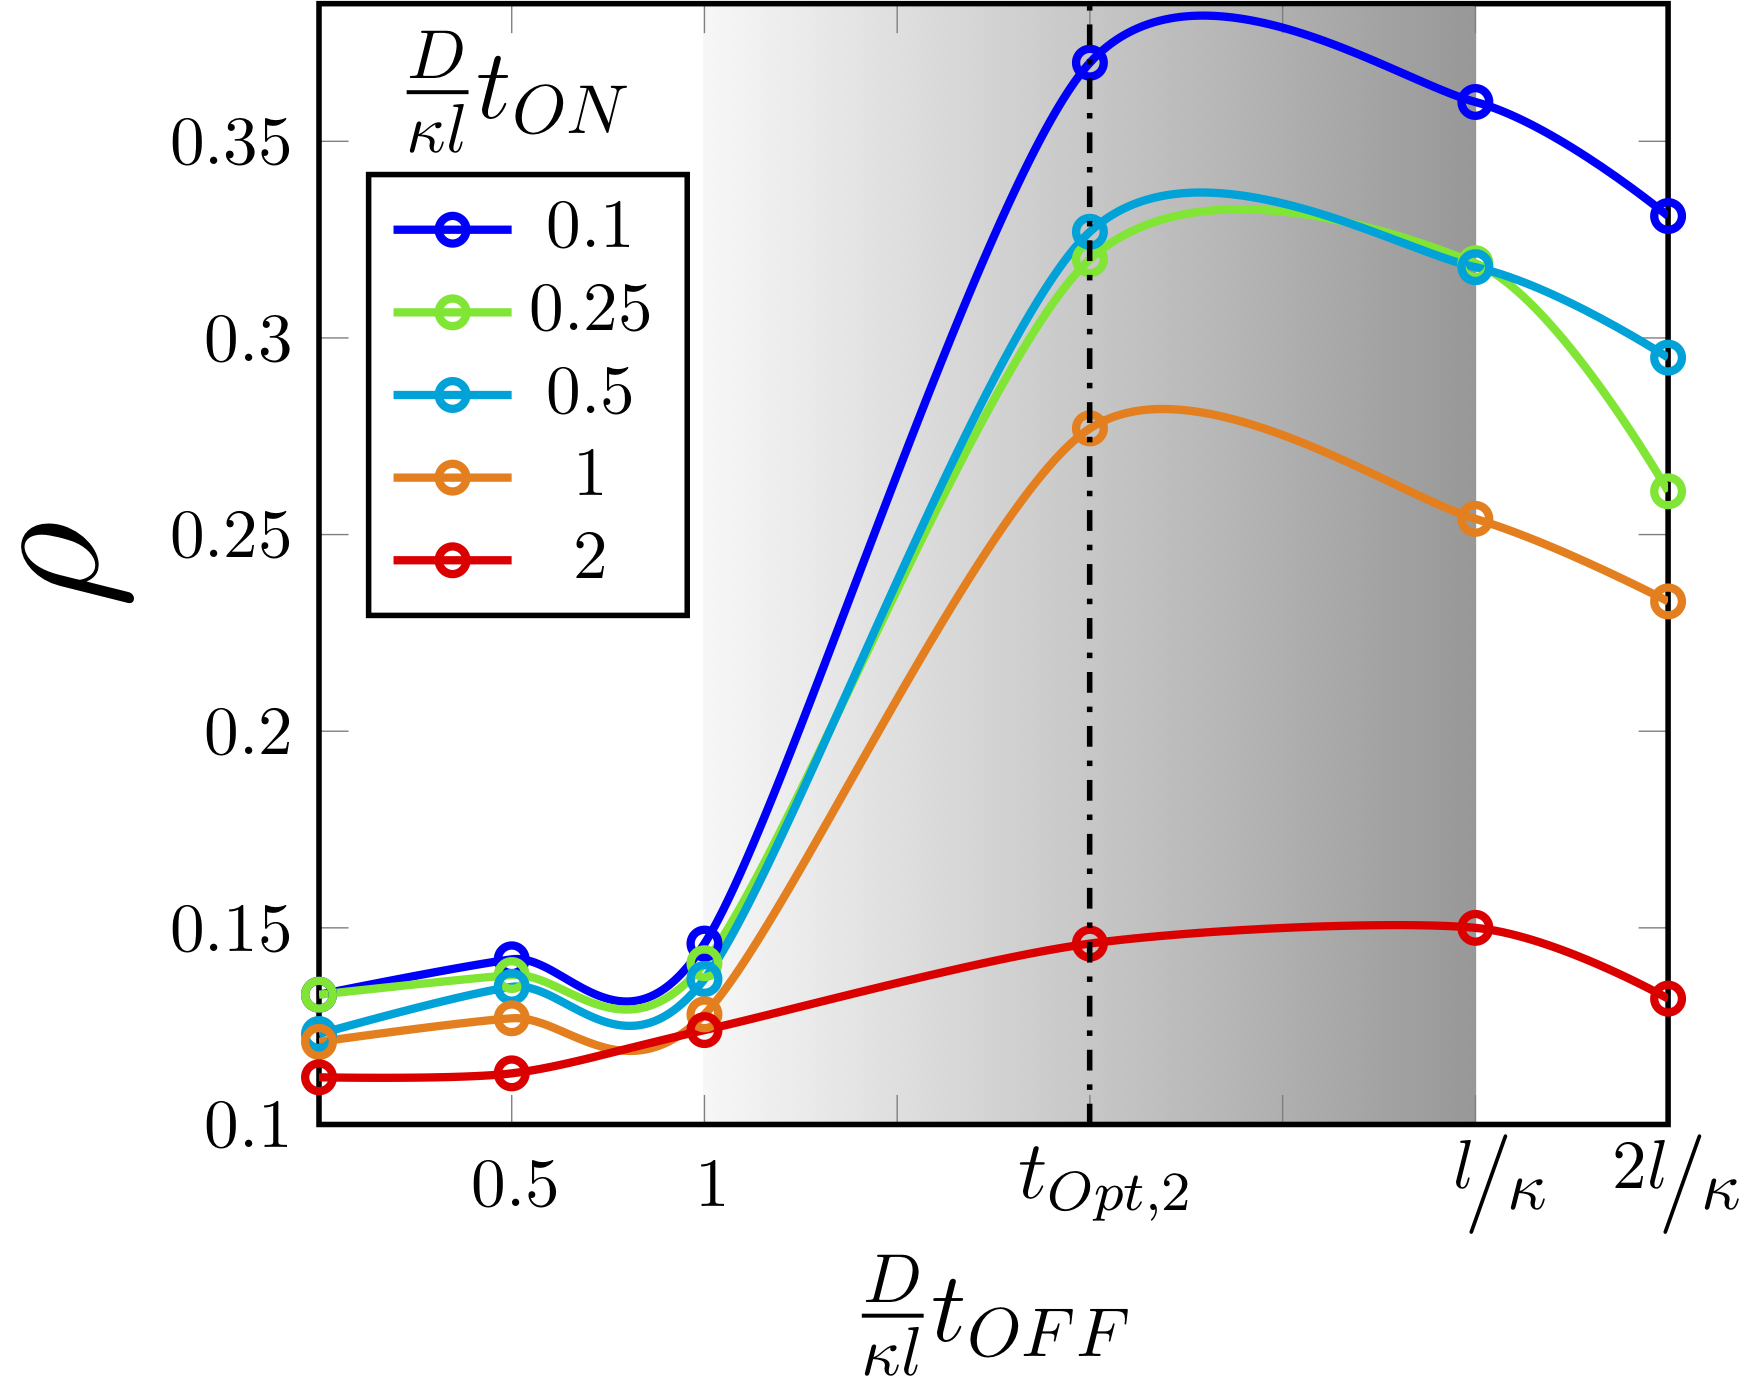
Therefore the relaxation time scale varies from in the individual peaks to the in the larger domain of the cell, and the control relaxation time in fact varies in such range. Figure 6 represents the density of the dendrites versus the intervals of pulse and the rest (i.e. relaxation) periods. The density of the electro-deposits correlates inversely with the pulse charing time . This is due to the exacerbated branching during the charge time which upon growing further gets more difficult to halt. On the other hand, applying finer pulse periods provides better possibility for the suppression of dendrites. Needless to mention that such pulse period could not indefinitely get short since the ions ultimately would require enough time to reach the dendrites during this time and react from ionic to atomic species.
As well, the density values correlates with the relaxation time until reaching a certain saturation limit. Since the length of the domain is much larger than the double layer (), the range of feedback relaxation time , shown by color gradient, would extremely reduce the charging time with negligible compensation in the density of electro-deposits . The underlying reason is that the relaxation would let the ionic concentration to relax and uniform ionic distribution. On the other hand, extra relaxation period will not helpful since the ionic concentration is already relaxed and the concentration gradient has already vanished.
As well, imposing higher-than-limit relaxation time would slightly reduce the density since additional concentration from the ambient electrolyte could be depleted in the into the non-reacting dendritic sites. The negligible increase in the density of the dendrites in the span of Figures 6a, 6b and 6c illustrates the effective-ness of the pulse charging method for the multitudes of the charge amount .
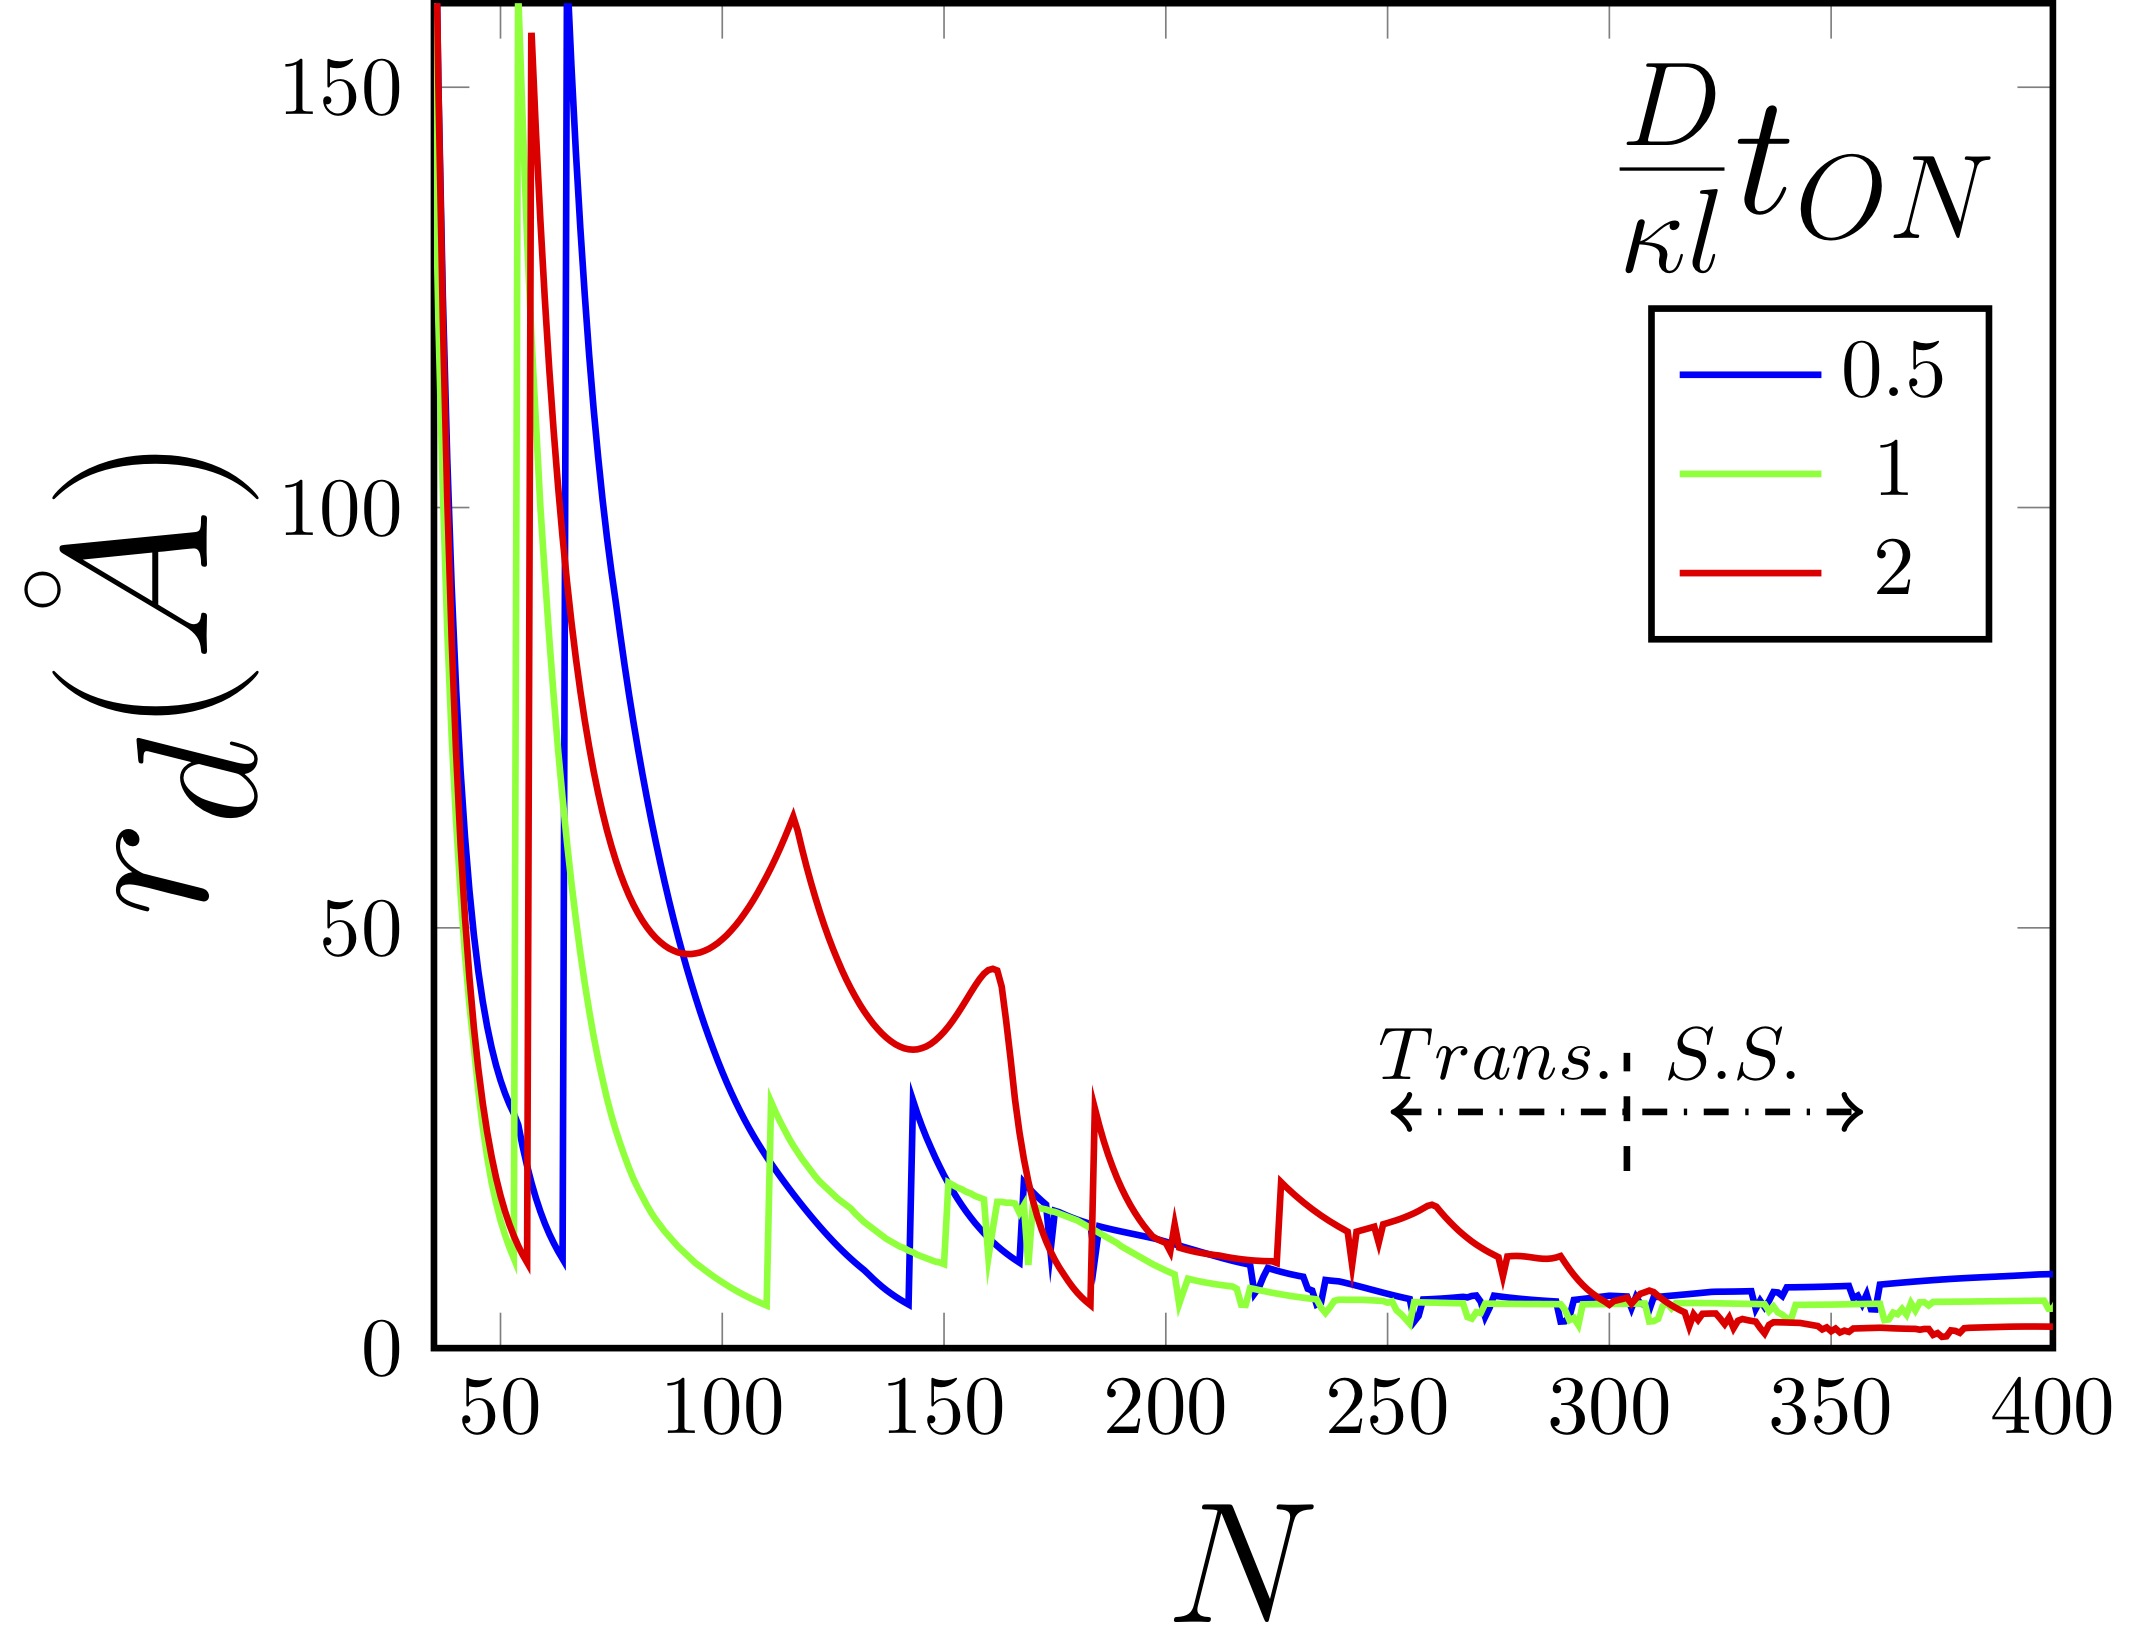


The dendritic evolution can be divided into two distinctive stages of the transient and steady-state () growth regimes [66, 67], which has been illustrated in the Figures 9, 9 and 9. The initial transient regime in fact is a stochastic in nature whereas the steady state regime can illustrate an effective trend. Figure 9 represents the variation of the radius of the curvature in the growing interface versus the deposition progress (i.e. number of the atoms). In this figure, the transition stage during the higher pulse time shows more fluctuation which indicates the non-uniform regime of growth for the augmented pulse intervals. On the other hand during the steady-state () regime, radius of curvature correlates inversely with the pulse time interval , which indicates that the morphology is controlled for more finer pulse periods.
Figure 9 represents the control relaxation time versus the progress in electrodeposition during the dendritic evolution, where the higher pulse intervals would require higher amount of control relaxation time for the effective suppression of the dendrites. As well the higher fluctuation for the higher amount of pulse charge shows the higher control rate due to faster dynamics of variation in the curvature.
The same trend of transition-to-steady state regimes has been observed in the Figure 9, where the highest fluctuation occurs for the higher pulsing time where is leads to the lowest density after reaching the steady growth regime.
In fact, the quickening growth regime of the dendrites illustrates that the larger height of the electrodeposits the rate of their growth would be higher as well. This can simply be represented by the following:
where the integration leads to the exponential relationship for the growth regime as:
where is the coefficient of the proportion. Setting exponential relationship causes a very high sensitivity for the control relaxation time to act vigilantly versus smallest perturbation in the ramified peaks and the form of the control relation time proportionally contains the exponential form in Equation 12. Note that other forms of the relaxation time would as well could satisfy the boundary conditions given in the Equation 10 such as given as:
| (18) |
which has lower sensitivity for the radius of curvature relative to proposed control relation time . This can be proven by calculating their derivative with respect to radius of curvature ( ) and show that:
Thus from equations 12 and 18 and considering the negative value for both derivatives, one must have:
| (19) |
since dividing by negative value of changes the inequality sign, therefore:
| (20) |
The equation 20 is obvious for a large values of radius of curvature since the exponential term in the denominator will surpass the quadratic term in the right side. As well for an infinitesimally small value of the radius of curvature one can use Taylor expansion as: and one has:
re-arranging gives:
which is a quadratic equation in terms of the radius of curvature and the root is found as:
Considering the infinitesimal value for thickness of the double layer () the value for would be very small. Therefore for the most range of the exponential relationship remains as the most sensitive to the variations in the radius of curvature and the Equation 12 as effective control relaxation time for suppression of the dendrites..
In practice, the discerning the formation of such a peak in the dendrite morphology for potentiostatic charging (constant applied voltage ) could be obtained by computing the sudden increase in the current density, representing the runaway process, whereas for galvanic charging (constant applied current ) could be the sudden drop in the potential value, where both of these events represent the runaway process (i.e jump) in time..
4 Conclusions
In this paper we have developed an effective real-time feedback control relaxation method for minimization of dendritic grown during electrodeposition for preventing the branched evolution of the grown microstructures. The control parameter has been considered as the maximum curvature of the growing interface based on the radius of curvature of the most critical peaks. The sensitivity of the feedback relaxation time to the curvature has been analyzed to be extremely high with the exponential correlation, analogous to the growth dynamics of the branches. The methodology can be used for smart charging in rechargeable batteries for the controlling the morphology of the grown electro-deposits.
References
- [1] J. Rugolo and M. J. Aziz. Electricity storage for intermittent renewable sources. Energy Environ. Sci., 5(5):7151–7160, 2012.
- [2] Bruce Dunn, Haresh Kamath, and Jean-Marie Tarascon. Electrical energy storage for the grid: a battery of choices. Science, 334(6058):928–935, 2011.
- [3] Rotem Marom, S Francis Amalraj, Nicole Leifer, David Jacob, and Doron Aurbach. A review of advanced and practical lithium battery materials. Journal of Materials Chemistry, 21(27):9938–9954, 2011.
- [4] John B Goodenough and Kyu-Sung Park. The li-ion rechargeable battery: a perspective. Journal of the American Chemical Society, 135(4):1167–1176, 2013.
- [5] Xin-Bing Cheng, Rui Zhang, Chen-Zi Zhao, and Qiang Zhang. Toward safe lithium metal anode in rechargeable batteries: a review. Chemical reviews, 117(15):10403–10473, 2017.
- [6] Michael D Slater, Donghan Kim, Eungje Lee, and Christopher S Johnson. Sodium-ion batteries. Adv. Funct. Mater., 23(8):947–958, 2013.
- [7] Rachel Davidson, Ankit Verma, David Santos, Feng Hao, Coleman Fincher, Sisi Xiang, Jonathan Van Buskirk, Kelvin Xie, Matt Pharr, Partha P Mukherjee, et al. Formation of magnesium dendrites during electrodeposition. ACS Energy Letters, 4(2):375–376, 2018.
- [8] Pucheng Pei, Keliang Wang, and Ze Ma. Technologies for extending zinc air batterys cyclelife: A review. Applied Energy, 128:315–324, 2014.
- [9] Siyuan Li, Jixiang Yang, and Yingying Lu. Lithium metal anode. Encyclopedia of Inorganic and Bioinorganic Chemistry, pages 1–21.
- [10] W. Xu, J. L. Wang, F. Ding, X. L. Chen, E. Nasybutin, Y. H. Zhang, and J. G. Zhang. Lithium metal anodes for rechargeable batteries. Energy and Environmental Science, 7(2):513–537, 2014.
- [11] Aruna Zhamu, Guorong Chen, Chenguang Liu, David Neff, Qing Fang, Zhenning Yu, Wei Xiong, Yanbo Wang, Xiqing Wang, and Bor Z Jang. Reviving rechargeable lithium metal batteries: enabling next-generation high-energy and high-power cells. Energy Environ. Sci., 5(2):5701–5707, 2012.
- [12] Brian L Ellis and Linda F Nazar. Sodium and sodium-ion energy storage batteries. Current Opinion in Solid State and Materials Science, 16(4):168–177, 2012.
- [13] Ivgeni Shterenberg, Michael Salama, Yossi Gofer, Elena Levi, and Doron Aurbach. The challenge of developing rechargeable magnesium batteries. Mrs Bulletin, 39(5):453–460, 2014.
- [14] Yanguang Li and Hongjie Dai. Recent advances in zinc–air batteries. Chem. Soc. Rev., 43(15):5257–5275, 2014.
- [15] Kang Xu. Nonaqueous liquid electrolytes for lithium-based rechargeable batteries. Chemical Reviews-Columbus, 104(10):4303–4418, 2004.
- [16] Deepti Tewari, Sobana P Rangarajan, Perla B Balbuena, Yevgen Barsukov, and Partha P Mukherjee. Mesoscale anatomy of dead lithium formation. The Journal of Physical Chemistry C, 2020.
- [17] MS Dresselhaus and G Dresselhaus. Intercalation compounds of graphite. Advances in Physics, 30(2):139–326, 1981.
- [18] Zhe Li, Jun Huang, Bor Yann Liaw, Viktor Metzler, and Jianbo Zhang. A review of lithium deposition in lithium-ion and lithium metal secondary batteries. J. Power Sources, 254:168–182, 2014.
- [19] Asghar Aryanfar, Tao Cheng, and William A Goddard. Bulk properties of amorphous lithium dendrites. ECS Transactions, 80(10):365–370, 2017.
- [20] Yaoyu Ren, Yang Shen, Yuanhua Lin, and Ce-Wen Nan. Direct observation of lithium dendrites inside garnet-type lithium-ion solid electrolyte. Electrochemistry Communications, 57:27–30, 2015.
- [21] Christoffer P Nielsen and Henrik Bruus. Morphological instability during steady electrodeposition at overlimiting currents. arXiv preprint arXiv:1505.07571, 2015.
- [22] PP Natsiavas, K Weinberg, D Rosato, and M Ortiz. Effect of prestress on the stability of electrode–electrolyte interfaces during charging in lithium batteries. Journal of the Mechanics and Physics of Solids, 95:92–111, 2016.
- [23] J. Steiger, D. Kramer, and R. Monig. Mechanisms of dendritic growth investigated by in situ light microscopy during electrodeposition and dissolution of lithium. J. Power Sources, 261:112–119, 2014.
- [24] N. Schweikert, A. Hofmann, M. Schulz, M. Scheuermann, S. T. Boles, T. Hanemann, H. Hahn, and S. Indris. Suppressed lithium dendrite growth in lithium batteries using ionic liquid electrolytes: Investigation by electrochemical impedance spectroscopy, scanning electron microscopy, and in situ li-7 nuclear magnetic resonance spectroscopy. J. Power Sources, 228:237–243, 2013.
- [25] Reza Younesi, Gabriel M Veith, Patrik Johansson, Kristina Edström, and Tejs Vegge. Lithium salts for advanced lithium batteries: Li-metal, li-o 2, and li-s. Energy and Environmental Science, 8(7):1905–1922, 2015.
- [26] Soon-Ki Jeong, Hee-Young Seo, Dong-Hak Kim, Hyun-Kak Han, Jin-Gul Kim, Yoon Bae Lee, Yasutoshi Iriyama, Takeshi Abe, and Zempachi Ogumi. Suppression of dendritic lithium formation by using concentrated electrolyte solutions. Electrochemistry communications, 10(4):635–638, 2008.
- [27] I. W. Seong, C. H. Hong, B. K. Kim, and W. Y. Yoon. The effects of current density and amount of discharge on dendrite formation in the lithium powder anode electrode. J. Power Sources, 178(2):769–773, 2008.
- [28] GM Stone, SA Mullin, AA Teran, DT Hallinan, AM Minor, A Hexemer, and NP Balsara. Resolution of the modulus versus adhesion dilemma in solid polymer electrolytes for rechargeable lithium metal batteries. J. Electrochem. Soc., 159(3):A222–A227, 2012.
- [29] Asghar Aryanfar, Tao Cheng, Agustin J Colussi, Boris V Merinov, William A Goddard III, and Michael R Hoffmann. Annealing kinetics of electrodeposited lithium dendrites. The Journal of chemical physics, 143(13):134701, 2015.
- [30] Asghar Aryanfar, Daniel J Brooks, AgustÃn J Colussi, Boris V Merinov, William A Goddard III, and Michael R Hoffmann. Thermal relaxation of lithium dendrites. Phys. Chem. Chem. Phys., 17(12):8000–8005, 2015.
- [31] Yuanzhou Yao, Xiaohui Zhao, Amir A Razzaq, Yuting Gu, Xietao Yuan, Rahim Shah, Yuebin Lian, Jinxuan Lei, Qiaoqiao Mu, Yong Ma, et al. Mosaic rgo layer on lithium metal anodes for effective mediation of lithium plating and stripping. Journal of Materials Chemistry A, 2019.
- [32] Ji Qian, Yu Li, Menglu Zhang, Rui Luo, Fujie Wang, Yusheng Ye, Yi Xing, Wanlong Li, Wenjie Qu, Lili Wang, et al. Protecting lithium/sodium metal anode with metal-organic framework based compact and robust shield. Nano Energy, 2019.
- [33] Wei Deng, Wenhua Zhu, Xufeng Zhou, Fei Zhao, and Zhaoping Liu. Regulating capillary pressure to achieve ultralow areal mass loading metallic lithium anodes. Energy Storage Materials, 2019.
- [34] Alexander W Abboud, Eric J Dufek, and Boryann Liaw. Implications of local current density variations on lithium plating affected by cathode particle size. Journal of The Electrochemical Society, 166(4):A667–A669, 2019.
- [35] Markus Klinsmann, Felix E Hildebrand, Markus Ganser, and Robert M McMeeking. Dendritic cracking in solid electrolytes driven by lithium insertion. Journal of Power Sources, 442:227226, 2019.
- [36] Chen Xu, Zeeshan Ahmad, Asghar Aryanfar, Venkatasubramanian Viswanathan, and Julia R Greer. Enhanced strength and temperature dependence of mechanical properties of li at small scales and its implications for li metal anodes. Proceedings of the National Academy of Sciences, 114(1):57–61, 2017.
- [37] Peng Wang, Wenjie Qu, Wei-Li Song, Haosen Chen, Renjie Chen, and Daining Fang. Electro–chemo–mechanical issues at the interfaces in solid-state lithium metal batteries. Advanced Functional Materials, page 1900950, 2019.
- [38] Guangyu Liu, Dandan Wang, Jianyu Zhang, Andrew Kim, and Wei Lu. Preventing dendrite growth by a soft piezoelectric material. ACS Materials Letters, 1(5):498–505, 2019.
- [39] Rangeet Bhattacharyya, Baris Key, Hailong Chen, Adam S Best, Anthony F Hollenkamp, and Clare P Grey. In situ nmr observation of the formation of metallic lithium microstructures in lithium batteries. Nat. Mater., 9(6):504, 2010.
- [40] S Chandrashekar, Nicole M Trease, Hee Jung Chang, Lin-Shu Du, Clare P Grey, and Alexej Jerschow. 7li mri of li batteries reveals location of microstructural lithium. Nat. Mater., 11(4):311–315, 2012.
- [41] Yunsong Li and Yue Qi. Energy landscape of the charge transfer reaction at the complex li/sei/electrolyte interface. Energy & Environmental Science, 2019.
- [42] Laleh Majari Kasmaee, Asghar Aryanfar, Zarui Chikneyan, Michael R Hoffmann, and AgustÃn J Colussi. Lithium batteries: Improving solid-electrolyte interphases via underpotential solvent electropolymerization. Chem. Phys. Lett., 661:65–69, 2016.
- [43] Jun Li, Edward Murphy, Jack Winnick, and Paul A Kohl. The effects of pulse charging on cycling characteristics of commercial lithium-ion batteries. J. Power Sources, 102(1):302–309, 2001.
- [44] S Chandrashekar, Onyekachi Oparaji, Guang Yang, and Daniel Hallinan. Communication 7li mri unveils concentration dependent diffusion in polymer electrolyte batteries. Journal of The Electrochemical Society, 163(14):A2988–A2990, 2016.
- [45] Asghar Aryanfar, Daniel J Brooks, and William A Goddard. Theoretical pulse charge for the optimal inhibition of growing dendrites. MRS Advances, 3(22):1201–1207, 2018.
- [46] J. N. Chazalviel. Electrochemical aspects of the generation of ramified metallic electrodeposits. Phys. Rev. A, 42(12):7355–7367, 1990.
- [47] C. Monroe and J. Newman. Dendrite growth in lithium/polymer systems - a propagation model for liquid electrolytes under galvanostatic conditions. J. Electrochem. Soc., 150(10):A1377–A1384, 2003.
- [48] Thomas A Witten and Leonard M Sander. Diffusion-limited aggregation. Phys. Rev. B, 27(9):5686, 1983.
- [49] Xin Zhang, Q Jane Wang, Katharine L Harrison, Katherine Jungjohann, Brad L Boyce, Scott A Roberts, Peter M Attia, and Stephen J Harris. Rethinking how external pressure can suppress dendrites in lithium metal batteries. Journal of The Electrochemical Society, 166(15):A3639–A3652, 2019.
- [50] V. Fleury. Branched fractal patterns in non-equilibrium electrochemical deposition from oscillatory nucleation and growth. Nature, 390(6656):145–148, 1997.
- [51] Allen J. Bard and Larry R. Faulkner. Electrochemical methods: fundamentals and applications. 2 New York: Wiley, 1980., 1980.
- [52] Deepti Tewari and Partha P Mukherjee. Mechanistic understanding of electrochemical plating and stripping of metal electrodes. Journal of Materials Chemistry A, 7(9):4668–4688, 2019.
- [53] Asghar Aryanfar, Daniel Brooks, Boris V. Merinov, William A. Goddard Iii, AgustÃn J. Colussi, and Michael R. Hoffmann. Dynamics of lithium dendrite growth and inhibition: Pulse charging experiments and monte carlo calculations. The Journal of Physical Chemistry Letters, 5(10):1721–1726, 2014.
- [54] Wenyu Mu, Xunliang Liu, Zhi Wen, and Lin Liu. Numerical simulation of the factors affecting the growth of lithium dendrites. Journal of Energy Storage, 26:100921, 2019.
- [55] David R Ely, Aniruddha Jana, and R Edwin GarcÃa. Phase field kinetics of lithium electrodeposits. J. Power Sources, 272:581–594, 2014.
- [56] Daniel A Cogswell. Quantitative phase-field modeling of dendritic electrodeposition. Physical Review E, 92(1):011301, 2015.
- [57] Rohan Akolkar. Mathematical model of the dendritic growth during lithium electrodeposition. J. Power Sources, 232:23–28, 2013.
- [58] Martin Z Bazant, Brian D Storey, and Alexei A Kornyshev. Double layer in ionic liquids: Overscreening versus crowding. Phys. Rev. Lett., 106(4):046102, 2011.
- [59] Asghar Aryanfar, Michael R Hoffmann, and William A Goddard III. Finite-pulse waves for efficient suppression of evolving mesoscale dendrites in rechargeable batteries. Physical Review E, 100(4):042801, 2019.
- [60] M. S. Chandrasekar and M. Pushpavanam. Pulse and pulse reverse plating - conceptual, advantages and applications. Electrochim. Acta, 53(8):3313–3322, 2008.
- [61] M. Z. Bazant, K. Thornton, and A. Ajdari. Diffuse-charge dynamics in electrochemical systems. Physical Review E, 70(2), 2004.
- [62] Jean Philibert. One and a half century of diffusion: Fick, einstein, before and beyond. Diffusion Fundamentals, 4(6):1–19, 2006.
- [63] Philip J Pritchard, John W Mitchell, and John C Leylegian. Fox and McDonald’s Introduction to Fluid Mechanics, Binder Ready Version. John Wiley & Sons, 2016.
- [64] Robert J Hunter. Foundations of colloid science. Oxford university press, 2001.
- [65] Ron O Dror, Morten Ø Jensen, David W Borhani, and David E Shaw. Exploring atomic resolution physiology on a femtosecond to millisecond timescale using molecular dynamics simulations. Journal of General Physiology, 135(6):555–562, 2010.
- [66] Peng Bai, Ju Li, Fikile R Brushett, and Martin Z Bazant. Transition of lithium growth mechanisms in liquid electrolytes. Energy & Environmental Science, 9(10):3221–3229, 2016.
- [67] G. Gonzalez, M. Rosso, and E. Chassaing. Transition between two dendritic growth mechanisms in electrodeposition. Physical Review E, 78(1), 2008.