∎
Multiple populations in massive star clusters under the magnifying glass of photometry: Theory and tools
Abstract
The existence of star-to-star light-element abundance variations in massive Galactic and extragalactic star clusters has fairly recently superseded the traditional paradigm of individual clusters hosting stars with the same age, and uniform chemical composition. Several scenarios have been put forward to explain the origin of this multiple stellar population phenomenon, but so far all have failed to reproduce the whole range of key observations.
Complementary to high-resolution spectroscopy, which has first revealed and characterized chemically the presence of multiple populations in Galactic globular clusters, photometry has been instrumental in investigating this phenomenon in much larger samples of stars –adding a number of crucial observational constraints and correlations with global cluster properties– and in the discovery and characterization of multiple populations also in Magellanic Clouds’ intermediate-age clusters.
The purpose of this review is to present the theoretical underpinning and application of the photometric techniques devised to identify and study multiple populations in resolved star clusters. These methods have played and continue to play a crucial role in advancing our knowledge of the cluster multiple population phenomenon, and promise to extend the scope of these investigations to resolved clusters even beyond the Local Group, with the launch of the James Webb Space Telescope.
Keywords:
Globular clusters: general Infrared: stars opacity Stars: evolution Stars: imaging Ultraviolet: stars1 Introduction
Globular clusters (GCs) are widely employed as tracers of Galaxy evolution, due to their old ages (on the order of 10 Gyr) which imply a formation redshift 2 or higher, around the peak of the cosmic star formation (see, e.g., Madau and Dickinson, 2014). Their survival until today allows us to treat GCs as fossil records, whose stars preserve the chemical and dynamical properties of their origin.
The formation of GCs is however still an open problem (see, e.g., Forbes et al., 2018, for a recent review), made even more complex by the discovery that they do not host simple (single-age, single chemical composition) stellar populations, as generally believed. It is since about 40 years that variations of the initial chemical abundances of some light elements in individual Milky Way GCs have been revealed, (see, e.g., Cohen, 1978), however only the much more recent advent of high-resolution multi-object spectrographs has firmly established this result (see, e.g., Carretta et al., 2009a, b; Gratton et al., 2012, and references therein).
In addition to direct spectroscopic measurements, intracluster abundance variations have been revealed also through photometry, due to their effect on stellar effective temperatures, luminosities, and spectral energy distributions (see, e.g., Salaris et al., 2006; Marino et al., 2008; Yong et al., 2008; Sbordone et al., 2011; Cassisi et al., 2013; Dalessandro et al., 2016; Mucciarelli et al., 2016; Milone et al., 2017b; Dalessandro et al., 2018; Salaris et al., 2019). The use of appropriate colours and colour combinations (denoted as colour indices or pseudocolours) has indeed allowed us to greatly enlarge the sample of clusters investigated, the sample of stars surveyed in individual clusters, and the range of evolutionary phases (including the main sequence, typically too faint to be investigated spectroscopically with current observational facilities) where chemical abundance variations have been detected (see, e.g., Milone et al., 2012c; Monelli et al., 2013; Piotto et al., 2015; Milone et al., 2017b; Niederhofer et al., 2017).
By taking advantage of both spectroscopy and photometry, it has been definitively established that individual GCs host roughly coeval multiple populations (MPs) of stars, born with chemical abundance distributions characterised by anticorrelations between C-N and O-Na (sometimes also Mg-Al) pairs, and a range of He abundances. For the majority of Galactic GCs the abundances of the other elements, and in particular Fe, are remarkably uniform within individual clusters (see, e.g., the reviews by Gratton et al., 2012; Bastian and Lardo, 2018; Gratton et al., 2019), although it does exist a small sample of objects like Cen, Terzan 5, or M2, known to host stars born with a range of initial Fe abundances111Interestingly, it has been found that within these ‘peculiar’ clusters C-N, O-Na anticorrelations are present among stars with the same Fe abundance (see, e.g. Marino et al., 2011)..
Most scenarios for the origin of MPs (reviewed, e.g., in Bastian and Lardo, 2018) invoke subsequent episodes of star formation. Stars with CNONa (and He) abundance ratios similar to those observed in the halo field populations are supposed to be the first objects to form (we denote them as P1 stars), while stars enriched in N and Na (and He) and depleted in C and O formed later (we denote them as P2 stars), from freshly synthesised gas ejected by some class of polluter stars belonging to the P1 population. To date, none of the proposed scenarios is able to explain quantitatively the ensemble of chemical patterns observed in individual GCs (see Renzini et al., 2015; Bastian and Lardo, 2018, for independent discussions). Also, recent indications of He abundance variations among P1 stars in a sample of GCs (Lardo et al., 2018; Milone et al., 2018) is particularly difficult to accommodate by these scenarios.
Photometric (see, e.g., Larsen et al., 2014; Dalessandro et al., 2016; Gilligan et al., 2019; Lagioia et al., 2019b; Nardiello et al., 2019, and references therein) and to a lesser extent spectroscopic (Mucciarelli et al., 2009) observations have also shown that this MP phenomenon –meaning that individual clusters host stars born with a range of chemical abundances displaying the same anticorrelation patterns as in Galactic GCs– is not confined to Galactic GCs, for MPs have been discovered also in old clusters of the Magellanic Clouds, the Fornax dwarf galaxy, and M31. Integrated spectroscopy of clusters in M31 also reveal the signature of MPs amongst old massive clusters in this galaxy (see, e.g., Schiavon et al., 2013).
Additionally, recent spectroscopic and to a much larger extent photometric studies of small samples of intermediate-age, resolved extragalactic massive clusters, have shown that clusters down to ages of 2 Gyr do host MPs (see, e.g., Hollyhead et al., 2019; Lagioia et al., 2019a; Martocchia et al., 2019, and references therein). This result adds an additional and very important piece of information to the MP puzzle, because it strongly suggests a close connection between the formation of old GCs and young massive clusters (see, e.g., Kruijssen, 2015).
It should be clear from this very brief summary, that photometry has played and continues to play a crucial role in the detection and characterization of MPs in resolved clusters. Obviously, high-resolution spectroscopy enables a more detailed investigation of the chemical patterns of P2 stars, and has been responsible for the discovery of the MP phenomenon, but for the majority of Galactic GCs this type of analysis is restricted to the bright red giant branch (RGB) stars, and in any case to a limited number of objects. Even harder is to perform spectroscopy of individual stars in extragalactic objects.
On the other hand, imaging allows us to disentangle efficiently P1 and P2 populations in individual clusters, through photometry of samples of many thousands of stars, and to cover wider regions in the sky compared to spectroscopic surveys. This has enabled us to infer robustly the number ratios of P1 to P2 stars, and study their radial distributions, by virtue of the large samples of objects observed. For example, the HST UV Legacy Survey of Galactic Globular Clusters (Piotto et al., 2015) has taken advantage of HST photometric high precision and accuracy, to detect and characterize MPs in a large sample of Galactic GCs, and explore the link with their host cluster properties with unprecedented precision. HST photometry has also been pivotal in the discovery of MPs in several intermediate-age massive clusters (see, e.g., Martocchia et al., 2019). The information gained from photometry is therefore crucial to try and identify the mechanisms for the formation of massive star clusters.
The purpose of this review is to discuss the theoretical underpinning and application of the main photometric tools to able to identify and characterize MPs in resolved star clusters. We first summarize in Sects.2 and 3 the impact of P2 chemical abundances on theoretical stellar models and isochrones, and the predicted spectral energy distributions. These results are then employed in Sects. 4, 5, and 6 to introduce and discuss several photometric diagnostics to detect and characterize MPs in star clusters. We close in Sect. 7 with a summary of the main results related to MP discoveries and characterization, obtained by photometric surveys of massive star clusters, and future prospects for this type of investigation.
2 Impact of chemical abundance anticorrelations on stellar evolution models, tracks and isochrones
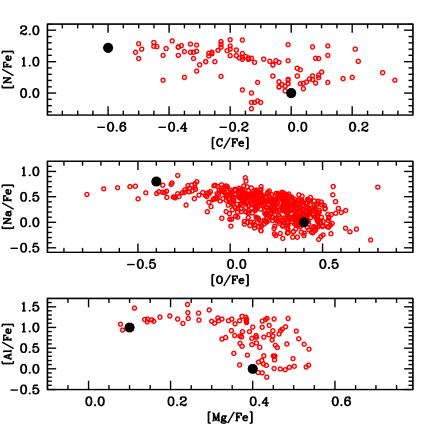
As mentioned in the Introduction, in the context of massive cluster MPs are groups of stars born with different initial chemical compositions, but very similar ages. The chemical pattern that tells apart the various populations comprises anticorrelations between the abundances of specific pairs of elements amongst stars in the same cluster, namely C-N, O-Na, and sometimes Al-Mg (and rarely Si-F) (see the discussion in Gratton et al., 2019, and references therein). P1 stars show abundance ratios typical of field stars – with the same [Fe/H] – in the cluster environment (for example, field Galactic halo stars in case of Galactic GCs), while P2 stars comprise objects with enhanced N and depleted C, enhanced Na and depleted O, enhanced Al and depleted Mg, compared to the P1 population. Clusters with spectroscopic measurements of C, N and O, show that the sum is constant within current uncertainties (a factor 1.5-2), with few exceptions represented by the Galactic GCs NGC 1851 (but see Villanova et al., 2010; Yong et al., 2009, for conflicting results on this cluster), NGC 6656 (Marino et al., 2012b), and Cen (Marino et al., 2012a). This latter cluster is also well known to display a large range of [Fe/H]. Figure 1 shows abundances of RGB stars for a small sample of Galactic GCs, which follow clear C-N, O-Na and Mg-Al anticorrelations (see Cassisi et al., 2013).
The pairs of elements involved and their anticorrelated patterns points to an origin linked to high-temperature proton captures during CNO H-burning. This, in turn, suggests also the presence of He abundance variations between P1 and P2 stars. Helium variations (, where denotes the He mass fraction) can be determined by direct spectroscopic measurements in bright RGB stars (through a chromospheric line) and horizontal branch (HB) stars hot enough to show He photospheric lines (8500 K), but cooler than the limit for the onset of atomic diffusion (12000 K, see e.g. Dupree and Avrett, 2013; Marino et al., 2014; Mucciarelli et al., 2014; Pasquini et al., 2011; Villanova et al., 2012). The few available measurements are consistent with some He-abundance spreads coupled to the CNONaMgAl anticorrelations, although the uncertainties are large.
To employ photometry as an additional diagnostic to detect and characterize cluster MPs, we need to assess the impact of the P2 chemical abundance patterns first on stellar evolution models, and the corresponding tracks and isochrones in the Hertzsprung-Russell diagram (HRD), and then on the predicted spectral energy distributions (SEDs) .
2.1 Impact of the light-element anticorrelations on stellar models and evolutionary tracks
The effect of CNONaMgAl anticorrelations on stellar models has been investigated by Salaris et al. (2006), Pietrinferni et al. (2009), Cassisi et al. (2013), and Dotter et al. (2015). Here we first explore the effect of this metal abundance patterns at fixed initial helium abundance.
Reference calculations for the P1 populations are from the BaSTI (Pietrinferni et al., 2006) models computed with an -enhanced [/Fe]=0.4 metal mixture. The P2 models –unless otherwise noted– have been calculated, at a given [Fe/H] and , including depletions of C, O and Mg by 0.6 dex 0.8 dex and 0.3 dex by mass, respectively, and enhancements of N, Na and Al by 1.44 dex, 0.8 dex and 1 dex, compared to P1 abundances Cassisi et al. (2013). The (C+N+O) sum in the P2 metal composition is within 0.5% of the P1 value, and the resulting total metal mass fraction is the same between P1 and P2 models at a given [Fe/H] and . These P2 abundance patterns are shown in Fig. 1, superimposed on the abundances observed in a sample of Galactic GCs. We chose in our modeling somewhat extreme values of the observed anticorrelations (as observed in NGC 6752 and NGC 2808, see also the detailed discussions in Carretta et al., 2005; Gratton et al., 2012, 2019, and references therein) to maximise their impact on stellar models as well as on their SEDs (see Sect. 3).
In addition, we also consider the effect of a CNO-enhanced () metal distribution, with the (C+N+O) sum larger by a factor of 2 compared to P1 abundances (the only difference compared to the CNO-constant P2 composition is that N is enhanced by 1.8 dex rather than 1.44 dex, see Sbordone et al., 2011). This is to investigate the effect of a CNO-enhancement, as observed in some Galactic GCs, like NGC 6656 and Cen. In this case the metallicity of P2 models is a factor of 2 higher than the P1 counterpart with the same [Fe/H] and .
From basic stellar physics we expect the differences between P1 and P2 composition to affect the radiative Rosseland mean opacity , the equation of state and the energy generation efficiency, which in turn can have an impact on luminosity, and lifetime of the models. Actually, the reference P2 composition with unchanged CNO sum does not have any significant impact on model structure, lifetime, evolutionary tracks, in the regime of Galactic GCs (see, e.g., Cassisi et al., 2013), but also, as we have verified with appropriate calculations, at intermediate ages down to 1-2 Gyr and [Fe/H] up to about half solar values.
A sizable effect is however expected in case of the P2 composition (Salaris et al., 2006; Cassisi et al., 2008; Pietrinferni et al., 2009; Ventura et al., 2009; VandenBerg et al., 2012), mainly through opacity and energy generation efficiency. Figure 2 displays the relative difference of the radiative opacity in both high- and low-temperature regimes, between matter with a normal enhanced P1 heavy element distribution and matter with the P2 mixture, for [Fe/H]=1.6 and =0.246. The differences are displayed as a function of the density parameter R= / –where is the density in and the temperature in million Kelvin– and various temperatures
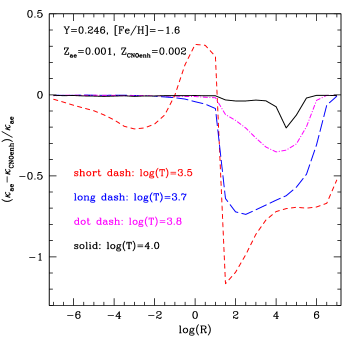
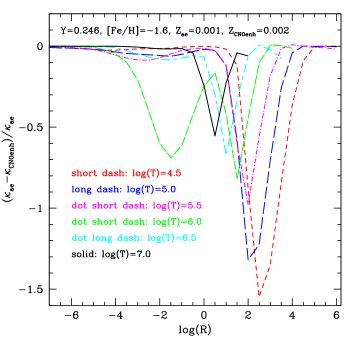
For temperatures lower than about 10,000 K and , i.e. in the regime typical of the envelopes of low-mass models along the main sequence (MS), subgiant branch (SGB) and RGB, differences are small, except for very low temperatures around 3000 K. On the other hand, at temperatures above 10,000 K and larger values of , typical of model interiors, differences are much more significant. The opacity of the composition is typically larger than that of the P1 metal mixture, with differences mainly confined to R values in the range between and . The larger values of the opacities in this regime are consistent with the fact that C, N and O are among the main contributors to the high-temperature opacity of the stellar matter (see, e.g., Salaris et al., 1993; VandenBerg et al., 2012).
Results from the computation of low-mass models with P1 and P2 compositions can be summarised as follows:
-
•
If the CNO sum is the same in P1 and P2 models, evolutionary tracks (including the core He-burning stage) and isochrones of P2 populations are identical to their -enhanced P1 counterparts with the same [Fe/H] and , meaning that there is no need for dedicated calculations. This is important, given that, as already mentioned, measurements (albeit not very extensive) of the CNO sum point to a constant value in P1 and P2 stars, within the measurement errors.
-
•
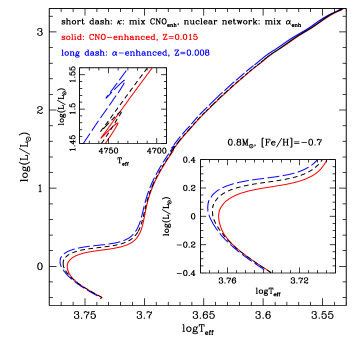
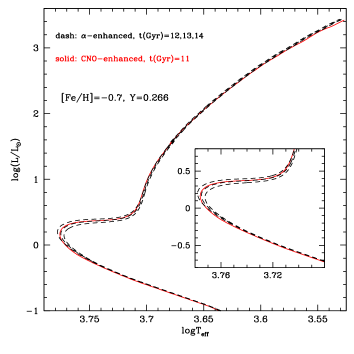
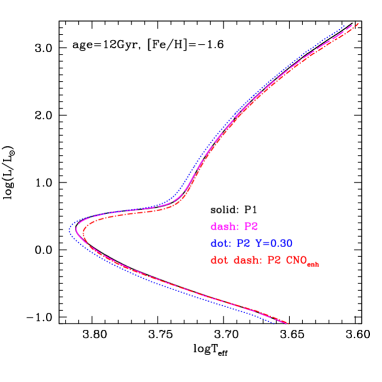
if the CNO sum is enhanced in P2 models, the morphology of evolutionary tracks in the HRD is modified, as shown in the upper panel of Fig. 3 for the MS, SGB and RGB. For a given initial mass (at fixed [Fe/H] and ), both MS turn off (TO) and SGB are fainter (the TO is also cooler) in comparison with standard enhanced P1 tracks. This behaviour is due to both the increased efficiency of the CNO-cycle in CNO-enhanced models, and the increase of . The variation of the TO luminosity and is mainly due to the increased efficiency of the CNO cycle, as shown by the results of the numerical experiment in Fig. 3. If the CNO enhancement is accounted for only in the opacities, the effect on the TO position in the HRD is more than halved.
-
•
The evolutionary lifetimes of the CNO-enhanced P2 models are affected by the increase of the CNO sum due to the altered efficiency of the CNO-cycle. However, for masses typical of stars currently evolving in Galactic GCs, due to the marginal contribution of the CNO-cycle to the energy budget, this effect is small, amounting to % for the 0.8 tracks shown in Fig. 3, the P1 enhanced models being younger by about 120 Myr. Whilst the of the RGB is basically unchanged, the RGB bump luminosity becomes fainter in the P2 track by . Again, as for the TO, the main effect is the increased efficiency of the CNO cycle (see Fig. 3).
-
•
Despite the fact that during the first dredge-up (FDU) the convective envelope reaches deeper layers in models, the amount of helium dredged to the surface is exactly the same () as in P1 calculations. This is due to the increased efficiency of the CNO cycle in models, which confines core H-burning to regions closer to the centre.
The properties of stellar models at the He-flash are also changed in the calculations. In the case of the tracks displayed in Fig. 3, the He-core mass at the tip of the RGB (TRGB) is equal to for the P2 composition, while the corresponding P1 value is . This difference translates to a difference of the TRGB luminosity.
-
•
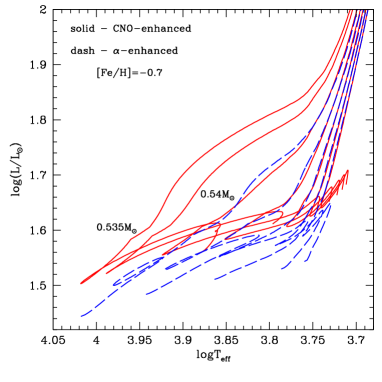
Despite the lower value of and the larger total metallicity , at fixed [Fe/H] and initial the HB tracks and their Zero age HB (ZAHB) location are brighter than the P1 counterparts, as shown in Fig. 4. The reason is the increased efficiency of the CNO-burning in the hydrogen shell, as a consequence of the increased CNO sum. The brightness difference along the ZAHB at = 3.83 –taken as representative of the mean effective temperature of the RR Lyrae instability strip– is equal to , for models with [Fe/H]=0.7. For a fixed total mass, the ZAHB location of CNO-enhanced P2 models is cooler compared to P1 models: However, as a consequence of the higher efficiency of the H-burning shell, P2 models display more extended blue loops in the HRD, as shown in Fig. 4.
-
•
The HRD of MS-SGB-RGB isochrones with P2 composition are identical to P1 results, but for the TO and SGB regions, which are fainter (the TO is also cooler) for the P2 composition, as shown in Fig. 3. At the [Fe/H] and values of this comparison, the 11 Gyr P2 CNO-enhanced isochrone is perfectly mimicked by a Gyr older P1 isochrone.
2.2 Impact of helium enhancement
The initial helium abundance has a major effect on the structure and evolution of stellar models, and this section discusses in detail the impact of helium abundance variations on the shape and location of isochrones in the HRD. Section 2.2.1 will focus on the lower main sequence, Sect. 2.2.2 on RGB models and Sect. 2.2.3 on the core He-burning phase.
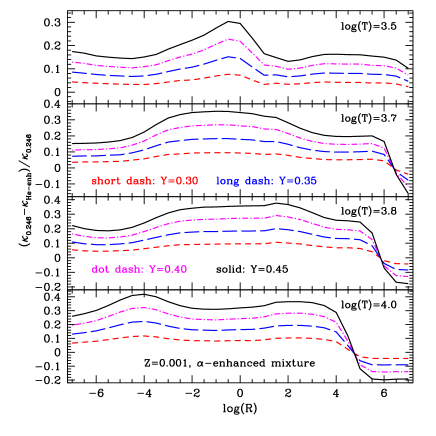
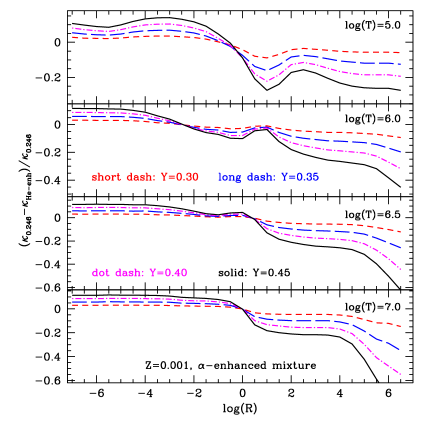
Let us at first discuss the impact of a He abundance change on the opacity of stellar matter. An increase of the He mass fraction at fixed metallicity causes a reduction of the radiative opacity, as shown in Fig. 5. In this figure we show the relative difference of the Rosseland mean radiative opacity between a a composition with standard =0.248 and compositions with various He enhancements, for a representative metallicity =0.001. At temperatures below or equal to 10,000 K, an increase of decreases at fixed R. At =3.8 the decrease is on average on the order of % when going from =0.248 to =0.30, but increases to % when =0.45. Only for R larger than the trend is reversed and the opacity increases when increasing the He abundance222In the interiors of low-mass models, reaches values on the order of only during the RGB advanced evolutionary phases. However in this regime the electron conduction opacity is the dominant contributor to the opacity in the He-core.. This behaviour is confirmed also at temperatures above 10,000 K –although the change of the opacity is smaller in comparison to lower temperatures– but the value of R beyond which the trend is reversed is shifted to lower values, as the temperature increases. This general decrease of when increasing the He content at fixed is due to the decrease of the hydrogen mass fraction , hydrogen being a major opacity source via the ion. The decrease of makes He-enhanced stellar models generally hotter than models with standard .
The opacity reduction in He-enhanced models makes them also brighter during the MS. An additional and larger increase of the luminosity in this phase is caused by the change of the mean molecular weight333In case of complete ionisation, the mean molecular weight is given by . of the stellar matter when the He abundance changes. In fact, the H-burning luminosity increaes with as . When He increases at fixed , the mean molecular weight also increases, and this translates to a larger H-burning luminosity. Given that , an increase causes a % increase of the H-burning luminosity. The combined effect of the radiative opacity decrease and the increase of H-burning efficiency make He-rich stellar models brighter and hotter along the MS. As a consequence, their MS lifetime () is significantly reduced: for a , decreases from 11.3 Gyr to 3.8 Gyr when increases from 0.246 to 0.40.
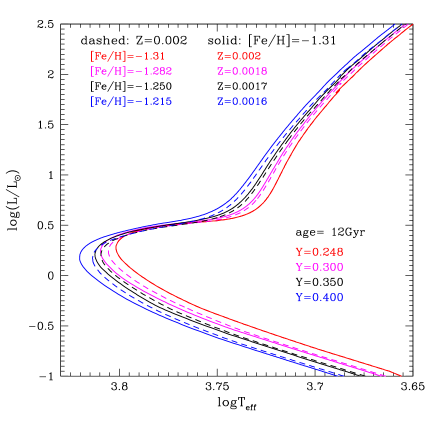
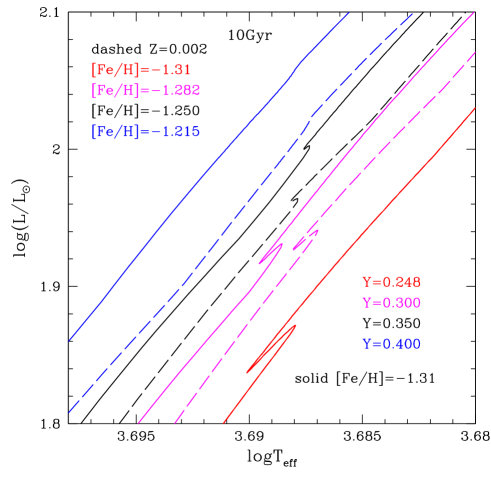
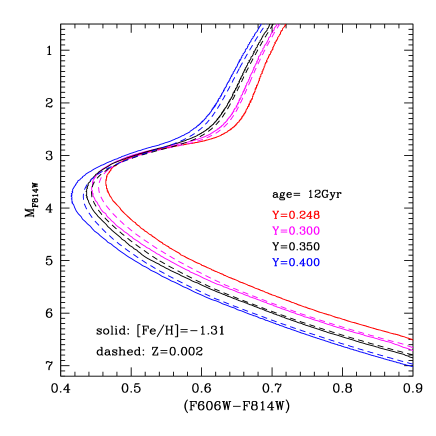
Figure 6 shows various isochrones from the MS to the RGB at fixed and age, but different values of the initial He abundance. The most relevant features are the following:
-
•
The various MS isochrones run parallel in the luminosity interval from the TO down to the lower mass limit in the figure. At fixed age, the TO becomes fainter when increasing the He content; this is a consequence of the shorter MS lifetimes of He-rich stars, which imply a lower mass at the TO (). For a 12 Gyr old isochrone is equal to when =0.245, and for =0.40. This has important implications for the morphology of the HB of He-rich stellar populations;
-
•
The of the MS at fixed luminosity increases with increasing initial He abundance, K;
-
•
The SGB morphology is practically unaffected by a He abundance change;
-
•
The of the RGB is also affected by a He increase: at fixed bolometric luminosity, the larger the initial He content, the hotter the RGB. The effect is larger at the base of the RGB, decreasing when increasing the luminosity. For example, at =1, K (smaller than for the MS), which decreases to K when =2.
The previous analysis has been performed by comparing isochrones for various initial He abundances but the same metallicity . Once the heavy element distribution is fixed, the amount of iron is set by , hence the assumption of constant when changing the He abundance has the implication that [Fe/H] is not constant, because the hydrogen abundance does change. Given that by definition, if is kept fixed, increasing implies a decrease of , hence an increase of [Fe/H].
The choice of models with different initial He abundance and constant seems appropriate for MP studies, because the abundance patterns commonly observed do not show evidence of a significant change in the total metallicity among the various populations in individual clusters. In fact, the sum of the CNO abundances plus the abundances of all elements not affected by the anti-correlations (the most important ones being Fe, Ne, and Si) amount to about 90% or more of the total . Given that the CNO sum and iron abundance are remarkably constant amongst the cluster sub-populations –but for very few exceptions like for example Cen (Johnson and Pilachowski, 2010), or Terzan 5 (Origlia et al., 2013)– it seems appropriate to consider He-enhancements at constant . In addition, when the He abundance variation amongst the cluster populations is large enough –as indeed is the case of NGC 2808– it is possible to detect spectroscopically small variations of [Fe/H], consistent with the expected change due to the H abundance decrease (Bragaglia et al., 2010). In general, the change of [Fe/H] due to ‘reasonable’ variations of is small, becoming more significant ( dex or more) only for a He increase larger than about 0.1.
The impact on theoretical isochrones of changing at constant [Fe/H] is also shown in Fig. 6, for heuristic purposes. The important point to consider is that to have the same [Fe/H] with an increased , the metallicity needs to be decreased. This causes some important differences with respect to the case of He variations at constant metallicity. First of all, for a fixed He enhancement, the shift in effective temperature along the MS and the RGB is larger for the case of constant [Fe/H], as a consequence of the lower –hence the lower opacity – that pushes stellar models towards even hotter values. Also, the SGBs of He-enhanced isochrones at fixed [Fe/H] do not overlap well with the standard isochrones, as in case of constant ; this is mainly due to the reduction of the CNO sum as a consequence of the decrease of , which affects the CNO-cycle efficiency.
2.2.1 He enhancement and the lower main sequence
Accurate, near-infrared photometry with the WFC3 camera on board Hubble Space Telescope (HST) has extended the study of multiple stellar populations in Galactic GCs to very low-mass (VLM) stars (stars with mass below 0.45 ), which populate the faintest portion of the MS (see, e.g., Milone et al., 2012a, 2017a). These stars are important not only to investigate the existence of differences in the mass function of the various cluster populations (see the discussion in Milone et al., 2012b), but also because VLM stars are fully convective and pose stringent constraint on accretion scenarios proposed to explain the MP origin (see the discussion in Bastian et al., 2013; Cassisi and Salaris, 2014; Salaris and Cassisi, 2014, and references therein).
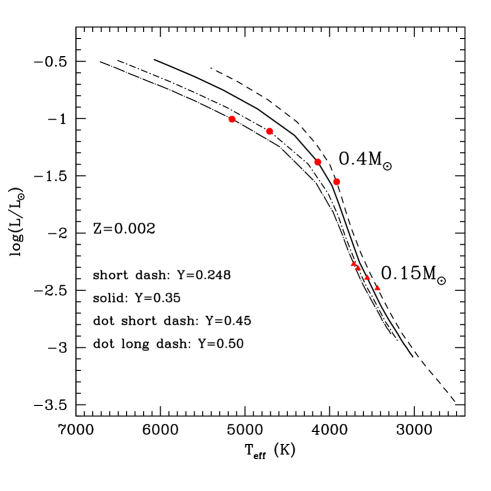
As shown in Fig. 7, an increase of the initial in VLM model calculations has a much smaller effect than in more massive models. At an age of 10 Gyr an increase Y=0.25 causes a change of by only K, and 0.2 for a 0.15 model, whereas the changes are equal to K and for a model. This reduced sensitivity can be explained by the fact that VLM models are fully convective on the MS, and the He produced is homogeneously mixed throughout the whole structure, minimizing differences among models calculated with different initial He abundances.

2.2.2 Red giant branch models and He enhancement
Concerning the RGB evolution, there are three important properties affected by a change of the initial He abundance: the scale, the bump luminosity, and the TRGB luminosity.
The variation of the RGB has been already noted when discussing Fig. 6, and is due to the decreased opacity when is increased. Regarding the bump, we recall that the RGB bump is a local maximum in the differential luminosity function of the RGB in old populations. It corresponds to the stage when the H-burning shell crosses the hydrogen abundance discontinuity left over by the convective envelope at the completion of the FDU. During this crossing, the luminosity of RGB models drops temporarily, then starts again to increase after the hydrogen shell has moved beyond the discontinuity. As a result, there is a narrow luminosity range along the RGB that is crossed three times by models. This produces a bump (a local maximum) in the luminosity functions of old stellar populations (see, e.g., Thomas, 1967; Cassisi and Salaris, 2013, and references therein).
As shown by Fig 8, models predict than an increase of increases the bump brightness, and causes a smaller luminosity excursion. The first effect is due to the lower envelope opacity of He-rich models, which shifts to more external layers the discontinuity of the H abundance, because of a shallower surface convection. A shallower convective envelope has also the important consequence that the amount of He dredged to the surface by the FDU decreases when increasing the initial He abundance, as shown in the upper panel of Fig. 9.
The second effect (smaller luminosity excursion) is caused by the narrower jump of the H abundance at the discontinuity in He-enhanced models, because of the lower H-abundance in the envelope. As a consequence the surface luminosity is less affected when the H-burning shell crosses this chemical discontinuity (see, Cassisi et al., 2002, for a detailed discussion on this issue).
The RGB bump vanishes when the initial is larger than . The exact value of does depend on the isochrone age and metallicity. It increases when the age decreases at fixed metallicity, and decreases when metallicity decreases at fixed age. For instance, at =0.002 the critical abundance is equal to 0.32 at an age t=12.5 Gyr, whereas at 12 Gyr (see the discussion in Cassisi and Salaris, 2013). On the other hand, at t=12 Gyr =0.28 when =0.0003.
Observationally, the impact of a He abundance range on the RGB bump brightness in Galactic GCs has been discussed by Bragaglia et al. (2010). The effect on the RGB bump luminosity excursion has been used by Nataf et al. (2011b) to interpret the small number of RGB bump stars in the Galactic bulge: An oberved number smaller than predictions of He-normal stellar models has been considered as a proof that bulge stellar populations are He-enhanced.
The TRGB brightness is also affected by the initial He abundance. For a given value of the initial mass of RGB models, an increase of the initial He content decreases the TRGB brightness (see Fig. 9). The reason is that He-rich models are hotter at the end of the MS, and develop a lower level of electron degeneracy in the He-core. At the same time, as a consequence of the higher H-burning efficiency, the He-core mass grows at a faster rate. Both effects acts in a way that the thermal conditions required for the ignition of the reaction, are attained earlier, with a smaller He-core mass, as shown in Fig. 9. Due to the existence of a core mass-luminosity relation for RGB models, the TRGB brightness decreases in He-rich, low-mass giants. We also recall that, as a consequence of the reduction of the MS lifetime of He-rich models, the mass of stars at the TRGB is expected to be significantly smaller in He-enhanced stellar populations, when age is kept constant and if the efficiency of mass loss during the RGB does not depend on the initial He content (see Fig. 9).
The effect of enhancing at fixed [Fe/H] on the properties shown in Fig. 9 is almost exactly the same as for the case of constant . The reason is that the variations of associated to the increase of (reported in Fig. 6) are small enough to have a negligible influence on the results of Fig. 9.
Regarding the bump luminosity, a given enhancement of helium at fixed age and [Fe/H] makes the bump luminosity to increase either more or less than the case of enhancement at fixed , depending on the actual value of . This is due to the combination of two factors. First of all, compared to the case of constant , an increase of at fixed [Fe/H] implies a reduction of the initial metallicity, which makes the bump brighter at fixed initial mass. However, at a given age the mass of the models evolving along the RGB is also reduced compared to the case at constant , causing a decrease of the bump luminosity.
Regarding the effective temperature of RGB isochrones, enhancements at constant [Fe/H] make the isochrones hotter compared to the case of enhancement at fixed , due to the metallicity decrease necessary to keep [Fe/H] constant.

2.2.3 Core He-burning and He enhancement
For a given population age, HB models for an enhanced initial He abundance are typically bluer (hotter) in the HRD, compared to models for a normal initial He. This is due to the combination of two effects (see also D’Antona et al., 2002; Caloi and D’Antona, 2005; Cassisi and Salaris, 2013, for a detailed discussion on this topic):
-
•
As already mentioned, for a given age and , and assuming the same efficiency of mass loss along the RGB, the TRGB of a He-enhanced isochrone corresponds to models with a smaller total mass at the TRGB and a smaller He-core mass than the He-normal counterpart. The first effect prevails over the second one, even for variations of as small as 0.01-0.02, hence the following HB phase in He-enhanced populations will harbour models with a smaller total mass and a smaller ratio. Furthermore, given that the of a model on the ZAHB depends on this ratio –the lower the ratio, the hotter the ZAHB location– the ZAHB of He-enhanced populations will be typically bluer than the He-normal counterpart with the same age and ;
-
•
As shown in Fig. 10, the larger the He abundance in the envelope of HB models at a given total mass, the more extended the blue loops in the HRD, which characterize the off-ZAHB evolution of He-rich models.
A He-enhancement has an additional important implication for the global HB morphology. As shown in Fig. 11, the ZAHB brightness is a strong function of the initial He content: Typically, the higher the initial , the brighter the ZAHB. However, when is higher than K, the trend reverses. This behaviour is a consequence of both the decrease of the He-core mass at the TRGB and the increased efficiency of shell H-burning in He-rich stars. In models whose ZAHB location is cooler than K, the second effect prevails, and He-enhanced models are brighter. Above this threshold, due to the reduced envelope mass of the models, the H-burning shell efficiency is low, and the decrease of the He-core mass causes a reduction of the ZAHB luminosity with increasing .
2.3 Isochrones for multiple stellar populations
Figure 12 encapsulates the impact of several results of the previous sections on the HRD of cluster MPs. We show here a comparison among isochrones from the MS (masses above 0.5) to the RGB with the same age and [Fe/H], but different heavy element distributions, namely P1, P2 with and without CNO enhancement, and P2 with He enhancement (this latter one has been calculated for the same and CNO sum of the P2 CNO-normal composition). Some important properties are worth mentioning:
-
•
For P2 compositions at the same CNO of the P1 metal mixture, we expect that only variations of affect the HRD. Higher means hotter MS, TO (at fixed age) and RGB. The TO is only slightly fainter than P1 isochrones, the SGB essentially overlaps in luminosity with the P1 one;
-
•
An increase of the CNO sum affects the TO-SGB region of the isochrones. The TO becomes cooler and fainter, the SGB becomes fainter. The MS and RGB are unaffected;
-
•
There is no need to calculate theoretical isochrones for P2 compositions, as long as the CNO sum in P2 stars is the same as in P1 objects. This allows us to employ standard -enhanced (or solar scaled) isochrones to model P2 populations, with either normal or enhanced He.
3 Impact of abundance anticorrelations on theoretical spectral energy distributions
As already mentioned, the interpretation of photometric observations of cluster multiple populations requires to asses the impact of the P2 chemical patterns not only on theoretical stellar evolution models and isochrones, but also on the predicted SED of the models.
Early works which cross-correlated chemical abundances determined from spectroscopy, with photometry of small samples of RGB stars in the Galactic GCs M4 and NGC6752, have found that the colour and the Strömgren index are able to separate the different populations within the same cluster (Marino et al., 2008; Yong et al., 2008). The first theoretical investigation of the effect of P2 abundance patterns on stellar SEDs was then performed by Sbordone et al. (2011) and later extended by Cassisi et al. (2013) and Salaris et al. (2019). More targeted studies focused on specific evolutionary phases or wavelength ranges have been published, e.g., by Milone et al. (2012c), Milone et al. (2012a), Dotter et al. (2015), Niederhofer et al. (2017).
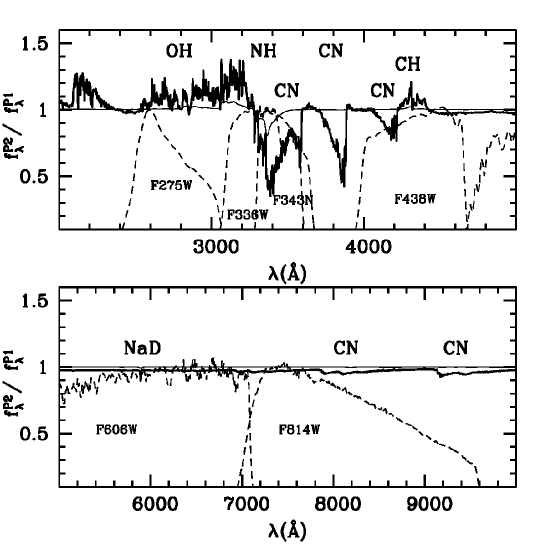
Figure 13 displays the ratio of the fluxes of two pairs of P1 and P2 SEDs computed for two points along a 12 Gyr, [Fe/H]=1.6, =0.246 isochrone. The first pair of P1-P2 SEDs is calculated along the RGB at =4,500 K, and surface gravity =2 (cgs units); the second pair corresponds to the TO point, with =6,131 K and =4.5 (calculations from Salaris et al., 2019). The SEDs cover the wavelength range between 2,000 and 10,000 Å, and the next Fig. 14 displays the continuation of the same SEDs up to 51,000 Å.
The figures show very clearly the much stronger molecular NH and CN absorption bands between about 3,200 and 4,200 Å in the P2 RGB SED, due to the higher N abundance. The CH molecular band at 4,400 Å is less prominent in the P2 SED due to the decreased carbon. Below about 3,200 Å the OH bands are weaker in the P2 SED, because of the lower oxygen abundance, while above 4,200 Å the differences between the two SEDs are very small. Above 10,000 Å the weaker CO bands in the P2 SED cause some sizable differences around 24,000 Å and above 44,000 Å. In general differences decrease with increasing : at the MS TO the two SEDs are basically identical, apart from a small difference in a narrow wavelength range around 3,300 Å due to NH, because the high temperatures prevent the formation of CN and CH molecules. Below about 4,000 K and at moderate-high metallicities, molecular bands of TiO and also appear above 10,000 Å, which are weaker in P2 SEDs due to the reduced abundance of oxygen.
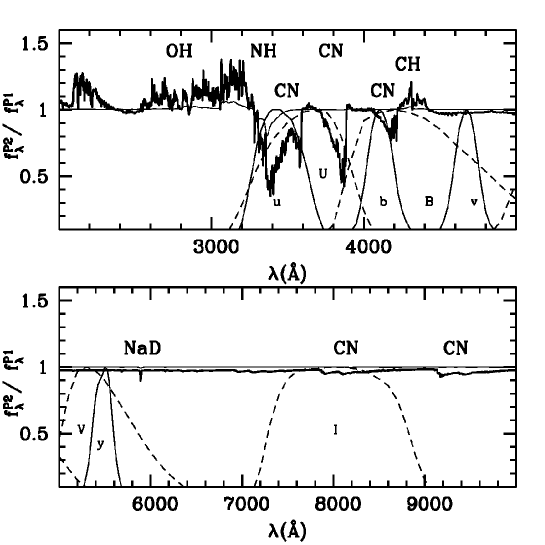

Figures 13 and 14 display also the transmission curves of representative photometric filters, and show how below 10,000 Å the Johnson and Strömgren filters are the most affected by the P2 chemical pattern, for they cover the wavelength range of prominent NH and CN molecular bands. The (in this wavelength range the opposite effects of the CN and CH molecular bands almost compensate each other), and Johnson filters, as well as the (only marginally affected by CN molecular absorption), , Strömgren ones are much less affected, if at all. When moving to the infrared, the fiter is marginally sensitive to a CO molecular band, while the filters , , and are much more sensitive to the P2 chemical pattern. Below 4,000 K and at higher [Fe/H] the appearance of and TiO molecular bands affect all filters shown in Fig. 14.
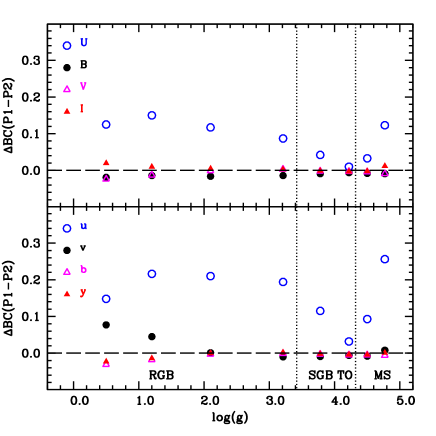
Figure 15 shows how the differences in the theoretical P1 and P2 SEDs translate to variations of the predicted magnitudes in selected photometric filters. We display differences of the bolometric corrections (BCs) calculated for the Johnson-Cousins and Strömgren filters of Fig. 13, taken at selected points along a 12 Gyr isochrone with [Fe/H]=1.6 and =0.246444We recall that, as long as the CNO sum (and initial ) is the same, P1 and P2 theoretical isochrones are identical.. Only the and magnitudes change drastically between P1 and P2 composition, as expected. Differences of BCs between P1 and P2 SEDs are basically zero at the TO –the hottest point along the isochrone– and increase when moving towards the lower MS and along the RGB. On the RGB the values of BC reach a maximum at 4,500 K, and decrease slightly towards lower effective temperatures (corresponding to higher bolometric luminosities). The effect on the BCs for the infrared filters of Fig. 14 is quantitatively smaller, even for the , , and filters centred on CO molecular bands. If we neglect the Mg-Al anticorrelation in the SED calculations or we increase , the effect on both SED and BCs is very minor (see, e.g., Girardi et al., 2007; Cassisi et al., 2013; Milone et al., 2018).
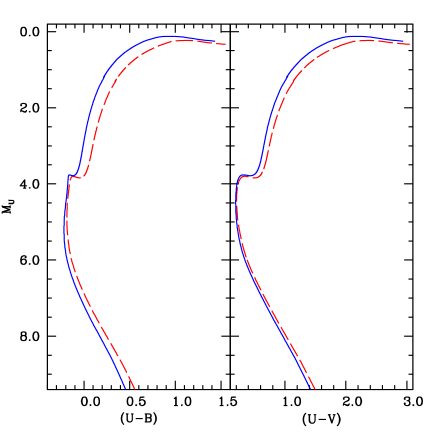
Figure 16 shows the 12 Gyr old [Fe/H]=1.6, =0.246 isochrones for P1 and P2 compositions in the and colour-magnitude diagram (CMD). They are clearly separated along MS and RGB – P2 models being redder in and – whilst they converge around the TO, where the BCs are essentially the same for P1 and P2 SEDs. This separation is due to the effect of CN and NH molecular absorption in the band, whilst the and bands are essentially unaffected by the P2 abundance anticorrelations.
Passbands of selected filters of the WFC3 and ACS cameras on board the Hubble Space Telescope (HST), and widely used to disentangle cluster MPs –like for example in the UV Legacy Survey of Galactic Globular Clusters– are displayed in Fig. 17. We can see clearly how the and passbands are very sensitive to the nitrogen abundance, while the effects of oxygen variations on the filter, and the C-N anticorrelation on the filter are less substantial.
On the quantitative side, the size of these effects depend obviously on the exact values of C and N abundances in the P2 SED calculations (in these tests we employed the values in Fig. 1), and the the metallicity , which affects also the of the underlying theoretical isochrones (see, e.g., Milone et al., 2018). If we combine the results about the effect of P2 compositions (at fixed and age) on both theoretical isochrones and SEDs, we can draw the following general conclusions about photometric diagnostics of cluster MPs:
-
•
Spreads and/or splittings of both MS and RGB in optical CMDs (Johnson-Cousins or HST equivalent filters) are caused by variations of the initial helium content between P1 and P2 stars.
-
•
Spreads and/or splittings of the TO-SGB region in optical CMDs are caused by variations of the CNO sum.
-
•
CMDs which employ colours like, e.g., , , , , –made of a passband sensitive to the CN anticorrelation, and a passband unaffected by CN molecular bands– will show spreads and/or splittings along MS, SGB and RGB, with a minimal effect around the TO. Colours like and are sensitive, to smaller degrees (but this also depends on ), to oxygen (through OH molecular absorption) and carbon (through CH molecular absorption) depletion, respectively. In addition, these CMDs will show the additional effect of variations of (if present), which alter the of the MS, TO and RGB, like in case of the optical CMDs.
4 Colour magnitude diagrams
As discussed at the end of the previous section, CMDs with appropriately chosen colours including a passband (typically in the UV) sensitive to the CN anticorrelation, are able to disclose the presence of MPs in clusters. They show up as broadenings or multimodalities in the colour distributions of RGB and MS stars. The use of optical colours can still reveal MPs along MS and RGB, because a range of initial He abundances causes again colour spreads and multimodalities. In general, whenever the colour distribution at fixed magnitude along a given evolutionary phase –the large majority of the investigations are based on the RGB, that is bright and well populated in old- and intermediate-age populations– is broader than what expected from photometric errors only, MPs are present in the cluster. If bi- or multimodality is found in these colour distributions, P1 and P2 (one or several P2 subpopulations) can be separated, and their fractions of the total cluster population can be estimated. Moreover, once disentangled, their radial distributions within a cluster can be determined and compared.
Just to give a few examples, Piotto et al. (2007) employed an ACS - CMD to detect multiple sequences along the MS – hence a multimodal He abundance distribution– in the Galactic GC NGC 2808. More recently, Milone et al. (2012c) and Piotto et al. (2013) made use of several WFC3 and ACS CMDs, employing various filters from the UV to the optical. By accounting for the response of various colour combinations to variations of C, N and He, these authors determined, by an iterative procedure, the presence of abundance spreads along the MS and RGB of of the Galactic GCs 47 Tuc (Milone et al., 2012c) and NGC 288 (Piotto et al., 2007). Milone et al. (2012c) detected MPs also along the SGB and HB of 47 Tuc.
The theoretical justification for this procedure is that different colours respond differently to variations of these three elements (for example an optical colour like is affected only by variations of hence , whilst e.g., is sensitive to N). An analogous technique was applied by Milone et al. (2018) and Lagioia et al. (2019b) to determine He abundance difference between P1 and P2 populations (disentangled by means of the so-called chromosome maps discussed below) in 57 Galactic GCs and four intermediate-age and old Small Magellanic Cloud clusters, considering multiple colour differences at a given reference magnitude along the cluster RGBs.
Analogous technique was employed by Milone et al. (2014), but applied to the lower MS of the Galactic GC M4 and using different sets of WFC3 and ACS filters, including the IR filters and of the WFC3 camera. The CMD -() was found to be especially sensitive to MPs at these low (below about 4,000 K) and [Fe/H]1, because of the effect of molecular bands on the theoretical SEDs. The observed spread of the lower MS in this colour is effectively tracing the presence of the O-Na anticorrelation. We also note that this detection of MPs in fully convective, lower MS stars, has provided strong evidence of their primordial origin.
4.1 Pseudocolours and chromosome maps
A slightly different approach devised to enhance the photometric separation between P1 and P2 stars envisages the use of appropriate combinations of colours, that we will refer to interchangeably as colour indices or pseudocolours. The basic idea is to use a combination of, for example, two colours, one of which increases whilst the other one decreases when moving from P1 to P2 compositions. Their combination would therefore enhance the disentangling power, compared to just one colour. In same cases the combination is chosen as to erase the dependence on of a colour sensitive to P2 chemistry along the RGB, to produce almost vertical sequences in a suitable magnitude-pseudocolour diagram. This facilitates the identification of broadenings/multimodalities caused by MPs.
An early example can be found in Grundahl et al. (2002), who found a correlation between the pseudocolour and the nitrogen abundances measured in a sample of RGB stars in the Galactic GC NGC 6752. Yong et al. (2008) later introduced the Strömgren index , which tracks , but removes much of its temperature sensitivity, as shown in Fig. 18.
As a result, - CMDs of Galactic GCs display an almost vertical RGB at luminosities lower than the RGB bump (see Fig. 18), as shown empirically by Yong et al. (2008), who also derived a tight correlation between and spectroscopic N abundances aalong the RGB. Theoretical isochrones displayed in the - diagram agree with this empirical evidence. The sensitivity to N comes mainly through the filter , as discussed in the previous section. P2 isochrones have redder colours than P1 ones, as shown in Fig. 18, and an increase of the initial He abundance shifts the RGBs of P2 isochrones further away from the P1 ones 555Lee (2017) has introduced the index, defined as , where and are two fiters in the wavelength range between 3800 and 4050 Å. The index is sensitive to the absorption of the CN band at 3883 Å, and the - diagram is very similar to the - counterpart, but with a better MP resolving power.
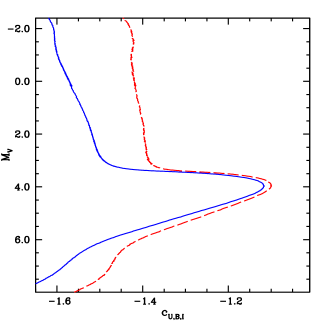
Carretta et al. (2011) have proposed instead the Strömgren index . Calculations of P1 and P2 isochrones show that in the - diagram, P2 isochrones are systematically shifted to higher values of compared to P1 ones, both along MS and RGB. Moreover, isochrones are almost insensitive to the initial , hence any colour spread observed in this CMD depends only on the range of N abundances666The index is also almost insensitive to reddening, given that ..
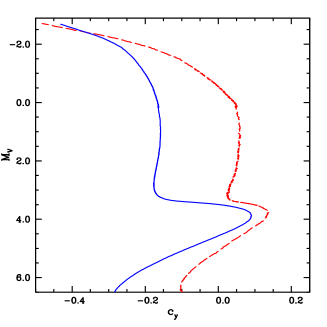
Moving to the Johnson-Cousins system, Milone et al. (2012c) employed the pseudocolour to disentangle MPs along the red HB of 47 Tuc in a - diagram, whilst Monelli et al. (2013) introduced the pseudocolour , which displays a behaviour very similar to , as shown in Fig. 18. This index is sensitive to the nitrogen abundance through the filter (like the case of the pseudocolour) and as for , an increase of the initial He abundance shifts the RGBs of P2 isochrones further away from the P1 ones. Monelli et al. (2013) have employed - diagrams of 23 Galactic GCs to detect the presence of MPs by analyzing the spread along the RGB.
The pseudocolours and have been introduced by Niederhofer et al. (2017) and Martocchia et al. (2017) to detect MPs along the RGBs of massive clusters in the Magellanic Clouds, by comparing the observed width with that expected from photometric errors only (once differential reddening, if any, has been corrected for). In each of these combinations, the first colour is sensitive to N enhancements, and gets redder for P2 compositions, whilst the second colour has a mild sensitivity to carbon depletions, and gets bluer for P2 compositions. These pseudocolours thus enhance the separation of the various cluster populations compared to using just one N-sensitive colour.
A new and different diagnostic tool which makes use of suitable colours and pseudocolours was presented by Milone et al. (2017b), as the culmination of the HST UV Legacy Survey of Galactic Globular Clusters. This tool, applied to 57 clusters of the survey, has been named chromosome map and is based on the combination of a - CMD and a - diagram, where 777See also Milone et al. (2015) for a first discussion of this map for the Galactic GC NGC 2808, and alternative versions of chromosome maps. Zennaro et al. (2019) has very recently used another version of chromosome maps to study the Galactic GC NGC 2419, employing the pseudocolour and the colour . The construction and general properties of this map are the same as for Milone et al. (2017b) maps. For the same cluster, Larsen et al. (2019) have devised an analogous type of chromosome map, but based on the and pair of colours..
Given a cluster members’ photometry (corrected for differential reddening, if any), red and blue fiducial lines of the RGB in each of these two diagrams are calculated by considering the values of the 4th and the 96th percentile of the and distributions in various magnitude bins. On theoretical grounds, in both the - HRD and - diagram, P2 stars are expected to be located at blue side of the observed RGB. As a second step, the widths of the RGB in the colour () and in the pseudocolour () two magnitudes above the TO, are calculated by taking the colour and pseudocolor differences between the red and blue fiducials at the reference magnitude. All clusters studied by Milone et al. (2017b) have and larger than zero, even after subtracting the effect of photometric errors, implying that MPs are ubiquitous in their sample. Finally, for each star the following quantities are calculated:
| (1) |
| (2) |
where X= and Y= are measured, R and B correspond to the values for the red and blue fiducials at the star magnitude.
With these definitions, =0 and =0 correspond to stars lying on the red fiducial lines –P1 stars, which will be spread around these coordinates due to the photometric error– and values different from zero denote colour and pseudocolour distances (defined as positive for , and negative for ) from such lines. The values of these distances are normalized to the distance between the two fiducials taken at the reference level above the TO.
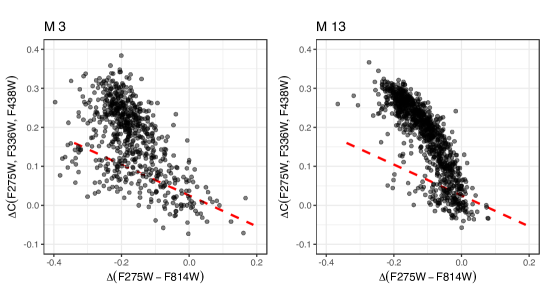
Figure 19 displays, as an example, chromosome maps of the two Galactic GCs M 3 and M 13, which have essentially the same age and [Fe/H] (see, e.g., Salaris and Weiss, 2002).
The distribution of stars describes a curve extended towards increasing and decreasing , implying the presence of RGB stars bluer than the P1 population in both and . The relative narrowness of the sequence also indicates that the shifts in and are correlated. An increase of N moves the position of stars almost vertically towards higher , whilst an increase of He ( is strongly sensitive to ) and a decrease of O shift stars roughly horizontally towards lower . At low- and intermediate metallicities like the case of these two clusters, is very weakly sensitive to the oxygen abundance (Lardo et al., 2018), and the shape of the cluster chromosome maps in Fig. 19 shows clearly that P2 stars are also enriched in He.
In general, the slope of the curve depends on how the increase of He and decrease of O trace the increase of N, and this may vary from cluster to cluster (a detailed analysis of the effect of varying the individual abundances of various elements can be found in Milone et al., 2018; Lardo et al., 2018).
The chromosome maps of the majority of the GCs investigated show well separated groups of stars, corresponding to P1 (clustered around the origin of the coordinates) and P2 populations. In some cases the P2 population consists of a few subgroups centred around discrete values of . Only for a handful of clusters there is no clear separation, between P1 and P2 along their chromosome map, which shows a continuous number distribution along the full range of .
Another important point to notice is that the majority of clusters in Milone et al. (2017b) sample display another sequence extending from =0 and =0 (the expected location of P1 stars) towards negative values of , but with only a small increase of . This can be seen in the map of M 3 map (the sequence below the dashed line), but is virtually missing in M 13. Correlations of spectroscopic abundance measurements for samples of RGB stars in NGC 2808 (Milone et al., 2015; Cabrera-Ziri et al., 2019) and M 4 (Milone et al., 2017b) with positions in the clusters’ chromosome maps show that this sequence hosts stars with [O/Fe] abundance ratios typical of P1 stars. The natural explanation for the existence of this sequence is therefore the presence of a range of He abundances also in P1 stars, at least in a large fraction of GCs (Milone et al., 2018; Lardo et al., 2018). An alternative explanation is the presence of a small range of Fe abundances (Fe decreasing towards negative values of , because of the higher of more Fe poor RGB stars) in P1 stars. Marino et al. (2019) found hints of a range of [Fe/H] among P1 stars in NGC 3201, which shows an extended P1 sequence in the chromosome map, but see also the discussion in Mucciarelli et al. (2015).
On the other hand a range of Fe is not found by Cabrera-Ziri et al. (2019) along the extended P1 sequence of NGC 2808. A recent analysis by Martins et al. (2020) has also excluded binaries (see also Kamann et al., 2020) and chromospheric activity as explanations for the observed extended P1 sequences.
In general, shape and extension of the sequences in the chromosome maps exhibit a great deal of variety. A number of clusters (denoted as Type II by Milone et al., 2017b, as opposed to Type I clusters with the typical chromosome maps just described), like e.g., Cent, NGC 1851, NGC 6656, NGC 6934, even display additional P2 sequences (e.g. NGC 1851) or an apparent split of both P1 and P2 sequences (e.g. NGC 6934), these additional features being typically located at larger compared to the main ones. Some of these clusters are known to have a spread also of [Fe/H] (e.g. Cent), others a spread of the CNO sum (e.g. NGC 1851); these further chemical peculiarities are most likely the reason for the observed additional sequences in the chromosome maps.
A couple of final comments on these maps. First of all, due to the effect of the metallicity on the colour and pseudocolour sensitivity to the MP abundance variations (e.g. Milone et al., 2018), comparison of cluster chromosome maps need to account for [Fe/H] differences. Also, it is worth remarking that the exact shape and extension of the sequences depends on the magnitude level at which the map is normalized. This can be seen in Fig. 20, which displays six different chromosome maps for M 13, with the normalization taken at several different levels above the TO. The position of the reference open rectangle in each map relative to the P2 sequence, shows that the shape (and the total range of the coordinates) of the map depends on the normalization magnitude. This is because, at fixed metallicity, the sensitivity of and to chemical abundance variations depend on . Especially in case of intermediate-age clusters, there is also the additional issue that the range of surface nitrogen abundances spanned by P1 and P2 stars generally changes along the RGB, as discussed below. Both effects imply that the values of the widths and do depend on the brightness level chosen for the normalization of the maps. This needs to be taken into account when translating the observed shape and extensions of the chromosome maps to quantitative chemical abundance spreads.
4.2 First dredge up and thermohaline mixing
An important issue to consider when translating colour or pseudocolour ranges into initial chemical abundance spreads, or when ranking the width of RGBs with respect to age and/or metallicity, is the evolutionary change of the surface abundances involved in the anticorrelations. The large majority of the information obtained about MPs has come from RGB stars, and we know that the FDU alters the surface abundance of mainly nitrogen, and to a lesser degree carbon (see, e.g., Cassisi and Salaris, 2013; Salaris et al., 2015). During the FDU the surface nitrogen increases (and carbon decreases) compared to the initial values, and this increase depends on the initial abundance. The variation of the surface abundances due to the FDU impacts the SEDs, hence the predicted colours and pseudocolours sensitive to this element. This is not relevant for old star clusters (especially the metal-poor ones), like the Galactic GCs, because the impact of the FDU at these ages is minimal (see, e.g., Salaris et al., 2015), but the effect is more important in intermediate age clusters, where MPs have also been detected (Salaris et al., 2020).
Moreover, we know observationally (see, e.g., Gratton et al., 2000) that at the RGB bump an additional element transport mechanism starts to increase again the surface N (and decrease C) with increasing luminosity. Thermohaline mixing is generally considered to be responsible for these latter changes, although theoretical predictions for the efficiency of this process in RGB stars are still uncertain (see, e.g. Charbonnel and Lagarde, 2010; Lattanzio et al., 2015).
Because of the FDU and later (presumably) thermohaline mixing, the observed RGB widths in N-sensitive (and C-sensitive) colours and pseudocolours are determined by both the initial nitrogen (and carbon) abundance spreads, and the variations induced by these transport mechanisms. P2 stars, with a higher initial N abundance, are predicted to be much less affected by FDU and thermohaline mixing, compared to P1 objects. The reason is that during the FDU the convective envelope reaches layers where the abundances of C and N attained the equilibrium values of the CN cycle during core H-burning. The equilibrium abundance of N is typically higher (and the C abundance lower) than standard P1 solar scaled or -enhanced counterparts for a given total metallicity, hence the FDU causes an increase of surface N (and a decrease of C). However, when the initial metal mixture is N-enhanced (and carbon depleted) the equilibrium abundance of N (and C) becomes more comparable to the initial one, and the effect of the FDU is much less appreciable, or even negligible. The same is true for thermohaline mixing, which acts as to erase the gradients of N and C abundances between the base of the convective envelope and inner layers where CN is at equilibrium.
Reliable predictions for the effect of thermohaline mixing are hard to make, given the theoretical uncertainty regarding the efficiency of this process, but the effect of the FDU can be quantified. This is shown by Fig. 21, which displays the run with age of [N/Fe], defined as the difference of surface [N/Fe] between a RGB with P2 composition, and a coeval one with P1 composition (for [Fe/H]=1.3 in this example).

The figure shows both a representative initial –the same for all ages– and the corresponding differences at the completion of the FDU (). is always lower than , following a trend with age, despite the fact that is the same at all ages. In younger RGB models is much smaller than , getting progressively closer to its initial value with increasing age. The reason for this trend is that in RGB models with P1 initial N abundance, the surface [N/Fe] at the end of the FDU increases with decreasing age, while the impact of the FDU is always much reduced or negligible in N-enhanced P2 models. The effect of the FDU on the surface carbon abundance is also small or negligible in P2 models with initial C-depleted abundances, while the surface [C/Fe] at the end of the FDU gets progressively lower with decreasing age in P1 models, hence the carbon abundance spread also increases with decreasing age (starting for a initial constant value at all ages).
Figures 22 and 23 display a couple of examples of the impact of the FDU on pseudocolours sensitive to P2 compositions (see Salaris et al., 2020). The P2 chemical composition in this case has [C/Fe]=0.28, [N/Fe]=0.80 and [O/Fe]=0.28 (wich keeps the CNO sum unchanged compared to the P1 metal distribution), whilst the P1 composition is solar scaled; no variations of Na, Mg and Al have been included in the P2 composition, because they do not have any relevant effect on the SED.
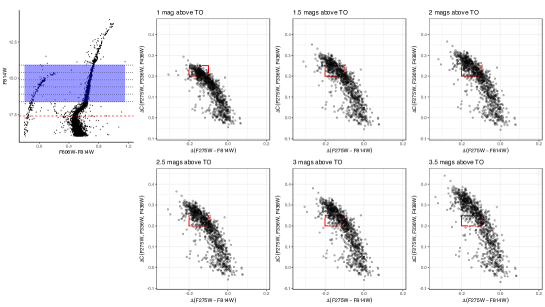
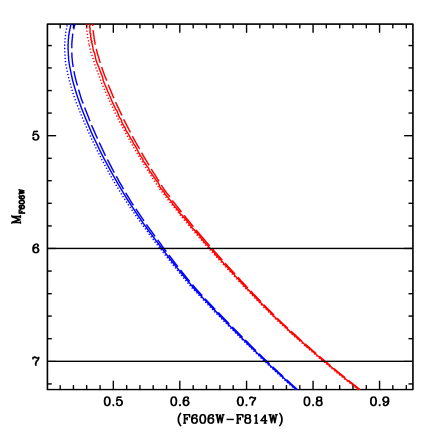
Figure 22 shows theoretical RGBs for two pairs of bimodal P1-P2 populations with ages equal to 6 and 13.5 Gyr, [Fe/H]=1.3, and =0.8, displayed in the diagram employed by Martocchia et al. (2019) to study MPs in intermediate-age clusters in the Magellanic Clouds. The range of magnitudes corresponds approximately to the range employed in Martocchia et al. (2019) analysis, which encompasses the entire development of the FDU, and stops below the RGB bump. In the same figure the dotted lines display P1 RGBs that do not account for the effect of the FDU on the SEDs. At 13.5 Gyr the no-FDU (in the SED calculations) RGB is almost coincident with the FDU RGB, because at this metallicity and age the effect of the FDU on the surface abundances is very small also for the P1 composition. For the 6 Gyr case, the no-FDU P1 isochrone RGB runs parallel to the P2 one, and diverges steadily from the calculations that include the FDU.
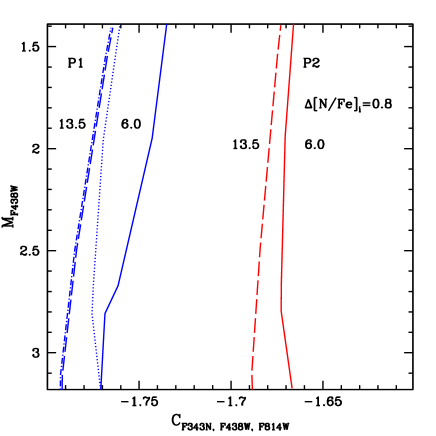
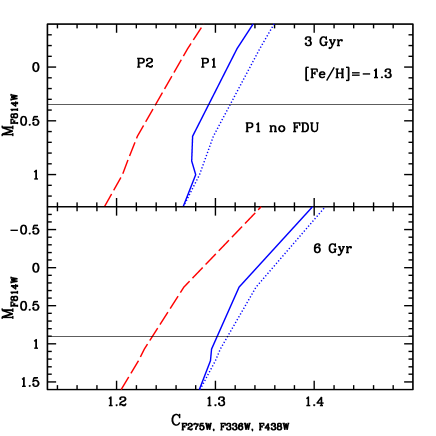
Figure 23 displays instead the RGB diagram (below the RGB bump) of two P1-P2 bimodal populations (again at a representative [Fe/H]=1.3) with ages of 3 and 6 Gyr, respectively, including also P1 RGBs calculated without accounting for the FDU in the SEDs. The N-sensitive pseudocolour is also employed as the vertical axis of chromosome maps. The behaviour is the same as in Fig. 22, just this time the relative position of P1 and P2 RGBs is swapped. The level at which the total RGB width is normalized in the chromosome maps to compare different clusters (two magnitudes above the main sequence turn off in the filter) is marked.
It is clear how with decreasing age the normalization is at magnitudes increasingly more affected by FDU abundance variations. Any interpretation in terms of of the RGB widths in the chromosome maps of intermediate-age clusters, but also comparisons of observed as a function of age, must account for the effect of the FDU on the surface [N/Fe] and pseudocolours. The net effect of neglecting the influence of the FDU on the model SEDs is an underestimate of the initial N-abundance ranges from RGB photometry.
5 RGB bump luminosity and HB morphology as diagnostics of He abundance spreads
As mentioned in Sect. 2, the luminosity of the RGB bump at fixed and age is sensitive to the initial , hence it can potentially be used to constrain the relative helium abundances among cluster MPs, if high precision photometry is available. As an example, Fig. 24 displays the predicted magnitude difference in the ACS filter (insensitive to light element abundance anticorrelations) between the RGB bump brightness of P2 and P1 =0.002 isochrones, as a function of the difference in (, calculated with respect to the value =0.248 for the P1 composition), for two ages and P2 compositions with constant (the same as P1 isochrones) and enhanced (by a factor of 2) CNO, respectively. For a given cluster age and metallicity, measurements of magnitude differences of the bump brightness translate straightforwardly into values of .
The dependence on age increases with increasing , whilst the relationship for CNO-enhanced P2 isochrones is offset by a sizeable zero point, due to the fact that for the same and age the RGB bump in CNO enhanced isochrones is fainter than in -enhanced P1 ones. It is also important to notice that the RGB bump disappears beyond threshold values of , which depend on age and chemical composition.

Bragaglia et al. (2010) determined empirically that the bump luminosity for P2 stars (identified spectroscopically) in a sample of 14 Galactic GCs is on average brighter than P1 stars, implying larger abundances. Nataf et al. (2011a) concluded that the gradient of the bump brightness and star counts with the radial distance in the Galactic GC 47 Tuc, is consistent with the presence of a helium enriched stellar population in the cluster centre. More recently, Milone et al. (2015) detected the RGB bump in three populations along the RGB of of NGC2808, as identified from the chromosome map, deriving helium differences 0.03 and 0.10, consistent with results obtained from the MS colours (see Sect. 6).
Lagioia et al. (2018) have determined P1 and P2 RGB bump magnitudes for a sample of 26 Galactic GCs, using chromosome maps to separate the two types of populations. For 18 clusters they were able to determine from optical CMDs an average = 0.0110.002 between P1 and P2 stars (assuming coeval populations), the latter being more helium rich. Lagioia et al. (2019b) performed a similar analysis in 4 Small Magellanic Cloud old clusters, finding for three of them a slightly larger average in P2 stars.
Also the HB can be used to estimate He abundance spreads in intermediate-age (Chantereau et al., 2019) and old star clusters (see, e.g., D’Antona et al., 2002; di Criscienzo et al., 2010; Dalessandro et al., 2011, 2013; Gratton et al., 2013; Niederhofer et al., 2017), because its morphology is very sensitive to the initial He distribution of the cluster population, as shown by the next two figures.
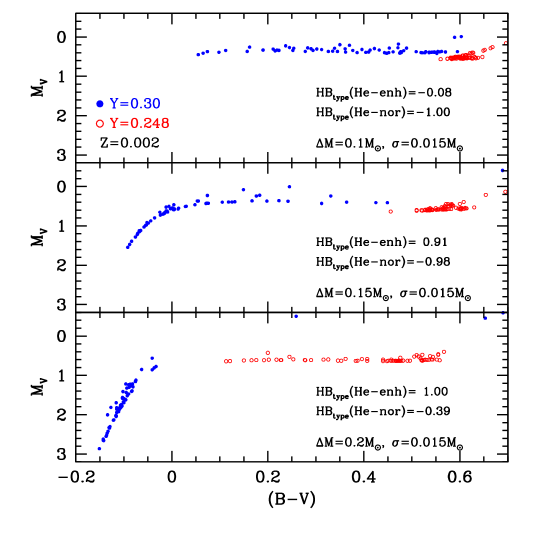
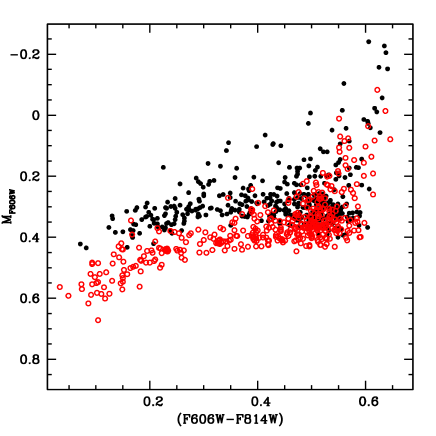
Figure 25 displays optical CMDs (hence BCs are not affected by the light element abundance variations) of three synthetic HBs, each one calculated for a bimodal P1-P2 cluster with uniform metallicity (=0.002), the two labelled initial values of (=0.248 for P1 stars and =0.300 for P2 stars), and RGB progenitor ages equal to 12.5 Gyr, corresponding to initial masses equal to 0.84 and 0.76 for the P1 and P2 population, respectively. The mean amount of mass lost by the RGB progenitors () is the same for both populations in each CMD, and increases from the top to the bottom panel, as labelled. The spread around these mean values is the same in all diagrams.
Regardless of the specific value of , assuming it is the same for both P1 and P2, the He-enhanced P2 synthetic objects are bluer than the P1 ones. This a consequence of the lower RGB progenitor mass in the He-enhanced population. With increasing , the overall HB morphology becomes bluer, and a blue tail typical of optical HB CMDs (due to the large increase of the BCs above a threshold ) start to appear. A quantitative measure of this increasingly bluer morphology with increasing is provided by the parameter, defined as where B, R, and V are the number of objects bluer, redder and within the RR Lyrae instability strip, respectively. The values of for both P1 and P2 objects increase with increasing , as expected from the progressive shift to bluer colours of the synthetic populations.
Due to the lack of a reliable theory for the RGB mass loss, we cannot be sure that is truly the same in P1 and P2 stars, and in terms of colour distributions, morphologies like the ones in Fig. 25 could be reproduced by just P1 objects, with a bimodal distribution of values. However, the enhancement of He affects also the magnitudes –apart from the objects on the blue tail in this optical CMD, where He-normal and He-enhanced objects are located essentially on the same sequence. The P2 He-enhanced population is brighter, because of the increased efficiency of the H-burning shell (see Sect. 2), and this increase of luminosity cannot be reproduced by tuning the mass loss of P1 objects.
Figure 26 makes this point very clear, by showing the optical CMD in ACS optical filters, of two synthetic HBs with the same metallicity and progenitor age, but in one case a constant initial =0.248 and a large spread of (with uniform distribution), whilst in the other simulation has a single value with a negligible spread, but a range of initial helium abundance enhancements (uniform distribution), from 0 to =0.04. Both simulations cover approximately the same colour range, but the slope of the synthetic HB is clearly different in the two cases. A different slope of the HB when comparing synthetic populations with constant He and large spread of , with populations at constant and large spread of , appears also in simulations of red HBs like the Galactic GC 47 Tuc, and intermediate age clusters (see, e.g. Salaris et al., 2016; Chantereau et al., 2019).
A range of initial He abundances explains the very tilted optical CMDs of the HB in Galactic GCs like NGC 6388, NGC 6441 and NGC 1851(see Caloi and D’Antona, 2007; Busso et al., 2007; Salaris et al., 2008; Tailo et al., 2017, and references therein), and also extended blue tails like in the CMDs of NGC 2808 (D’Antona et al., 2005; Lee et al., 2005), and again NGC6441 and NGC6388.
Regarding the blue tails in UV CMDs, Dalessandro et al. (2011) and Dalessandro et al. (2013) have shown with extensive simulations how the use of UV filters for these hot HB stars help to disentangle the degeneracy between He-normal and He-enhanced populations, by properly tracing the differences in bolometric luminosities discussed in Sect. 2.
Finally, the expectation that He-rich stars populate preferentially the hotter side of the HB in old clusters, has been used to infer the presence of MPs from the integrated colours of extragalactic globular clusters. Bellini et al. (2015) have employed integrated UV-optical CMDs and two-colour diagrams to identify a small group of likely GCs belonging to the elliptical galaxy M87, which might host multiple populations with extreme helium content.
6 The main sequence as tracer of He abundance spreads
As discussed in Sect. 3, spreads and/or splittings of the MS in optical CMDs provide us with yet another way to determine He-abundance spreads in clusters, because they are caused by variations of the initial between P1 and P2 stars, being independent of associated light-element abundance variations. Figure 27 shows representative coeval isochrones (with [/Fe]=0.4) in an optical CMD, calculated by varying the initial at either fixed or fixed [Fe/H]. The behaviour mirrors what was discussed in the theoretical HRD. Using the MS in optical colours like to detect He abundance spreads in clusters has the additional advantage of a weak metallicity dependence of the - relation (Pietrinferni et al., 2004).
The determination of He abundance spreads from the MS is straighforward: It is enough to evaluate colour differences on the MS at a given magnitude level, for example mag below the TO to avoid age effects (Cassisi et al., 2017), and compare them with model predictions. This is outlined in Fig. 28, as applied to the case of the blue and red sequences observed along the MS of Cen (Bedin et al., 2004; Piotto et al., 2005; King et al., 2012), a more complicated situation than for standard monometallicity GCs. The figure displays the difference of the colour taken at between an isochrone with the same [Fe/H] of the red MS in the cluster ([Fe/H]=1.62, assuming it has standard =0.246) and an isochrone with the [Fe/H] of the blue MS (the three possible values labelled), as a function of the initial He abundance of the isochrone representative of the blue MS. The [Fe/H] of the blue MS isochrones is kept constant when varies, fixed at the measured value. The three different [Fe/H] for the blue MS reflect the observational uncertainty (see, e.g., King et al., 2012), and the measured value of the colour difference is also marked, together with the uncertainty. The fact that the red MS is more metal poor than the blue one means that the blue MS must have a much higher initial .

The intersection of the solid horizontal line with the predictions from the theoretical isochrones at varying provides a direct estimate of for the blue MS. Values derived considering the full range of estimates of [Fe/H] for the blue MS provide an estimate of the effect of this source of error, to combine with error from the uncertainty on the measured value of the colour difference.
Figure 28 shows also a prediction for the colour difference between the blue and red MS of Cen by keeping fixed the metallicity of the blue MS when increasing . The assumed value =0.002 corresponds exactly to [Fe/H]= (with a [/Fe]=0.4 metal distribution) for a normal =0.248, but to keep [Fe/H] fixed to this value with increasing , the metallicity should increase by for example 15% for =0.40. This explains the difference with the results for [Fe/H]=1.32, constant with . There is no significant variation in the colour difference predicted by the constant model until . Above this limit, the constant models predict systematically larger for the blue MS.
For the bulk of globular clusters the interpretation of colour differences at fixed magnitude along the MS due to MPs with different is much simpler. The measured values would correspond to differences calculated from isochrones with the same and varying (because of the uniform Fe abundance in the cluster). The minimum value of the difference would then be zero, when both points belong to an isochrone with the same and . On the contrary, in case of Cen, when of the blue MS is the same as for the red one, the predicted colour difference is negative, meaning that the blue MS should actually be redder than the red one, because of its higher [Fe/H].
The use of optical CMDs of the cluster MS as He abundance diagnostic has been discussed in detail by Cassisi et al. (2017) who found from their -enhanced models that:
-
•
The derivative (taken two magnitudes below the TO in ) is weakly dependent on the isochrone metallicity, being equal to about at =0.0003 (corresponding to [Fe/H]= for =0.245) and to 1.7 at =0.008 (corresponding to [Fe/H] for =0.256);
-
•
The values of are also largely independent of the exact value of the MS reference brightness. A change from 2 magnitudes to 1 magnitude below the TO at =0.002 (corresponding to [Fe/H]=1.3 for =0.248) changes from 1.8 to 2.1 ;
-
•
is also fairly independent of the isochrone age when the reference brightness is at least about 2 mag below the TO, in the unevolved part of the MS.
In the following, we discuss briefly the accuracy of the He abundance spreads derived from MS optical CMDs, following Cassisi et al. (2017). We summarize the impact of the efficiency of superadiabatic convection, the treatment of the outer boundary conditions of the models, the effect of atomic diffusion, and the choice of BCs. The tests discussed below are all made at fixed =0.002, [/Fe]=0.4, corresponding to [Fe/H]=1.32 for =0.248.
Regarding the treatment of the superadiabatic envelope convection, the mixing length theory (MLT – Böhm-Vitense, 1958) is almost universally used. This formalism contains in its standard form 4 free parameters: three parameters are fixed a priori (and define what we denote as the MLT flavour) whereas one (the so-called mixing length, ) is calibrated by reproducing observational constraints, firstly the solar radius by means of a solar model. Tracks computed with different MLT flavours do basically overlap along MS, SGB and RGB as long as is appropriately calibrated to match the solar radius (see, e.g., Salaris and Cassisi, 2008; Salaris et al., 2018). However, given that there is no a priori reason for the solar to be appropriate also for other masses, chemical compositions and evolutionary phases, it is important to check how is affected by changes of . Figure 29 shows how the CMD location of the MS for two values of changes when is varied by around the solar value. This variation is consistent with the changes along the MS predicted by the 3D radiation hydrodynamics models by Trampedach et al. (2014) and Magic et al. (2015). At a given He abundance the three sequences are almost coincident for 6 (about 2 magnitudes below the TO) as well as at fainter magnitudes. The reason is that models in this magnitude range have deep convective envelopes almost completely adiabatic, and the variation of has a negligible effect on their temperature stratification, hence on the predicted and colours.
To integrate the stellar structure equations, it is necessary to fix the value of the pressure and temperature at the photosphere (see, e.g., VandenBerg et al., 2008, and references therein). The choice of these outer boundary conditions has an impact of the MS location, because it affects the of stellar models with convective envelopes (see, e.g., Cassisi and Salaris, 2013, for more details). As a test, we have calculated isochrones computed adopting two widely used relationship to determine the model boundary conditions, namely the Krishna Swamy (1966) and the Eddington grey . For each of these two choices the value of is calibrated on the Sun. Calculations with the Eddington are systematically bluer by mag, but the shift is independent of the adopted initial He abundance, the shape of the MS is preserved, and the value of is unchanged.
It is well known (see, e.g. Cassisi and Salaris, 2013) that, although helioseismic data require the inclusion of approximately fully efficient atomic diffusion in the standard solar model, high resolution spectroscopy of metal-poor, Galactic GC stars has shown strong evidence that the efficiency of this element transport mechanism has to be lower than predicted by theory. Atomic diffusion affects the chemical stratification of the MS models, modifying opacity, and impacting the model scale. Following the detailed investigation by Cassisi et al. (2017), Fig. 30 compares isochrones with no atomic diffusion, fully efficient diffusion thorughout the models, and diffusion from the convective envelope inhibited, but efficient in the radiative interior. The first two cases correspond to the two extreme situations: Fully efficient atomic diffusion shifts the isochrone MS to redder colours, by an amount that increases moving towards the MS turn-off. However, the faintest portion of the MS is less affected, because models have very extended (in mass) fully mixed, convective envelopes, which minimize the surface depletion of metals and He due to atomic diffusion. This has the important implication that the calibration of depends in this case on the adopted reference magnitude: At =7, the effect of diffusion is barely noticeable, whilst it is more relevant at =6.
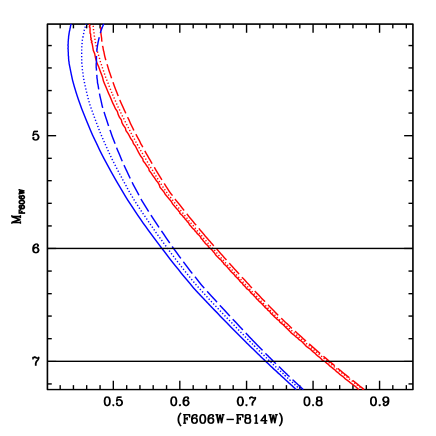
The impact on the MS and colours is He dependent, increasing with increasing initial He abundance, because the larger , the shallower the convective envelope. When diffusion is restricted to the radiative interiors the impact on the MS colours is obviously reduced. In case of fully efficient diffusion at =6 increases by about 0.4 in the He range between 0.30 and 0.35, and by about 0.5 for initial He abundances larger than 0.35, compared to no diffusion models.
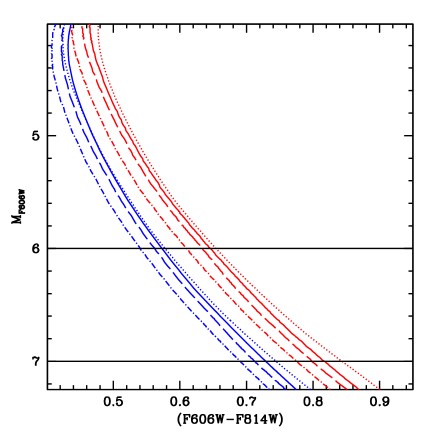
Finally, we briefly discuss the choice of BCs. Figure 31 shows the comparison of isochrones for two different values of (=0.248 and =0.40) and four independent choices of BCs. Three sets come from theoretical calculations (ATLAS9, employed as a reference in all previous tests, PHOENIX, MARCS, from Pietrinferni et al., 2004; Brott and Hauschildt, 2005; Casagrande and VandenBerg, 2014, respectively), whilst one set is empirical (Worthey and Lee, 2011). Varying the set of BCs affects the colours of the MS, but the impact on is minimal when considering the three theoretical BC calculations, because differences are just systematic shifts, the same for all . On the other hand, the use of the empirical BCs does impact , which changes compared to the reference values for the ATLAS9 BC, because of a clear change of shape of the isochrones. The value of is almost the same as for the reference ATLAS9 case at =6, but it gets increasingly smaller than the corresponding reference value when considering increasingly fainter magnitudes along the MS.
7 Present status and outlook
The previous sections have discussed in some detail a range of photometric methods, informed by the results of high resolution spectroscopy, to disentangle and characterize the main properties of MPs in massive star clusters. Their application to Milky Way and Magellanic Clouds’ clusters has had a massive impact on studies in the field. Below, we give a concise summary of the main information gathered by photometric investigations of MPs (see, e.g., Dalessandro et al., 2014; Milone et al., 2017b; Bastian and Lardo, 2018; Milone et al., 2018; Lardo et al., 2018; Lagioia et al., 2019b, a; Chantereau et al., 2019; Martocchia et al., 2018a, 2019, and references therein), which set strong constraints for all scenarios/models put forward to explain their origin, and more in general the formation of massive star clusters.
-
•
Figure 32 summarizes, in a cluster (present-day) mass-age diagram, the situation regarding photometrically detected MPs in Galactic GCs and massive clusters of the Magellanic Clouds. MPs have been detected down to ages around 2 Gyr, but not below this threshold. At ages below about 8 Gyr the lower (present-day) mass limit for the presence of MPs is around , but several older clusters with MPs have lower masses, down to about .
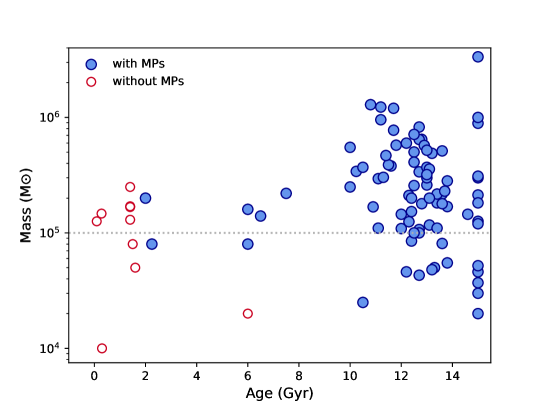
Figure 32: Present-day mass vs. age diagram of surveyed Galactic GCs and massive clusters in the Magellanic Clouds, with and without photometrically detected MPs. A reference mass equal to is marked (see text for details). -
•
In some clusters clear multimodal (pseudo-)colour distributions are detected in RGB chromosome maps or CMDs, whilst in other cases smooth distributions are observed, without evident separations between populations.
-
•
P2 stars are generally the most abundant population in most Galactic GCs. On average, the larger the cluster mass, the smaller the fraction of P1 stars.
-
•
A substantial fraction of GCs display internal chemical variations in P1 stars, very likely associated to a range of initial He abundances or, possibly, small spreads of Fe on the order of 0.1 dex.
-
•
In Galactic GCs the RGB width in colours and pseudocolours sensitive to He and N abundances correlates strongly with the cluster metallicity. When this dependence is removed, the RGB width correlates with cluster mass and luminosity. More massive and brighter clusters have larger internal variations of these elements. When considering also the relationship between number fraction of P2 stars and cluster mass, it turns out that the larger the fraction of P2 stars, the larger the internal variations of He and N.
-
•
Most GCs have P2 stars more concentrated in the innermost region than P1 stars, with few exceptions whereby P1 stars are more centrally concentrated than P2 stars, or both P1 and P2 stars share the same radial distribution.
-
•
The current sample of observed Magellanic Clouds’ clusters display a trend with age of the RGB width in nitrogen sensitive indices. Even after correcting for the effect of FDU, the width of the RGB increases with increasing age. The range of He abundances derived from the CMD of the core He-burning phase however does not seem to correlate with age, and follows the same trend with cluster mass found in Galactic GCs.
-
•
Estimates of the age difference between P1 and P2 populations (when they have been determined) in Galactic GCs are within 300 Myr (see, e.g., Marino et al., 2012b; Nardiello et al., 2015), and within 20 Myr for massive clusters about 2 Gyr old (see, e.g., Martocchia et al., 2018b; Saracino et al., 2020).
The discovery of MPs in intermediate-age massive clusters of the Magellanic Clouds –the same MP phenomenon as in Galactic GCs– has certainly put into a new perspective the problem of their formation. Whilst it has been generally acknowledged that MP formation was connected to high-redshift environments, their discovery in clusters with ages as low as 2 Gyr is clearly in serious conflict with this idea. An increase of the sample of Magellanic Clouds’ clusters hosting MPs (at the moment we have about just 10 clusters with MP detection) is certainly necessary, together with a homogeneous comparison with Galactic GCs using consistent pseudocolours (see Lagioia et al., 2019a) and chromosome maps (see Saracino et al., 2019, 2020).
In the near future JWST will provide us with photometric diagnostics to search for MPs in resolved massive clusters even beyond the Local Group (Salaris et al., 2020). This will allow us to investigate in more depth the role that the environment might play in the formation of MPs. At the same time JWST will also enable to study the lower MS in a much larger sample of Galactic GCs than possible today with HST, and provide crucial information on the present-day mass functions of P1 and P2 stars, plus estimates of N and O abundance ranges in this fully convective objects still on the zero age MS, to compare with results from the much more evolved RGB stars in the same cluster.
Acknowledgements.
We acknowledge the anonymous referee for his/her helpful suggestions. We warmly thank Adriano Pietrinferni for interesting discussions and the fruitful collaboration over all these years. We wish to acknowledge Giampaolo Piotto for his leading role in the development of photometric studies of MPs in globular clusters. Raffaele Gratton and Alvio Renzini are also warmly acknowledged for interesting discussions and collaborations on this research topic. We thank Nate Bastian and Carmela Lardo for several comments on an early draft of the manuscript. We are grateful to Carmela Lardo also for producing some of the figures. SC acknowledges support from Premiale INAF MITiC, from Istituto Nazionale di Fisica Nucleare (INFN) (Iniziativa specifica TAsP), progetto INAF Mainstream (PI: S. Cassisi), PLATO ASI-INAF agreement n.2015-019-R.1-2018, and grant AYA2013- 42781P from the Ministry of Economy and Competitiveness of Spain.Conflict of interest
The authors declare that they have no conflict of interest.
References
- Bastian and Lardo (2018) Bastian N, Lardo C (2018) Multiple Stellar Populations in Globular Clusters. Annual review of Astronomy and Astrophysics 56:83–136, DOI 10.1146/annurev-astro-081817-051839, 1712.01286
- Bastian et al. (2013) Bastian N, Lamers HJGLM, de Mink SE, Longmore SN, Goodwin SP, Gieles M (2013) Early disc accretion as the origin of abundance anomalies in globular clusters. Monthly Notices of the Royal Astronomical Society 436(3):2398–2411, DOI 10.1093/mnras/stt1745, 1309.3566
- Bedin et al. (2004) Bedin LR, Piotto G, Anderson J, Cassisi S, King IR, Momany Y, Carraro G (2004) Centauri: The Population Puzzle Goes Deeper. Astrophysical Journal Letter 605(2):L125–L128, DOI 10.1086/420847, astro-ph/0403112
- Bellini et al. (2015) Bellini A, Renzini A, Anderson J, Bedin LR, Piotto G, Soto M, Brown TM, Milone AP, Sohn ST, Sweigart AV (2015) UV Insights into the Complex Populations of M87 Globular Clusters. Astrophysical Journal 805(2):178, DOI 10.1088/0004-637X/805/2/178, 1504.01742
- Böhm-Vitense (1958) Böhm-Vitense E (1958) Über die Wasserstoffkonvektionszone in Sternen verschiedener Effektivtemperaturen und Leuchtkräfte. Mit 5 Textabbildungen. Zeitschrift für Astrophysik 46:108
- Bragaglia et al. (2010) Bragaglia A, Carretta E, Gratton R, D’Orazi V, Cassisi S, Lucatello S (2010) Helium in first and second-generation stars in globular clusters from spectroscopy of red giants. Astronomy & Astrophysics 519:A60, DOI 10.1051/0004-6361/201014702, 1005.2659
- Brott and Hauschildt (2005) Brott I, Hauschildt PH (2005) A PHOENIX Model Atmosphere Grid for Gaia. In: Turon C, O’Flaherty KS, Perryman MAC (eds) The Three-Dimensional Universe with Gaia, ESA Special Publication, vol 576, p 565, astro-ph/0503395
- Busso et al. (2007) Busso G, Cassisi S, Piotto G, Castellani M, Romaniello M, Catelan M, Djorgovski SG, Recio Blanco A, Renzini A, Rich MR, Sweigart AV, Zoccali M (2007) The peculiar horizontal branch morphology of the Galactic globular clusters NGC 6388 and NGC 6441: new insights from UV observations. Astronomy & Astrophysics 474:105–119, DOI 10.1051/0004-6361:20077806, 0708.1736
- Cabrera-Ziri et al. (2019) Cabrera-Ziri I, Lardo C, Mucciarelli A (2019) Constant light element abundances suggest that the extended P1 in NGC 2808 is not a consequence of CNO-cycle nucleosynthesis. Monthly Notices of the Royal Astronomical Society 485(3):4128–4133, DOI 10.1093/mnras/stz707, 1903.03621
- Caloi and D’Antona (2005) Caloi V, D’Antona F (2005) Helium self-enrichment in globular clusters and the second parameter problem in M 3 and M 13. Astronomy & Astrophysics 435:987–993, DOI 10.1051/0004-6361:20041773, astro-ph/0502195
- Caloi and D’Antona (2007) Caloi V, D’Antona F (2007) NGC 6441: another indication of very high helium content in globular cluster stars. Astronomy & Astrophysics 463:949–955, DOI 10.1051/0004-6361:20066074, astro-ph/0610406
- Carretta et al. (2005) Carretta E, Gratton RG, Lucatello S, Bragaglia A, Bonifacio P (2005) Abundances of C, N, O in slightly evolved stars in the globular clusters NGC 6397, NGC 6752 and 47 Tuc. Astronomy & Astrophysics 433:597–611, DOI 10.1051/0004-6361:20041892, astro-ph/0411241
- Carretta et al. (2009a) Carretta E, Bragaglia A, Gratton R, Lucatello S (2009a) Na-O anticorrelation and HB. VIII. Proton-capture elements and metallicities in 17 globular clusters from UVES spectra. Astronomy & Astrophysics 505:139–155, DOI 10.1051/0004-6361/200912097, 0909.2941
- Carretta et al. (2009b) Carretta E, Bragaglia A, Gratton RG, Lucatello S, Catanzaro G, Leone F, Bellazzini M, Claudi R, D’Orazi V, Momany Y, Ortolani S, Pancino E, Piotto G, Recio-Blanco A, Sabbi E (2009b) Na-O anticorrelation and HB. VII. The chemical composition of first and second-generation stars in 15 globular clusters from GIRAFFE spectra. Astronomy & Astrophysics 505:117–138, DOI 10.1051/0004-6361/200912096, 0909.2938
- Carretta et al. (2011) Carretta E, Bragaglia A, Gratton R, D’Orazi D’Orazi V, Lucatello S (2011) A Strömgren view of the multiple populations in globular clusters. Astronomy & Astrophysics 535:A121, DOI 10.1051/0004-6361/201117180, 1109.3199
- Casagrande and VandenBerg (2014) Casagrande L, VandenBerg DA (2014) Synthetic stellar photometry - I. General considerations and new transformations for broad-band systems. Monthly Notices of the Royal Astronomical Society 444:392–419, DOI 10.1093/mnras/stu1476, 1407.6095
- Cassisi and Salaris (2013) Cassisi S, Salaris M (2013) Old Stellar Populations: How to Study the Fossil Record of Galaxy Formation
- Cassisi and Salaris (2014) Cassisi S, Salaris M (2014) The main sequences of NGC 2808: constraints on the early disc accretion scenario. Astronomy & Astrophysics 563:A10, DOI 10.1051/0004-6361/201323185, 1312.6363
- Cassisi et al. (2002) Cassisi S, Salaris M, Bono G (2002) The Shape of the Red Giant Branch Bump as a Diagnostic of Partial Mixing Processes in Low-Mass Stars. Astrophysical Journal 565(2):1231–1238, DOI 10.1086/324695, astro-ph/0110247
- Cassisi et al. (2008) Cassisi S, Salaris M, Pietrinferni A, Piotto G, Milone AP, Bedin LR, Anderson J (2008) The Double Subgiant Branch of NGC 1851: The Role of the CNO Abundance. Astrophysical Journal Letter 672:L115–L118, DOI 10.1086/527035, 0711.3823
- Cassisi et al. (2013) Cassisi S, Mucciarelli A, Pietrinferni A, Salaris M, Ferguson J (2013) Photometric properties of stellar populations in Galactic globular clusters: the role of the Mg-Al anticorrelation. Astronomy & Astrophysics 554:A19, DOI 10.1051/0004-6361/201321311, 1303.5222
- Cassisi et al. (2017) Cassisi S, Salaris M, Pietrinferni A, Hyder D (2017) On the determination of the He abundance distribution in globular clusters from the width of the main sequence. Monthly Notices of the Royal Astronomical Society 464(2):2341–2348, DOI 10.1093/mnras/stw2579, 1610.01755
- Chantereau et al. (2019) Chantereau W, Salaris M, Bastian N, Martocchia S (2019) Helium enrichment in intermediate-age Magellanic Clouds clusters: towards an ubiquity of multiple stellar populations? Monthly Notices of the Royal Astronomical Society 484(4):5236–5244, DOI 10.1093/mnras/stz378, 1902.01806
- Charbonnel and Lagarde (2010) Charbonnel C, Lagarde N (2010) Thermohaline instability and rotation-induced mixing. I. Low- and intermediate-mass solar metallicity stars up to the end of the AGB. Astronomy & Astrophysics 522:A10, DOI 10.1051/0004-6361/201014432, 1006.5359
- Cohen (1978) Cohen JG (1978) Abundances in globular cluster red giants. I - M3 and M13. Astrophysical Journal 223:487–508, DOI 10.1086/156284
- Dalessandro et al. (2011) Dalessandro E, Salaris M, Ferraro FR, Cassisi S, Lanzoni B, Rood RT, Fusi Pecci F, Sabbi E (2011) The peculiar horizontal branch of NGC 2808. Monthly Notices of the Royal Astronomical Society 410(1):694–704, DOI 10.1111/j.1365-2966.2010.17479.x, 1008.4478
- Dalessandro et al. (2013) Dalessandro E, Salaris M, Ferraro FR, Mucciarelli A, Cassisi S (2013) The horizontal branch in the UV colour-magnitude diagrams - II. The case of M3, M13 and M79. Monthly Notices of the Royal Astronomical Society 430(1):459–471, DOI 10.1093/mnras/sts644, 1212.4419
- Dalessandro et al. (2014) Dalessandro E, Massari D, Bellazzini M, Miocchi P, Mucciarelli A, Salaris M, Cassisi S, Ferraro FR, Lanzoni B (2014) First Evidence of Fully Spatially Mixed First and Second Generations in Globular Clusters: The Case of NGC 6362. Astrophysical Journal Letters 791(1):L4, DOI 10.1088/2041-8205/791/1/L4, 1407.0484
- Dalessandro et al. (2016) Dalessandro E, Lapenna E, Mucciarelli A, Origlia L, Ferraro FR, Lanzoni B (2016) Multiple Populations in the Old and Massive Small Magellanic Cloud Globular Cluster NGC 121. Astrophysical Journal 829(2):77, DOI 10.3847/0004-637X/829/2/77, 1607.05736
- Dalessandro et al. (2018) Dalessandro E, Lardo C, Cadelano M, Saracino S, Bastian N, Mucciarelli A, Salaris M, Stetson P, Pancino E (2018) IC 4499 revised: Spectro-photometric evidence of small light-element variations. Astronomy & Astrophysics 618:A131, DOI 10.1051/0004-6361/201833650, 1807.07618
- D’Antona et al. (2002) D’Antona F, Caloi V, Montalbán J, Ventura P, Gratton R (2002) Helium variation due to self-pollution among Globular Cluster stars. Consequences on the horizontal branch morphology. Astronomy & Astrophysics 395:69–75, DOI 10.1051/0004-6361:20021220, astro-ph/0209331
- D’Antona et al. (2005) D’Antona F, Bellazzini M, Caloi V, Pecci FF, Galleti S, Rood RT (2005) A Helium Spread among the Main-Sequence Stars in NGC 2808. Astrophysical Journal 631(2):868–878, DOI 10.1086/431968, astro-ph/0505347
- di Criscienzo et al. (2010) di Criscienzo M, Ventura P, D’Antona F, Milone A, Piotto G (2010) The helium spread in the globular cluster 47 Tuc. Monthly Notices of the Royal Astronomical Society 408(2):999–1005, DOI 10.1111/j.1365-2966.2010.17168.x, 1006.2024
- Dotter et al. (2015) Dotter A, Ferguson JW, Conroy C, Milone AP, Marino AF, Yong D (2015) Stellar models of multiple populations in globular clusters - I. The main sequence of NGC 6752. Monthly Notices of the Royal Astronomical Society 446(2):1641–1656, DOI 10.1093/mnras/stu2170, 1410.4570
- Dupree and Avrett (2013) Dupree AK, Avrett EH (2013) Direct Evaluation of the Helium Abundances in Omega Centauri. Astrophysical Journal Letters 773(2):L28, DOI 10.1088/2041-8205/773/2/L28, 1307.5860
- Ferguson et al. (2005) Ferguson JW, Alexander DR, Allard F, Barman T, Bodnarik JG, Hauschildt PH, Heffner-Wong A, Tamanai A (2005) Low-Temperature Opacities. Astrophysical Journal 623(1):585–596, DOI 10.1086/428642, astro-ph/0502045
- Forbes et al. (2018) Forbes DA, Bastian N, Gieles M, Crain RA, Kruijssen JMD, Larsen SS, Ploeckinger S, Agertz O, Trenti M, Ferguson AMN, Pfeffer J, Gnedin OY (2018) Globular cluster formation and evolution in the context of cosmological galaxy assembly: open questions. Proceedings of the Royal Society of London Series A 474:20170616, DOI 10.1098/rspa.2017.0616, 1801.05818
- Gilligan et al. (2019) Gilligan CK, Chaboyer B, Cummings JD, Mackey D, Cohen RE, Geisler D, Grocholski AJ, Parisi MC, Sarajedini A, Ventura P, Villanova S, Yang SC, Wagner-Kaiser R (2019) Exploring the nature and synchronicity of early cluster formation in the Large Magellanic Cloud - IV. Evidence for multiple populations in Hodge 11 and NGC 2210. Monthly Notices of the Royal Astronomical Society 486(4):5581–5599, DOI 10.1093/mnras/stz1174, 1904.01434
- Girardi et al. (2007) Girardi L, Castelli F, Bertelli G, Nasi E (2007) On the effect of helium enhancement on bolometric corrections and Teff-colour relations. Astronomy & Astrophysics 468(2):657–662, DOI 10.1051/0004-6361:20077129, astro-ph/0703094
- Gratton et al. (2019) Gratton R, Bragaglia A, Carretta E, D’Orazi V, Lucatello S, Sollima A (2019) What is a globular cluster? An observational perspective. Astronomy & Astrophysics Reviews 27(1):8, DOI 10.1007/s00159-019-0119-3, 1911.02835
- Gratton et al. (2000) Gratton RG, Sneden C, Carretta E, Bragaglia A (2000) Mixing along the red giant branch in metal-poor field stars. Astronomy & Astrophysics 354:169–187
- Gratton et al. (2012) Gratton RG, Carretta E, Bragaglia A (2012) Multiple populations in globular clusters. Lessons learned from the Milky Way globular clusters. Astronomy & Astrophysics Review 20:50, DOI 10.1007/s00159-012-0050-3, 1201.6526
- Gratton et al. (2013) Gratton RG, Lucatello S, Sollima A, Carretta E, Bragaglia A, Momany Y, D’Orazi V, Cassisi S, Pietrinferni A, Salaris M (2013) The Na-O anticorrelation in horizontal branch stars. III. 47 Tucanae and M 5. Astronomy & Astrophysics 549:A41, DOI 10.1051/0004-6361/201219976, 1210.4069
- Grundahl et al. (2002) Grundahl F, Briley M, Nissen PE, Feltzing S (2002) Abundances of RGB stars in NGC 6752. Astronomy & Astrophysics 385:L14–L17, DOI 10.1051/0004-6361:20020264
- Hollyhead et al. (2019) Hollyhead K, Martocchia S, Lardo C, Bastian N, Kacharov N, Niederhofer F, Cabrera-Ziri I, Dalessandro E, Mucciarelli A, Salaris M, Usher C (2019) Spectroscopic detection of multiple populations in the 2 Gyr old cluster Hodge 6 in the LMC. Monthly Notices of the Royal Astronomical Society 484:4718–4725, DOI 10.1093/mnras/stz317, 1902.02297
- Iglesias and Rogers (1996) Iglesias CA, Rogers FJ (1996) Updated Opal Opacities. Astrophysical Journal 464:943, DOI 10.1086/177381
- Johnson and Pilachowski (2010) Johnson CI, Pilachowski CA (2010) Chemical Abundances for 855 Giants in the Globular Cluster Omega Centauri (NGC 5139). Astrophysical Journal 722:1373–1410, DOI 10.1088/0004-637X/722/2/1373, 1008.2232
- Kamann et al. (2020) Kamann S, Giesers B, Bastian N, Brinchmann J, Dreizler S, Göttgens F, Husser TO, Latour M, Weilbacher PM, Wisotzki L (2020) The binary content of multiple populations in NGC 3201. Astronomy & Astrophysics 635:A65, DOI 10.1051/0004-6361/201936843, 1912.01627
- King et al. (2012) King IR, Bedin LR, Cassisi S, Milone AP, Bellini A, Piotto G, Anderson J, Pietrinferni A, Cordier D (2012) Hubble Space Telescope Observations of an Outer Field in Omega Centauri: A Definitive Helium Abundance. Astronomical Journal 144:5, DOI 10.1088/0004-6256/144/1/5, 1205.3760
- Krishna Swamy (1966) Krishna Swamy KS (1966) Profiles of Strong Lines in K-Dwarfs. Astrophysical Journal 145:174, DOI 10.1086/148752
- Kruijssen (2015) Kruijssen JMD (2015) Globular clusters as the relics of regular star formation in ‘normal’ high-redshift galaxies. Monthly Notices of the Royal Astronomical Society 454(2):1658–1686, DOI 10.1093/mnras/stv2026, 1509.02163
- Lagioia et al. (2018) Lagioia EP, Milone AP, Marino AF, Cassisi S, Aparicio AJ, Piotto G, Anderson J, Barbuy B, Bedin LR, Bellini A, Brown T, D’Antona F, Nardiello D, Ortolani S, Pietrinferni A, Renzini A, Salaris M, Sarajedini A, van der Marel R, Vesperini E (2018) The Hubble Space Telescope UV Legacy Survey of Galactic Globular Clusters - XII. The RGB bumps of multiple stellar populations. Monthly Notices of the Royal Astronomical Society 475(3):4088–4103, DOI 10.1093/mnras/sty083, 1801.03395
- Lagioia et al. (2019a) Lagioia EP, Milone AP, Marino AF, Cordoni G, Tailo M (2019a) The Role of Cluster Mass in the Multiple Populations of Galactic and Extragalactic Globular Clusters. Astronomical Journal 158(5):202, DOI 10.3847/1538-3881/ab45f2, 1909.08439
- Lagioia et al. (2019b) Lagioia EP, Milone AP, Marino AF, Dotter A (2019b) Helium Variation in Four Small Magellanic Cloud Globular Clusters. Astrophysical Journal 871(2):140, DOI 10.3847/1538-4357/aaf729
- Lardo et al. (2018) Lardo C, Salaris M, Bastian N, Mucciarelli A, Dalessandro E, Cabrera-Ziri I (2018) Chemical inhomogeneities amongst first population stars in globular clusters. Evidence for He variations. Astronomy & Astrophysics 616:A168, DOI 10.1051/0004-6361/201832999, 1805.09599
- Larsen et al. (2014) Larsen SS, Brodie JP, Grundahl F, Strader J (2014) Nitrogen Abundances and Multiple Stellar Populations in the Globular Clusters of the Fornax dSph. Astrophysical Journal 797:15, DOI 10.1088/0004-637X/797/1/15, 1409.0541
- Larsen et al. (2019) Larsen SS, Baumgardt H, Bastian N, Hernandez S, Brodie J (2019) Hubble Space Telescope photometry of multiple stellar populations in the inner parts of NGC 2419. Astronomy & Astrophysics 624:A25, DOI 10.1051/0004-6361/201834494, 1902.01416
- Lattanzio et al. (2015) Lattanzio JC, Siess L, Church RP, Angelou G, Stancliffe RJ, Doherty CL, Stephen T, Campbell SW (2015) On the numerical treatment and dependence of thermohaline mixing in red giants. Monthly Notices of the Royal Astronomical Society 446(3):2673–2688, DOI 10.1093/mnras/stu2238, 1410.6517
- Lee (2017) Lee JW (2017) Multiple Stellar Populations of Globular Clusters from Homogeneous Ca-CN Photometry. II. M5 (NGC 5904) and a New Filter System. Astrophysical Journal 844(1):77, DOI 10.3847/1538-4357/aa7b8c, 1706.07969
- Lee et al. (2005) Lee YW, Joo SJ, Han SI, Chung C, Ree CH, Sohn YJ, Kim YC, Yoon SJ, Yi SK, Demarque P (2005) Super-Helium-rich Populations and the Origin of Extreme Horizontal-Branch Stars in Globular Clusters. Astrophysical Journal Letter 621(1):L57–L60, DOI 10.1086/428944, astro-ph/0501500
- Madau and Dickinson (2014) Madau P, Dickinson M (2014) Cosmic Star-Formation History. Annual Review of Astronomy and Astrophysics 52:415–486, DOI 10.1146/annurev-astro-081811-125615, 1403.0007
- Magic et al. (2015) Magic Z, Weiss A, Asplund M (2015) The Stagger-grid: A grid of 3D stellar atmosphere models. III. The relation to mixing length convection theory. Astronomy & Astrophysics 573:A89, DOI 10.1051/0004-6361/201423760, 1403.1062
- Marino et al. (2008) Marino AF, Villanova S, Piotto G, Milone AP, Momany Y, Bedin LR, Medling AM (2008) Spectroscopic and photometric evidence of two stellar populations in the Galactic globular cluster NGC 6121 (M 4). Astronomy & Astrophysics 490:625–640, DOI 10.1051/0004-6361:200810389, 0808.1414
- Marino et al. (2011) Marino AF, Milone AP, Piotto G, Villanova S, Gratton R, D’Antona F, Anderson J, Bedin LR, Bellini A, Cassisi S, Geisler D, Renzini A, Zoccali M (2011) Sodium-Oxygen Anticorrelation and Neutron-capture Elements in Omega Centauri Stellar Populations. Astrophysical Journal 731:64, DOI 10.1088/0004-637X/731/1/64, 1102.1653
- Marino et al. (2012a) Marino AF, Milone AP, Piotto G, Cassisi S, D’Antona F, Anderson J, Aparicio A, Bedin LR, Renzini A, Villanova S (2012a) The C+N+O Abundance of Centauri Giant Stars: Implications for the Chemical-enrichment Scenario and the Relative Ages of Different Stellar Populations. Astrophysical Journal 746(1):14, DOI 10.1088/0004-637X/746/1/14, 1111.1891
- Marino et al. (2012b) Marino AF, Milone AP, Sneden C, Bergemann M, Kraft RP, Wallerstein G, Cassisi S, Aparicio A, Asplund M, Bedin RL, Hilker M, Lind K, Momany Y, Piotto G, Roederer IU, Stetson PB, Zoccali M (2012b) The double sub-giant branch of NGC 6656 (M 22): a chemical characterization. Astronomy & Astrophysics 541:A15, DOI 10.1051/0004-6361/201118381, 1202.2825
- Marino et al. (2014) Marino AF, Milone AP, Przybilla N, Bergemann M, Lind K, Asplund M, Cassisi S, Catelan M, Casagrande L, Valcarce AAR, Bedin LR, Cortés C, D’Antona F, Jerjen H, Piotto G, Schlesinger K, Zoccali M, Angeloni R (2014) Helium enhanced stars and multiple populations along the horizontal branch of NGC 2808: direct spectroscopic measurements. Monthly Notices of the Royal Astronomical Society 437(2):1609–1627, DOI 10.1093/mnras/stt1993, 1310.4527
- Marino et al. (2019) Marino AF, Milone AP, Sills A, Yong D, Renzini A, Bedin LR, Cordoni G, D’Antona F, Jerjen H, Karakas A, Lagioia E, Piotto G, Tailo M (2019) Chemical Abundances along the 1G Sequence of the Chromosome Maps: The Globular Cluster NGC 3201. Astrophysical Journal 887(1):91, DOI 10.3847/1538-4357/ab53d9, 1910.02892
- Martins et al. (2020) Martins F, Morin J, Charbonnel C, Lardo C, Chantereau W (2020) Impact of a companion and of chromospheric emission on the shape of chromosome maps for globular clusters. Astronomy & Astrophysics 635:A52, DOI 10.1051/0004-6361/201937212, 2001.07581
- Martocchia et al. (2017) Martocchia S, Bastian N, Usher C, Kozhurina-Platais V, Niederhofer F, Cabrera-Ziri I, Dalessandro E, Hollyhead K, Kacharov N, Lardo C, Larsen S, Mucciarelli A, Platais I, Salaris M, Cordero M, Geisler D, Hilker M, Li C, Mackey D (2017) The search for multiple populations in Magellanic Cloud Clusters - III. No evidence for multiple populations in the SMC cluster NGC 419. Monthly Notices of the Royal Astronomical Society 468(3):3150–3158, DOI 10.1093/mnras/stx660, 1703.04631
- Martocchia et al. (2018a) Martocchia S, Cabrera-Ziri I, Lardo C, Dalessandro E, Bastian N, Kozhurina-Platais V, Usher C, Niederhofer F, Cordero M, Geisler D, Hollyhead K, Kacharov N, Larsen S, Li C, Mackey D, Hilker M, Mucciarelli A, Platais I, Salaris M (2018a) Age as a major factor in the onset of multiple populations in stellar clusters. Monthly Notices of the Royal Astronomical Society 473:2688–2700, DOI 10.1093/mnras/stx2556, 1710.00831
- Martocchia et al. (2018b) Martocchia S, Niederhofer F, Dalessandro E, Bastian N, Kacharov N, Usher C, Cabrera-Ziri I, Lardo C, Cassisi S, Geisler D, Hilker M, Hollyhead K, Kozhurina-Platais V, Larsen S, Mackey D, Mucciarelli A, Platais I, Salaris M (2018b) The search for multiple populations in Magellanic Cloud clusters - IV. Coeval multiple stellar populations in the young star cluster NGC 1978. Monthly Notices of the Royal Astronomical Society 477(4):4696–4705, DOI 10.1093/mnras/sty916, 1804.04141
- Martocchia et al. (2019) Martocchia S, Dalessandro E, Lardo C, Cabrera-Ziri I, Bastian N, Kozhurina-Platais V, Salaris M, Chantereau W, Geisler D, Hilker M, Kacharov N, Larsen S, Mucciarelli A, Niederhofer F, Platais I, Usher C (2019) The search for multiple populations in Magellanic Clouds clusters - V. Correlation between cluster age and abundance spreads. Monthly Notices of the Royal Astronomical Society DOI 10.1093/mnras/stz1596, 1906.03273
- Milone et al. (2012a) Milone AP, Marino AF, Cassisi S, Piotto G, Bedin LR, Anderson J, Allard F, Aparicio A, Bellini A, Buonanno R, Monelli M, Pietrinferni A (2012a) The Infrared Eye of the Wide-Field Camera 3 on the Hubble Space Telescope Reveals Multiple Main Sequences of Very Low Mass Stars in NGC 2808. Astrophysical Journal 754:L34, DOI 10.1088/2041-8205/754/2/L34, 1206.5529
- Milone et al. (2012b) Milone AP, Piotto G, Bedin LR, Cassisi S, Anderson J, Marino AF, Pietrinferni A, Aparicio A (2012b) Luminosity and mass functions of the three main sequences of the globular cluster NGC 2808. Astronomy & Astrophysics 537:A77, DOI 10.1051/0004-6361/201116539, 1108.2391
- Milone et al. (2012c) Milone AP, Piotto G, Bedin LR, King IR, Anderson J, Marino AF, Bellini A, Gratton R, Renzini A, Stetson PB, Cassisi S, Aparicio A, Bragaglia A, Carretta E, D’Antona F, Di Criscienzo M, Lucatello S, Monelli M, Pietrinferni A (2012c) Multiple Stellar Populations in 47 Tucanae. Astrophysical Journal 744:58, DOI 10.1088/0004-637X/744/1/58, 1109.0900
- Milone et al. (2014) Milone AP, Marino AF, Bedin LR, Piotto G, Cassisi S, Dieball A, Anderson J, Jerjen H, Asplund M, Bellini A, Brogaard K, Dotter A, Giersz M, Heggie DC, Knigge C, Rich RM, van den Berg M, Buonanno R (2014) The M 4 Core Project with HST - II. Multiple stellar populations at the bottom of the main sequence. Monthly Notices of the Royal Astronomical Society 439(2):1588–1595, DOI 10.1093/mnras/stu030, 1401.1091
- Milone et al. (2015) Milone AP, Marino AF, Piotto G, Renzini A, Bedin LR, Anderson J, Cassisi S, D’Antona F, Bellini A, Jerjen H, Pietrinferni A, Ventura P (2015) The Hubble Space Telescope UV Legacy Survey of Galactic Globular Clusters. III. A Quintuple Stellar Population in NGC 2808. Astrophysical Journal 808(1):51, DOI 10.1088/0004-637X/808/1/51, 1505.05934
- Milone et al. (2017a) Milone AP, Marino AF, Bedin LR, Anderson J, Apai D, Bellini A, Bergeron P, Burgasser AJ, Dotter A, Rees JM (2017a) The HST large programme on Centauri - I. Multiple stellar populations at the bottom of the main sequence probed in NIR-Optical. Monthly Notices of the Royal Astronomical Society 469(1):800–812, DOI 10.1093/mnras/stx836, 1704.00418
- Milone et al. (2017b) Milone AP, Piotto G, Renzini A, Marino AF, Bedin LR, Vesperini E, D’Antona F, Nardiello D, Anderson J, King IR, Yong D, Bellini A, Aparicio A, Barbuy B, Brown TM, Cassisi S, Ortolani S, Salaris M, Sarajedini A, van der Marel RP (2017b) The Hubble Space Telescope UV Legacy Survey of Galactic globular clusters - IX. The Atlas of multiple stellar populations. Monthly Notices of the Royal Astronomical Society 464:3636–3656, DOI 10.1093/mnras/stw2531, 1610.00451
- Milone et al. (2018) Milone AP, Marino AF, Renzini A, D’Antona F, Anderson J, Barbuy B, Bedin LR, Bellini A, Brown TM, Cassisi S, Cordoni G, Lagioia EP, Nardiello D, Ortolani S, Piotto G, Sarajedini A, Tailo M, van der Marel RP, Vesperini E (2018) The Hubble Space Telescope UV legacy survey of galactic globular clusters - XVI. The helium abundance of multiple populations. Monthly Notices of the Royal Astronomical Society 481:5098–5122, DOI 10.1093/mnras/sty2573, 1809.05006
- Monelli et al. (2013) Monelli M, Milone AP, Stetson PB, Marino AF, Cassisi S, del Pino Molina A, Salaris M, Aparicio A, Asplund M, Grundahl F, Piotto G, Weiss A, Carrera R, Cebrián M, Murabito S, Pietrinferni A, Sbordone L (2013) The SUMO project I. A survey of multiple populations in globular clusters. Monthly Notices of the Royal Astronomical Society 431:2126–2149, DOI 10.1093/Monthly Notices of the Royal Astronomical Society/stt273, 1303.5187
- Mucciarelli et al. (2009) Mucciarelli A, Origlia L, Ferraro FR, Pancino E (2009) Looking Outside the Galaxy: The Discovery of Chemical Anomalies in Three Old Large Magellanic Cloud Clusters. Astrophysical Journal Letters 695(2):L134–L139, DOI 10.1088/0004-637X/695/2/L134, 0902.4778
- Mucciarelli et al. (2014) Mucciarelli A, Lovisi L, Lanzoni B, Ferraro FR (2014) The Helium Abundance in the Metal-poor Globular Clusters M30 and NGC 6397. Astrophysical Journal 786(1):14, DOI 10.1088/0004-637X/786/1/14, 1403.0595
- Mucciarelli et al. (2015) Mucciarelli A, Lapenna E, Massari D, Ferraro FR, Lanzoni B (2015) The Origin of the Spurious Iron Spread in the Globular Cluster NGC 3201. Astrophysical Journal 801(1):69, DOI 10.1088/0004-637X/801/1/69, 1501.01968
- Mucciarelli et al. (2016) Mucciarelli A, Dalessandro E, Massari D, Bellazzini M, Ferraro FR, Lanzoni B, Lardo C, Salaris M, Cassisi S (2016) NGC 6362: The Least Massive Globular Cluster with Chemically Distinct Multiple Populations. Astrophysical Journal 824(2):73, DOI 10.3847/0004-637X/824/2/73, 1604.04151
- Nardiello et al. (2015) Nardiello D, Piotto G, Milone AP, Marino AF, Bedin LR, Anderson J, Aparicio A, Bellini A, Cassisi S, D’Antona F, Hidalgo S, Ortolani S, Pietrinferni A, Renzini A, Salaris M, Marel RPvd, Vesperini E (2015) The Hubble Space Telescope UV Legacy Survey of Galactic Globular Clusters - IV. Helium content and relative age of multiple stellar populations within NGC 6352. Monthly Notices of the Royal Astronomical Society 451(1):312–322, DOI 10.1093/mnras/stv971, 1504.07876
- Nardiello et al. (2019) Nardiello D, Piotto G, Milone AP, Rich RM, Cassisi S, Bedin LR, Bellini A, Renzini A (2019) Hubble Space Telescope analysis of stellar populations within the globular cluster G1 (Mayall II) in M 31. Monthly Notices of the Royal Astronomical Society 485:3076–3087, DOI 10.1093/mnras/stz629, 1903.00488
- Nataf et al. (2011a) Nataf DM, Gould A, Pinsonneault MH, Stetson PB (2011a) The Gradients in the 47 Tuc Red Giant Branch Bump and Horizontal Branch are Consistent with a Centrally Concentrated, Helium-enriched Second Stellar Generation. Astrophysical Journal 736(2):94, DOI 10.1088/0004-637X/736/2/94, 1102.3916
- Nataf et al. (2011b) Nataf DM, Udalski A, Gould A, Pinsonneault MH (2011b) OGLE-III Detection of the Anomalous Galactic Bulge Red Giant Branch Bump: Evidence of Enhanced Helium Enrichment. Astrophysical Journal 730:118, DOI 10.1088/0004-637X/730/2/118, 1011.4293
- Niederhofer et al. (2017) Niederhofer F, Bastian N, Kozhurina-Platais V, Larsen S, Salaris M, Dalessandro E, Mucciarelli A, Cabrera-Ziri I, Cordero M, Geisler D, Hilker M, Hollyhead K, Kacharov N, Lardo C, Li C, Mackey D, Platais I (2017) The search for multiple populations in Magellanic Cloud clusters - I. Two stellar populations in the Small Magellanic Cloud globular cluster NGC 121. Monthly Notices of the Royal Astronomical Society 464(1):94–103, DOI 10.1093/mnras/stw2269, 1609.01595
- Origlia et al. (2013) Origlia L, Massari D, Rich RM, Mucciarelli A, Ferraro FR, Dalessandro E, Lanzoni B (2013) The Terzan 5 Puzzle: Discovery of a Third, Metal-poor Component. Astrophysical Journal Letter 779:L5, DOI 10.1088/2041-8205/779/1/L5, 1311.1706
- Pasquini et al. (2011) Pasquini L, Mauas P, Käufl HU, Cacciari C (2011) Measuring helium abundance difference in giants of NGC 2808. Astronomy & Astrophysics 531:A35, DOI 10.1051/0004-6361/201116592, 1105.0346
- Pietrinferni et al. (2004) Pietrinferni A, Cassisi S, Salaris M, Castelli F (2004) A Large Stellar Evolution Database for Population Synthesis Studies. I. Scaled Solar Models and Isochrones. Astrophysical Journal 612(1):168–190, DOI 10.1086/422498, astro-ph/0405193
- Pietrinferni et al. (2006) Pietrinferni A, Cassisi S, Salaris M, Castelli F (2006) A Large Stellar Evolution Database for Population Synthesis Studies. II. Stellar Models and Isochrones for an -enhanced Metal Distribution. Astrophysical Journal 642:797–812, DOI 10.1086/501344, astro-ph/0603721
- Pietrinferni et al. (2009) Pietrinferni A, Cassisi S, Salaris M, Percival S, Ferguson JW (2009) A Large Stellar Evolution Database for Population Synthesis Studies. V. Stellar Models and Isochrones with CNONa Abundance Anticorrelations. Astrophysical Journal 697:275–282, DOI 10.1088/0004-637X/697/1/275, 0903.0825
- Piotto et al. (2005) Piotto G, Villanova S, Bedin LR, Gratton R, Cassisi S, Momany Y, Recio-Blanco A, Lucatello S, Anderson J, King IR, Pietrinferni A, Carraro G (2005) Metallicities on the Double Main Sequence of Centauri Imply Large Helium Enhancement. Astrophysical Journal 621:777–784, DOI 10.1086/427796, astro-ph/0412016
- Piotto et al. (2007) Piotto G, Bedin LR, Anderson J, King IR, Cassisi S, Milone AP, Villanova S, Pietrinferni A, Renzini A (2007) A Triple Main Sequence in the Globular Cluster NGC 2808. Astrophysical Journal Letter 661:L53–L56, DOI 10.1086/518503, astro-ph/0703767
- Piotto et al. (2013) Piotto G, Milone AP, Marino AF, Bedin LR, Anderson J, Jerjen H, Bellini A, Cassisi S (2013) Multi-wavelength Hubble Space Telescope Photometry of Stellar Populations in NGC 288. Astrophysical Journal 775(1):15, DOI 10.1088/0004-637X/775/1/15, 1306.5795
- Piotto et al. (2015) Piotto G, Milone AP, Bedin LR, Anderson J, King IR, Marino AF, Nardiello D, Aparicio A, Barbuy B, Bellini A, Brown TM, Cassisi S, Cool AM, Cunial A, Dalessandro E, D’Antona F, Ferraro FR, Hidalgo S, Lanzoni B, Monelli M, Ortolani S, Renzini A, Salaris M, Sarajedini A, van der Marel RP, Vesperini E, Zoccali M (2015) The Hubble Space Telescope UV Legacy Survey of Galactic Globular Clusters. I. Overview of the Project and Detection of Multiple Stellar Populations. Astronomical Journal 149(3):91, DOI 10.1088/0004-6256/149/3/91, 1410.4564
- Renzini et al. (2015) Renzini A, D’Antona F, Cassisi S, King IR, Milone AP, Ventura P, Anderson J, Bedin LR, Bellini A, Brown TM, Piotto G, van der Marel RP, Barbuy B, Dalessandro E, Hidalgo S, Marino AF, Ortolani S, Salaris M, Sarajedini A (2015) The Hubble Space TelescopeUV Legacy Survey of Galactic Globular Clusters - V. Constraints on formation scenarios. Monthly Notices of the Royal Astronomical Society 454:4197–4207, DOI 10.1093/mnras/stv2268, 1510.01468
- Salaris and Cassisi (2008) Salaris M, Cassisi S (2008) Stellar models with the ML2 theory of convection. Astronomy & Astrophysics 487:1075–1080, DOI 10.1051/0004-6361:200810253, 0807.0863
- Salaris and Cassisi (2014) Salaris M, Cassisi S (2014) Lithium and oxygen in globular cluster dwarfs and the early disc accretion scenario. Astronomy & Astrophysics 566:A109, DOI 10.1051/0004-6361/201423722, 1404.6123
- Salaris and Weiss (2002) Salaris M, Weiss A (2002) Homogeneous age dating of 55 Galactic globular clusters. Clues to the Galaxy formation mechanisms. Astronomy & Astrophysics 388:492–503, DOI 10.1051/0004-6361:20020554, astro-ph/0204410
- Salaris et al. (1993) Salaris M, Chieffi A, Straniero O (1993) The alpha -enhanced Isochrones and Their Impact on the FITS to the Galactic Globular Cluster System. Astrophysical Journal 414:580, DOI 10.1086/173105
- Salaris et al. (2006) Salaris M, Weiss A, Ferguson JW, Fusilier DJ (2006) On the Primordial Scenario for Abundance Variations within Globular Clusters: The Isochrone Test. Astrophysical Journal 645:1131–1137, DOI 10.1086/504520, astro-ph/0604137
- Salaris et al. (2008) Salaris M, Cassisi S, Pietrinferni A (2008) The Horizontal Branch of NGC 1851: Constraints on the Cluster Subpopulations. Astrophysical Journal Letter 678:L25–L28, DOI 10.1086/588467, 0803.3546
- Salaris et al. (2015) Salaris M, Pietrinferni A, Piersimoni AM, Cassisi S (2015) Post first dredge-up [C/N] ratio as age indicator. Theoretical calibration. Astronomy & Astrophysics 583:A87, DOI 10.1051/0004-6361/201526951, 1509.06904
- Salaris et al. (2016) Salaris M, Cassisi S, Pietrinferni A (2016) On the red giant branch mass loss in 47 Tucanae: Constraints from the horizontal branch morphology. Astronomy & Astrophysics 590:A64, DOI 10.1051/0004-6361/201628181, 1604.02874
- Salaris et al. (2018) Salaris M, Cassisi S, Schiavon RP, Pietrinferni A (2018) Effective temperatures of red giants in the APOKASC catalogue and the mixing length calibration in stellar models. Astronomy & Astrophysics 612:A68, DOI 10.1051/0004-6361/201732340, 1801.09441
- Salaris et al. (2019) Salaris M, Cassisi S, Mucciarelli A, Nardiello D (2019) Detection of multiple stellar populations in extragalactic massive clusters with JWST. Astronomy & Astrophysics 629:A40, DOI 10.1051/0004-6361/201936252, 1908.02229
- Salaris et al. (2020) Salaris M, Usher C, Martocchia S, Dalessandro E, Bastian N, Saracino S, Cassisi S, Cabrera-Ziri I, Lardo C (2020) Photometric characterization of multiple populations in star clusters: the impact of the first dredge-up. Monthly Notices of the Royal Astronomical Society 492(3):3459–3464, DOI 10.1093/mnras/staa089, 2001.04145
- Saracino et al. (2019) Saracino S, Bastian N, Kozhurina-Platais V, Cabrera-Ziri I, Dalessandro E, Kacharov N, Lardo C, Larsen SS, Mucciarelli A, Platais I, Salaris M (2019) An extragalactic chromosome map: the intermediate-age SMC cluster Lindsay 1. Monthly Notices of the Royal Astronomical Society 489(1):L97–L101, DOI 10.1093/mnrasl/slz135, 1909.02138
- Saracino et al. (2020) Saracino S, Martocchia S, Bastian N, Kozhurina-Platais V, Chantereau W, Salaris M, Cabrera-Ziri I, Dalessandro E, Kacharov N, Lardo C, Larsen SS, Platais I (2020) Chromosome maps of young LMC clusters: an additional case of coeval multiple populations. Monthly Notices of the Royal Astronomical Society 493(4):6060–6070, DOI 10.1093/mnras/staa644, 2003.01780
- Sbordone et al. (2011) Sbordone L, Salaris M, Weiss A, Cassisi S (2011) Photometric signatures of multiple stellar populations in Galactic globular clusters. Astronomy & Astrophysics 534:A9, DOI 10.1051/0004-6361/201116714, 1103.5863
- Schiavon et al. (2013) Schiavon RP, Caldwell N, Conroy C, Graves GJ, Strader J, MacArthur LA, Courteau S, Harding P (2013) Star Clusters in M31. V. Evidence for Self-enrichment in Old M31 Clusters from Integrated Spectroscopy. Astrophysical Journal Letters 776(1):L7, DOI 10.1088/2041-8205/776/1/L7, 1308.6590
- Tailo et al. (2017) Tailo M, D’Antona F, Milone AP, Bellini A, Ventura P, Di Criscienzo M, Cassisi S, Piotto G, Salaris M, Brown TM, Vesperini E, Bedin LR, Marino AF, Nardiello D, Anderson J (2017) The Hubble Space Telescope UV Legacy Survey of Galactic globular clusters - XI. The horizontal branch in NGC 6388 and NGC 6441. Monthly Notices of the Royal Astronomical Society 465(1):1046–1056, DOI 10.1093/mnras/stw2790, 1610.08264
- Thomas (1967) Thomas HC (1967) Sternentwicklung VIII. Der Helium-Flash bei einem Stern von 1. 3 Sonnenmassen. Zeitschrift für Astrophysik 67:420
- Trampedach et al. (2014) Trampedach R, Stein RF, Christensen-Dalsgaard J, Nordlund Å, Asplund M (2014) Improvements to stellar structure models, based on a grid of 3D convection simulations - II. Calibrating the mixing-length formulation. Monthly Notices of the Royal Astronomical Society 445(4):4366–4384, DOI 10.1093/mnras/stu2084, 1410.1559
- VandenBerg et al. (2008) VandenBerg DA, Edvardsson B, Eriksson K, Gustafsson B (2008) On the Use of Blanketed Atmospheres as Boundary Conditions for Stellar Evolutionary Models. Astrophysical Journal 675:746-763, DOI 10.1086/521600, 0708.1188
- VandenBerg et al. (2012) VandenBerg DA, Bergbusch PA, Dotter A, Ferguson JW, Michaud G, Richer J, Proffitt CR (2012) Models for Metal-poor Stars with Enhanced Abundances of C, N, O, Ne, Na, Mg, Si, S, Ca, and Ti, in Turn, at Constant Helium and Iron Abundances. Astrophysical Journal 755:15, DOI 10.1088/0004-637X/755/1/15, 1206.1820
- Ventura et al. (2009) Ventura P, Caloi V, D’Antona F, Ferguson J, Milone A, Piotto GP (2009) The C+N+O abundances and the splitting of the subgiant branch in the globular cluster NGC 1851. Monthly Notices of the Royal Astronomical Society 399:934–943, DOI 10.1111/j.1365-2966.2009.15335.x, 0907.1765
- Villanova et al. (2010) Villanova S, Geisler D, Piotto G (2010) Detailed Abundances of Red Giants in the Globular Cluster NGC 1851: C+N+O and the Origin of Multiple Populations. Astrophysical Journal Letter 722:L18–L22, DOI 10.1088/2041-8205/722/1/L18, 1008.4372
- Villanova et al. (2012) Villanova S, Geisler D, Piotto G, Gratton RG (2012) The Helium Content of Globular Clusters: NGC 6121 (M4). Astrophysical Journal 748(1):62, DOI 10.1088/0004-637X/748/1/62, 1201.3241
- Worthey and Lee (2011) Worthey G, Lee Hc (2011) An Empirical UBV RI JHK Color-Temperature Calibration for Stars. Astrophysical Journal Supplement Series 193:1, DOI 10.1088/0067-0049/193/1/1, astro-ph/0604590
- Yong et al. (2008) Yong D, Grundahl F, Johnson JA, Asplund M (2008) Nitrogen Abundances in Giant Stars of the Globular Cluster NGC 6752. Astrophysical Journal 684:1159–1169, DOI 10.1086/590658, 0806.0187
- Yong et al. (2009) Yong D, Grundahl F, D’Antona F, Karakas AI, Lattanzio JC, Norris JE (2009) A Large C+N+O Abundance Spread in Giant Stars of the Globular Cluster NGC 1851. Astrophysical Journal Letters 695(1):L62–L66, DOI 10.1088/0004-637X/695/1/L62, 0902.1773
- Zennaro et al. (2019) Zennaro M, Milone AP, Marino AF, Cordoni G, Lagioia EP, Tailo M (2019) Four stellar populations and extreme helium variation in the massive outer-halo globular cluster NGC 2419. Monthly Notices of the Royal Astronomical Society 487(3):3239–3251, DOI 10.1093/mnras/stz1477, 1902.02178