Optical spectroscopy of BL Lac objects: TeV candidates
Abstract
We investigate the spectroscopic optical properties of gamma-ray sources detected with high significance above 50 GeV in the Third Catalog of Hard Fermi-LAT Sources (3FHL) and that are good candidates as TeV emitters. We focus on the 91 sources that are labelled by the Fermi team as BL Lac objects (BLL) or Blazar candidates of uncertain type (BCU) , that are in the Northern hemisphere, and are with unknown or uncertain redshift. We report here on GTC spectra (in the spectral range 4100 - 7750 Å) of 13 BCU and 42 BLL. We are able to classify the observed targets as BLL and each source is briefly discussed. The spectra allowed us to determine the redshift of 25 objects on the basis of emission and/or absorption lines, finding 0.05 z 0.91. Most of the emission lines detected are due to forbidden transition of [O III] and [N II]. The observed line luminosity is found lower than that of QSOs at similar continuum and could be reconciled with the line-continuum luminosity relationship of QSOs if a significant beaming factor is assumed. Moreover for 5 sources we found intervening absorption lines that allows to set a spectroscopic lower limit of the redshift. For the remaining 25 sources, for which the spectra are lineless, a lower limit to z is given, assuming that the host galaxies are giant ellipticals.
keywords:
galaxies: active and redshifts — BL Lacertae objects: general — gamma-rays: galaxies1 Introduction
BL Lac objects (BLL) are active galactic nuclei, whose emission is dominated by non-thermal radiation from a relativistically beamed jet aligned with the line of sight. The emission, of synchrotron-inverse Compton origin, extends over the whole electromagnetic spectrum, from radio to gamma-ray. Distinctive characteristics of the class are the large and rapid flux variability, high polarization, and the absence or weakness of spectral lines, washed out by the emission from the jet, that in most cases makes very arduous the determination of the their distance.
Data-sets of BLL have been produced through a number of dedicated surveys in all spectral bands, originally in the radio (Stickel, et al., 1991; Giommi, et al., 2002; Marchã & Caccianiga, 2013), and X-rays (Stocke, et al., 1990; Perlman, et al., 1996, 1998; Laurent-Muehleisen, et al., 1998, 1999; Voges, et al., 1999; Cusumano, et al., 2010), then in the optical and infrared (e.g. Scarpa, et al., 2000a; Scarpa, et al., 2000b; Urry, et al., 2000; Falomo, et al., 2000; Plotkin, et al., 2010; D’Abrusco, et al., 2014, 2019), and more recently also in the gamma-ray band (Abdollahi, et al., 2020, and references in therein). The latter surveys indeed showed that BLL represent the dominant extragalactic population of gamma sources (The Fermi-LAT collaboration, 2019). Thanks to its systematic monitoring of the whole sky, and the long duration of the mission, the Fermi catalogues of -ray sources have become a privileged means for discovering new BLL. The procedure of identification of the counterpart of the gamma-ray emitter generally goes through the search of X-ray and radio sources in the gamma-ray error box (e.g. Stephen, et al., 2010; Takeuchi, et al., 2013; Landi, et al., 2015; Paiano, et al., 2017). The BLL nature of the target can be guessed because of the broad spectral energy distribution (SED), which in BLL is well characterized by two broad humps, one due to synchrotron radiation (IR-optical), and one to inverse Compton (X-ray- Gamma rays). (see e.g. Maraschi, et al., 1992; Ghisellini & Tavecchio, 2009; Ghisellini, et al., 2017; Madejski & Sikora, 2016). However, the secure classification derives generally from optical spectroscopy. The identification of weak spectral lines is the basic tool for obtaining first of all a firm classification and the distance of the source, but also for constraining some physical parameters of the emission region. If no intrinsic lines are observed, there are indirect procedures based on some hypothesis on the nature of the host galaxy, which can effectively produce lower limit to the redshift of the source (e.g. Sbarufatti, et al., 2006a; Sbarufatti, et al., 2006b; Meisner & Romani, 2010; Falomo, Pian & Treves, 2014, see also Section 4 of this paper). In some cases the optical spectra can exhibit absorption lines due to intervening medium, from which a spectroscopic lower limit to z can be derived.
The knowledge of the distance is a basic ingredient for modeling the BLLs, for constructing the luminosity function of this class of blazars, to assess the cosmic evolution, and to evaluate the contribution of the BLL population to the gamma-ray cosmic background. Because the overall spectrum may extend to the TeV domain, BLL of known redshift are unique probes of the extragalactic background light (EBL), since at z 1 the absorption effects due to pair production become important (Franceschini, et al., 2017). Some BLL are also supposedly ultrahigh energy (PeV) neutrino emitters (Ahlers & Halzen, 2015; Padovani, et al., 2016; Righi, et al., 2019), and again the distance knowledge is a crucial information for modeling the neutrino production, and the cosmic neutrino background radiation.
All these arguments explain the major effort for optical spectroscopic studies of BLL candidates. Because of the above mentioned weakness of the lines, it is compulsory to secure spectra with high and adequate signal-to-noise (S/N) ratios, in order to be able to measure these features of very low equivalent widths (EW). This requires the use of telescopes of the 8-10 m class.
For twenty years, we have embarked on a systematic study of BLL, lately focusing on Fermi detections, using the ESO 8 m Very Large Telescope (VLT) and, more recently, the 10 m Gran Telescopio Canarias (GTC). Optical spectra of 250 BLL have been produced, adopting various selection criteria of the sources (Sbarufatti, et al., 2005a, 2006a, 2008, 2009; Landoni, et al., 2012, 2013, 2014, 2015; Paiano, et al., 2016; Falomo, et al., 2017; Paiano et al., 2017a, b, c, 2018; Landoni, et al., 2018; Paiano et al., 2019).
Here we present optical spectroscopy of 55 objects, which exhibit a hard gamma-ray spectrum in the 3FHL catalogue (Ajello, et al., 2017). From these observations, we are able to characterize the optical spectral properties and we determine the redshift in many objects.
In a coordinated paper (Paiano et al, in preparation), we will point out candidates for detection in the TeV range on the basis of the extrapolation to the very high energy ( 100 GeV) of the Fermi spectra accounting for absorption by the EBL. It is expected that 20% of the sources with known redshift considered in this work could be detected with the current Cherenkov telescopes, like MAGIC, and 85% with the future Cherenkov Telescope Array (CTA).
2 The sample
The objects in our sample were extracted from the 3FHL catalog, which contains 1556 objects detected above 10 GeV over 7 years of Fermi operations. We concentrate on 246 TeV candidates111flagged as ”C” in the 3FHL catalog, which are sources revealed with significance3 at energy 50 GeV. They exhibit a hard spectrum, with photon index 2.5 and integrated flux F(10 GeV) 10-11 ph cm-2 s-1. Of these, 224 sources are classified by the Fermi team as BLL and blazar candidates of uncertain type (BCU): 180 and 44 sources respectively. Extensive search in the literature show that 153 of these objects lack a measurement of the redshift or the available value is uncertain. Of these, there are 21 BCU and 70 BLL at -20 and thus well-observable in the Northern hemisphere.
Here we report on extensive optical spectroscopy obtained at the GTC for 42 BLL and 13 BCU (see Table 1 for the properties of our sample).
3 Observations and data reduction
Optical spectra were collected using the spectrograph OSIRIS (Cepa, et al., 2003) of the 10.4 m GTC at the Roque de Los Muchachos (La Palma). We used the grism R1000B covering the spectral range 4100 - 7750 Å, and a slit width = 1.2”.
Data reduction was performed using the IRAF software (Tody, 1986, 1993) and standard procedures for long slit spectroscopy, following the same scheme given in Paiano et al. (2017a, b, 2019). For each source at least three spectra were obtained and combined together to obtain the final spectrum. Cosmic rays were removed using the L.A.Cosmic algorithm (van Dokkum, 2001). The accuracy of the wavelength calibration is 0.1 Å over the whole observed spectral range. The relative flux calibration was performed from the observation of a number of spectro-photometric standard stars secured during each night of the program. Since most of the spectra were obtained during non-photometric nights, we set the absolute calibration from the comparison of the magnitude of the targets, as from the acquisition image in the g band, and that of secondary photometric objects in the field as derived from PanSTARRS or SDSS images. Finally all spectra were dereddened applying the extinction law by Cardelli, Clayton & Mathis (1989) and assuming the value of Galactic extinction E(B-V) derived from the NASA/IPAC Infrared Science Archive 6222http://irsa.ipac.caltech.edu/applications/DUST/ (Schlafly & Finkbeiner, 2011). In Fig. 1, we display all our absolute-calibrated and dereddened spectra (upper panel) with the normalized form (bottom panel) obtained through the fit of the continuum with a cubic spline. The spectra are also available in our online database ZBLLAC333http://web.oapd.inaf.it/zbllac/.
4 Methods and results
For each spectrum the S/N was measured, and the minimum detectable EW was evaluated following the procedure described in detail in Paiano et al. (2017a).
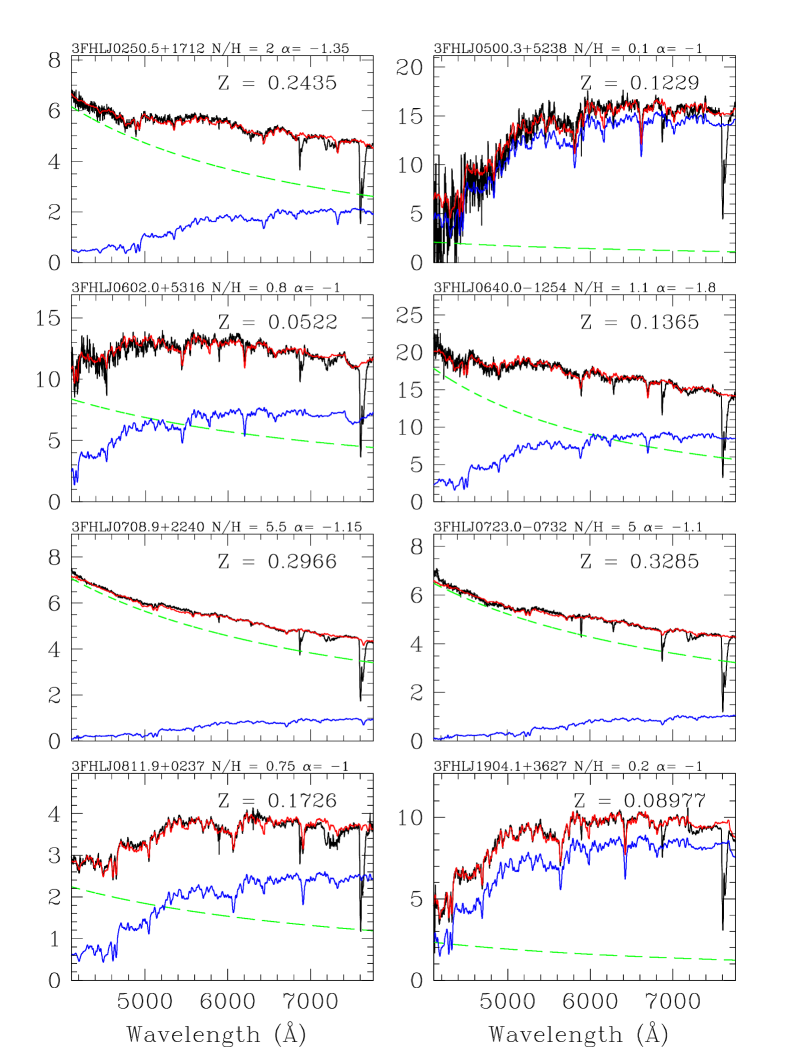
The optical spectrum is assumed to be the superposition of a non thermal component described by a power law (PL) and the starlight component of the host galaxy. The latter is in almost all cases a giant elliptical galaxy of M(R)-22.9 (Sbarufatti, et al., 2005b). We performed a spectral decomposition using these two components for all our targets (see some examples in Fig. 2) and for details for the individual sources are reported in the corresponding notes. The visibility of the absorption features due to the host galaxy at a given wavelength, depends on the ratio of the two components (N/H, nucleus-to-host ratio) and on the minimum detectable EW (Sbarufatti, et al., 2006a). Under this assumption, it is possible to set a lower limit to the redshift, when no absorption lines of the host galaxy are detected. We followed the procedure described in the Appendix A of Paiano et al. (2017a) to evaluate this redshift lower limit.
Our optical spectroscopy shows that all 55 observed targets are BLL, including the 13 targets previously classified as BCU. No objects like flat spectrum radio-quasar or narrow line Seyfert I were found. In Tab 2 we report for each target whether the spectrum exhibits emission lines (labelled as E), galactic lines (G), intervening lines (I) or if it is lineless (L). For each source we give the redshift, the spectroscopic redshift lower limit in case of intervening line detection or a lower limit, estimated following the minimum EW method (described above), when the spectrum is featureless. In Table 3, we give the measurement of the all detected lines and in Fig. 3 we display some close-ups of the normalized spectra around interesting detected features. In 12 objects we detected emission lines and in 20 we found intrinsic absorption lines. This allows us the determination of 26 new redshifts, ranging from z = 0.05 to z = 0.91. The mean value is 0.28. In 5 sources intervening lines are detected, in most case due to Mg II, which enable to set a robust spectroscopic lower limit to the redshift. These intervening lines are originated at redshift in the range between 0.1 and 1.1. The intervening lines are an efficient tool for finding the most distant sources. For the reminder 24 sources, we provide the redshift lower limits based on lack of detection of spectral features. These limits range from z 0.1 to z 0.6.


5 Notes on individual sources
-
3FHL J0009.4+5030: The spectrum appears featureless and no emission/absorption lines are detected. On the basis of the minimum EW (0.20 Å) and on the lack of detection of features from the host galaxy, we can set a redshift lower limit of z 0.6.
-
3FHL J0015.7+5551: The observed optical counterpart (g = 18.7) of this gamma-ray source is at (RA,DEC)=(00:15:40, +55:51:45) and spatially coincident there is one X-ray source (J001540+555144), detected by Swift, and one radio source (NVSS J001540+555144). The de-reddened (E(B-V) = 0.37) spectrum of the source is characterized by stellar absorption features of the host galaxy (Ca II 3934,3968, G-band 4305, Ca+Fe 5269) at z = 0.2168, superposed to a non thermal power law continuum (F, = -1.2). From the spectral decomposition of the two components, we set a N/H = 1.5. This object was previously studied by Álvarez Crespo, et al. (2016), who due to low S/N of the spectrum failed to detect the absorption features. At 2.5" (West on the right), there is a faint companion (g = 20.7) that was placed in the slit during our observation and exhibits a stellar spectrum.
-
3FHL J0045.3+2127: Our optical spectrum (S/N90) is characterized by a power law emission ( = -1.3). We detect an faint absorption doublet at 5600 Å that we identify as Ca II 3934,3968 at z = 0.4253. It is worth to note that there is a galaxy close to our target at a projected distance of 10" (see Fig. 4) with redshift z = 0.4265 provided by SDSS survey. A previous spectrum provided by SDSS survey failed to detect any feature, while Shaw, et al. (2013) provided a lower limit compatible with our measurement.
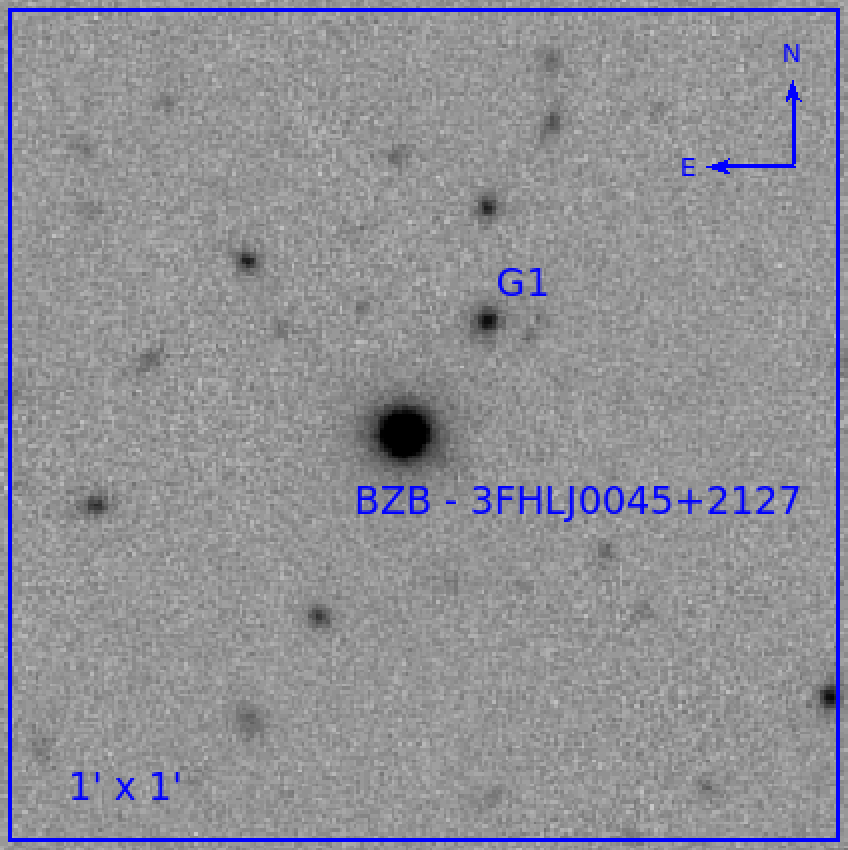
Figure 4: PANSTARR i-band image of the BLL 3FHL J0045+2127. There is one close companion at 10′′ from the target (that is at the center). Field shown is 1′, North up and East left. -
3FHL J0045.7+1217: In our spectrum we find absorption lines due to Ca II 3934,3968, G-band 4305, Mg I 5175 and Ca+Fe 5269 attributed to the stellar population of the host galaxy. In addition we also detect a faint (EW = 0.2 Å) emission line due to [O II] 3727 (see Fig. 3). The redshift is 0.2549. This is consistent with the lower limit proposed by Shaw, et al. (2013). From the spectral decomposition, we set a N/H4.5 and = -1.0 for the nuclear power law component.
-
3FHL J0131.1+6120: The dereddened spectrum (E(B-V) = 0.79) is featureless with a minimum detectable EW varying between 0.20 Å and 0.70 Å along the spectrum. We can set a lower limit of the redshift z 0.10.
-
3FHL J0134.4+2638: We obtain an optical spectrum that is featureless. No emission or absorption lines are detected out to a minimum EW of 0.35 - 0.50 Å. This is consistent with the featureless spectrum of the SDSS survey. From the lack of detection of host galaxy features, we can set a redshift lower limit z 0.15. An optical spectrum obtained by Marchesi, et al. (2018) exhibits a prominent emission line at 4400 Å which is interpreted as Mg II 2800. We suspect that the reported line is a spurious artifact. In fact this feature is not reported in the SDSS spectrum and in Shaw, et al. (2013).
-
3FHL J0137.9+5815: Our spectrum (S/N145) is dominated by non-thermal continuum. We detect very weak absorption features from the host galaxy (Ca II 3934,3968, Mg I 5175 and Ca+Fe 5269), yielding a z = 0.2745, and from the spectral decomposition we obtain N/H3. No previous spectrum is available in literature.
-
3FGL J0141.4-0929: The only feature in our spectrum is an absorption doublet at 4200 Å, which is due to intervening Mg II 2800, yielding a spectroscopic lower limit of the redshift of z 0.501. This feature is also present in the spectra reported in Stickel, et al. (1993) and Stocke, et al. (1997). Note that we do not confirm the emission of Mg II 2800 and [O II] 3727 at z = 0.737 proposed by Stocke, et al. (1997).
-
3FHL J0148.2+5201: In our spectrum, the Ca II 3934,3968 doublet is apparent at 5670 Å and, together with the G-band 4305 absorption line at 6183 Å, yield z = 0.437. The decomposition of the spectrum provides a N/H5, and =1.3 for the nuclear power law component. The spectrum published by Álvarez Crespo, et al. (2016), with a poorer S/N, is featureless.
-
3FHL J0241.3+6543: We detect two emission lines at 7370 Å which can be interpreted as Hα 6563 and [N II] 6584 at z = 0.1211 (see the close-up in Fig. 3). At the same redshift, there is a further emission doublet that we attribute to [S II] 6716,6731, and an absorption line due to Na I 5892. We note that Marchesi, et al. (2018), on the basis of an absorption doublet at 4600 Å, identified as Mg II, suggest a redshift lower limit z0.645. This conflicts with our redshift determination.
-
3FHL J0250.5+1712: We obtain a spectrum with S/N100 which exhibits clear absorption lines attributed to the host galaxy (Ca II 3934,3968, Hδ 4861, G-band 4305, Mg I 5175, Hβ 4861 and Na I 5892). This yields a redshift of z = 0.2435, confirming the proposal of Archambault, et al. (2016). For the emission lines, the upper limit of EW is 0.45 Å. The present of the host galaxy is well detected in the decomposition reported in Fig. 2, where a N/H = 2 is estimated.
-
3FHL J0322.0+2336: Our optical spectrum, with S/N160, is largely superior to one reported by Laurent-Muehleisen, et al. (1998), but still no significant features are present. The upper limit for the emission/absorption lines is EW = 0.10 - 0.25 Å, corresponding to a lower limit of the redshift of z 0.25.
-
3FHL J0423.8+4149: We detect a single emission line at 6997.6 Å of equivalent width EW = 1.9 Å. The most plausible identification of this line is [O III] 5007 that yields a tentative redshift of z = 0.3977. The other component of [O III] 4959 doublet is washed out by the telluric band at 6870 Å. This target was proposed as neutrino source by Righi, et al. (2019) and Paiano et al. (2019).
-
3FHL J0433.1+3227: Even though our optical spectrum (S/N100) is of higher quality than that presented by Álvarez Crespo, et al. (2016) (S/N5), we still do not find significant features and from the minimum detectable EW 0.3 Å, we can set a redshift lower limit z 0.45.
-
3FHL J0433.6+2905: The spectrum is severely reddened with E(B-V) = 0.66. There is a possible broad emission feature centered at 5340 Å in a region of the spectrum where the S/N 15. A similar feature maybe is present in the spectrum reported in Shaw, et al. (2013), but not identified by the authors. Supposing that this feature is due Mg II 2800, the redshift would be 0.91.
-
3FHL J0434.7+0921: In our spectrum no spectral feature is apparent. We set a lower limit of z 0.1 from the lack of absorption lines from the host galaxy.
-
3FHL J0500.3+5238: The target is highly reddened with E(B-V)=0.75. Several photospheric absorption lines are apparent (G-band 4305, Hβ 4861, Mg I 5175, Na I 5892 and Hα 6564), yielding z = 0.1229. At the same redshift there is a narrow emission line attributed to [N II] 6584 with EW1.3 Å. The spectral decomposition in the power law (-1.0), due to the nucleus, and in the host galaxy template is reported in Fig. 2 and we find a N/H = 0.1.
-
3FHL J0506.0+6113: The optical spectrum (S/N70) is highly reddened with E(B-V) = 0.55. We find a hint of Ca II 3934,3968 doublet at 6042,6096 Å that would correspond to z0.54.
-
3FHL J0515.8+1528: No significant feature is apparent in our spectrum (S/N130). From the null detection of absorption lines of the host galaxy, we can set a lower limit of z 0.2.
-
3FHL J0540.5+5823: There are no convincing emission/absorption features in our spectrum (S/N60). A lower limit of z 0.10 can be set from the lack of detected absorption lines of the host galaxy. This source is inserted in the Padovani, et al. (2016) list of hard gamma-ray sources found around the position of IceCube events.
-
3FHL J0600.3+1245: This gamma-ray object, associated to the radio source NVSS J060015+124344, is classified as BCU in the Fermi catalogs. It is spatially coincident with the X-ray source 1RXS J006014.8+124341 and with the optical counterpart at (RA,DEC) = (06:00:15, 12:43:43). Our optical spectrum exhibits several absorption lines (G-band 4305, Hβ 4861, Mg I 5175, Na I 5892 and Hα 6563) attributed to the old stellar population of the host galaxy, that allow us to measure z = 0.0835. At the same redshift, we also detect, at 7133 Å, two narrow emission lines (EW = 1.2 Å and EW = 1.8 Å) due to Hα 6563 and [N II] 6584 (see the close-up in Fig. 3).
-
3FHL J0601.0+3837: The source was proposed as a BLL by Paggi, et al. (2014) who show a featureless spectrum of the X-ray counterpart. The source is faint (g = 20.5) and severely extincted (E(B-V) = 0.46), and we obtained a spectrum with a S/N40. This is basically featureless, apart for a possible doublet (at 6560 Å) that, if attributed to Ca II doublet of the host galaxy, corresponds to a redshift z = 0.662.
-
3FHL J0602.0+5316: The gamma-ray source is associated to the bright radio galaxy GB6J601+5315 and it is inside the error box of a neutrino event detected by IceCube (Padovani, et al., 2016). No previous optical spectrum is found in literature. Our spectrum of the source (g = 17.0) shows the absorption lines (Ca II, G-band, etc…) of the galaxy stellar population at z = 0.0522. The decomposition of the optical spectrum (see Fig. 2) in an elliptical template and power-law ( -1.0) emission indicates the presence of a non-thermal component contributing for 45%.
-
3FHL J0607.4+4739: An optical spectrum, obtained by Shaw, et al. (2013), does not show any significant features. From our lineless spectrum (S/N = 100), on the basis of the lack of detectable galaxy absorption lines, we can set a redshift lower limit z 0.10.
-
3FHL J0612.8+4122: Our spectrum is dominated by a power law continuum without significant intrinsic emission/absorption lines. However, we clearly detect intervening absorption systems of Mg II 2800, Fe II 2382, and Fe II 2586,2600 at z = 1.107. The Mg II absorption line doublet is also apparent in Shaw, et al. (2013).
-
3FHL J0620.6+2645: This gamma-ray source (g = 18.5) is classified as BCU in the Fermi catalogs. No previous optical spectrum is available. In our spectrum, many absorption lines from the host galaxy are clearly detected, yielding z = 0.1329. The decomposition of the spectrum, in a elliptical galaxy and a power law ( = -1.5) emission, allows us to set N/H0.5.
-
3FHL J0640.0-1254: No previous redshift is reported in literature. Our spectrum exhibits absorption lines (Ca II, G-band, Mg I, Na I) of the host galaxy diluted by the non thermal emission from the nucleus, allowing to measure z = 0.1365. The spectral decomposition in the elliptical galaxy and nucleus power law component provides an N/H 1 (see Fig. 2). In addition to the absorption feature, we also detect a narrow emission line at 7482 Å (EW = 0.6 Å) corresponding to [N II] 6584. We note that the object visible at 6.5" from the target is a star and it is derived by the GTC spectrum obtained during the same observation of our target.
-
3FHL J0702.6-1950: No optical spectra are found in literature. We obtain the spectrum orientating the slit to intersect the target (g = 19.1) and the close object at 5", which is a star (the classification is provided by GTC spectroscopy). The moderate S/N50 spectrum of the -ray target is dominated by a featureless continuum characterized by a typical power law shape with spectral index = -1.4. Based on the lack of spectral features from the host galaxy, we set a lower limit of z 0.10.
-
3FHL J0706.5+3744: We detect a faint absorption doublet at 4350 Å (EW0.6 Å) that is attributed to Ca II 3934,3968 (see Fig. 3) yielding the redshift z = 0.1042. If these lines were ascribed to the starlight of the host elliptical galaxy, we would expect to observe the trace of the host galaxy in the continuum, which is not present. Moreover these detected lines are narrower, compared to the typical Ca II line width from elliptical galaxies, rather indicating an interstellar absorption origin. Indeed at 12" from the target, there is another galaxy for which we obtained an optical spectrum: we found several emission lines due to Hβ 4861, [OIII] 4959,5007 and Hα 6563 at z = 0.1042, the same value of the BLL. We suppose that the halo gas of this close galaxy (located at the projected distance 23 kpc at that redshift) can be responsible of the absorption doublet found in the spectrum of -ray source. Therefore, for 3FHL J0706.5+3744, we set the spectroscopic lower limit of the redshift z 0.1042.
-
3FHL J0708.9+2240: This object is a BCU gamma-ray emitter associated to the radio source GB6J0708+2241. The optical counterpart (g = 17.4) is at (RA,DEC)=(07:08:58.3, 22:41:36.0). Massaro, et al. (2015) report an optical spectrum without evident features. We detect absorption lines (Ca II, G-band, and Mg I) due to the old stellar population of the host galaxy, allowing us to locate the source at z = 0.2966. The spectral decomposition, reported in Fig. 2), indicates the presence of a no-thermal power law component (=-1.15) and a N/H = 5.5.
-
3FHL J0709.1-1525: In the Fermi catalog, this BCU -ray source is associated to the radio source PKS 0706-15. From the analysis of Swift/XRT data, inside the Fermi error box we detect the X-ray source J070912-152703, spatially coincident with the radio counterpart and the optical counterpart (g = 18.9) at (RA,DEC)=(07:09:12.3,-15:27:00.0). This confirms the association with PKS 0706-15. No previous spectrum is reported in literature. Our spectrum, highly reddened (E(B-V) = 0.55), exhibits the shape of an elliptical galaxy with evident absorption lines (Ca II, G-band, Hβ, Ca+Fe, Na I, and Hα) at redshift z = 0.1420. In addition we detect an emission line (EW = 1.0 Å) at 7518 Å which is attributed to [N II] 6584 Å.
-
3FHL J0723.0-0732: The blazar classification of this -ray emitter is proposed by Martí, et al. (2004) who report a featureless optical spectrum. In our spectrum (S/N170), we detect the absorption doublet attributed to Ca II 3934,3968 and a faint feature due to G-band. This yields a redshift of z = 0.3285. The decomposition of the spectrum (see Fig. 2) in an elliptical template and power-law emission indicates the presence of no-thermal component and allows us to set N/H5.
-
3FHL J0811.9+0237: There are not previous spectra available for this object. Our spectrum clearly exhibits absorption lines (Ca II, G-band, Hβ, Mg I, Ca+Fe, and Na I ) due to the host elliptical galaxy at z = 0.1726. In addition a faint emission line attributed to [N II] 6584 is detected at the same redshift. The decomposition of the spectrum in an elliptical galaxy and power-law (=-1) emission reveals the presence of no-thermal component and the N/H0.75 (see Fig. 2). We note that 3FHL J0811.9+0237 could belong to a small group of galaxies. There are two neighbour galaxies at 9" (on East) and 22" (North-West) at redshift similar to our target (see Fig. 5): from our GTC spectroscopy of G1 and from the SDSS spectrum available for G2, we find that these companions are elliptical galaxies at z = 0.1697 of projected velocity of 900 km s-1 relative to our target.
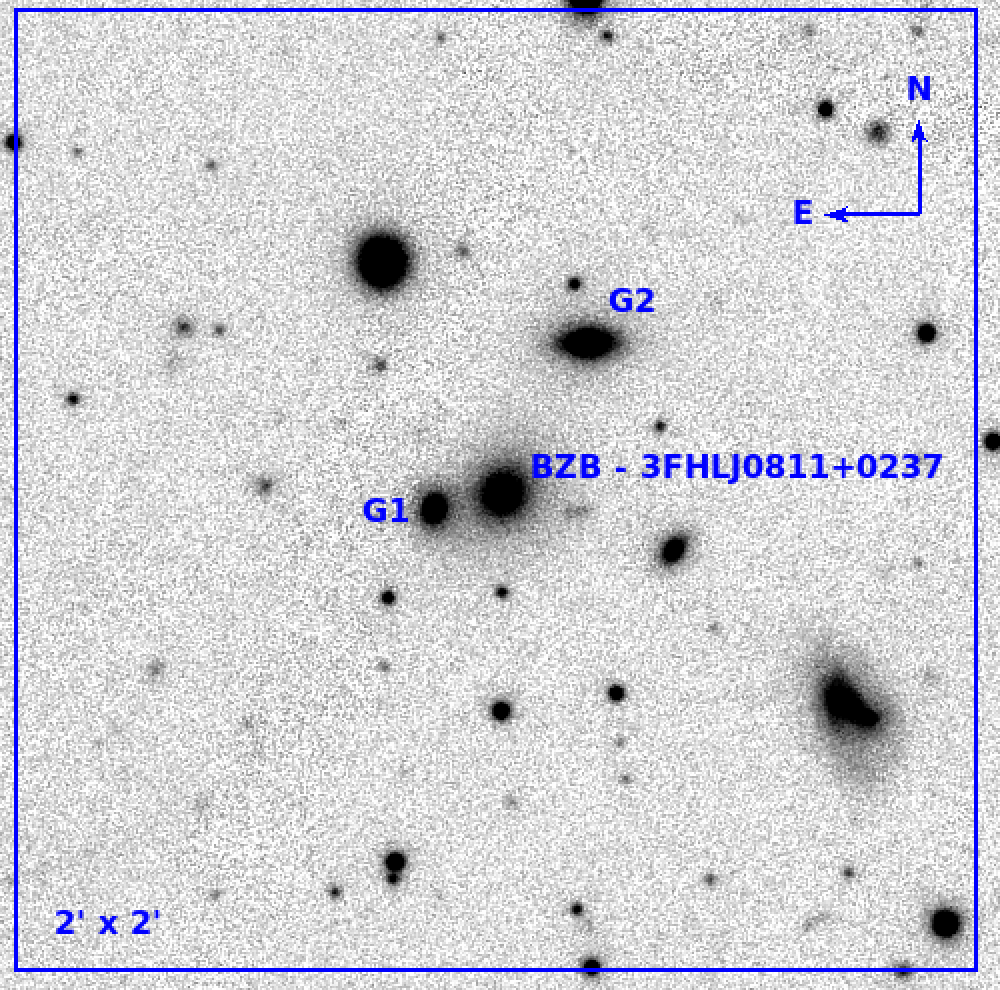
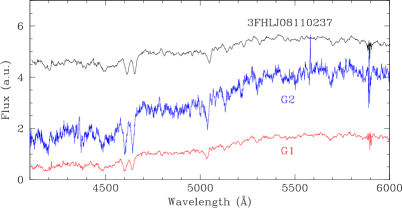
Figure 5: Upper panel: The PANSTARR i-band image (North up and East left) of the BLL 3FHL J0811.9+0237 (in the center). There are two close companions of the BLL: G1 at 9" and G2 at 22". Bottom panel: Comparison of the BLL spectrum with the spectra of the two companions (see details in the text). -
3FHL J0816.4-1311: Despite the high quality optical spectrum (S/N300), no emission/absorption lines are found. On the basis of the minimum detectable EW (0.10 Å) and the lack of feature detection from the host galaxy, we can set a redshift lower limit of z 0.40. There are previous spectra reported in literature by Shaw, et al. (2013), who show a featureless spectrum, and by Pita, et al. (2014) that found intervening absorption systems attributed to Mg II 2800 (at z = 0.1902, z = 0.2336, and z = 0.2882) in a spectral range not covered by our spectrum.
-
3FHL J0905.5+1357: We observed this source at two different epochs separated by an interval of about one year (see Table 1). It is noticeable that the source magnitude obtained from the acquisition images varied by one mag. In Fig. 1 we report the average spectrum of the two epochs. The shape is the typical BLL continuum and the only intrinsic feature detected is an emission line (average EW0.7 Å) at 6133 Å (see the close-up around this line in Fig. 3) which, if attributed to [OIII] 5007, yields a redshift of 0.2239. The line luminosity is 81040 erg/s during the two states, while the continuous varies of a factor of 3. This source is quoted in Padovani, et al. (2016) as spatially coincident with the error box of a neutrino IceCube event and there are two previous spectra by Shaw, et al. (2013) and the SDSS. Both spectra appear featureless and correspond to a high state of the source (F(6100Å)110-16 erg cm-2 s-1) that probably has hampered the detection of the line, which appeared clearly in our observations when the source was in a lower flux state.
-
3FHL J0910.5+3329: Our optical spectrum with S/N200 appears featureless, in agreement with the previous spectra available in literature (Bauer, et al., 2000; Shaw, et al., 2013, and that provided by the SDSS survey). We can set a redshift lower limit z 0.15 on the basis of the non-detection of features due to the host galaxy.
-
3FHL J0953.0-0840: The only spectrum available in literature is provided by Shaw, et al. (2013) that is featureless. In our good optical spectrum (S/N220), still no emission/absorption line is detected. The spectrum exhibits the power-law shape, typical for BLLs, with spectral index of = -1.5. By the minimum EW method, we can set the redshift lower limit z 0.15.
-
3FHL J1037.6+5711: All previous spectra reported in literature (Laurent-Muehleisen, et al., 1998; Caccianiga, et al., 2002; Shaw, et al., 2013, and the SDSS survey) do not exhibit emission/absorption lines. Our high quality (S/N300) spectrum shows the typical BLL power-law shape and it still is featureless. The estimated minimum EW is 0.15 Å and this yields a redshift lower limit z 0.25.
-
3FHL J1055.6-0125: No redshift is reported in literature. The spectral shape of our spectrum is well described by a power law emission ( -1.5), typical of a BLL. No emission or absorption features are apparent at level of EW0.40 Å and we can set a redshift lower limit of z 0.55.
-
3FHL JJ1059.1-1134: The source was observed by Landoni, et al. (2013) and Shaw, et al. (2013) and they did not detect any features. Also our spectrum appears featureless. The minimum detectable EW spans between 0.30 Å and 1.15 Å along the spectrum, allowing us to set a redshift lower limit based on the lack of galaxy absorption lines of z0.10.
-
3FHL J1150.5+4154: There is an SDSS spectrum of the source and one in the collection of Shaw, et al. (2013). Neither absorption nor emission features are apparent. Also our high S/N200 spectrum is featureless and from the minimum EW0.25 Å, we can set a lower limit z 0.25 from the lack of detection of features from the host galaxy.
-
3FHL J1233.7-0145: Optical spectra provided by Shaw, et al. (2013), Kügler, et al. (2014) and from the SDSS survey are featureless and no spectroscopic redshift is provided. Also in our spectrum no emission/absorption features are detected and, from a minimum detectable EW0.45 - 0.95 Å, we can set a redshift lower limit of 0.10.
-
3FHL J1253.1+5300: In our high quality spectrum (S/N250) of the target (g = 16.6), we detect a faint absorption doublet system (EW0.3 Å) at 4660 Å attributed to intervening Mg II Å cold gas, allowing us to set the spectroscopic redshift lower limit z 0.6638. The same line system is found in the spectrum of the SDSS survey and reported by Shaw, et al. (2013).
-
3FHL J1418.4-0233: All optical spectra reported in literature (Shaw, et al., 2013; Kügler, et al., 2014, and that provided by SDSS survey) appear featureless and no redshift is measurable. Our S/N200 optical spectrum of this bright target (g = 16.4) does not exhibit emission or absorption lines and the minimum detectable EW is 0.15-0.30 Å. We can set a redshift lower limit of z 0.12.
-
3FHL J1445.0-0326: This object has been classified as BLL by Bauer, et al. (2000), but its redshift was not determined because of the absence of emission and absorption features. Featureless spectra are reported in Sbarufatti, et al. (2006a) and Piranomonte, et al. (2007) Also our spectrum (S/N = 200) does not show apparent spectral lines at level of EW0.20 Å and we can set a redshift lower limit of z 0.45.
-
3FHL J1447.9+3608: In our spectrum (SNR250), there is a clear absorption doublet at 4865 Å, which is due to intervening Mg II 2800 system, yielding a spectroscopic lower limit of z 0.738. The feature was noted by Shaw, et al. (2013) and appears also in the SDSS spectrum.
-
3FHL J1454.5+5124: The redshift z = 1.0831 reported in literature was proposed by the automatic procedure of the SDSS survey. However no convincing line identification is provided and also the spectrum shown by Shaw, et al. (2013) appears featureless. In our spectrum of very good quality, with S/N320, no spectral features are found. We can set a redshift lower limit of z 0.40 by the minimum EW0.10 Å.
-
3FHL J1549.9-0659: This gamma-ray emitter is associated to the radio source NVSS J154952-065907 and proposed as blazar candidate in the Fermi catalog because no spectra are available in literature. Our spectrum establishes the BLL nature of the source and we find faint absorption lines due to Ca II 3934,3968 and G-band 4305, attributed to the stellar population of the host galaxy, at a z = 0.418.
-
3FHL J1748.6+7005: In literature, Stickel, et al. (1989) provided a tentative redshift of z = 0.77 based on identification of the very faint (EW = 0.4 Å) [O II] emission line at 6600 Å. This value was subsequently confirmed by Lawrence, et al. (1996) from the detection of additional lines due to C III] (EW = 0.4 Å) and [O III] (EW = 0.7 Å). Our high S/N (300) spectrum of the bright target (g = 16.6) is featureless. Note that we cannot detect the emission lines claimed in the previous works because they are out of our spectral range.
-
3FHL J1800.5+7827: We clearly detect a significant (EW = 8.3 Å) emission line at 4712 Å (see the close-up in Fig. 3) that, if attributed to Mg II 2800, leads to a redshift z = 0.683. From the literature, a similar value is reported in Hewitt, et al. (1993) and in Stickel, et al. (1994) where neither spectrum nor line identification are shown.
-
3FHL J1841.3+2909: This 3FHL source is associated to the radio source MG3 J184126+2910 and proposed as BLL candidate (Massaro, et al., 2013). Our de-reddened (E(B-V)=0.21) optical spectrum is described as a power-law ( = -1.1) and no evident lines are found. We set a redshift lower limit of z 0.1. There is also another spectrum published by Marchesi, et al. (2018) that is again featureless.
-
3FHL J1904.1+3627: This target is a candidate blazar in the Fermi catalog and associated to the radio source MG2 J190411+3627. In Marchesi, et al. (2018) the optical spectrum seems featureless, mainly due to a poor S/N. Our spectrum (S/N60) is modelled by an elliptical galaxy shape and shows several absorption lines due to the old stellar population of the host galaxy. The redshift of the target is z = 0.08977. From the spectral decomposition (see Fig. 2) we can determine that the AGN contributes to 15% (N/H=0.2).
-
3FHL J1911.5-1908: This source is a BCU of the Fermi catalog associated to the radio source PMN J1911-1908. Marchesi, et al. (2018) report an optical spectrum of modest S/N that appears featureless. In our spectrum, several absorption lines are found due to the old stellar population (Ca II, G-band, Mg I, Ca+Fe and Na I), yielding a redshift z = 0.138. At the same redshift, we also detect narrow emission lines due to forbidden transitions attributed to [O II] 3727, [O III] 5007, [N II] 6548, Hα 6563 partially blended, and [N II] 6584.
-
3FHL J1921.8-1607: Our good (S/N125) optical spectrum does not exhibit emission or absorption lines. From the lack of detection of features of the host galaxy, with the minimum detectable EW0.20-0.50 Å and magnitude g = 17.6, we can set a lower limit of the redshift z 0.12. In literature, there is another spectrum in Shaw, et al. (2013) that is featureless.
6 Summary and Conclusions
From our optical spectroscopy, we can assess that all sources in the observed data set are BLL. We determined the redshift for 26 objects from absorption lines of their host galaxies and in some cases also from emission lines. For other 5 objects we found a spectroscopic lower limit from the detection of intervening absorptions. The remaining 24 sources have featureless optical spectra thus we estimate a redshift lower limit from the absence of absorption features of the host galaxy. Moreover for all the latter sources there are not intervening absorptions that suggests they are at relatively low redshift. Considering the absorptions from Mg II we expect that the number of Mg II absorbers per redshift bin (dN/dz), with EW0.3 Å, is 0.5 (Zhu & Ménard, 2013). Since none are detected above 4100 Å, one must have on average < 0.6. This is consistent with the median value of the detected redshifts (0.3.).
BLL are characterized by the lack (or very weak) features in their optical spectra. Apart from the absorption lines from the host galaxies, that are always present if sufficient high quality spectrum is available (Landoni, et al., 2014), it is of interest to evaluate the properties of the possible emission lines compared with other active nuclei. Weak narrow emission lines are observed in a number of cases for BLL. These can arise either from a region of significant star formation or from nuclear emission in the narrow line region (Bressan, et al., 2006; Paiano et al., 2017a, 2018). The detection of weak broad emission lines is rarer (see e.g. Sbarufatti, et al., 2006b; Landoni, et al., 2012). It adds an important ingredient for the understanding of this class of active galatic nuclei (e.g. Giommi, et al., 2013), in particular in the connection with the FSRQ and the possibility of an evolutionary relation between these two classes (for example Giommi, et al., 2013; Ajello, et al., 2014).
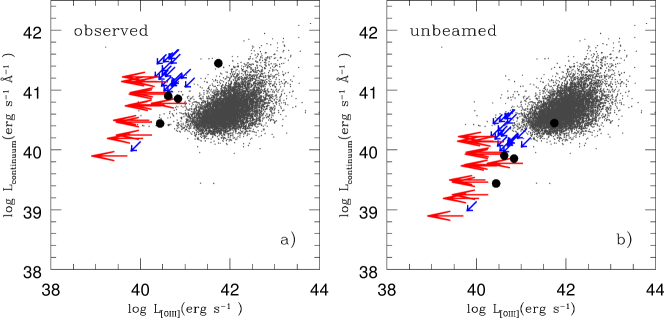
In 4 objects we detected weak (EW0.5-1.9 Å) [O III] 5007 emission lines (see Table 3). This yields an average line luminosity L 8 1040 erg/s. For the 13 objects of known redshift and for which [O III] would be observable in our spectra, on average we set an upper limit line luminosity of 31040 erg/s. A similar limit was also derived for the 24 sources of unknown redshift, assuming that the [O III] emission line be inside the observed range. In addition to the [O III] emission line, we also detect [N II] 6584 emission feature in 7 targets (only in one of these cases also [O III] is present). The derived [N II] line luminosity is in the range 0.1-21041 erg/s. Only for two sources we detected measurable Hα emission. These weak (EW1.5 Å) lines imply Hα luminosity of 2.51040 and 1.21041 erg/s. At face value, the [O III] line luminosity is significantly lower than that found for the low redshift (0.10.5) QSOs (see e.g. Shen, et al., 2011) at comparable observed continuum luminosity (see Fig. 6-upper panel-a). On average the [O III] luminosity for our BLL sample is a factor 50 lower than that found for the QSOs (1042 erg/s) and a factor 20 lower considering the [O III] luminosity distribution of the type II QSOs (see Zakamska, et al., 2003). This might indicate either that the lines are indeed fainter of that found in the QSOs at the same continuum level or that the continuum is significantly enhanced by the presence of relativistic beaming that is characteristic of this kind of sources (e.g. Urry & Padovani, 1995). Actually, assuming a beaming factor of 10, both measured values and upper limits move to the region at the lowest line and continuum luminosities as it is displayed in Fig. 6-upper panel-b).
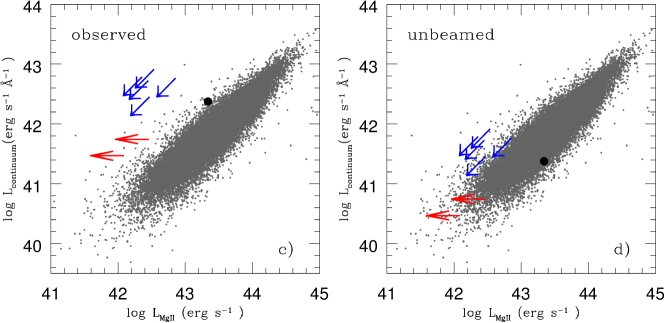
Another important result of our spectroscopy is that we do not find broad emission lines, except for 3FHL J1800.5+7827 for which we detect Mg II emission line of EW = 8.3Å, FWHM3500km/s and LMgII = 2.21043 erg/s. This is at the limit of the distribution of the QSOs at similar redshift and luminosity of the continuum (see Fig. 6-bottom panel-c). Among our BLL with known redshift, only two are at z0.5 and the Mg II emission could occur in the observed spectral range. For these sources we estimate an upper limit of the Mg II luminosity 21042 erg/s, that is a factor 20 smaller than the average value of the QSOs reported in Shen, et al. (2011). A similar value is also found for the BLL for which we provide a spectroscopic redshift lower limit. As for the case of [O III] lines, when accounting for the same beaming correction data points and limits locate in the region of the lowest luminosity (see Fig. 6-bottom panel-d).
The comparison and contrast of the properties of the emission lines of BLL and AGN obviously requires a thorough and extended discussion, which deserve the comparison of large and homogeneous samples to properly investigate this issue.
| 3FGL Name | Counterpart | RA | DEC | Class | E(B-V) | Obs. date | tExp | Seeing | g |
|---|---|---|---|---|---|---|---|---|---|
| (J2000) | (J2000) | (s) | (”) | ||||||
| 3FHLJ0009.4+5030 | NVSSJ000922+503028 | 00:09:22.8 | 50:30:28.8 | bll | 0.13 | 06-11-2018 | 4500 | 1.5 | 18.9 |
| 3FHLJ0015.7+5551 | GB6J0015+5551 | 00:15:40.1 | 55:51:45.0 | bll | 0.37 | 06-11-2018 | 3000 | 1.5 | 18.7 |
| 3FHLJ0045.3+2127 | GB6J0045+2127 | 00:45:19.3 | 21:27:40.0 | bll | 0.03 | 06-11-2018 | 1200 | 1.7 | 17.7 |
| 3FHLJ0045.7+1217 | GB6J0045+1217 | 00:45:43.3 | 12:17:12.0 | bll | 0.07 | 26-11-2018 | 3000 | 2.0 | 17.6 |
| 3FHLJ0131.1+6120 | 1RXSJ013106.4+612035 | 01:31:07.3 | 61:20:34.0 | bll | 0.79 | 03-12-2018 | 3600 | 1.3 | 20.3 |
| 3FHLJ0134.4+2638 | 1RXSJ013427.2+263846 | 01:34:28.1 | 26:38:43.0 | bcu | 0.09 | 03-12-2017 | 1000 | 1.3 | 17.6 |
| 3FHLJ0137.9+5815 | 1RXSJ013748.0+581422 | 01:37:50.4 | 58:14:11.0 | bll | 0.45 | 03-01-2019 | 3600 | 1.2 | 18.9 |
| 3FGLJ0141.4-0929 | PKS0139-09 | 01:41:25.8 | -09:28:43.7 | bll | 0.02 | 27-12-2017 | 1350 | 1.1 | 16.8 |
| 3FHLJ0148.2+5201 | GB6J0148+5202 | 01:48:20.2 | 52:02:06.0 | bll | 0.19 | 04-12-2018 | 2400 | 2.7 | 18.1 |
| 3FHLJ0241.3+6543 | TXS0237+655 | 02:41:21.6 | 65:43:11.9 | bcu | 1.09 | 07-12-2016 | 3600 | 0.9 | 20.9 |
| 3FHLJ0250.5+1712 | NVSSJ025037+171209 | 02:50:37.9 | 17:12:09.0 | bll | 0.12 | 30-10-2018 | 1200 | 1.7 | 17.8 |
| 3FHLJ0322.0+2336 | MG3J032201+2336 | 03:22:00.0 | 23:36:11.0 | bll | 0.17 | 30-10-2018 | 1200 | 1.3 | 17.5 |
| 3FHLJ0423.8+4149 | 4C+41.11 | 04:23:56.0 | 41:50:02.7 | bll | 0.63 | 26-03-2018 | 7200 | 1.9 | 20.3 |
| 3FHLJ0433.1+3227 | NVSSJ043307+322840 | 04:33:07.7 | 32:28:40.0 | bll | 0.38 | 08-11-2018 | 3900 | 0.7 | 19.7 |
| 3FHLJ0433.6+2905 | MG2J043337+2905 | 04:33:37.8 | 29:05:55.4 | bll | 0.66 | 21-02-2017 | 4500 | 1.9 | 21.9 |
| 3FHLJ0434.7+0921 | TXS0431+092 | 04:34:41.0 | 09:23:49.0 | bcu | 0.22 | 05-12-2017 | 3900 | 1.6 | 18.1 |
| 3FHLJ0500.3+5238 | GB6J0500+5238 | 05:00:21.4 | 52:38:02.0 | bcu | 0.75 | 26-11-2016 | 3600 | 1.4 | 19.6 |
| 3FHLJ0506.0+6113 | NVSSJ050558+611336 | 05:05:58.8 | 61:13:36.0 | bll | 0.55 | 14-12-2018 | 4800 | 2.0 | 19.6 |
| 3FHLJ0515.8+1528 | GB6J0515+1527 | 05:15:47.3 | 15:27:17.0 | bll | 0.47 | 03-03-2019 | 7200 | 1.7 | 18.9 |
| 3FHLJ0540.5+5823 | GB6J0540+5823 | 05:40:30.0 | 58:23:38.0 | bll | 0.34 | 28-01-2018 | 900 | 1.7 | 18.2 |
| 3FHLJ0600.3+1245 | NVSSJ060015+124344 | 06:00:15.0 | 12:43:43.0 | bcu | 0.41 | 28-11-2016 | 3600 | 0.9 | 18.5 |
| 3FHLJ0601.0+3837 | B20557+38 | 06:01:02.8 | 38:38:29.0 | bll | 0.46 | 09/10-03-2019 | 6000 | 1.6 | 20.5 |
| 3FHLJ0602.0+5316 | GB6J0601+5315 | 06:02:00.4 | 53:16:00.0 | bcu | 0.15 | 03-12-2017 | 900 | 1.2 | 17.0 |
| 3FHLJ0607.4+4739 | TXS0603+476 | 06:07:23.2 | 47:39:47.0 | bll | 0.16 | 20-01-2019 | 1200 | 1.1 | 17.2 |
| 3FHLJ0612.8+4122 | B30609+413 | 06:12:51.2 | 41:22:37.0 | bll | 0.17 | 20-01-2019 | 900 | 1.2 | 18.1 |
| 3FHLJ0620.6+2645 | RXJ0620.6+2644 | 06:20:40.0 | 26:43:32.0 | bcu | 0.34 | 09-04-2019 | 3600 | 1.8 | 18.5 |
| 3FHLJ0640.0-1254 | TXS0637-128 | 06:40:07.2 | 12:53:14.2 | bcu | 0.49 | 24-02-2017 | 1500 | 1.5 | 17.9 |
| 3FHLJ0702.6-1950 | TXS0700-197 | 07:02:42.9 | -19:51:22.0 | bll | 0.42 | 10-03-2019 | 750 | 1.9 | 19.1 |
| 3FHLJ0706.5+3744 | GB6J0706+3744 | 07:06:31.7 | 37:44:36.0 | bll | 0.06 | 02-11-2018 | 1800 | 2.5 | 17.6 |
| 3FHLJ0708.9+2240 | GB6J0708+2241 | 07:08:58.3 | 22:41:36.0 | bll | 0.05 | 03-12-2018 | 4500 | 1.2 | 17.4 |
| 3FHLJ0709.1-1525 | PKS0706-15 | 07:09:12.3 | -15:27:00.0 | bcu | 0.55 | 04-12-2018 | 7200 | 2.5 | 18.9 |
| 3FHLJ0723.0-0732 | 1RXSJ072259.5-073131 | 07:22:59.7 | -07:31:35.0 | bll | 0.21 | 14-12-2018 | 3000 | 1.2 | 18.1 |
| 3FHLJ0811.9+0237 | PMNJ0811+0237 | 08:12:01.8 | 02:37:33.0 | bll | 0.02 | 04-12-2018 | 7200 | 2.0 | 18.0 |
| 3FHLJ0816.4-1311 | PMNJ0816-1311 | 08:16:27.2 | -13:11:52.0 | bll | 0.07 | 22-02-2018* | 5400 | 1.8 | 17.2 |
| 3FHLJ0905.5+1357 | MG1J090534+1358 | 09:05:35.0 | 13:58:06.0 | bll | 0.03 | 17-02-2018** | 850 | 1.2-2.0 | 16.2-17.3** |
| 3FHLJ0910.5+3329 | Ton1015 | 09:10:37.0 | 33:29:24.0 | bll | 0.02 | 22-02-2018 | 350 | 1.5 | 16.2 |
| 3FHLJ0953.0-0840 | PMNJ0953-0840 | 09:53:02.7 | -08:40:18.0 | bll | 0.04 | 22-02-2018 | 900 | 1.5 | 16.8 |
| 3FHLJ1037.6+5711 | GB6J1037+5711 | 10:37:44.3 | 57:11:56.0 | bll | 0.01 | 30-04-2018 | 1050 | 1.2 | 16.5 |
| 3FHLJ1055.6-0125 | NVSSJ105534-012617 | 10:55:34.3 | -01:26:16.0 | bll | 0.04 | 14-12-2018 | 3000 | 1.3 | 18.6 |
| 3FHLJ1059.1-1134 | PKSB1056-113 | 10:59:12.4 | -11:34:23.0 | bll | 0.02 | 22-01-2019 | 900 | 1.8 | 17.6 |
| 3FHLJ1150.5+4154 | RBS1040 | 11:50:34.7 | 41:54:40.9 | bll | 0.02 | 20-01-2019 | 900 | 1.3 | 17.0 |
| 3FHLJ1233.7-0145 | NVSSJ123341-014426 | 12:33:41.3 | -01:44:24.0 | bll | 0.03 | 20-01-2019 | 3600 | 1.9 | 20.3 |
| 3FHLJ1253.1+5300 | S41250+53 | 12:53:11.9 | 53:01:12.0 | bll | 0.01 | 20-01-2019 | 1200 | 1.2 | 16.6 |
| 3FHLJ1418.4-0233 | NVSSJ141826-023336 | 14:18:26.3 | -02:33:34.0 | bll | 0.05 | 30-04-2018 | 1050 | 1.2 | 16.4 |
| 3FHLJ1445.0-0326 | RBS1424 | 14:45:06.3 | -03:26:12.0 | bll | 0.08 | 09-04-2019 | 3600 | 1.2 | 17.8 |
| 3FHLJ1447.9+3608 | RBS1432 | 14:48:00.6 | 36:08:32.0 | bll | 0.01 | 16-04-2019 | 1500 | 1.8 | 16.2 |
| 3FHLJ1454.5+5124 | TXS1452+516 | 14:54:27.1 | 51:24:34.0 | bll | 0.02 | 10-04-2019 | 3600 | 1.0 | 16.7 |
| 3FHLJ1503.7-1541 | RBS1457 | 15:03:40.6 | -15:41:14.0 | bll | 0.10 | 16-04-2019 | 3600 | 2.0 | 17.8 |
| 3FHLJ1549.9-0659 | NVSSJ154952-065907 | 15:49:52.0 | -06:59:07.0 | bcu | 0.14 | 09-04-2018 | 7200 | 1.7 | 18.1 |
| 3FHLJ1748.6+7006 | S41749+70 | 17:48:32.8 | 70:05:50.7 | bll | 0.03 | 29-03-2018 | 1500 | 0.9 | 16.6 |
| 3FHLJ1800.5+7827 | S51803+784 | 18:00:45.7 | 78:28:04.0 | bll | 0.04 | 11-08-2018 | 900 | 2.5 | 16.7 |
| 3FHLJ1841.3+2909 | MG3J184126+2910 | 18:41:21.7 | 29:09:41.0 | bcu | 0.21 | 31-03-2018 | 1200 | 1.8 | 18.2 |
| 3FHLJ1904.1+3627 | MG2J190411+3627 | 19:04:11.9 | 36:26:59.0 | bcu | 0.08 | 07-04-2018 | 1600 | 2.0 | 17.3 |
| 3FHLJ1911.5-1908 | PMNJ1911-1908 | 19:11:29.7 | -19:08:23.0 | bcu | 0.14 | 12-05-2018 | 1200 | 2.0 | 18.0 |
| 3FHLJ1921.8-1607 | PMNJ1921-1607 | 19:21:51.5 | -16:07:13.2 | bll | 0.16 | 18-10-2018*** | 5400 | 2.5 | 17.6 |
Col.1: Fermi name of the target; Col.2: Counterpart name of the target; Col.3 - 4: Right ascension and declination of the optical counterpart; Col.5: Source classification reported in the 3FHL catalog (bll = BL Lac object, bcu = blazar candidate of uncertain type); Col.6: taken from the NASA/IPAC Infrared Science Archive (https://irsa.ipac.caltech.edu/applications/DUST/); Col.7: Date of observation; Col.8: Total integration time; Col.9: Seeing during the observation; Col.10: g magnitude measured from the acquisition image.
(*) This source was observed also in 14-12-2018 and 04-04-2019, (**) This source was observed also in 09-03-2019 and the source was found in two different flux states, (***) This source was also discussed in Paiano et al. (2017c)
| OBJECT | SNR | EWmin | z | Line type |
|---|---|---|---|---|
| 3FHLJ0009.4+5030 | 160 | 0.17 - 0.20 | ( 0.60) | L |
| 3FHLJ0015.7+5551 | 120 | 0.25 - 0.40 | 0.2168 | E,G |
| 3FHLJ0045.3+2127 | 90 | 0.30 | 0.4253 | G |
| 3FHLJ0045.7+1217 | 200 | 0.20 | 0.2549 | G |
| 3FHLJ0131.1+6120 | 75 | 0.20 - 0.70 | ( 0.10) | L |
| 3FHLJ0134.4+2638 | 80 | 0.35 - 0.50 | ( 0.15) | L |
| 3FHLJ0137.9+5815 | 145 | 0.25 - 0.30 | 0.2745 | G |
| 3FGLJ0141.4-0929 | 200 | 0.20 | 0.501 | I |
| 3FHLJ0148.2+5201 | 110 | 0.30 - 0.35 | 0.437 | G |
| 3FHLJ0241.3+6543 | 25 | 1.10 - 2.70 | 0.1211 | E,G |
| 3FHLJ0250.5+1712 | 100 | 0.35 - 0.45 | 0.2435 | G |
| 3FHLJ0322.0+2336 | 160 | 0.10 - 0.25 | ( 0.25) | L |
| 3FHLJ0423.8+4149 | 40 | 0.35 - 1.60 | 0.3977 | E |
| 3FHLJ0433.1+3227 | 110 | 0.25 - 0.35 | ( 0.45) | L |
| 3FHLJ0433.6+2905 | 15 | 1.35 - 3.80 | 0.91 ? | E |
| 3FHLJ0434.7+0921 | 75 | 0.30 - 0.90 | ( 0.1) | L |
| 3FHLJ0500.3+5238 | 40 | 0.55 - 4.00 | 0.1229 | E,G |
| 3FHLJ0506.0+6113 | 70 | 0.30 - 0.90 | 0.538 ? | G |
| 3FHLJ0515.8+1528 | 130 | 0.20 - 0.30 | ( 0.20) | L |
| 3FHLJ0540.5+5823 | 60 | 0.40 - 0.90 | ( 0.10) | L |
| 3FHLJ0600.3+1245 | 50 | 0.45 - 1.85 | 0.0835 | E,G |
| 3FHLJ0601.0+3837 | 40 | 0.50 - 1.35 | 0.662 ? | G |
| 3FHLJ0602.0+5316 | 70 | 0.35 - 1.00 | 0.0522 | G |
| 3FHLJ0607.4+4739 | 100 | 0.15 - 0.40 | ( 0.10) | L |
| 3FHLJ0612.8+4122 | 50 | 0.35 - 1.10 | 1.107 | I |
| 3FHLJ0620.6+2645 | 75 | 0.40 - 0.80 | 0.1329 | G |
| 3FHLJ0640.0-1254 | 80 | 0.35 - 0.65 | 0.1365 | E,G |
| 3FHLJ0702.6-1950 | 50 | 0.50 - 0.95 | ( 0.10) | L |
| 3FHLJ0706.5+3744 | 100 | 0.20 - 0.35 | 0.1042 | I |
| 3FHLJ0708.9+2240 | 250 | 0.15 - 0.20 | 0.2966 | G |
| 3FHLJ0709.1-1525 | 70 | 0.35 - 1.10 | 0.1420 | E,G |
| 3FHLJ0723.0-0732 | 170 | 0.10 - 0.25 | 0.3285 | G |
| 3FHLJ0811.9+0237 | 70 | 0.40 - 0.85 | 0.1726 | E,G |
| 3FHLJ0816.4-1311 | 300 | 0.10 | ( 0.40) | L |
| 3FHLJ0905.5+1357 | 200 | 0.10 - 0.20 | 0.2239: | E |
| 3FHLJ0910.5+3329 | 200 | 0.10 - 0.20 | ( 0.15) | L |
| 3FHLJ0953.0-0840 | 220 | 0.15 - 0.25 | ( 0.15) | L |
| 3FHLJ1037.6+5711 | 300 | 0.10 - 0.15 | ( 0.25) | L |
| 3FHLJ1055.6-0125 | 130 | 0.20 - 0.40 | ( 0.55) | L |
| 3FHLJ1059.1-1134 | 50 | 0.30 - 1.15 | ( 0.10) | L |
| 3FHLJ1150.5+4154 | 200 | 0.15 - 0.25 | ( 0.25) | L |
| 3FHLJ1233.7-0145 | 40 | 0.45 - 0.95 | ( 0.10) | L |
| 3FHLJ1253.1+5300 | 250 | 0.10 - 0.20 | 0.6638 | I |
| 3FHLJ1418.4-0233 | 200 | 0.15 - 0.30 | ( 0.12) | L |
| 3FHLJ1445.0-0326 | 200 | 0.10 - 0.20 | ( 0.45) | L |
| 3FHLJ1447.9+3608 | 250 | 0.10 - 0.20 | 0.738 | I |
| 3FHLJ1454.5+5124 | 320 | 0.05 - 0.10 | ( 0.40) | L |
| 3FHLJ1503.7-1541 | 50 | 0.55 - 1.25 | ( 0.10) | L |
| 3FHLJ1549.9-0659 | 200 | 0.15 - 0.20 | 0.418 | G |
| 3FHLJ1748.6+7006 | 320 | 0.10 - 0.20 | ( 0.3) | L |
| 3FHLJ1800.5+7827 | 130 | 0.25 - 0.40 | 0.683 | E |
| 3FHLJ1841.3+2909 | 40 | 0.55 - 1.35 | ( 0.10) | L |
| 3FHLJ1904.1+3627 | 60 | 0.40 - 1.50 | 0.08977 | G |
| 3FHLJ1911.5-1908 | 50 | 0.55 - 1.20 | 0.138 | E,G |
| 3FHLJ1921.8-1607 | 125 | 0.20 - 0.50 | ( 0.12) | L |
Col.1: Name of the target; Col.2: Median S/N of the spectrum; Col.3: Range of the minimum equivalent width (EWmin) derived from different regions of the spectrum; Col.4: Redshift; Col.5: Type of detected line to estimate the redshift: E = emission line, G = galaxy absorption line, I= intervening absorption assuming Mg II 2800Å identification, L= lower limit derived on the lack of detection of host galaxy absorption lines assuming a BLL elliptical host galaxy with M(R) = -22.9 (see details in Paiano et al., 2017a).
(:) This marker indicates that the redshift is tentative due to the detection of only one feature.
(*) For this source we found other two absorption line systems due to Fe II (2382, 2600) (See details text).
| Object name | EW | Line ID | Line Lum. | |
|---|---|---|---|---|
| (Å) | (Å) | (erg/s) | ||
| 3FHLJ0015.7+5551 | 4787 | 1.6 | Ca II 3934 | |
| 4829 | 1.0 | Ca II 3968 | ||
| 5238 | 1.0 | G-band 4305 | ||
| 6093 | -0.5 | [O III] 5007 | 4.21040 | |
| 6411 | 0.4 | Ca+Fe 5269 | ||
| 3FHLJ0045.3+2127 | 5607 | 1.0 | Ca II 3934 | |
| 5656 | 0.5 | Ca II 3968 | ||
| 3FHLJ0045.7+1217 | 4679 | -0.2 | [O II] 3727 | 2.31040 |
| 4936 | 1.0 | Ca II 3934 | ||
| 4980 | 0.9 | Ca II 3968 | ||
| 5403 | 0.3 | G-band 4305 | ||
| 6489 | 0.6 | Mg I 5175 | ||
| 6612 | 0.5 | Ca+Fe 5269 | ||
| 7393 | 0.5 | Na I 5892 | ||
| 3FHLJ0137.9+5815 | 5013 | 0.4 | Ca II 3934 | |
| 5057 | 0.6 | Ca II 3968 | ||
| 6596 | 0.9 | Mg I 5175 | ||
| 3FGLJ0141.4-0929 | 4197 | 1.0 | Mg II 2796 | |
| 4207 | 0.5 | Mg II 2803 | ||
| 3FHLJ0148.2+5201 | 5654 | 1.3 | Ca II 3934 | |
| 5703 | 1.5 | Ca II 3968 | ||
| 6183 | 0.8 | G-band 4305 | ||
| 3FHLJ0241.3+6543 | 6607 | 2.8 | Na I 5892 | |
| 7358 | -1.7 | Hα 6563 | 1.31041 | |
| 7381 | -2.5 | [N II] 6584 | 2.01041 | |
| 7531 | -2.0 | [SII] 6716 | 1.31041 | |
| 7545 | -1.4 | [SII] 6731 | 8.71040 | |
| 3FHLJ0250.5+1712 | 4890 | 1.7 | Ca II 3934 | |
| 4932 | 1.5 | Ca II 3968 | ||
| 5090 | 0.5 | Hδ 4102 | ||
| 5352 | 0.6 | G-band 4305 | ||
| 6045 | 0.6 | Hβ 4861 | ||
| 6433 | 0.8 | Mg I 5175 | ||
| 6549 | 0.6 | Ca+Fe 5269 | ||
| 7324 | 1.9 | Na I 5892 | ||
| 3FHLJ0423.8+4149 | 6998 | -1.9 | [O III] 5007 | 5.51041 |
| 3FHLJ0433.6+2905 | 5340 | -9.5 | Mg II 2800 | 2.51042 |
| 3FHLJ0500.3+5238 | 4833 | 3.5 | G-band 4305 | |
| 5459 | 3.1 | Hβ 4861 | ||
| 5811 | 1.6 | Mg I 5175 | ||
| 5917 | 2.3 | Ca+Fe 5269 | ||
| 6617 | 4.7 | Na I 5892 | ||
| 7369 | -0.3 | Hα 6563 | 1.71040 | |
| 7393 | -1.3 | [N II] 6584 | 8.71040 | |
| 3FHLJ0506.0+6113 | 6042 | 0.8 | Ca II 3934 | |
| 6096 | 0.6 | Ca II 3968 | ||
| 3FHLJ0600.3+1245 | 4664 | 1.6 | G-band 4305 | |
| 5267 | 1.8 | Hβ 4861 | ||
| 5608 | 2.3 | Mg I 5175 | ||
| 5709 | 1.6 | Ca+Fe 5269 | ||
| 6385 | 3.1 | Na I 5892 | ||
| 7111 | -1.2 | Hα 6563 | 2.31040 | |
| 7133 | -1.8 | [N II] 6584 | 3.51040 | |
| 3FHLJ0601.0+3837 | 6538 | 2.5 | Ca II 3934 | |
| 6596 | 2.0 | Ca II 3968 |
Col.1: Name of the target; Col.2: Barycenter of the detected line; Col.3: Measured equivalent width; Col.4: Line identification; Col.5: Line luminosity.
| Object name | EW | Line ID | Line Lum. | |
|---|---|---|---|---|
| (Å) | (Å) | (erg/s) | ||
| 3FHLJ0602.0+5316 | 4139 | 2.8 | Ca II 3934 | |
| 4176 | 1.5 | Ca II 3968 | ||
| 4529 | 2.1 | G-band 4305 | ||
| 5115 | 0.6 | Hβ 4861 | ||
| 5446 | 1.3 | Mg I 5175 | ||
| 5543 | 0.7 | Ca+Fe 5269 | ||
| 6200 | 1.8 | Na I 5892 | ||
| 3FHLJ0612.8+4122 | 5022 | 1.5 | Fe II 2382 | |
| 5450 | 0.4 | Fe II 2586 | ||
| 5478 | 1.5 | Fe II 2600 | ||
| 5891 | 3.5 | Mg II 2796 | ||
| 5906 | 3.1 | Mg II 2803 | ||
| 3FHLJ0620.6+2645 | 4456 | 2.8 | Ca II 3934 | |
| 4496 | 3.7 | Ca II 3968 | ||
| 4876 | 1.7 | G-band 4305 | ||
| 5507 | 1.2 | Hβ 4861 | ||
| 5863 | 2.6 | Mg I 5175 | ||
| 5969 | 0.8 | Ca+Fe 5269 | ||
| 6676 | 2.1 | Na I 5892 | ||
| 7435 | 0.4 | Hα 6563 | ||
| 3FHLJ0640.0-1254 | 4471 | 0.4 | Ca II 3934 | |
| 4510 | 0.8 | Ca II 3968 | ||
| 4892 | 1.6 | G-band 4305 | ||
| 5525 | 0.7 | Hβ 4861 | ||
| 5882 | 2.2* | Mg I 5175 | ||
| 5988 | 0.7 | Ca+Fe 5269 | ||
| 6697 | 1.4 | Na I 5892 | ||
| 7482 | -0.6 | [N II] 6584 | 4.71040 | |
| 3FHLJ0706.5+3744 | 4344 | 0.4 | Ca II 3934 | |
| 4382 | 0.6 | Ca II 3968 | ||
| 3FHLJ0708.9+2240 | 5100 | 0.4 | Ca II 3934 | |
| 5146 | 0.5 | Ca II 3968 | ||
| 5581 | 0.3 | G-band 4305 | ||
| 6710 | 0.5 | Mg I 5175 | ||
| 6832 | 0.2 | Ca+Fe 5269 | ||
| 3FHLJ0709.1-1525 | 4492 | 5.3 | Ca II 3934 | |
| 4532 | 4.6 | Ca II 3968 | ||
| 4916 | 1.7 | G-band 4305 | ||
| 5552 | 1.9 | Hβ 4861 | ||
| 6017 | 1.3 | Ca+Fe 5269 | ||
| 6729 | 2.3 | Na I 5892 | ||
| 7518 | -1.0 | [N II] 6584 | 3.41040 | |
| 3FHLJ0723.0-0732 | 5226 | 0.5 | Ca II 3934 | |
| 5272 | 0.9 | Ca II 3968 | ||
| 5718 | 0.5 | G-band 4305 | ||
| 3FHLJ0811.9+0237 | 4613 | 4.7 | Ca II 3934 | |
| 4653 | 4.5 | Ca II 3968 | ||
| 5047 | 1.6 | G-band 4305 | ||
| 5700 | 2.7 | Hβ 4861 | ||
| 6069 | 3.0 | Mg I 5175 | ||
| 6178 | 1.9 | Ca+Fe 5269 | ||
| 6910 | 6.0* | Na I 5892 | ||
| 7720 | -0.3 | [N II] 6584 | 9.81039 | |
| 3FHLJ0905.5+1357 | 6128 | -0.7** | [O III] 5007 | 81040** |
| 3FHLJ1253.1+5300 | 4652 | 0.3 | Mg II 2796 | |
| 4664 | 0.2 | Mg II 2803 |
(*) This marker indicates that the line is partially contaminated by a telluric band or the interstellar Na I absorption of our Galaxy,
(**) This is the average EW (EW = 0.5 Å when the source is in high state and EW = 0.9 Å in the low state).
| Object name | EW | Line ID | Line Lum. | |
|---|---|---|---|---|
| (Å) | (Å) | (erg/s) | ||
| 3FHLJ1447.9+3608 | 4859 | 0.4 | Mg II 2796 | |
| 4872 | 0.2 | Mg II 2803 | ||
| 3FHLJ1549.9-0659 | 5578 | 1.1 | Ca II 3934 | |
| 5627 | 0.9 | Ca II 3968 | ||
| 6104 | 0.5 | G-band 4305 | ||
| 3FHLJ1800.5+7827 | 4712 | -8.3 | Mg II 2800 | 2.21043 |
| 3FHLJ1904.1+3627 | 4287 | 6.0 | Ca II 3934 | |
| 4325 | 5.9 | Ca II 3968 | ||
| 4691 | 3.6 | G-band 4305 | ||
| 5298 | 2.6 | Hβ 4861 | ||
| 5640 | 3.5 | Mg I 5175 | ||
| 5742 | 2.1 | Ca+Fe 5269 | ||
| 6421 | 3.6 | Na I 5892 | ||
| 3FHLJ1911.5-1908 | 4242 | -2.8 | [O II] 3727 | 8.31040 |
| 4474 | 4.1 | Ca II 3934 | ||
| 4514 | 2.9 | Ca II 3968 | ||
| 4896 | 3.3 | G-band 4305 | ||
| 5529 | 1.3 | Hβ 4861 | ||
| 5695 | -0.9 | [O III] 5007 | 2.81040 | |
| 5886 | 3.3 | Mg I 5175 | ||
| 5993 | 2.2 | Ca+Fe 5269 | ||
| 6702 | 3.0 | Na I 5892 | ||
| 7448 | -0.7* | [N II] 6548 | 1.51040 | |
| 7465 | -0.6* | Hα 6563 | 1.31043 | |
| 7489 | -2.6 | [N II] 6584 | 6.31040 |
(*) These lines are very faint and blended.


Data availability
The flux calibrated and dereddened spectra are available in our online database ZBLLAC444http://web.oapd.inaf.it/zbllac/.
References
- Abdollahi, et al. (2020) Abdollahi S., et al., 2020, ApJS, 247, 33
- Ahlers & Halzen (2015) Ahlers M., Halzen F., 2015, RPPh, 78, 126901
- Ajello, et al. (2017) Ajello M., et al., 2017, ApJS, 232, 18
- Ajello, et al. (2014) Ajello M., et al., 2014, ApJ, 780, 73
- Álvarez Crespo, et al. (2016) Álvarez Crespo N., et al., 2016, AJ, 151, 32
- Archambault, et al. (2016) Archambault S., et al., 2016, AJ, 151, 142
- Bauer, et al. (2000) Bauer F. E., Condon J. J., Thuan T. X., Broderick J. J., 2000, ApJS, 129, 547
- Bressan, et al. (2006) Bressan A., Falomo R., Valdés J. R., Rampazzo R., 2006, ApJL, 645, L101
- Caccianiga, et al. (2002) Caccianiga A., Marchã M. J., Antón S., Mack K.-H., Neeser M. J., 2002, MNRAS, 329, 877
- Cardelli, Clayton & Mathis (1989) Cardelli J. A., Clayton G. C., Mathis J. S., 1989, ApJ, 345, 245
- Cepa, et al. (2003) Cepa J., et al., 2003, SPIE, 4841, 1739, SPIE.4841
- Cusumano, et al. (2010) Cusumano G., et al., 2010, A&A, 524, A64
- D’Abrusco, et al. (2014) D’Abrusco R., Massaro F., Paggi A., Smith H. A., Masetti N., Landoni M., Tosti G., 2014, ApJS, 215, 14
- D’Abrusco, et al. (2019) D’Abrusco R., et al., 2019, ApJS, 242, 4
- Falomo, et al. (2000) Falomo R., Scarpa R., Treves A., Urry C. M., 2000, ApJ, 542, 731
- Falomo, Pian & Treves (2014) Falomo R., Pian E., Treves A., 2014, A&ARv, 22, 73
- Falomo, et al. (2017) Falomo R., Treves A., Scarpa R., Paiano S., Landoni M., 2017, MNRAS, 470, 2814
- The Fermi-LAT collaboration (2019) Fermi-LAT collaboration, 2019, arXiv, arXiv:1905.10771
- Franceschini, et al. (2017) Franceschini A., Rodighiero G., 2017, A&A, 603, A34
- Ghisellini & Tavecchio (2009) Ghisellini G., Tavecchio F., 2009, MNRAS, 397, 985
- Ghisellini, et al. (2017) Ghisellini G., Righi C., Costamante L., Tavecchio F., 2017, MNRAS, 469, 255
- Giommi, et al. (2002) Giommi P., Perri M., Piranomonte S., Padovani P., 2002, babs.conf, 123, babs.conf
- Giommi, et al. (2013) Giommi P., Padovani P., Polenta G., 2013, MNRAS, 431, 1914
- Hewitt, et al. (1993) Hewitt A., Burbidge G., 1993, ApJS, 87, 451
- Kügler, et al. (2014) Kügler S. D., Nilsson K., Heidt J., Esser J., Schultz T., 2014, A&A, 569, A95
- Landi, et al. (2015) Landi R., Bassani L., Stephen J. B., Masetti N., Malizia A., Ubertini P., 2015, A&A, 581, A57
- Landoni, et al. (2012) Landoni M., Falomo R., Treves A., Sbarufatti B., Decarli R., Tavecchio F., Kotilainen J., 2012, A&A, 543, A116
- Landoni, et al. (2013) Landoni M., Falomo R., Treves A., Sbarufatti B., Barattini M., Decarli R., Kotilainen J., 2013, AJ, 145, 114
- Landoni, et al. (2014) Landoni M., Falomo R., Treves A., Sbarufatti B., 2014, A&A, 570, A126
- Landoni, et al. (2015) Landoni M., Falomo R., Treves A., Scarpa R., Reverte Payá D., 2015, AJ, 150, 181
- Landoni, et al. (2018) Landoni M., Paiano S., Falomo R., Scarpa R., Treves A., 2018, ApJ, 861, 130
- Laurent-Muehleisen, et al. (1998) Laurent-Muehleisen S. A., Kollgaard R. I., Ciardullo R., Feigelson E. D., Brinkmann W., Siebert J., 1998, ApJS, 118, 127
- Laurent-Muehleisen, et al. (1999) Laurent-Muehleisen S. A., Kollgaard R. I., Feigelson E. D., Brinkmann W., Siebert J., 1999, ApJ, 525, 127
- Lawrence, et al. (1996) Lawrence C. R., Zucker J. R., Readhead A. C. S., Unwin S. C., Pearson T. J., Xu W., 1996, ApJS, 107, 541
- Madejski & Sikora (2016) Madejski G., Sikora M., 2016, ARA&A, 54, 725
- Maraschi, et al. (1992) Maraschi L., Ghisellini G., Celotti A., 1992, ApJL, 397, L5
- Marchã & Caccianiga (2013) Marchã M. J. M., Caccianiga A., 2013, MNRAS, 430, 2464
- Marchesi, et al. (2018) Marchesi S., Kaur A., Ajello M., 2018, AJ, 156, 212
- Martí, et al. (2004) Martí J., Paredes J. M., Bloom J. S., Casares J., Ribó M., Falco E. E., 2004, A&A, 413, 309
- Massaro, et al. (2013) Massaro F., Paggi A., Errando M., D’Abrusco R., Masetti N., Tosti G., Funk S., 2013, ApJS, 207, 16
- Massaro, et al. (2015) Massaro F., et al., 2015, A&A, 575, A124
- Meisner & Romani (2010) Meisner A. M., Romani R. W., 2010, ApJ, 712, 14
- Padovani, et al. (2016) Padovani P., Resconi E., Giommi P., Arsioli B., Chang Y. L., 2016, MNRAS, 457, 3582
- Paggi, et al. (2014) Paggi A., et al., 2014, AJ, 147, 112
- Paiano, et al. (2016) Paiano S., Landoni M., Falomo R., Scarpa R., Treves A., 2016, MNRAS, 458, 2836
- Paiano, et al. (2017) Paiano S., Franceschini A., Stamerra A., 2017, MNRAS, 468, 4902
- Paiano et al. (2017a) Paiano S., Landoni M., Falomo R., Treves A., Scarpa R., Righi C., 2017, ApJ, 837, 144
- Paiano et al. (2017b) Paiano S., Landoni M., Falomo R., Treves A., Scarpa R., 2017, ApJ, 844, 120
- Paiano et al. (2017c) Paiano S., Falomo R., Franceschini A., Treves A., Scarpa R., 2017, ApJ, 851, 135
- Paiano et al. (2018) Paiano S., Falomo R., Treves A., Scarpa R., 2018, ApJL, 854, L32
- Paiano et al. (2018) Paiano S., Falomo R., Treves A., Landoni M., Scarpa R., 2018, ATel, 12269, 1
- Paiano et al. (2019) Paiano S., Falomo R., Treves A., Franceschini A., Scarpa R., 2019, ApJ, 871, 162
- Paiano et al. (2019) Paiano S., Falomo R., Treves A., Righi C., Scarpa R., Lindfors E., 2019, ATel, 12802, 1
- Paiano et al. (2019c) Paiano S., Padovani P., Falomo R., Giommi P., Scarpa R., Treves A., 2019, ATel, 13202, 1
- Perlman, et al. (1996) Perlman E. S., et al., 1996, ApJS, 104, 251
- Perlman, et al. (1998) Perlman E. S., Padovani P., Giommi P., Sambruna R., Jones L. R., Tzioumis A., Reynolds J., 1998, AJ, 115, 1253
- Piranomonte, et al. (2007) Piranomonte S., Perri M., Giommi P., Landt H., Padovani P., 2007, A&A, 470, 787
- Pita, et al. (2014) Pita S., et al., 2014, A&A, 565, A12
- Plotkin, et al. (2010) Plotkin R. M., et al., 2010, AJ, 139, 390
- Righi, et al. (2019) Righi C., Tavecchio F., Inoue S., 2019, MNRAS, 483, L127
- Righi, et al. (2019) Righi C., Tavecchio F., Pacciani L., 2019, MNRAS, 484, 2067
- Sbarufatti, et al. (2005a) Sbarufatti B., Treves A., Falomo R., Heidt J., Kotilainen J., Scarpa R., 2005, AJ, 129, 559
- Sbarufatti, et al. (2005b) Sbarufatti B., Treves A., Falomo R., 2005, ApJ, 635, 173
- Sbarufatti, et al. (2006a) Sbarufatti B., Treves A., Falomo R., Heidt J., Kotilainen J., Scarpa R., 2006, AJ, 132, 1
- Sbarufatti, et al. (2006b) Sbarufatti B., Falomo R., Treves A., Kotilainen J., 2006, A&A, 457, 35
- Sbarufatti, et al. (2008) Sbarufatti B., Ciprini S., Kotilainen J., Decarli R., Treves A., Veronesi A., Falomo R., 2008, arXiv, arXiv:0810.3563
- Sbarufatti, et al. (2009) Sbarufatti B., Ciprini S., Kotilainen J., Decarli R., Treves A., Veronesi A., Falomo R., 2009, AJ, 137, 337
- Scarpa, et al. (2000a) Scarpa R., Urry C. M., Falomo R., Pesce J. E., Treves A., 2000, ApJ, 532, 740
- Scarpa, et al. (2000b) Scarpa R., Urry C. M., Padovani P., Calzetti D., O’Dowd M., 2000, ApJ, 544, 258
- Schlafly & Finkbeiner (2011) Schlafly E. F., Finkbeiner D. P., 2011, ApJ, 737, 103
- Shaw, et al. (2013) Shaw M. S., et al., 2013, ApJ, 764, 135
- Shen, et al. (2011) Shen Y., et al., 2011, ApJS, 194, 45
- Stephen, et al. (2010) Stephen J. B., Bassani L., Landi R., Malizia A., Sguera V., Bazzano A., Masetti N., 2010, MNRAS, 408, 422
- Stickel, et al. (1989) Stickel M., Fried J. W., Kuehr H., 1989, A&AS, 80, 103
- Stickel, et al. (1991) Stickel M., Padovani P., Urry C. M., Fried J. W., Kuehr H., 1991, ApJ, 374, 431
- Stickel, et al. (1993) Stickel M., Fried J. W., Kuehr H., 1993, A&AS, 98, 393
- Stickel, et al. (1994) Stickel M., Meisenheimer K., Kuehr H., 1994, A&AS, 105, 211
- Stocke, et al. (1990) Stocke J. T., Morris S. L., Gioia I., Maccacaro T., Schild R. E., Wolter A., 1990, ApJ, 348, 141
- Stocke, et al. (1997) Stocke J. T., Rector T. A., 1997, ApJL, 489, L17
- Takeuchi, et al. (2013) Takeuchi Y., Kataoka J., Maeda K., Takahashi Y., Nakamori T., Tahara M., 2013, ApJS, 208, 25
- Tody (1986) Tody D., 1986, SPIE, 627, 733, SPIE..627
- Tody (1993) Tody D., 1993, ASPC, 52, 173, ASPC…52
- Urry & Padovani (1995) Urry C. M., Padovani P., 1995, PASP, 107, 803
- Urry, et al. (2000) Urry C. M., Scarpa R., O’Dowd M., Falomo R., Pesce J. E., Treves A., 2000, ApJ, 532, 816
- van Dokkum (2001) van Dokkum P. G., 2001, PASP, 113, 1420
- Voges, et al. (1999) Voges W., et al., 1999, A&A, 349, 389
- Zakamska, et al. (2003) Zakamska N. L., et al., 2003, AJ, 126, 2125
- Zhu & Ménard (2013) Zhu G., Ménard B., 2013, ApJ, 770, 130