Does the disk in the hard state of XTE J1752–223 extend to the innermost stable circular orbit?
Abstract
The accreting black-hole binary XTE J1752–223 was observed in a stable hard state for 25 d by RXTE, yielding a 3-140 keV spectrum of unprecedented statistical quality. Its published model required a single Comptonization spectrum reflecting from a disk close to the innermost stable circular orbit. We studied that model as well as a number of other single-Comptonization models (yielding similarly low inner radii), but found they violate a number of basic physical constraints, e.g., their compactness is much above the maximum allowed by pair equilibrium. We also studied the contemporaneous 0.55–6 keV spectrum from the Swift/XRT and found it well fitted by an absorbed power law and a disk blackbody with the innermost temperature of 0.1 keV. The normalization of the disk blackbody corresponds to an inner radius of 20 gravitational radii and its temperature, to irradiation of the truncated disk by a hot inner flow. We have also developed a Comptonization/reflection model including the disk irradiation and intrinsic dissipation, but found that it does not yield any satisfactory fits. On the other hand, we found that the 10 keV band from RXTE is much better fitted by a reflection from a disk with the inner radius 100 gravitational radii, which model then underpredicts the spectrum at 10 keV by 10%. We argue that the most plausible explanation of the above results is inhomogeneity of the source, with the local spectra hardening with the decreasing radius. Our results support the presence of a complex Comptonization region and a large disk truncation radius in this source.
1 Introduction
Broad-band, 1–300 keV, X-ray spectra of black hole (BH) binaries in the (low) hard state (LHS) are often successfully fitted by the sum of three components: blackbody emission from a disk, Comptonization in a hot plasma (sometimes approximated by a power law with an exponential high-energy cutoff), and a reflected spectrum from the plasma irradiating the disk (e.g., Dove et al. 1997; Zdziarski et al. 1998; Done et al. 2007 and references therein). When data at 3 keV are not available, the disk component is usually not detectable, and the spectra can be well fitted by Comptonization and reflection alone (e.g., García et al. 2015; Dziełak et al. 2019). This is, in particular, the case for the RXTE spectrum from the BH X-ray binary XTE J1752–223 studied by García et al. (2018), hereafter G18.
Still, the usual exposure time used to make an X-ray spectrum is several thousands of seconds (and often more), which is much longer than the dominant variability time scale in the LHS of the order of a second (corresponding to the peak of the variability power per logarithm of frequency). The total root-mean-square (rms) variability in the LHS is typically 30–40% (Muñoz-Darias et al., 2011). This means that the fitted X-ray spectra are averaged over many cycles of strong variability. It could be a spectrum of a constant shape varying in its amplitude but rms spectra in this state often decrease with the energy in the X-ray regime, thus inducing significant spectral variability, see, e.g., Gierliński & Zdziarski (2005); Stiele & Yu (2015). This could still correspond to a single Comptonizing region with a variable input of soft seed photons (presumably from the disk), resulting in a pivoting spectrum (Zdziarski et al., 2002; Gierliński & Zdziarski, 2005).
Further constraints on the structure of the sources are obtained from combined spectral/timing analysis. Revnivtsev et al. (1999) showed that X-ray spectra corresponding to different Fourier-frequency ranges of the variability of Cyg X-1 in its LHS become harder with the increasing frequency. Axelsson & Done (2018) performed similar calculations, but fitted the power spectrum with three Lorentzian components, and obtained the X-ray spectra corresponding to each. Similarly, they found that the X-ray spectra harden with the increasing Lorentzian peak frequency. This technique was later used by Mahmoud & Done (2018) and Mahmoud et al. (2019) to develop detailed models of accretion flows fitting simultaneously observational constraints from the spectra, variability and time lags, and showing that there have to be more than one Comptonization component, which also agrees with the spectral/timing analysis of Yamada et al. (2013). In this framework, the hard X-ray lags are interpreted as due to the local spectra becoming harder (Kotov et al., 2001). Therefore, even if a good spectral fit can be found to a time-averaged X-ray spectrum with a single-Comptonization and reflection model, such a model appears to be not physically consistent with combined spectral/timing results.
Here, we consider the case of the LHS of the X-ray binary XTE J1752–223. It is a transient accreting BH binary, and it has had only one outburst so far, in 2009–2010 (Shaposhnikov et al., 2010). The BH nature of the system is inferred from the overall similarity of its properties to known BH systems. The distance, , and binary parameters of the source remain relatively uncertain. Shaposhnikov et al. (2010) estimated kpc and the BH mass of using a correlation method. (We note, however, that the same method yielded for Cyg X-1, much below the current dynamical estimate.) Then, Ratti et al. (2012) estimated kpc based on the flux of the soft-to-hard transition, and kpc including also constraints on the emission of the donor, with some preference for 8 kpc based on the radio/X-ray correlation and consideration of the orbital period. A rough constraint on can also be set from the remarkable similarity of the X-ray hardness-count rate diagram for XTE J1752–223 to that of GX 339–4, shown in fig. 1 of G18. The distance to GX 339–4 was estimated in Zdziarski et al. (2019) as 8–12 kpc, approximately correlated with the BH mass estimate within 4–, which favors a large distance for XTE J1752–223. That hardness-count rate shape is also characteristic of low-inclination BH transients (Muñoz-Darias et al., 2013), which implies . The binary inclination is then limited to (Ratti et al., 2012), while that of the jet to (Miller-Jones et al., 2011).
A remarkable feature of XTE J1752–223 is that, during the rise, it was observed for 25 d by RXTE in a stable LHS, with an almost constant flux and hardness (G18). Still, the source was highly variable on short time scales, with a rms variability in the –15 keV energy range and the 0.002–128 Hz frequency range measured during the first 4 d of the RXTE observations (Muñoz-Darias et al. 2010; hereafter MD10). G18 has obtained the average spectra from the PCA (3–45 keV) and HEXTE (20–140 keV) for all of these observations. This resulted in highly accurate spectra with a 300 ks exposure and very large count numbers, and for the PCA and HEXTE, respectively. In spite of the relatively low energy resolution of the PCA, the accuracy of the calibration and the very high count numbers allow for detailed spectral fits, as shown by G18.
G18 fitted thermal Comptonization and relativistically broadened reflection using the xillver and relxill models (García et al., 2013; Dauser et al., 2016). They found extreme relativistic broadening, with their overall best fits corresponding to the disk inner radius, , very close to the radius of the innermost stable circular orbit (ISCO), , and the primary source forming a ‘lamppost’ (a static point source on the BH rotation axis) very close to the BH horizon radius, . This result can be considered to be one of the best existing arguments for the disk reaching the immediate vicinity of the ISCO in the luminous LHS.
The question whether the disk in accreting BH binaries reaches the ISCO already in the luminous LHS (at of the Eddington luminosity, ) or only in the soft state has, however, been the subject of an intense ongoing debate. Results similar to those of G18 have been obtained in many other studies (e.g., Reis et al. 2008, 2010; García et al. 2015, 2019). On the other hand, spectral fits obtaining significantly truncated disks in the luminous LHS have been obtained as well (e.g., Plant et al. 2015; Basak & Zdziarski 2016; Basak et al. 2017; Dziełak et al. 2019). Significant truncation is also implied by the measured relatively long reverberation lags of soft X-rays responding to variable hard X-rays (De Marco et al., 2015, 2017; Mahmoud et al., 2019), modelling of type C QPOs as precession of the inner hot disk (e.g., Ingram et al. 2016), and accounting for the re-emission of the X-rays absorbed by the disk (Zdziarski & De Marco, 2020).
Given the above arguments in favor of an inhomogeneous accretion flow in the LHS of BHXRBs, and the X-ray timing characteristics of the source (MD10), here we reconsider the RXTE data from XTE J1752–223, with the aim of testing this scenario. Crucially, we also study data from the X-ray Telescope (XRT; Burrows et al. 2000) onboard Neil Gehrels Swift. The XRT performed 10 short observations of XTE J1752–223 during the first 9 days of the RXTE observations. These data, not considered in G18, extend the spectral coverage down to 0.5 keV, allowing us to constrain the presence of a disk blackbody component.
2 Observations
Details about the RXTE observations and their data reduction are given in G18. They combined the 57 individual pointings taken during MJD 55130–55155 using the method of García et al. (2015), which accounts for changes in the hardness ratio, slightly decreasing during these observations, see fig. 1 in G18. Then they applied the calibration corrections of García et al. (2014, 2016b) to the resulting average spectra from the PCA and HEXTE, respectively, aimed at improving the quality of the spectra. We use the same combined and corrected PCA and HEXTE spectral data as G18. The PCA data include a 0.1% systematic error, and none is added to the HEXTE data.
We analyzed the XRT observations carried out during MJD 55130–55138 in the Windowed Timing mode, with the total exposure of 9376 s. The data were reduced following standard procedures (xrtpipeline within HEASOFT v.6.25). Source counts were extracted from a circular region with radius of centered on the source. The background counts were extracted from an annular region centered on the source. We selected only single-pixel events (grade=0). Ancillary response files were generated using the xrtmkarf task, and the response file swxwt0s620090101v015.rmf was used. The spectra were summed into a single spectrum using the ftool addspec, which also creates an appropriate ancillary response file for the summed spectrum. The spectrum has been rebinned requiring the minimum number of channels per bin of 3 and a signal to noise ratio of 50, and a 1% systematic error has been added. We have also looked for a possible contribution of a scattering halo, but found it negligible.
3 Fits to the X-ray Spectra of XTE J1752–223
We study the spectra using the X-ray fitting package xspec (Arnaud, 1996). The reported fit uncertainties are for 90% confidence, .
As in G18, the overall slope of the PCA data is corrected using the model jscrab (Steiner et al., 2010), which multiplies the spectrum by a power law with a residual index difference, (where is defined by the photon number flux ) and a normalization factor of 1.097, to achieve an agreement with the standard Crab results, see G18 for details. The same model is applied to the HEXTE and XRT data with free and the relative normalization. This allows to partially correct for differences between the spectral calibration of the three instruments. As found in G18, the PCA data still suffer from some calibration problems at highest detector energies, which are corrected by adding two narrow Gaussian lines at 29.8 and 43.4 keV. Similarly, as found by MD10, fitting the 1.5–2.5 keV XRT data requires an addition of two instrumental lines, at 1.7 and 2.3 keV. These lines have negligible effect on the fit parameters.
We account for the ISM absorption using the tbabs model (Wilms et al., 2000). We have found that both the fitted value of the H column density as well the actual absorption of low-energy parts of the spectra depend sensitively on the assumed abundances. The fitted absorption is much stronger for the abundances of Wilms et al. (2000) compared to those of Anders & Grevesse (1989). This is especially the case for the XRT data, whose fitting yields unrealistically strong disk blackbody components when using the former abundances. Also, the total Hi and H2 column density in the direction of XTE J1752–223 is111https://www.swift.ac.uk/analysis/nhtot/index.php cm-2 (Willingale et al., 2013), whereas fitting with the former abundances yields almost twice that value. Therefore, we use here the abundances of Anders & Grevesse (1989), except when noted otherwise.
3.1 The XRT spectrum
| keV | |||||
| 94/96 |
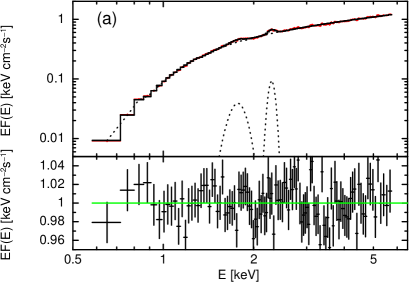
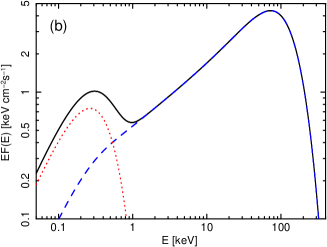
We first consider the XRT spectrum. We fit it in the 0.55–6 keV range with the thermal Comptonization model of Zdziarski et al. (2020), thcomp. This is a convolution model, allowing for Comptonization of a fraction of photons from any form of the seed spectrum. We assume the seed photons have a disk blackbody spectrum (diskbb; Mitsuda et al. 1984). (Adding diskbb to an absorbed power law model has the probability of 10-4 of being by chance.) As stated above, we account for the spectral differences between the instruments using the jscrab model, where we fix at 0.077 and the normalization at 0.83 as found in our overall best-fit model below for the joint XRT/PCA/HEXTE data (which assume a power-law irradiation profile), see Section 3.2.
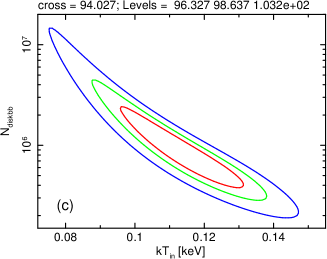
We obtain a very good fit, whose parameters are given in Table 1. It shows the XRT spectrum can be self-consistently accounted for by Compton scattering of a relatively small fraction of the disk blackbody photons. Figures 1a, b show the unfolded spectrum with the absorbed model and the data/model ratio, and the unabsorbed model components, respectively. Since the two parameters of the disk blackbody are anticorrelated, we show their confidence contours on Figure 1c. We see that the power-law-like component dominates down to 1 keV, while the thermal disk has a rather low temperature. The fitted value of is consistent with that of the Galactic column density. We have also tested the effect of switching to the abundances of Wilms et al. (2000). Then, cm-2, , keV, and the is significantly larger, .
We note our value of is different from that of MD10, keV. They used the sum of disk blackbody and a power law, and we thus fitted the XRT data with that model. We obtain keV, very similar to that of the Comptonization model described above. They also used the average of the first three XRT observations only. We repeated this procedure, and also found keV. This also confirms that the obtained low value of is not an artifact of the summing of the individual XRT spectra. We argue that the value given in MD10 might to be a typo considering that their diskbb normalization () at keV yields a disk blackbody flux () 100 times higher than that of the data (which is erg cm-2s-1). This discrepancy disappears for keV.
As we discuss in Section 4.2, the fitted disk blackbody normalization implies the disk inner radius of . If the abundances of Wilms et al. (2000) are used, even larger values are implied. Either is completely incompatible with the inner radius of found in G18. Furthermore, the low inner disk temperature we find implies a large truncation radius as well (Section 4.2). Below, we include the RXTE data in our study, considering possible ways to reconcile them with the findings based on the XRT data.
3.2 Analysis of joint spectra
| # | xspec structure | Description |
|---|---|---|
| 1 | (relxilllpCp+simplcut(relxilllpCp) | PCA/HEXTE, following 3.A of G18, reflection lamppost |
| +xillverCp) | ||
| 2 | (reflkerr_lp+hreflect) | PCA/HEXTE, bottom lamp, reflection = lamppost |
| 3 | (diskbb+reflkerr_lp+hreflect) | XRT/PCA/HEXTE, bottom lamp, reflection = lamppost, additional disk blackbody |
| 4 | (diskbb+reflkerr+hreflect) | XRT/PCA/HEXTE, coronal model with a power-law profile + disk blackbody |
| 5 | (reflkerr_lpbb+hreflect) | XRT/PCA/HEXTE, bottom lamp, reflection = lamppost, quasi-thermal disk emission |
We repeat the analysis of G18 for their model 3.A of the joint PCA/HEXTE spectrum, which is one of their two best models (the other assumes the disk inner radius exactly at the ISCO, ). It assumes a lamppost above a rotating BH with the dimensionless spin of (for which and , where ). The incident spectrum is from thermal Comptonization, using the model nthcomp. Their model also includes thermal Comptonization of a fraction of the reflected emission by the electrons in the lamppost, using the simplcut model of Steiner et al. (2017) and a weak contribution of static reflection from remote parts of the disk (using xillverCp), as given in the xspec notation in Table 2 as Model 1. We used two relxilllpCp components to describe the primary and reflected emission separately, respectively, see the first and second components in Table 2. We note here that relxilllpCp gives the electron temperature, , in the observer’s frame222http://www.sternwarte.uni-erlangen.de/~dauser/research/relxill/, i.e., redshifted with respect to that in the lamppost by , which is given by
| (1) |
We thus set the temperature of the scattering electrons in simplcut to , while the observer’s frame was used in G18 (J. García 2020, private communication). G18 assumed the abundances of Wilms et al. (2000), which we also assume in this model. With the current version (1.3.5) of the relxill family of codes, we find an excellent fit with this model, even better than that reported in G18, with , compared to their 117/89. We obtain lower relativistic blurring than G18, with our best-fit lamppost height at (vs. in G18), (vs. in G18), , and cm-2. However, our new fit has some self-consistency problems. First, of the disk-reflected emission directed toward the observer undergo subsequent scattering in the primary Comptonizing source, which is approximated as a point source. As shown by Dovčiak & Done (2016), much fewer reflected photons would go back to the lamppost, especially given the fitted low disk inclination. Second, the fitted reflection fraction (defined as in Dauser et al. 2016) is , while the value predicted by the lamppost model is 2.08 (as obtained by setting fixReflFrac = 2 in the model), i.e., about four times more.
Thus, we modify Model 1 by setting the reflection fraction equal the lamppost value. Since the PCA data are for 3 keV only, the fitted Galactic absorption column may be not fully correct as well. Therefore, we also impose cm-2 and switch back to the abundances of Anders & Grevesse (1989), based on the fitting the XRT data. However, we have found we are then unable to obtain a good fit, with the best found of only .
Then, we switched to the reflkerr_lp model of Niedźwiecki et al. (2019), shown as Model 2 in Table 2, where the static reflection component hreflect (Niedźwiecki et al. 2019; combining xillver and ireflect, Magdziarz & Zdziarski 1995) accounts for reflection from remote parts of the disk, assumed to be close to neutral. The reflkerr_lp has some advantages over relxilllpCp: it includes the emission of the bottom lamppost, it models the incident Comptonization photon using the compps model of Poutanen & Svensson (1996) (which is significantly more accurate than the nthcomp model used in relxilllpCp), and it uses a correct relativistic treatment of Compton reflection at energies 10 keV, while relxilllpCp uses a non-relativistic treatment (García & Kallman, 2010). At low inclination angles, the gravitationally focused emission from the bottom lamppost enhances the direct emission (Niedźwiecki & Zdziarski, 2018), which then reduces the fractional reflection, which is equivalent to artificially reducing the reflection fraction from its physical value when only the top lamp emission is included (as in relxilllpCp). This effect apparently prevented finding a good fit with the above relxilllpCp model at the physical reflection normalization. Furthermore, we find that the fit with reflkerr_lp no longer requires any scattering of the reflected emission. This has been tested using the thcomp model (instead of simplcut), which is compatible with compps (see Zdziarski et al. 2020) used as the incident spectrum in reflkerr_lp. The incident Comptonization spectrum includes only the scattered photons, since it is emitted by electron scattering in the lamppost. Since the reflkerr_lp model gives both and in the lamppost frame whereas hreflect has parameters almost equal to those in the observer’s frame, we account for the gravitational redshift of the direct lamppost emission by setting the electron and seed temperatures in hreflect equal to , . We obtain an excellent fit with , and , , cm-2 (compatible with the constraint from the XRT spectrum). In this model, the bottom lamp is fully visible, while it is likely to be partially obscured by the fast flow below . We have tested it, and found that the 90% confidence range of the fraction of the bottom-lamp emission being visible is .
Similarly to the previous models for the PCA/HEXTE spectrum, the reflecting medium is found to be strongly ionized, with , where the ionization parameter is defined as
| (2) |
where is the irradiating flux measured at the source in the 0.1–1000 keV photon energy range (J. García 2020, private communication) and is the electron density. For our fitted spectra, this energy range contains most of the bolometric flux, and we hereafter neglect the small inaccuracy resulting from not accounting for the flux beyond this range.
However, we find a number of issues with this model. The gravitational focusing of the bottom lamppost implies a strongly fine-tuned (and very low) inclination, . Then, 72% of the primary photons are captured by the BH. Thus, this model has the radiative efficiency more than three times lower than that of models with negligible photon capture by the BH. This needs to be compensated by increasing the accretion rate, , by a factor of 3, which, as can be inferred from fig. 1 of G18, would make the in the LHS higher than that in the following soft state (which effect was pointed out by Niedźwiecki et al. 2016). In the soft state, most of the X-ray flux is from the intrinsic emission from the disk extending to the ISCO, which is much less affected by the photon trapping than the emission of the lamppost. The electron temperature is keV, for which the Comptonization spectrum peaks around the threshold for e± pair production, 511 keV. The compactness parameter in the lamppost frame for the the fitted height and including all photons is , and that for only photons above the threshold for pair production is . Here, the compactness parameter is defined by
| (3) |
where , and are the lamppost luminosity in the its frame, the Thomson cross section and the electron rest energy, respectively, while the lamppost size, , has been estimated based on its distance to the horizon. As shown, e.g., in fig. 1 of Fabian et al. (2015) (see also Zdziarski 1985; Stern et al. 1995), we expect runaway e± pair production at the above for , i.e., our fit strongly violates the pair equilibrium. Finally, our model has a rather high Fe abundance, , also unlikely to be real. We note that similar problems occur for the original model of G18 as well as for our other lamppost models in this section.
Still, given that the model provides a good phenomenological description of the broad-band model, we apply it to the joint XRT, PCA and HEXTE data, see Model 3 in Table 2. Since these data extend down to 0.55 keV, disk blackbody photons and the seed photons for Comptonization become important. We account for the former using the diskbb model, in which the innermost disk temperature, , is given in the observer’s frame. Disk photons undergoing Comptonization in the lamppost are blueshifted, for which we take account by assuming the seed photon temperature of . Most of those photons are from close to the disk inner edge, and we therefore assume the seed photons have a blackbody distribution. As for the PCA/HEXTE model, we find a good fit with similar parameters (and thus the same problems as discussed above) at , and . The parameters of the disk blackbody are similar to those of the model for the XRT alone, keV, . We note that this component is introduced purely phenomenologically, and we do not yet address the issue whether the inner disk irradiated by a luminous lamppost can keep such a low inner temperature (see Section 3.3 below). The XRT and PCA data appear to be in a relatively good agreement in the overlapping range of 3–6 keV (after correcting for the slope and normalization differences with jscrab).
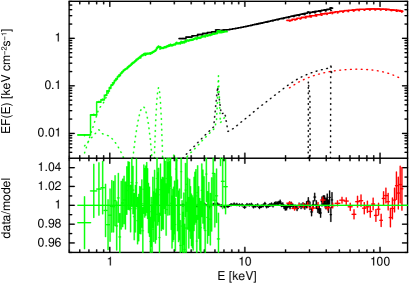
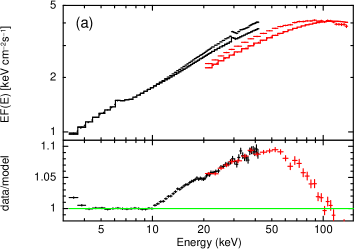
We have also fitted the joint XRT, PCA, HEXTE spectra by a coronal model with a phenomenological power-law radial irradiation profile, see Model 4 in Table 2 and Figure 2. However, this model, while yielding the lowest among the considered models to the XRT/PCA/HEXTE data, , requires an extremely steep profile, , , as well as the disk extending to the ISCO, , and a very high inclination, . Such a steep irradiation profile is unphysical (Niedźwiecki et al., 2016), and the high inclination unlikely. The reflection component is relatively weak, , for the relativistic and remote reflection, respectively. Hereafter, the reflection fraction, , is defined as the ratio of the flux locally emitted by the primary source toward the reflector to that away from it, e.g., for an isotropic source above a slab. The scattering plasma has the parameters of , keV, keV. The bolometric unabsorbed flux of this model is erg cm-2 s-1, and the flux in the Comptonization component is erg cm-2 s-1.
3.3 Quasi-thermal disk emission
The above fits neglect quasi-thermal radiation of the disk due to both re-emission of the power absorbed within the disk and the emission from the likely viscous dissipation (with the flux ). The latter effect is neglected in the reflkerr_lp (and relxilllpCp) model. The former is also effectively neglected because the spectrum below 10 keV is modelled using xillver (García & Kallman 2010; García et al. 2013; G18), which assumes the reflector density of cm-3. At the ionization parameter fitted to the XRT/PCA/HEXTE data of , the flux irradiating the disk is (Equation 2) erg cm-2 s-1. This is several orders of magnitude below the flux irradiating parts of the disk close to the ISCO estimated (following the method of Zdziarski & De Marco 2020) using the possible ranges of the distance and the BH mass of XTE J1752–223. As required by the Stefan-Boltzmann law, the re-emission of the absorbed power occurs at energies higher than those of a blackbody at the effective temperature of the irradiated medium, ,
| (4) |
where is the albedo for backscattering, is the fraction of the internal dissipation power transferred at to a corona or a lamppost (Svensson & Zdziarski, 1994), and is the Stefan-Boltzmann constant. Neglecting and scaling the albedo to typical for reflection from ionized media, we have eV using the above . Consequently, a quasi-thermal re-emission at this can only marginally affect the fitted energy range of 0.55–140 keV.
The above effects are approximately taken into account in the high-density version of the static reflionx radiative transfer code (Ross et al., 1999; Ross & Fabian, 2007; Tomsick et al., 2018), which, when convolved with a code from the relconv family (Dauser et al., 2010, 2013), can describe relativistic reflection/reprocessing spectra in either coronal or lamppost geometry. However, that version of reflionx is not publicly available. Therefore, in order to account for these effects in the disk-lamppost geometry, we have developed a new model, reflkerr_lpbb, described in detail in Appendix A. The irradiating flux at each disk radius is calculated exactly in the lamppost geometry, with the free parameters being and . The intrinsic, dissipative, flux is calculated using the GR disk model of Novikov & Thorne (1973) scaled by (to account for the reduction of the disk emission due to the transfer of energy away from the disk). That model assumes a zero-stress inner boundary condition at the ISCO. The disk accretion rate is calculated from the lamppost luminosity and the accretion efficiency. Then, the disk emission is approximated as a diluted blackbody integrated over the disk surface (and taking into account GR effects) at the color temperatures of , where –1.7 (Davis et al., 2005) is the color correction factor. While using a diluted blackbody is only a rough approximation to the actual reflection spectra, it does reproduce their overall shape, see, e.g., fig. 1 in Zdziarski & De Marco (2020).
Model 5 in Table 2 includes reflkerr_lpbb. We assume the lowest plausible values of the distance of kpc and , and the highest plausible BH mass in a low-mass X-ray binary, . We first allow free and (which parameter here corresponds to the fraction of the incident flux re-emitted below 0.1 keV, see Appendix A). In this model, we have no diskbb component, since its role is now taken over by the diluted blackbody disk emission. In the assumed geometry, a fraction of this emission is then Comptonized in the lamppost, resulting in the incident spectrum. However, taking it into account fully self-consistently would require a convolution version of Comptonization in reflkerr_lpbb, which is at present not available. Therefore, we allow the seed photon temperature for Comptonization to be free. We have obtained a relatively good fit, with and the remaining parameters almost identical to those in the lamppost model without the blackbody component, but the obtained albedo parameter is . However, the actual albedo parameter of the fitted spectrum can be calculated by averaging the reflected spectra over , which yields , almost independent of the radius. Then, the fit of the model with the fixed becomes much worse, with . This is due to pronounced residuals in the XRT energy range related to the predicted (but not present) quasi-thermal component. Its incident spectrum has even higher electron temperature, keV and the compactness parameter is , which strongly violate the pair equilibrium. In addition, 7 times more photons falls into the BH than escapes, which would then imply the hard-state luminosity to be larger than the soft-state one.
Summarizing, we have been able to find good phenomenological models for the broad-band spectrum, either including a diskbb component or without it but including some intrinsic disk emission. However, those models are unambiguously unphysical. They strongly violate the e± pair equilibrium, have an implausibly low radiative efficiency due to photon trapping by the BH, and either include an ad hoc disk blackbody component at a very low or, in the model with intrinsic disk emission and re-radiation, require the albedo parameter to be close to unity, while the actual value is close to a half.
In addition, all of the models show the reflection component to be weak, weaker than 1/4 of that corresponding to a lamppost illuminating a surrounding disk. In the original model of G18, this problem was solved by assuming that 83% of the reflection is then upscattered by hot electrons in the lamppost, which is clearly geometrically impossible (Dovčiak & Done, 2016). In our variant of the lamppost model, this is solved by invoking the gravitationally focused emission of the bottom lamp, which then works only if the inclination is within a narrow range around , requiring fine tuning. The observed reflection can be weak in the coronal geometry, as indeed found in our coronal model, but that broad-band model requires an extreme irradiation profile, , which cannot be physical. A likely solution to the above problems is an inhomogeneity of the primary X-ray source, as we discuss below.
3.4 Inhomogeneity of the X-ray source
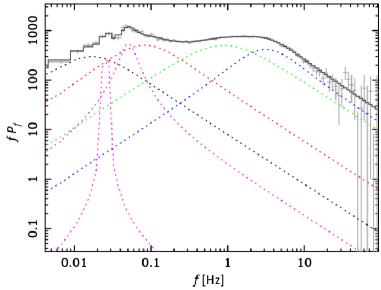
The applicability of models with a single-component Comptonization reflecting from a surrounding disk to XTE J1752–223 is also at odds with results from its X-ray variability studies, which support an inhomogeneous structure. MD10 studied time variability of the first three days of the same PCA data we consider here. They found a complex power spectrum, whose fitting required several separate Lorentzian components. We have obtained the individual power spectra for the entire PCA observation considered here. We have found they can be grouped into three epochs, each corresponding to periods during which the source was stationary, namely MJD 55130–55132, 55133–55148, 55149–55155. Figure 3 shows the first one. The spectrum has indeed a complex shape, which fitting requires six Lorentzian components. We consider it highly unlikely that this complexity is generated in a lamppost irradiating a surrounding disk. MD10 also found pronounced time lags of hard X-rays vs. soft ones, dependent on the Fourier frequency as , which also argue for the primary source being extended in the equatorial plane.
MD10 pointed out the remarkable similarity of the LHS of this source to that of Cyg X-1. For that object, we know well that the Fourier-resolved spectra do strongly depend on the frequency and the primary source appears to be composed of three main Comptonization components (Axelsson & Done, 2018; Mahmoud & Done, 2018). In particular, Mahmoud & Done (2018) show the dominance of the hardest spectral component at 10 keV.
Given the likely inhomogeneity of the source, we have tried to fit different parts of the broad-band spectrum with simple models. In this way, we have found we could fit the part of the PCA spectrum at 10 keV with very simple models. This range is crucial for precise determination of the relativistic broadening of the reflection, as it includes the intrinsically narrow Fe K lines as well as their wings, and the Fe K edge. The range above 10 keV includes the reflection hump, which is very broad, and thus weakly affected by relativistic effects, as well as much more difficult to distinguish from the primary continuum. We also stress that the 3.3–10.1 keV energy range still contains most of the PCA counts, with of out the total of in 17 channels.
If this source is indeed similar to Cyg X-1, this part of the spectrum is likely to be dominated by the outer Comptonizing regions, producing a softer spectrum. Indeed, we find we can achieve a very good fit to those data with a model with a broken-power law incident spectrum and reflection from a static neutral medium at the solar abundances using an absorbed bexrav model (Magdziarz & Zdziarski, 1995) and a narrow Gaussian line at 6.40 keV (as fitted if allowed free), obtaining . The power law breaks from below keV to above it. The reflection is weak, . In this model, the disk inclination has been fixed at . However, we can achieve equally good fits at any inclination ( for ).
While this model does not include the re-emission of absorbed photons, with the Fe K line added with a free normalization, equally good reflection fits can be obtained with either the reflection model xillver or hreflect. However, the best-fit break energy of the incident spectrum in previous fits hints at a soft excess component dominating below 3.8 keV. Therefore, we performed the fits with xillver and hreflect focusing on the energy range 4.1–10.1 keV (15 bins containing counts), thus excluding this component. Since neutral reflection contributes only weakly below 4 keV, this confirms that the Fe Ke line is added to the bexrav model properly. We then consider models taking into account relativistic blurring (using either relxill and reflkerr), but since the data are very well fitted with static reflection, they give only a slight improvement of the fit. In particular, reflkerr (Niedźwiecki et al., 2019) in the coronal geometry gives at , see Table 3 and Figures 4a, b. Figure 4a shows the full energy range of 3–140 keV, where we see a weak soft excess present below 4 keV and an excess at keV, which might be associated with inner, thus harder, Comptonization regions.
| 0.68 | 6/10 |

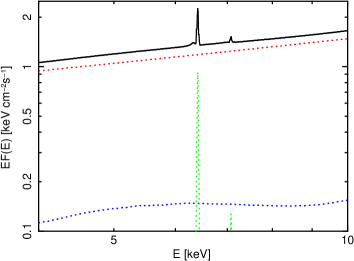
Using the abundances of Wilms et al. (2000) for the ISM absorption yields very similar results (except for higher best-fit values of ). We have also tested a number of other simple models fitted to the 4–10 keV range, but none gave a reasonable fit. For example, an absorbed power law fit yields , and an addition of a Gaussian line (narrow at 6.40 keV at the best fit) yields .
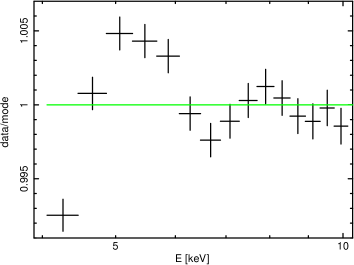
Still, an important problem with the models fitted to the 10.1 keV range is that they require the presence of absorption significantly stronger than that fitted to the XRT data. E.g., the bexrav model yields cm-2, and similar values are obtained in the 4.1–10.1 keV models. This is twice as much as the XRT fit of cm-2. This could be due to either an intrinsic absorption occurring after the end of the Neil Gehrels Swift observations and dominating the average spectrum or a complexity of the intrinsic spectrum, e.g., the presence of another spectral component in addition to the nearly-static reflection. Figure 5 shows the ratio of the 4.1–10.1 keV PCA data to a model with a power law and a static, nearly-neutral, reflection absorbed by cm-2. We have chosen such a model since all of the models fitting the broad-band data in Section 3.2 include static reflection in addition to the relativistic one. The shown residuals can be interpreted as an additional weak Fe K edge and either a moderately broadened and redshifted Fe K line, or a hardening of the spectrum below 5 keV (in addition to a broad Fe K edge). The large fitted value of may also be an effect of fitting the emission of an inhomogeneous source by a single model. As we see in Figure 4a, the presence of a harder contribution is required above 10 keV. However, it will also contribute below 10 keV, implying that the actual 4–10 keV spectrum is concave.
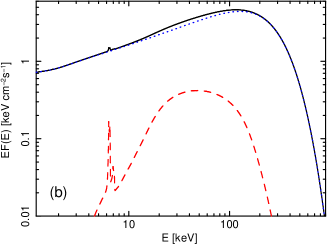
On the other hand, the broad-band fits in Sections 3.2–3.3 show rather different components. Figure 6a shows the data/model ratio resulting from removing the relativistic reflection from the coronal broad-band model, #4 in Table 2. While we see a hardening below 5 keV, we do not see any edge. Figure 6b shows the model components, where we see that the relativistic reflection plays here the role of another continuum component, with hardening both below 5 keV and above 9 keV. Similar decomposition is seen in the other broad-band models of Section 3.2. We note that the contributions to the 4.1–10.1 keV of those models (Section 3.2) is 15, while the very simple model of nonrelativistic reflection and absorption to the same range yields . Thus, while those models do provide relatively good overall description of the broad-band spectrum with , they do not account well for the details of the 4–10 keV range, which contains the Fe K line and edge, crucial for reflection.
Interpretation of these results is not obvious. It is highly remarkable that such simple reflection models fit the data at 10.1 keV very well. But if the absorption column is indeed as measured by the XRT, these models require that the incident continuum is curved in a way emulating the extra absorption. On the other hand, highly relativistic models fit relatively well the full broad-band data. However, their parameters are clearly unphysical, as discussed in Sections 3.2–3.3.
4 Mutual Connection of Disk Blackbody, Comptonization and Reprocessing
4.1 The Formalism
We discuss here a way in which the disk blackbody, reflection and primary (Comptonization) spectral components can be connected in a self-consistent way. Namely, a fraction, , of the blackbody emission (with the luminosity ) is Compton upscattered to form the primary component with the luminosity (though a part of the Comptonization component may be from upscattering of synchrotron photons). The same fraction of the reflection spectrum is Comptonized in the hot medium, which main effect is to reduce the observed normalization of that spectrum by a factor . Thus, the actual reflection relative fraction can be estimated as .
The reflection component originates from irradiation of the cold medium by the primary radiation. That reflection and the associated emission line spectrum, fitted to the X-ray data, contain only a fraction of the irradiating flux. The remainder of it is absorbed and reemitted as a reprocessed spectrum, roughly resembling a disk blackbody when integrated over the disk surface (Zdziarski & De Marco, 2020). The relative reflection fraction, , and the backscattering albedo, (–0.7 for typical LHS spectra; Zdziarski & De Marco 2020), determine the amount of the quasi-thermal re-emission contributing to the disk blackbody. This contribution can be approximately estimated from the total irradiating luminosity of
| (5) |
where is the observed flux in the Comptonization component. Note that estimated here from is not necessarily the total luminosity emitted by the Comptonizing plasma. In a disk-corona geometry, is is only the luminosity emitted outward. The remaining contribution to the disk blackbody emission is from the internal dissipation. The contribution to the disk blackbody emission at the disk inner edge due to irradiation has the color temperature , which is given by
| (6) | |||
| (7) |
where is the inner color temperature fitted in the disk blackbody component, is that due to the intrinsic dissipation, is the color correction, and an irradiation profile (as in the disk blackbody) is assumed to relate the irradiating flux to (Zdziarski & De Marco, 2020). Note that since is required, this gives a lower limit on based on the value of and independently of the fitted disk blackbody normalization.
For the blackbody emission of the disk, we use here the diskbb model, which does not include the zero-stress boundary condition at the inner radius. Its dimensionless normalization, , is related to the disk inner radius as
| (8) |
where . Note that this gives a constraint on based on the normalization and only, and independent of the fitted . This constraint can be compared to from reflection spectral fitting.
Equation (8) can be inserted in Equation (6), yielding
| (9) |
Notably, this estimate is independent of , and . It then constrains via Equation (7) and since , it serves as a self-consistency check of a fitted model.
The observed energy-integrated flux and the luminosity in the disk blackbody are
| (10) | |||
| (11) |
respectively. The mass accretion rate is333Note that if the zero-stress inner boundary term were included in the disk blackbody model, a factor of 3 would appear in the denominator.
| (12) |
where is given by Equations (7) and (9). Then, is related to the bolometric luminosity,
| (13) |
where is the accretion efficiency.
Five quantities obtained (with uncertainties) from fitting a given set of observations are , , , and . Then, the quantities estimated within some either theoretical or observational uncertainty ranges are , , , , , , while is an inferred source parameter. The above equations allow us to constrain the source parameters and check their self-consistency.
Then, the fitted values of and constrain the flow geometry. The effective solid angle that the disk subtends as seen by the hot flow is , and the solid angle that the Comptonizing region subtends as seen by the disk is . Given the inhomogeneity of the source, those quantities correspond to average values describing the accretion flow.
4.2 Constraints on the Hard State of XTE J1752–223
We use the value of from Table 3, , keV, from Table 1, and erg cm-2 s-1, which is the Comptonization flux of the broad-band XRT/PCA/HEXTE model shown in Figure 2. However, we set the lower limit on equal to zero, accounting for uncertainties in the geometry and the effect of Compton scattering on the reflection spectrum. Then, the above value of is to be considered tentative given the caveat regarding the value of given in Table 3; however, that is the lowest of all of the considered models, which is conservative choice, minimizing the efffect of the thermal re-emission of a part of the irradiating flux. We assume , but the results depend relatively weakly on that within the likely range of . We consider (Davis et al., 2005), (Zdziarski & De Marco, 2020), and kpc as likely allowed ranges. We calculate the uncertainty ranges of the derived parameters from the extrema of the above parameters, which is a conservative approach, yielding larger uncertainties than those from the propagation of errors.
We first consider constraints on the radius. Our fits yield three independent constraints,
| (14) | |||
| (15) | |||
| (16) |
The first one, Equation (14), follows from the reflection fit to the 4.1–10.1 keV PCA data, Table 3. While it should be considered tentative, it agrees relatively well with the other two. The next constraint, Equation (15), follows solely from the normalization of the disk blackbody fit, Table 1, and it yields for , kpc, . The final constraint, Equation (16), is due to the irradiation, see Equations (6–7), and is determined by the reflection fraction, the irradiating flux, and the inner temperature and the scattered fraction of the disk blackbody.
Then, Equation (9) yields a constraint on independent of , and . We obtain keV, while we require it to be keV. Within these uncertainties, no constraint on is found. Independent of that value, the irradiation requires a large truncation radius, , as implied by Equation (16) for , kpc, .
We then consider the constraints on . The bolometric luminosity from Equation (13) is erg s-1. This corresponds to (0.06– (at the H fraction of ), and to the actual accretion rate of
| (17) |
On the other hand, the maximum from Equation (12) at the maximum possible keV is g s-1. This, in principle, allows for . However, given that the PCA count rate in this LHS is quite close (G18) to that of the following soft state, where we expect and higher than in the LHS, values of in the LHS are ruled out. Thus, this luminous LHS accretion flow appears to have , in agreement with the theoretical prediction of Yuan & Narayan (2014), see their fig. 2.
These considerations show that a large disk truncation radius in XTE J1752–223 is implied by three independent constraints. One is given by the tentative result of the fit to the PCA spectrum at 10 keV (Section 3.4), indicating that the reflection component present in XTE J1752–223 is only weakly blurred by relativistic effects. This estimate of the truncation radius is then in agreement with the XRT data, which were not studied in G18. Indeed, the normalization of the disk blackbody model fitted to the XRT data yields (Equation 15). Moreover, the fitted inner temperature of the same model is so low that irradiation of the disk by the primary source has to be weak, requiring (Equation 16), which constraint is independent of the previous one. Thus, all three constraints taken together rule out models with the disc extending to the vicinity of the ISCO.
5 Summary and Discussion
In Section 3.1, we fitted the 0.55–6 keV spectrum of XTE J1752–223 from the XRT covering the first 9 days of the RXTE observations. This spectrum can be fitted by a disk blackbody and either a power law or thermal Comptonization. In either case, we obtained a large normalization of the disk blackbody with, , and a very low inner temperature of 0.1 keV. This normalization implies a large disk truncation radius, (where the limit depends on the uncertain color correction, BH mass and the distance, see Section 4.2). The obtained temperature is one of the lowest measured in luminous hard states of accreting BH binaries.
We then studied the 3–140 keV spectra from RXTE, first those data alone and then jointly with the XRT data (Section 3.2). We can find well-fitting models in either case. The models require the disk to extend relatively close to the BH, , i.e., much less than the required by the XRT fits. However, all of the lamppost models have the luminosity measured in the lamppost frame exceeding the threshold for e± pair equilibirum by factors , leading to runaway pair production. In addition, most of the emitted photons are captured by the BH, implying the mass accretion rate in that hard state exceeding that in the following soft state, which is unlikely. Also, the observed flux in the disk-reflected photons is significantly lower than the one implied by the lamppost geometry. A possible solution to this problem is the presence of a gravitationally focused emission from the bottom lamp; this, however, requires the inclination to be in a narrow range around . We also tested a coronal-like model with a power-law irradiation profile, finding the best fit with an extremely steep index of , which is not physical. Thus, while we can find phenomenological models of the broad-band spectrum, they violate a number of physical constraints.
Then, we considered the effects of the intrinsic disk dissipation and quasi-thermal re-emission of the absorbed part of the irradiating flux. To account for that, we have developed a new xspec lamppost model, reflkerr_lpbb, described in Appendix A. We found that imposing a correct value of the backscattering albedo prevents a satisfactory fit to the joint data, as well as the obtained model with a high violates the pair equilibrium in an extreme way and requires most of the emitted photons to be captured by the BH.
These results strongly suggest that the X-ray source in XTE J1752–223 is inhomogeneous, in agreement with the independent timing results obtained by MD10, and in agreement with recent results for other accreting BH binaries (e.g., Mahmoud et al. 2019). We considered this possibility in Section 3.4. We found that the spectrum from the PCA at 10.1 keV (containing 64% of the total of counts) is very well fitted with almost static Compton reflection, with the disk inner radius constrained to . The reflecting medium is weakly ionized and at the Fe abundance close to the solar value. In particular, the of the best fit to the 4.1–10.1 keV range is three times lower than the contributions to that band of the best-fit broad-band models of Section 3.2. This energy range is crucial to precisely constrain the relativistic broadening since it contains the intrinsically sharp Fe K lines and edges. The 10.1 keV fit underpredicts the observed spectrum at higher energies up to the maximum of 10%. This appears to be due to the inhomogeneity of the accretion flow, which emission becomes harder with the decreasing radius, as evidenced, e.g., by the observed hard X-ray lags. However, our models for the energy range 10.1 keV require the absorbing column density to be about twice the value determined from the XRT fit. This is an important caveat, to which we have found no qualitative solution.
Our finding that the apparent relativistic effects strongly increase when spectra at 10 keV are included in fits appears to be due to the upward spectral curvature at those energies. This results in either the fitted reflection being stronger and/or the fitted incident continuum being harder than those implied by the data at 10 keV. In the case of the broad-band fits of Section 3.2–3.3, both of these effects are present. Since the 10 keV data show only weak Fe K line and edge, the stronger reflection component implied by the upturn at 10 keV when fitted as a reflection hump needs to be heavily blurred in order to resemble another continuum component. Then, the included remote reflection accounts for the narrow Fe K line present in the data. This is clearly seen in Figure 6b, where we see that the reflection spectrum in one of those fits is virtually featurless. Also, it is significantly stronger than the reflection implied by the fit for 10 keV. We argue this is a signature of a more complex, spectrally inhomogeneous, primary continuum, as also suggested by timing results of these and other sources.
We note that Nowak et al. (2011) found that the spectra of Cyg X-1 also show spectral upturns above 10 keV stronger than those expected from the presence of their fitted reflection. Then, the effect we have found may explain the discrepancy between the results of Basak & Zdziarski (2016), who fitted the XMM-Newton spectra of the LHS of GX 339–4 below 10 keV finding only weak relativistic broadening of reflection, and those of García et al. (2015); Wang-Ji et al. (2018), who fitted broad-band data finding much stronger relativistic effects. However, while we have found a good agreement between the truncation radii from both the normalization of the disk blackbody and reflection fits, Basak & Zdziarski (2016) found that imposing those two fit radii to be equal led to an unlikely behavior of the inner radius (decreasing with the increasing spectral hardness) for seven LHS observations of GX 339–4. As we have pointed out, the disk blackbody model remains approximately valid in the presence of irradiation, which only increases the inner temperature with respect to the case with intrinsic disk dissipation only. Thus, irradiation alone does not explain that result. It may be explained by the presence of a soft X-ray excess in addition to the disk blackbody in GX 339–4 with the fitted model not including the former. On the other hand, the XRT data for XTE J1752–223 do not show any soft excess.
The spectrum irradiating the disk implied by the 4.1–10.1 keV fits when extrapolated to higher energies accounts for only 90% of the spectrum at 50 keV, thus showing that an additional, harder, spectral component is required. Without detailed studies of the timing properties of XTE J1752–223 (which is beyond the scope of this paper), the spectral shapes of the two components cannot be reliably constrained.
In Section 4, we developed a formalism to self-consistently connect the parameters of the disk blackbody, Comptonization, reflection/reprocessing and the mass accretion rate. Based on it, we have found that both the disk blackbody normalization and the bolometric flux of the incident spectrum when constrained to yield the irradiation temperature of 0.1 keV imply . Thus, the strong truncation is implied in two independent ways and in agreement with the result for the spectrum at energies 10.1 keV.
The disk at and the hot flow only at would imply small values of and . The moderate values found from the fits imply that there is an overlap between the disk and the hot flow, allowing then their stronger mutual interaction (Poutanen et al., 2018).
The methods developed in this work can also be applied to the LHS of other accreting BH binaries. The evidence for the disk being close to the ISCO at 1% of appears to be exclusively based on results of broad-band spectral fitting. It would be highly interesting to see whether constraining the fitted energy band to 10 keV systematically leads to an increase of the truncation radius.
An interesting issue is also possible inhomogeneity of the X-ray sources in AGNs, in particular in radio-quiet Seyfert galaxies, which have X-ray spectra often similar to those in the LHS of accreting BH binaries. The approach developed in this work can be applied to those sources.
6 Main Conclusions
Broad band fits assuming a single Comptonization region imply small truncation radii, but yield unphysical results from other points of view. The irradiation model developed by us, which still assumes a single Comptonization region, yields unsatisfactory fits. On the other hand, our analysis of the 4–10 keV spectrum suggests an inhomogeneity of the X-ray source. We conclude that such a solution may solve these discrepancies.
Acknowledgments
We thank Javier García for providing us with the average RXTE spectra and for comments as the referee of the original version of this paper. We have benefited from discussions during Team Meetings of the International Space Science Institute (Bern), whose support we acknowledge. We also acknowledge support from the Polish National Science Centre under the grants 2015/18/A/ST9/00746 and 2019/35/B/ST9/03944, and the European Union’s Horizon 2020 research and innovation program under the Marie Skłodowska-Curie grant agreement No. 798726.
Appendix A Lamppost with quasi-thermal emission
Our new lamppost model, reflkerr_lpbb444http://users.camk.edu.pl/mitsza/reflkerr, extends the reflkerr_lp model (Niedźwiecki et al., 2019) by accounting for two effects. One is the re-emission of the irradiating flux absorbed by the disk taking place as quasi-thermal emission satisfying the Stefan-Boltzmann law. The other is the intrinsic disk emission, due to the viscous dissipation.
We consider two X-ray sources (lamps) symmetrically located at the height at each side of the disk truncated at . The luminosity of each lamp measured at infinity is . We assume that the lamps are cooled by thermal Comptonization and the spectrum of the emitted radiation is described by compps (with , , as free parameters of the spectrum) for the spherical geometry, so their intrinsic emission is isotropic. We use the GR transfer functions of our reflkerr_lp model to find the directly observed flux, , and the flux irradiating the disk at the distance , . The local reflection spectrum for a given is given by the hreflect model, which uses either xillver or xillverCp at keV, which assume the reflector density of cm-3. The above features are identical to those in reflkerr_lp, except that in order to determine the amplitude of the irradiating flux we need to specify the distance to the source, , and the BH mass, , which are therefore free parameters of reflkerr_lpbb.
As follows from Equation (2), at typical values of the ionization parameter of erg cm s-1 has values characteristic to active galactic nuclei, but much lower than those expected in accreting BH binaries. Therefore, a major part of the absorbed flux in the model is re-emitted below 0.1 keV (which is the minimum energy at which xillver spectra are calculated in xspec), whereas it is, in reality, re-emitted at higher energies in BH binaries (e.g., Zdziarski & De Marco 2020). In order to account for this, we assume that the part of the irradiating flux falling below 0.1 keV in xillver is thermalized and re-emitted as a local diluted blackbody radiation with the effective temperature given by Equation (4). (This is similar to the approach of Poutanen et al. 2018 except that they used a fixed blackbody temperature of 50 eV.) Here, we call the fraction of the incident flux re-emitted above 0.1 keV the albedo parameter, . This is larger than the exact albedo (which corresponds to the backscattering only) since spectra from xillver, xillverCp at erg cm s-1 and are dominated by backscattering at –1 keV only (see García et al. 2016a) as well as they contain the Fe K complex at 6–7 keV. However, this approach is conservative in the sense it underestimates the average energy at which the absorbed flux is re-emitted, since the actual re-emitted spectra shift to higher energies with the increase of (and thus with the corresponding increase of ; García et al. 2016a). Therefore, departures from models neglecting re-emission, e.g., reflkerr_lp, are minimized. Further, we can achieve the conservation of energy. The model has as a free parameter. After fitting, we can check whether the used value was correct. For that, we need to average the hreflect spectra for the best-fit parameters over the viewing angle, in order to determine the total luminosity emitted by the disk.
Similarly as in reflkerr_lp, we allow to scale by , in which case both the reflected and the thermally re-emitted components are self-consistently scaled by the same factor. However, the results presented in this paper correspond to the actual values predicted for the lamppost geometry, i.e. .
In reflkerr_lpbb, is determined by the total observed flux in the Comptonization component, corrected by the light-bending factor (i.e. light-bending reduction of the direct radiation from the top lamp and enhancement of radiation from the bottom lamp, if it is visible), and the distance, . We determine the accretion rate, , at which the accretion flow is able to power the two lamps, using the relation , where and are the efficiencies of the accretion flow at and , respectively, and the fraction of the power dissipated at which is transfered outside the disk, , is a free parameter. Following Thorne (1974), we find the accretion efficiencies, and , where is the energy of a particle with the rest-mass at the circular orbit at . For we have , whereas is the efficiency of an untruncated disk, e.g., for and for .
We use the formula of Page & Thorne (1974) for the local energy release per unit area of the disk accreting at , . The effective temperature of the sum of the thermally radiated part of the locally dissipated energy and the thermalized fraction of the locally irradiating flux is given by Equation (4). For illustration purposes, we also define and , cf. Equation (7).
We approximate the local spectrum of the quasi-thermal emission by a diluted blackbody,
| (A1) |
where is the Planck function, is the spectral hardening factor and is locally observed color temperature. For the angular distribution of local disk emission we use
| (A2) |
where is the specific intensity in the disk rest frame, , is the angle with respect to the normal to the disk measured in the disk rest frame, is for a locally isotropic emission and is for the classical scattering limit. is then convolved with the disk-to-observer transfer functions of the reflkerr model to find the observed spectrum of the quasi-thermal emission.
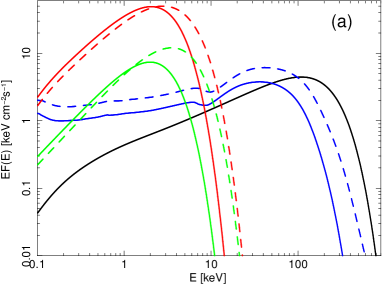
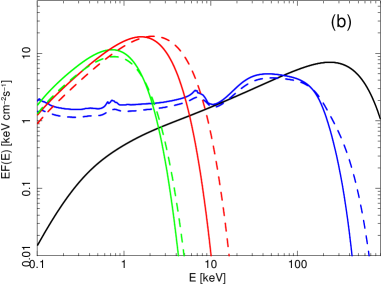
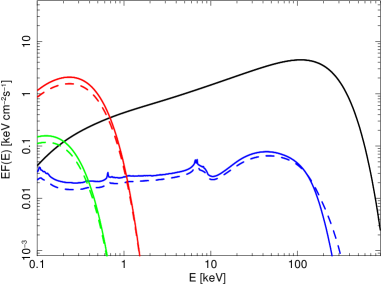
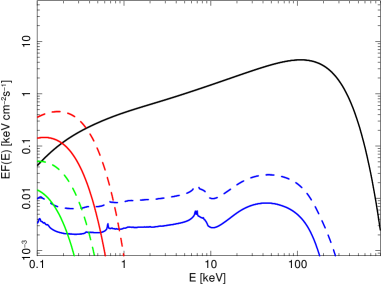
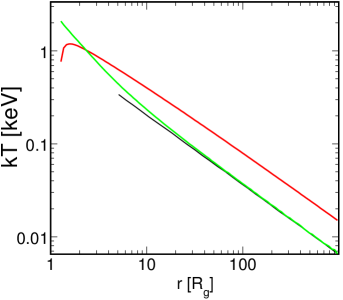
Example temperature profiles are shown in Figure 7 and the corresponding observed spectra for a model with an untruncated disk are shown in Figure 8. Note that strongly differs from at . As a result, the relative contributions of the quasi-thermal emissions due to irradiation and due to internal dissipation will strongly depend on the inclination, , as can be seen in Figure 8.
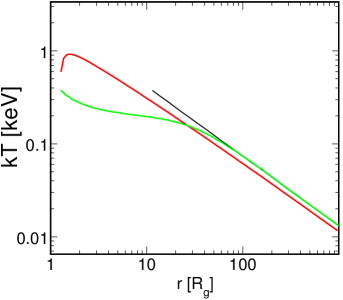
Figures 9 and 10 show spectra for the disk truncated at for and 1, which allows us to illustrate the effect of the bottom lamp. Here is the attenuation factor of the bottom lamp; means that the region at is fully transparent, for the bottom lamp is fully obscured, see also fig. A2 in Niedźwiecki et al. (2019). For , the direct Comptonization component is enhanced by the (gravitationally focused) emission of the bottom lamp, while the reflection as well as the thermalized re-emission remain almost the same as for . However, this is seen as a decrease of the amplitudes of the latter two components, as in all our plots the primary component has the same normalization at 1 keV. This effect is angle-dependent, because the contribution from the bottom lamp strongly depends on .
We then compare the features of our model with those of the high-density version of the reflionx code (Ross et al., 1999; Ross & Fabian, 2007; Tomsick et al., 2018), to which a relativistic convolution model of the relconv family (Dauser et al., 2010, 2013) can be applied. The reflionx model gives the reflection and reprocessing spectrum for a single value of the illuminating flux, which follows from the fitted values of and . It can also include a contribution from a single value intrinsic dissipation. Thus, this spectrum consists of a quasi-thermal component corresponding to a single value of the effective temperature, while our model takes account of the distribution of in the disk. On the other hand, reflionx spectra are obtained in a self-consistent way, though more approximately than the spectra from the xillver models (which, however, can be used at this time only up to cm-3). This is a major advantage of the high-density reflionx model. These spectra are then convolved with relativistic effects for a given geometry, either assuming a phenomenological irradiation profile approximating a corona or a lamppost. Thus, the range of the radius from which the reflection/reprocessing takes place is taken into account only in the relativistic effects, but not in the intrinsic emission.
Finally, we comment on our parametrization of the lamppost power. It assumes that the total accretion efficiency is that of the standard GR disk models, and that efficiency is divided into powering the intrinsic disk emission and the lamppost. Therefore, the actual disk emission is weaker than that of the standard model (Novikov & Thorne, 1973). On the other hand, models of jets usually assume the jet power, , to be independent of the disk dissipation and express it in units of , where is obtained from the observed disk emission, usually assuming a large efficiency, e.g., (Zamaninasab et al., 2014). The distribution of estimated using different methods based on observations exceeds unity, e.g., Pjanka et al. (2017). However, the actual can be underestimated in this procedure if a part of the power from the disk dissipation is transferred to the jet and/or the disk is truncated, in which cases the accretion efficiency will be lower.
References
- Anders & Grevesse (1989) Anders, E., & Grevesse, N. 1989, Geochim. Cosmochim. Acta, 53, 197, doi: 10.1016/0016-7037(89)90286-X
- Arnaud (1996) Arnaud, K. A. 1996, Astronomical Society of the Pacific Conference Series, Vol. 101, XSPEC: The First Ten Years, ed. G. H. Jacoby & J. Barnes, 17
- Axelsson & Done (2018) Axelsson, M., & Done, C. 2018, MNRAS, 480, 751, doi: 10.1093/mnras/sty1801
- Basak & Zdziarski (2016) Basak, R., & Zdziarski, A. A. 2016, MNRAS, 458, 2199, doi: 10.1093/mnras/stw420
- Basak et al. (2017) Basak, R., Zdziarski, A. A., Parker, M., & Islam, N. 2017, MNRAS, 472, 4220, doi: 10.1093/mnras/stx2283
- Burrows et al. (2000) Burrows, D. N., Hill, J. E., Nousek, J. A., et al. 2000, SPIE, 4140, 64, doi: 10.1117/12.409158
- Dauser et al. (2016) Dauser, T., García, J., Walton, D. J., et al. 2016, A&A, 590, A76, doi: 10.1051/0004-6361/201628135
- Dauser et al. (2013) Dauser, T., García, J., Wilms, J., et al. 2013, MNRAS, 430, 1694, doi: 10.1093/mnras/sts710
- Dauser et al. (2010) Dauser, T., Wilms, J., Reynolds, C. S., & Brenneman, L. W. 2010, MNRAS, 409, 1534, doi: 10.1111/j.1365-2966.2010.17393.x
- Davis et al. (2005) Davis, S. W., Blaes, O. M., Hubeny, I., & Turner, N. J. 2005, ApJ, 621, 372, doi: 10.1086/427278
- De Marco et al. (2015) De Marco, B., Ponti, G., Muñoz-Darias, T., & Nandra, K. 2015, ApJ, 814, 50, doi: 10.1088/0004-637X/814/1/50
- De Marco et al. (2017) De Marco, B., Ponti, G., Petrucci, P. O., et al. 2017, MNRAS, 471, 1475, doi: 10.1093/mnras/stx1649
- Done et al. (2007) Done, C., Gierliński, M., & Kubota, A. 2007, A&A Rev., 15, 1, doi: 10.1007/s00159-007-0006-1
- Dove et al. (1997) Dove, J. B., Wilms, J., Maisack, M., & Begelman, M. C. 1997, ApJ, 487, 759, doi: 10.1086/304647
- Dovčiak & Done (2016) Dovčiak, M., & Done, C. 2016, Astronomische Nachrichten, 337, 441, doi: 10.1002/asna.201612327
- Dziełak et al. (2019) Dziełak, M. A., Zdziarski, A. A., Szanecki, M., et al. 2019, MNRAS, 485, 3845, doi: 10.1093/mnras/stz668
- Fabian et al. (2015) Fabian, A. C., Lohfink, A., Kara, E., et al. 2015, MNRAS, 451, 4375, doi: 10.1093/mnras/stv1218
- García & Kallman (2010) García, J., & Kallman, T. R. 2010, ApJ, 718, 695, doi: 10.1088/0004-637X/718/2/695
- García et al. (2013) García, J. A., Dauser, T., Reynolds, C. S., et al. 2013, ApJ, 768, 146, doi: 10.1088/0004-637X/768/2/146
- García et al. (2016a) García, J. A., Fabian, A. C., Kallman, T. R., et al. 2016a, MNRAS, 462, 751, doi: 10.1093/mnras/stw1696
- García et al. (2016b) García, J. A., Grinberg, V., Steiner, J. F., et al. 2016b, ApJ, 819, 76, doi: 10.3847/0004-637X/819/1/76
- García et al. (2014) García, J. A., McClintock, J. E., Steiner, J. F., Remillard, R. A., & Grinberg, V. 2014, ApJ, 794, 73, doi: 10.1088/0004-637X/794/1/73
- García et al. (2015) García, J. A., Steiner, J. F., McClintock, J. E., et al. 2015, ApJ, 813, 84, doi: 10.1088/0004-637X/813/2/84
- García et al. (2018) García, J. A., Steiner, J. F., Grinberg, V., et al. 2018, ApJ, 864, 25, doi: 10.3847/1538-4357/aad231
- García et al. (2019) García, J. A., Tomsick, J. A., Sridhar, N., et al. 2019, ApJ, 885, 48, doi: 10.3847/1538-4357/ab384f
- Gierliński & Zdziarski (2005) Gierliński, M., & Zdziarski, A. A. 2005, MNRAS, 363, 1349, doi: 10.1111/j.1365-2966.2005.09527.x
- Ingram et al. (2016) Ingram, A., van der Klis, M., Middleton, M., et al. 2016, MNRAS, 461, 1967, doi: 10.1093/mnras/stw1245
- Kotov et al. (2001) Kotov, O., Churazov, E., & Gilfanov, M. 2001, MNRAS, 327, 799, doi: 10.1046/j.1365-8711.2001.04769.x
- Magdziarz & Zdziarski (1995) Magdziarz, P., & Zdziarski, A. A. 1995, MNRAS, 273, 837
- Mahmoud & Done (2018) Mahmoud, R. D., & Done, C. 2018, MNRAS, 480, 4040, doi: 10.1093/mnras/sty2133
- Mahmoud et al. (2019) Mahmoud, R. D., Done, C., & De Marco, B. 2019, MNRAS, 486, 2137, doi: 10.1093/mnras/stz933
- Miller-Jones et al. (2011) Miller-Jones, J. C. A., Jonker, P. G., Ratti, E. M., et al. 2011, MNRAS, 415, 306, doi: 10.1111/j.1365-2966.2011.18704.x
- Mitsuda et al. (1984) Mitsuda, K., Inoue, H., Koyama, K., et al. 1984, PASJ, 36, 741
- Muñoz-Darias et al. (2013) Muñoz-Darias, T., Coriat, M., Plant, D. S., et al. 2013, MNRAS, 432, 1330, doi: 10.1093/mnras/stt546
- Muñoz-Darias et al. (2011) Muñoz-Darias, T., Motta, S., & Belloni, T. M. 2011, MNRAS, 410, 679, doi: 10.1111/j.1365-2966.2010.17476.x
- Muñoz-Darias et al. (2010) Muñoz-Darias, T., Motta, S., Pawar, D., et al. 2010, MNRAS, 404, L94, doi: 10.1111/j.1745-3933.2010.00842.x
- Niedźwiecki et al. (2019) Niedźwiecki, A., Szanecki, M., & Zdziarski, A. A. 2019, MNRAS, 485, 2942, doi: 10.1093/mnras/stz487
- Niedźwiecki & Zdziarski (2018) Niedźwiecki, A., & Zdziarski, A. A. 2018, MNRAS, 477, 4269, doi: 10.1093/mnras/sty873
- Niedźwiecki et al. (2016) Niedźwiecki, A., Zdziarski, A. A., & Szanecki, M. 2016, ApJ, 821, L1, doi: 10.3847/2041-8205/821/1/L1
- Novikov & Thorne (1973) Novikov, I. D., & Thorne, K. S. 1973, in Black Holes (Les Astres Occlus), ed. C. Dewitt & B. S. Dewitt, 343–450
- Nowak et al. (2011) Nowak, M. A., Hanke, M., Trowbridge, S. N., et al. 2011, ApJ, 728, 13, doi: 10.1088/0004-637X/728/1/13
- Page & Thorne (1974) Page, D. N., & Thorne, K. S. 1974, ApJ, 191, 499, doi: 10.1086/152990
- Pjanka et al. (2017) Pjanka, P., Zdziarski, A. A., & Sikora, M. 2017, MNRAS, 465, 3506, doi: 10.1093/mnras/stw2960
- Plant et al. (2015) Plant, D. S., Fender, R. P., Ponti, G., Muñoz-Darias, T., & Coriat, M. 2015, A&A, 573, A120, doi: 10.1051/0004-6361/201423925
- Poutanen & Svensson (1996) Poutanen, J., & Svensson, R. 1996, ApJ, 470, 249, doi: 10.1086/177865
- Poutanen et al. (2018) Poutanen, J., Veledina, A., & Zdziarski, A. A. 2018, A&A, 614, A79, doi: 10.1051/0004-6361/201732345
- Ratti et al. (2012) Ratti, E. M., Jonker, P. G., Miller-Jones, J. C. A., et al. 2012, MNRAS, 423, 2656, doi: 10.1111/j.1365-2966.2012.21071.x
- Reis et al. (2010) Reis, R. C., Fabian, A. C., & Miller, J. M. 2010, MNRAS, 402, 836, doi: 10.1111/j.1365-2966.2009.15976.x
- Reis et al. (2008) Reis, R. C., Fabian, A. C., Ross, R. R., et al. 2008, MNRAS, 387, 1489, doi: 10.1111/j.1365-2966.2008.13358.x
- Revnivtsev et al. (1999) Revnivtsev, M., Gilfanov, M., & Churazov, E. 1999, A&A, 347, L23
- Ross & Fabian (2007) Ross, R. R., & Fabian, A. C. 2007, MNRAS, 381, 1697, doi: 10.1111/j.1365-2966.2007.12339.x
- Ross et al. (1999) Ross, R. R., Fabian, A. C., & Young, A. J. 1999, MNRAS, 306, 461, doi: 10.1046/j.1365-8711.1999.02528.x
- Shaposhnikov et al. (2010) Shaposhnikov, N., Markwardt, C., Swank, J., & Krimm, H. 2010, ApJ, 723, 1817, doi: 10.1088/0004-637X/723/2/1817
- Steiner et al. (2017) Steiner, J. F., García, J. A., Eikmann, W., et al. 2017, ApJ, 836, 119, doi: 10.3847/1538-4357/836/1/119
- Steiner et al. (2010) Steiner, J. F., McClintock, J. E., Remillard, R. A., et al. 2010, ApJ, 718, L117, doi: 10.1088/2041-8205/718/2/L117
- Stern et al. (1995) Stern, B. E., Begelman, M. C., Sikora, M., & Svensson, R. 1995, MNRAS, 272, 291
- Stiele & Yu (2015) Stiele, H., & Yu, W. 2015, MNRAS, 452, 3666, doi: 10.1093/mnras/stv1530
- Svensson & Zdziarski (1994) Svensson, R., & Zdziarski, A. A. 1994, ApJ, 436, 599, doi: 10.1086/174934
- Thorne (1974) Thorne, K. S. 1974, ApJ, 191, 507, doi: 10.1086/152991
- Tomsick et al. (2018) Tomsick, J. A., Parker, M. L., García, J. A., et al. 2018, ApJ, 855, 3, doi: 10.3847/1538-4357/aaaab1
- Wang-Ji et al. (2018) Wang-Ji, J., García, J. A., Steiner, J. F., et al. 2018, ApJ, 855, 61, doi: 10.3847/1538-4357/aaa974
- Willingale et al. (2013) Willingale, R., Starling, R. L. C., Beardmore, A. P., Tanvir, N. R., & O’Brien, P. T. 2013, MNRAS, 431, 394, doi: 10.1093/mnras/stt175
- Wilms et al. (2000) Wilms, J., Allen, A., & McCray, R. 2000, ApJ, 542, 914, doi: 10.1086/317016
- Yamada et al. (2013) Yamada, S., Makishima, K., Done, C., et al. 2013, PASJ, 65, 80, doi: 10.1093/pasj/65.4.80
- Yuan & Narayan (2014) Yuan, F., & Narayan, R. 2014, ARA&A, 52, 529, doi: 10.1146/annurev-astro-082812-141003
- Zamaninasab et al. (2014) Zamaninasab, M., Clausen-Brown, E., Savolainen, T., & Tchekhovskoy, A. 2014, Nature, 510, 126, doi: 10.1038/nature13399
- Zdziarski (1985) Zdziarski, A. A. 1985, ApJ, 289, 514, doi: 10.1086/162912
- Zdziarski & De Marco (2020) Zdziarski, A. A., & De Marco, B. 2020, ApJ, 896, L36, doi: 10.3847/2041-8213/ab9899
- Zdziarski et al. (1998) Zdziarski, A. A., Poutanen, J., Mikolajewska, J., et al. 1998, MNRAS, 301, 435, doi: 10.1046/j.1365-8711.1998.02021.x
- Zdziarski et al. (2002) Zdziarski, A. A., Poutanen, J., Paciesas, W. S., & Wen, L. 2002, ApJ, 578, 357, doi: 10.1086/342402
- Zdziarski et al. (2020) Zdziarski, A. A., Szanecki, M., Poutanen, J., Gierliński, M., & Biernacki, P. 2020, MNRAS, 492, 5234, doi: 10.1093/mnras/staa159
- Zdziarski et al. (2019) Zdziarski, A. A., Ziółkowski, J., & Mikołajewska, J. 2019, MNRAS, 488, 1026, doi: 10.1093/mnras/stz1787