A 3mm chemical exploration of small organics in Class I YSOs
Abstract
There is mounting evidence that the composition and structure of planetary systems are intimately linked to their birth environments. During the past decade, several spectral surveys probed the chemistry of the earliest stages of star formation and of late planet-forming disks. However, very little is known about the chemistry of intermediate protostellar stages, i.e. Class I Young Stellar Objects (YSOs), where planet formation may have already begun. We present here the first results of a 3mm spectral survey performed with the IRAM-30m telescope to investigate the chemistry of a sample of seven Class I YSOs located in the Taurus star-forming region. These sources were selected to embrace the wide diversity identified for low-mass protostellar envelope and disk systems. We present detections and upper limits of thirteen small () C, N, O, and S carriers - namely CO, \ceHCO+, HCN, HNC, CN, \ceN2H+, \ceC2H, CS, SO, \ceHCS+, \ceC2S, \ceSO2, OCS - and some of their D, 13C, 15N, 18O, 17O, and 34S isotopologues. Together, these species provide constraints on gas-phase C/N/O ratios, D- and 15N-fractionation, source temperature and UV exposure, as well as the overall S-chemistry. We find substantial evidence of chemical differentiation among our source sample, some of which can be traced back to Class I physical parameters, such as the disk-to-envelope mass ratio (proxy for Class I evolutionary stage), the source luminosity, and the UV-field strength. Overall, these first results allow us to start investigating the astrochemistry of Class I objects, however, interferometric observations are needed to differentiate envelope versus disk chemistry.
1 Introduction
Planets have long been supposed to form by material accretion in mature planet-forming disks, a.k.a. Class II disks, i.e. when disk parental envelopes have been cleared away (Lada & Wilking, 1984; Andrews & Williams, 2005; Dullemond et al., 2007). This evolutionary stage was thus identified as the birthplace of planets, containing both the chemical and mass reservoirs for planet formation. However, during the past decade, evidence started to challenge this assumption.
First, Class II disk masses are found to be, on average, well below the so-called minimum mass solar nebula (MMSN, Hayashi, 1981; Weidenschilling, 1977) of 0.01-0.1 M⊙ required to form planetary systems such as our own, and more generally below the typical masses of exoplanetary systems (e.g., Barenfeld et al., 2016; Ansdell et al., 2016; Law et al., 2017; Tazzari et al., 2017; Long et al., 2017; Eisner et al., 2018; Cazzoletti et al., 2019). Although Class II disk gas and dust masses could be underestimated due to, for example, poorly-understood CO depletion and/or optical depth effects (Yu et al., 2017a, b; Zhang et al., 2019; Andrews, 2020), if Class II disk masses are effectively well below the MMSN and, more generally, below the typical masses of exoplanetary systems, planet formation would need either 1) to start at earlier evolutionary stages, i.e. in the Class I stage, where the circumstellar envelope starts to fade away as matter accretes onto the nascent protoplanetary disk and the central protostar (e.g., Harsono et al., 2018) ; or 2) to still be fed by a regular replenishment of the protoplanetary disk from the parental molecular cloud (e.g., Kuffmeier et al., 2017; Manara et al., 2018; Dullemond et al., 2019; Kuffmeier et al., 2020).
Second, recent ALMA observations revealed that most Class II disks and even a few Class I disks (e.g., HL Tau, L1551 NE, and GY 91, Yen et al., 2017; Takakuwa et al., 2017; Sheehan & Eisner, 2018) possess sub-structures such as rings, clumps, spirals and large-scale crescents (e.g., ALMA Partnership et al., 2015; Andrews et al., 2018; Huang et al., 2018; Long et al., 2018). These sub-structures are somehow puzzling since they are at the same time supposed to (i) trace planets in the making (i.e., by-products of planet formation) and (ii) facilitate/initiate planet formation. Even though their primary origin remains to be elucidated, these sub-structures likely indicate that planet formation starts at earlier stages of disk evolution.
Thus, to get the full picture of planet genesis and chemical origins of planet compositions, it is crucial to study earlier evolutionary stages starting with Class I Young Stellar Objects (YSOs), which are still embedded in their parental envelope (e.g., White et al., 2007), i.e. protostellar envelope and disk systems. In the Class I phase, the disk chemistry is likely influenced both by the infall of fresh envelope material (e.g., Yen et al., 2013; Sakai et al., 2014; Jacobsen et al., 2019) and by the increasing importance of UV and X-ray emissions from the star (e.g., Feigelson & Montmerle, 1999; Igea & Glassgold, 1999; Bergin et al., 2003; Jonkheid et al., 2004; Gorti & Hollenbach, 2009; Woitke et al., 2010, 2016; Dutrey et al., 2014). It is unclear how much of the resulting chemical composition is inherited from their natal molecular cloud versus reset by chemical reprocessing. To address this question, we carried out a spectral line survey of a small sample of Class I systems to explore the chemical nature of these objects.
Here, we present IRAM-30m observations of a sample of seven low-mass protostellar systems located in the Taurus star-forming region and selected to encompass a wide range of Class I physical properties. We aim to explore the chemical content of Class I YSOs and the relationship between molecular emission patterns and the physical properties of these objects. The source sample and observations are described in Section 2. Our main findings are reported in Section 3 where, after presenting the different line detections (§ 3.1) and line flux variation across the source sample (§ 3.2), we focus on line flux ratios proposed to probe C/N/O gas-phase ratios, deuterium fractionation, temperature, UV-field strength, and chemical evolution (§ 3.3). In Section 4, we discuss the chemical differentiation found across our sample, and how it compares to other Class I studies, and to Class 0 and Class II chemistry. We present our conclusions in Section 5.
| Source | R.A.(a) | Dec.(a) | / | VLSR | Dist. | ||||||
|---|---|---|---|---|---|---|---|---|---|---|---|
| (J2000) | (J2000) | (K) | () | () | (M⊙) | (au) | (au) | (km/s) | (pc) | ||
| IRAS 04302+2247 | 04:33:16.501 | 22:53:20.400 | 122(c) | 0.4 | 0.017 | 0.114 | 6.7 | 1086 | 244 | 5.5 [1] | 1613(f) |
| IRAS 04295+2251 | 04:32:32.055 | 22:57:26.670 | 270(c) | 0.3 | 0.037 | 0.018 | 0.49 | 1081 | 127 | 5.3 [1] | 1613(f) |
| IRAS 04365+2535 | 04:39:35.194 | 25:41:44.730 | 164(d) | 2.1 | 0.071 | 0.030 | 0.42 | 1829 | 143 | 6.6 [2] | 1404(f) |
| IRAS 04016+2610 | 04:04:43.071 | 26:18:56.390 | 226(d) | 7.0 | 0.023 | 0.009 | 0.39 | 1446 | 497 | 6.8 [2] | 140(g) |
| IRAS 04166+2706 | 04:19:42.627 | 27:13:38.430 | 75(c) | 0.2 | 0.100 | 0.027 | 0.27 | 1209 | 180 | 6.7 [3] | 1603(f) |
| IRAS 04169+2702 | 04:19:58.449 | 27:09:57.070 | 133(c) | 0.8 | 0.055 | 0.012 | 0.22 | 672 | 39 | 6.8 [2] | 1603(f) |
| IRAS 04181+2654A | 04:21:11.469 | 27:01:09.400 | 346(e) | 0.3 | 1.234 | 0.006 | 4.8e-3 | 47 | 7.1 [1] | 1603(f) |
2 Observations
2.1 Source Sample
We selected seven Class I sources with well-characterized physical properties (e.g., Sheehan & Eisner, 2017), located in the nearby star-forming region of Taurus ( pc, Galli et al., 2019, see Table 1). The targeted sources were chosen to maximize the diversity of physical properties (disk-to-envelope ratio, luminosity and disk size) in order to elucidate their relationship with the disk chemical properties. The coordinates and properties of each source are listed in Table 1; the sources span luminosities ranging from 0.3 to 7 , envelope masses from 0.02 to 1.2 and masses of their embedded nascent disks from 0.01 to 0.1 . We provide a brief description of our selected sources in the following.
2.1.1 IRAS 04302+2247
IRAS 04302+2247 (hereafter I-04302), the so-called Butterfly star (Lucas & Roche, 1997), is a well-known YSO with an edge-on circumstellar disk located near the L1536b dark cloud (e.g., Wolf et al., 2003; Connelley & Greene, 2010). Of the sources in our sample, this one has the largest disk-to-envelope mass ratio (), presenting a massive disk, with and a 240 au radius, and is close to fully dispersing its natal envelope (, Sheehan & Eisner, 2017). This indicates the advanced evolutionary stage of this YSO with respect to the six other sources of our sample (see Table 1).
2.1.2 IRAS 04295+2251
IRAS 04295+2251 (hereafter I-04295), also known as L1536 IRS, is classified as a Class I object according to its bolometric temperature of K (Young et al., 2003). Although Chiang & Goldreich (1999) suggested that it could be an edge-on disk, later on observations rather suggest an inclined disk (Furlan et al., 2008; Eisner, 2012; Sheehan & Eisner, 2017). Although its disk-to-envelope mass ratio is , one order of magnitude lower than for I-04302, it is, however, the second largest of our sample. Thus, contrary to I-04302, this indicates that the disk is still well embedded in its natal envelope, with and a 130 au radius.
2.1.3 IRAS 04365+2535
IRAS 04365+2535 (hereafter I-04365), also known as TMC1A, is located at the center of the L1534 dark cloud (Benson & Myers, 1989). I-04365 shows an inclined Keplerian rotating disk (e.g., Harsono et al., 2014; Aso et al., 2015; Sheehan & Eisner, 2017), with a disk-to-envelope mass ratio of , third largest of our sample, with and a 140 au disk radius. The disk is driving a wind (Bjerkeli et al., 2016) and large-scale outflow (Chandler et al., 1995; Aso et al., 2015) probably both at the origin of a forming cavity in the surrounding envelope.
2.1.4 IRAS 04016+2610
IRAS 04016+2610 (hereafter I-04016), also known as L1489 IRS, is a Class I system ( K, Green et al., 2013) likely located behind a foreground starless cloud (e.g., Hogerheijde & Sandell, 2000; Brinch et al., 2007a). This source shows evidences of a disk in Keplerian rotation misaligned from its surrounding envelope (Hogerheijde, 2001; Brinch et al., 2007b) and a bipolar outflow (Myers et al., 1988; Hogerheijde et al., 1998; Yen et al., 2014). Although this source has the largest disk of our sample, it also has one of the smallest disk masses (, see Table 1), with a disk-to-envelope mass ratio indicative of the embedded nature of this source.
2.1.5 IRAS 04166+2706
IRAS 04166+2706 (hereafter I-04166) is a YSO located in the molecular filament of the L1495/B213 Taurus (Hacar et al., 2013), harbouring highly collimated jet and bipolar outflow (Bontemps et al., 1996; Tafalla et al., 2004; Santiago-García et al., 2009). Claimed to be a Class 0 system by some (e.g., Tafalla et al., 2004, 2017; Wang et al., 2014, 2019) and a Class I source by others (e.g., Young et al., 2003; Furlan et al., 2008; Eisner, 2012; Sheehan & Eisner, 2017), it is probably in transition between these two stages. This is in agreement with the fact that I-04166 is the source with the lowest luminosity () and bolometric temperature ( K) in our sample (see Table 1).
2.1.6 IRAS 04169+2702
IRAS 04169+2702 (hereafter I-04169), located in the molecular filament of the L1495/B213 Taurus (Hacar et al., 2013), is a Class I YSO (133 K, Young et al., 2003) also characterized by a bipolar outflow (Bontemps et al., 1996) found to be perpendicular to an elongated flattened envelope of about 2200 au 1100 au in size area (Ohashi et al., 1997). A compact au radius disk is embedded in this huge envelope (Sheehan & Eisner, 2017), with a disk-to-envelope mass ratio .
2.1.7 IRAS 04181+2654A
IRAS 04181+2654A (hereafter I-04181), located in the molecular filament of the L1495/B213 Taurus (Bontemps et al., 1996; Davis et al., 2010), is the least characterized source of our sample due to its lack of submillimeter study. It is part of a wide binary system, with a deeper embedded B component lying 31” away (i.e., au away at the distance of Taurus, Furlan et al., 2008). The A component is closer to a dense core and shows two bipolar outflows (Davis et al., 2010).
2.2 Description of the observations
The observations were performed at the IRAM-30m telescope in a single observing run of 49.5h from June 19th to June 23rd, 2019. Each of the seven sources targeted for this study was observed with the spectral line Eight MIxer Receivers (EMIR) in band E090 (3mm), with an almost complete coverage of the 3mm band, covering GHz and GHz, using the wide mode of the Fast Fourier Transform Spectrometers (FTS) (Klein et al., 2012) at a spectral resolution of 200 kHz (i.e., km.s-1), with an average sideband rejection of -16dB (Carter et al., 2012). The observations were carried out in Wobbler Switching (WSW) mode, with a throw of 180”, to ensure a flat baseline across the spectral bandwidth observed. Frequency Switching (FSW) mode was also used to check if the absorption features appearing on the strongest molecular spectra (mainly 12CO and \ceHCO+) were due to plausible contamination from the OFF positions or probing different physical components of the targeted sources. More observational time would have been required to also check the absorption features appearing on fainter lines with this method, but these first FSW checks provide some clues on the plausible origins of the absorption features observed, as described in Section 3. Moreover, the wobbler OFF position is given as a single fixed relative offset in azimuth with respect to the target position. This results in a slightly different absolute position in the sky of the OFF position as the Earth rotates. Thus, contamination lines can be checked in WSW data by analyzing if such lines are moving or disappearing during the observation scans. We used this technique to explore the origins of a handful of lines observed in absorption instead of emission (see Section 3.1).
Primary pointing and focus were done on Uranus and secondary focus were done on quasar 0439+360 and on Venus. Pointing was checked every 1.5 hours on these same two nearby sources. The average pointing corrections were between 3” and 4”, i.e. 5 to 10 times smaller than the IRAM beam at the observed frequencies, which varies from 34” at 72 GHz to 22” at 110 GHz. The averaged achieved rms is mK.
3 Results
In this section, we present the line detections of small (N) molecules in our 3mm spectral survey of seven Class I YSOs and explore their relationship with one another and with source properties across the sample – detections of larger molecules will be presented in a future article.
3.1 Line Detections
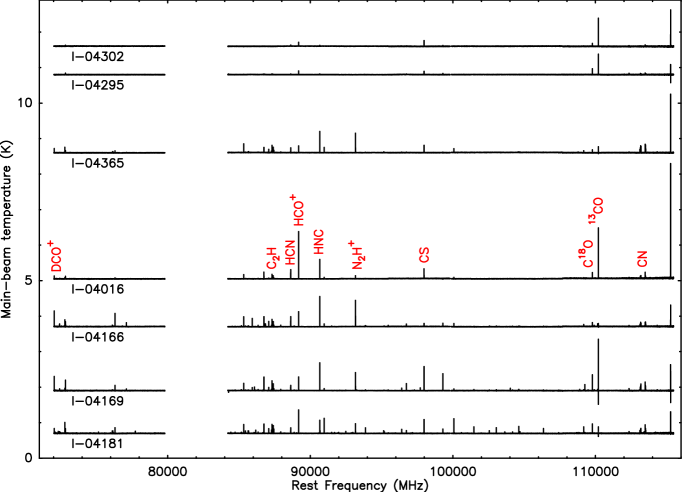
Figure 1 presents the full 3mm spectra obtained toward each of the seven Class I sources targeted in this work, sorted by decreasing disk-to-envelope mass ratios. All seven sources present a large number of spectral lines, but the line intensity and richness decreases with disk-to-envelope mass ratio. We detected thirty molecules with no more than 3 atoms toward three or more sources in our sample, where our detection criterion is set to be for the integrated intensity. Table 2 lists the most intense line of each species, and the same lines are presented in Figures 2 to 5.

Figure 2 displays spectra for the transitions of all CO and \ceHCO+ isotopologues observed, with the exception of 12CO, which will be discussed in a forthcoming study. 13CO, C18O and C17O are detected toward all Class I sources, while 13C18O is only seen in the four sources with the smallest disk-to-envelope mass ratios. Since absorption features are seen in 13CO and C18O, which could be indicative of multiple velocity components along the line-of-sight or simply due to the optical thickness of the lines, in the remainder of this work we use C17O as a proxy for CO. HCO+, DCO+, and H13CO+ are detected toward all sources, but the fainter isotopologue HC18O+ is only detected in emission in 5/7 sources. Faint absorption features are detected in the remaining two disk-dominated sources but are likely due to contamination from the OFF positions, because these features only appear in a few scans of the WSW observations.

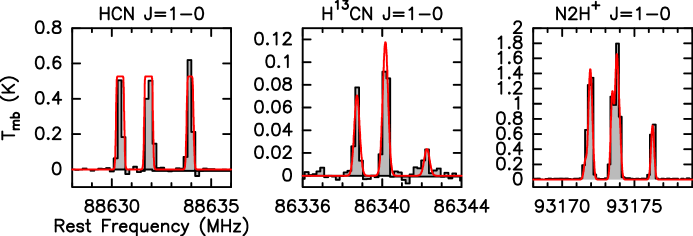
Nitrogen-bearing species are presented Fig. 3, with four isotopologues of HCN and HNC each (i.e., main, D, 13C and 15N isotopologues), and two of CN and \ceN2H+ each, (i.e., main and 13C, and main and D isotopologues, respectively). The main isotopologues of these four molecules are detected in all seven sources, while the rarer isotopologues are mainly seen in the low disk-to-envelope mass ratio sources. In addition, HN13C is seen in absorption toward I-04302, but we suspect this to be a foreground cloud contamination. We should also note that multiple velocity components are seen in \ceN2D+ toward I-04181 and in \ceN2H+ toward I-04302. These data will need higher resolution observations to be further explored. In the remainder of the present study, we focus on the narrow, central emission or absorption feature toward each source from which first general overview results of the chemistry of Class I objects can be straightforwardly derived.

Figure 4 presents the spectra for the sole 3-atom hydrocarbon observed, \ceC2H . It is detected toward all sources, but is observed in absorption toward I-04302. Why some lines are seen in absorption toward this source is unclear. Contrary to the HC18O+ line, checking the WSW observation scans one by one suggests that it is less likely that these absorption features are due to cloud contamination. We speculate that the line could originate from absorption in a cold envelope against optically thick dust in the edge-on disk of this system, but further observations are required to check their origin.

Figure 5 presents nine S-bearing species of interest, three isotopologues of CS (2-1) (including the main, 34S and 13C isotopologues), two isotopologues of SO (-) (including the main and 34S isotopologues), HCS+ (2-1), CCS (-), OCS (9-8), and \ceSO2(-). Absorption, self-absorption, or multiple velocity components are apparent for CS toward I-04166, and in both SO isotopologues toward I-04181, I-04016 and I-04365. In these cases, we integrated the emission of the central, narrow component, as indicated above (see Table 3).
| Molecule | Frequency | Transition | |||
| (MHz) | (K) | (s-1) | |||
| 13CO | 110201.354 | 5.3 | 6 | 6.33e-08 | 1 – 0 |
| C18O | 109782.173 | 5.3 | 3 | 6.27e-08 | 1 – 0 |
| C17O(‡) | 112358.982 | 5.4 | 8 | 6.70e-08 | 1 4 – 0 3 |
| 13C18O | 104711.404 | 5.0 | 4 | 5.46e-08 | 1 2 – 0 1 |
| HCO+ | 89188.525 | 4.3 | 3 | 4.19e-05 | 1 – 0 |
| DCO+ | 72039.312 | 3.5 | 3 | 2.21e-05 | 1 – 0 |
| H13CO+ | 86754.288 | 4.2 | 3 | 3.85e-05 | 1 – 0 |
| HC18O+ | 85162.223 | 4.1 | 3 | 3.65e-05 | 1 – 0 |
| HCN(‡) | 88631.847 | 4.3 | 5 | 2.43e-05 | 1 2 – 0 1 |
| DCN(‡) | 72414.905 | 3.5 | 5 | 1.31e-05 | 1 2 – 0 1 |
| H13CN(‡) | 86339.921 | 4.1 | 9 | 2.23e-05 | 1 – 0 |
| HC15N | 86054.966 | 4.1 | 3 | 2.20e-05 | 1 – 0 |
| HNC | 90663.568 | 4.4 | 3 | 2.69e-05 | 1 – 0 |
| DNC | 76305.700 | 3.7 | 3 | 1.60e-05 | 1 – 0 |
| HN13C | 87090.825 | 4.2 | 3 | 2.38e-05 | 1 – 0 |
| H15NC | 88865.715 | 4.3 | 3 | 1.98e-05 | 1 – 0 |
| CN(‡) | 113490.970 | 5.4 | 6 | 1.19e-05 | 1 0 2 3 – 0 0 1 2 |
| 13CN(‡) | 108780.201 | 5.2 | 7 | 1.05e-05 | 1 2 2 3 – 0 1 1 2 |
| \ceN2H+(‡) | 93173.700 | 4.5 | 15 | 3.63e-05 | 1 2 – 0 1 |
| \ceN2D+(‡) | 77109.610 | 3.7 | 5 | 2.06e-05 | 1 2 – 0 1 |
| \ceC2H(‡) | 87316.898 | 4.2 | 5 | 1.53e-06 | 1 2 2 – 0 1 1 |
| CS | 97980.953 | 7.1 | 5 | 1.68e-05 | 2 0 – 1 0 |
| 13CS | 92494.308 | 6.7 | 10 | 1.41e-05 | 2 0 – 1 0 |
| C34S | 96412.950 | 6.9 | 5 | 1.60e-05 | 2 0 – 1 0 |
| SO | 99299.870 | 9.2. | 7 | 1.13e-05 | 2 3 – 1 2 |
| 34SO | 97715.317 | 9.1 | 7 | 1.07e-05 | 2 3 – 1 2 |
| \ceHCS+ | 85347.890 | 6.1 | 5 | 1.11e-05 | 2 – 1 |
| CCS | 93870.107 | 19.9 | 17 | 3.74e-05 | 7 8 – 6 7 |
| \ceSO2 | 104029.418 | 7.7 | 7 | 1.01e-05 | 3 1 3 – 2 0 2 |
| OCS | 109463.063 | 26.3 | 19 | 3.70e-06 | 9 – 8 |
3.2 Integrated line Fluxes Across Our Source Sample
| I-04302 | I-04295 | I-04365 | I-04016 | I-04166 | I-04169 | I-04181 | |
|---|---|---|---|---|---|---|---|
| C17O(‡) | |||||||
| HCO+ | |||||||
| DCO+ | 6.4 1.8 (a) | ||||||
| H13CO+ | 3.7 1.0 | ||||||
| HC18O+ | …(c) | … | |||||
| HCN(‡) | |||||||
| DCN(‡) | |||||||
| H13CN(‡) | |||||||
| HC15N | 8.3 1.8 | 9.9 2.9 | |||||
| HNC | |||||||
| DNC | |||||||
| HN13C | … | … | |||||
| H15NC | 5.5 1.9 | ||||||
| CN | |||||||
| 13CN | 11.8 2.8 | 6.6 1.7 | 21.9 6.4 | ||||
| N2H+ | |||||||
| N2D+ | |||||||
| C2H | … | ||||||
| CS | |||||||
| C34S | 15.5 3.3 | 10.8 2.3 | 8.9 2.2 | ||||
| 13CS | 7.4 1.6 | 4.4 1.1 | 7.4 1.7 | ||||
| SO | |||||||
| 34SO | 4.4 1.3 | ||||||
| HCS+ | 5.9 1.4 | 4.6 1.2 | 7.4 2.0 | ||||
| C2S | 3.3 1.0 | ||||||
| SO2 | 8.8 1.8 | 8.7 2.8 | |||||
| OCS | … | 9.5 2.5 |
Note. — [1] Deduced from the rotational transition of HCN from this work, [2] Deduced from the rotational transition of CN from this work, [3] from Santiago-García et al. (2009) and in agreement with the one deduced from the rotational transition of HCN from this work.
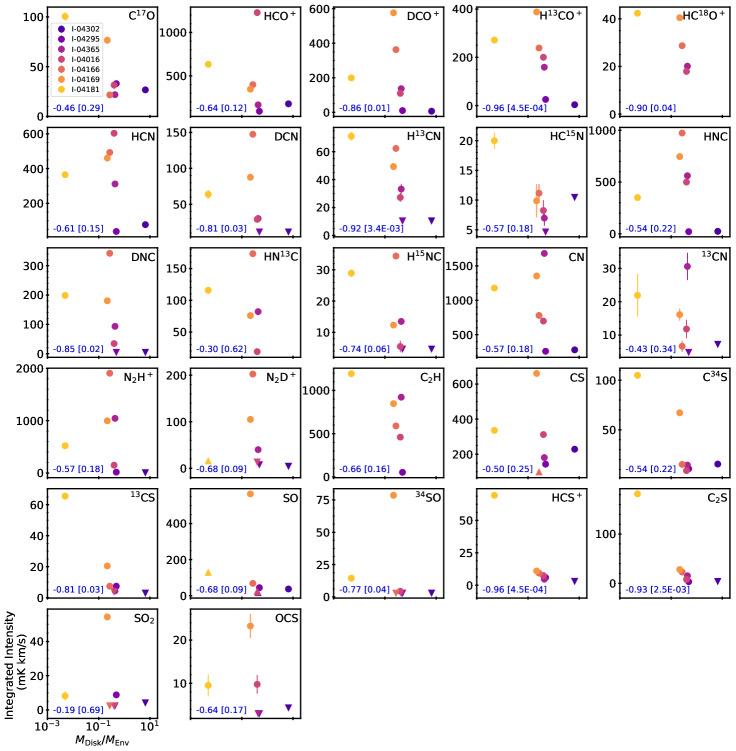
All line profiles were fitted by a single Gaussian to extract the integrated line intensities. A line is considered detected when , and tentatively detected when . The upper limits on the integrated line intensities were derived assuming a Gaussian shape and a line width of km.s-1, similar to the typical line width detected for the other molecules in these sources. Table 3 presents the integrated line intensities derived for all species presented in this work, except for the CO isotopologues, where we only focused on C17O as mentioned earlier. Figure 6 presents the integrated line intensities of all twenty-seven species versus disk-to-envelope mass ratio. For most species, line intensities vary by 1-2 orders of magnitude across the source sample, even within the central narrow range of disk-to-envelope mass ratios varying from to , i.e. excluding I-04181 and I-04302 (see Table 1).
A majority of lines are the weakest in the disk-dominated sources, but otherwise there is a range of trends. 33% (9/27) of the targeted lines are the brightest toward the source with smallest disk-to-envelope mass ratio I-04181, namely C17O, HC18O+, H13CN, HC15N, C2H, C34S, HCS+, C2S, 13CS. Most of these lines are typically associated with dense gas (e.g., Bergin et al., 1997; van Dishoeck & Blake, 1998; Tafalla et al., 2002; Magalhães et al., 2018; Artur de la Villarmois et al., 2019), and their overabundance in I-04181 may simply reflect more material in this envelope-dominated line-of-sight.
26% (7/27) of the lines are instead brightest toward the source with the second smallest disk-to-envelope mass ratio, I-04169, namely DCO+, H13CO+, CS, SO, 34SO, SO2, OCS. Note that this group contains all of the oxygen containing S-species, which is probably suggesting that shocked regions play a non-negligible role. An equal number of lines are brightest toward the source with the third smallest disk-to-envelope mass ratio, I-04166, namely HNC, DCN, DNC, HN13C, H15NC, N2H+, N2D+. These are all species associated with cold gas, which is consistent with the relatively low luminosity and low bolometric temperature of this source (see Table 1), likely resulting in a large cold gas reservoir in the surrounding disk and envelope. Note that the only deuterated species that is not the brightest in this source is DCO+, which may reflect different excitation conditions or chemistry for DCO+ compared to the other deuterated species, such as its relationship with the depletion of CO (Caselli, 2002; Öberg et al., 2015).
HCN and \ceHCO+ lines are the brightest toward the most luminous source, I-04016, with increased width likely reflecting their optically thickness, as confirmed by our line optical depth study presented in Appendix A. Finally, CN and 13CN are the brightest toward I-04365, perhaps indicating that this lower disk-to-envelope mass ratio source is more influenced by stellar UV illumination, since CN can be enhanced through photodissociation of HCN driven by Ly radiation from the central star (e.g., Bergin et al., 2003). Note that none of the targeted lines of this work are found to be the brightest in the two sources with the highest disk-to-envelope ratios, I-04295 and I-04302.
For each line presented here, we calculated the Spearman’s rank correlation coefficient, , between the integrated line intensity and the disk-to-envelope mass ratio across our Class I source sample, as shown in Fig. 6. This correlation method measures monotonic relationships, which is a reasonable approach for our case study where there is no reason to expect strictly linear trends. Moreover, this method is less sensitive to outliers than other methods such as the Pearson correlation method. Nine species display statistically significant anti-correlations with disk-to-envelope mass ratio, i.e. with and p-values (where the p-values are used as proxies to assess the statistical significances, e.g., Wasserstein & Lazar, 2016): HCS+, H13CO+, C2S, H13CN, HC18O+, DCO+, DNC, 13CS, and DCN.
3.3 Integrated Line Flux Ratios
In the following sub-section, we explore the relationship between subsets of species that have been proposed to trace C/N/O gas-phase ratios, deuterium fractionation, temperature, UV-field strength, and evolutionary stage. We note that in the optically thin limit of local thermodynamic equilibrium (LTE), the integrated line flux ratio of two co-spatial molecules presenting similar upper state energies is roughly proportional to their column density ratio. This assumption is, however, only reasonable for a subset of the observed species, since many of the brightest lines are optically thick (see Appendix A).
3.3.1 CO, C2H and HCN: Probing C/N/O Elemental Ratios?
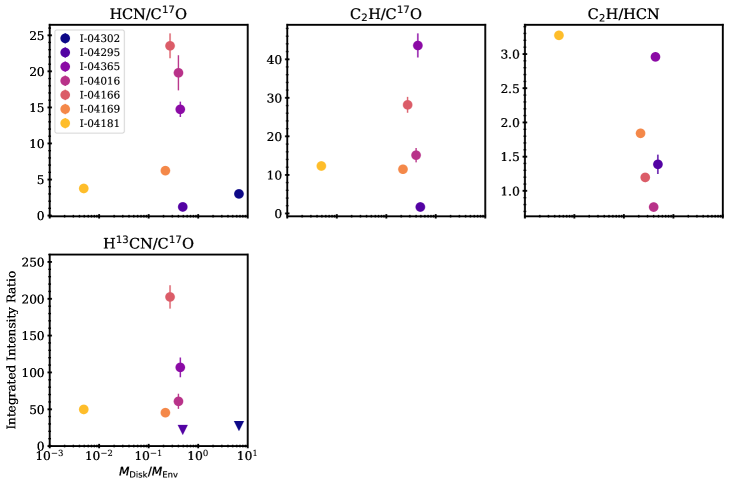
CO, C2H, and HCN have been proposed to trace the gas-phase C/N/O ratios (e.g., Du et al., 2015; Bergin et al., 2016; Cleeves et al., 2018; Bergner et al., 2019). Figure 7 shows the integrated line flux ratios of HCN/C17O, \ceC2H/C17O, \ceC2H/HCN, and H13CN/C17O, as functions of the disk-to-envelope mass ratio. There is no clear monotonic trend for any of the ratios, suggestive of a lack of consistent change in C/N/O ratios with disk-to-envelope mass ratio, a proxy for Class I evolutionary stage. We note, however, that this is preliminary since HCN is found to be highly optically thick in 4/7 sources and marginally thick in the three remaining sources (see Appendix A). We expect that this is also the case for C2H in most of the sources. Moreover, different sources likely present different excitation environments. The tentative negative correlation between C2H/HCN and disk-to-envelope mass ratio likely reflects a combined changing excitation and chemical environment as Class I disks evolve and requires spatially resolved observations to interpret further. If the trend is confirmed with spatially resolved optically thin tracers, part of the chemical explanation could suggest a decreasing C/N fraction due to C sequestration into grain mantles. However, other interpretations would also be possible, since \ceC2H has been shown to be very sensitive to UV environment in disks (Bergin et al., 2016; Bergner et al., 2019; Miotello et al., 2019). For instance, an increase of atomic C and \ceC+ in the gas phase of the sources where radiation can propagate more easily could also explain this tentative trend.
3.3.2 Deuterium Fractionation
Deuterium enrichment of molecules is intimately linked to their environments (e.g., Lubowich et al., 2000; Dalgarno & Lepp, 1984; Roberts et al., 2003; Willacy, 2007; Mumma & Charnley, 2011; Huang et al., 2017; Aikawa et al., 2018). Constraints on deuterium fractionation are thus commonly used as a diagnostic of chemical inheritance versus chemical reset along the evolutionary path from molecular clouds to planetary systems (we refer the reader to the reviews from Caselli & Ceccarelli, 2012; Ceccarelli et al., 2014, for more exhaustive overviews).
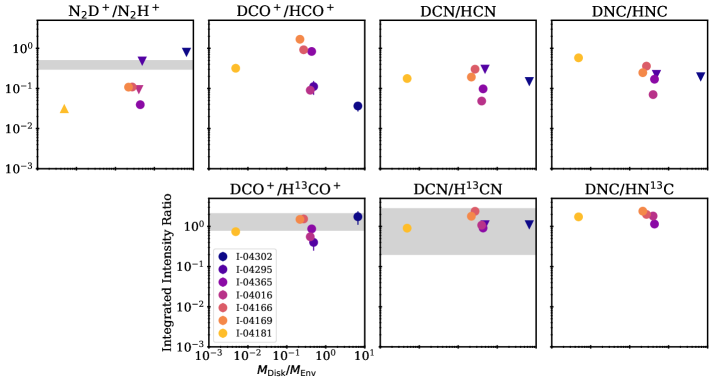
Figure 8 shows the line ratios \ceN2D+/\ceN2H+, \ceDCO+/\ceHCO+, DCN/HCN, DNC/HNC, \ceDCO+/\ceH13CO+, DCN/H13CN, and DNC/HN13C across our source sample. All ratios indicate highly deuterated gas, but this is in some part an opacity effect. Using the resolved hyperfine patterns of the HCN line and the \ceHCO+ isotopologues, we find that both, HCN and \ceHCO+ , are optically thick toward most of the targeted sources (see Appendix A), and we suspect this is also the case for the HNC line. However, \ceN2H+, H13CN, and \ceHCO+ are found to be optically thin in all sources where they are detected (see Appendix A) and can be used to directly trace the D/H ratio.
Focusing on the optically thin line ratios, we see between a factor of two and five difference for the different species. Assuming that the 12C/13C ratio remains unchanged among our source sample, it is striking how constant the D/H ratio is across the Class I sample. Furthermore, there is no evident trend with D/H ratio and disk-to-envelope mass ratio. Additional observations are required to further this preliminary D-fractionation study.
Comparison with Class II disk observations are represented in Fig. 8 for the ratios of \ceDCO+/\ceH13CO+ and DCN/H13CN derived in a sample of six Class II disks by Huang et al. (2017), and for the line ratio \ceN2D+/\ceN2H+ derived toward the disks surrounding the T Tauri star AS 209 (Huang & Öberg, 2015) and the Herbig-Ae star HD 163296 (Salinas et al., 2017). Despite the facts that we are using a different set of transitions and that the DCN/H13CN ratio spanning over one order magnitude in Class II disks is loosely constrained, this preliminary comparison already shows that the \ceDCO+/\ceH13CO+ and DCN/H13CN ratios are in the same order of magnitude from Class I to Class II sources. Especially, in Class II disks the \ceDCO+/\ceH13CO+ only spans over a factor and the Class I \ceDCO+/\ceH13CO+ ratios are all within a factor of 2 of this range. However, additional observations of these ratios in both Class I and Class II sources are required to further this comparison. The \ceN2D+/\ceN2H+ line ratios derived in our Class I source sample are lower by factors of a few to almost an order of magnitude compared to the \ceN2D+/\ceN2H+ ratios derived in Class II disks. However, there is a detection bias since \ceN2D+ has been difficult to detect in Class II disks, so any \ceN2D+/\ceN2H+ ratios reported in Class II disks are going to necessarily be high.
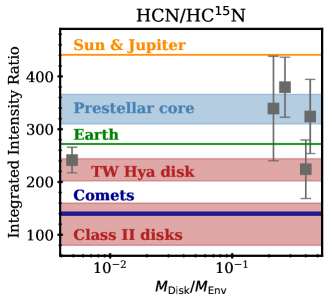
3.3.3 14N/15N Ratio In HCN
In un-shielded gas, such as disk atmospheres, selective photo-dissociation of 14N15N, whose opacity is lower than that of \ceN2, may result in 15N fractionation (e.g., Clayton, 2002; Liang et al., 2007; Heays et al., 2014). HCN/HC15N is a proposed probe of this process, and could potentially be linked to the UV-field strength of its environments. Chemical 15N fractionation of HCN has also long been supposed to be favored at low temperature ( K) due to the positive difference in zero-point energies between the 14N and 15N isotopologues, through:
| (1) |
followed by the dissociative recombination with electron \ceHC^15NH+ + e- -¿ HC^15N + H (Terzieva & Herbst, 2000). But, subsequent work demonstrated that the chemical fractionation of Eq (1) is unlikely to happen at low temperatures due to an important activation barrier (Roueff et al., 2015), ruling out a temperature-driven chemical fractionation of HCN. However, Wirström & Charnley (2018) pointed out that the updated reaction rates from Roueff et al. (2015) should be taken with caution, as they were only calculated for one collision angle. Further investigations of the low temperature 15N-fractionation pathway are still required to completely rule out the temperature-driven chemical differentiation of HCN.
Figure 9 shows the HCN/HC15N ratios derived toward the five sources of our sample where H13CN and HC15N are at least tentatively detected, using the integrated line flux ratio of H13CN/HC15N and assuming a constant 13C/12C isotopic ratio of (Milam et al., 2005; Manfroid et al., 2009; Asplund et al., 2009), and how they compare with HCN/HC15N ratios from other kinds of sources. The Class I disks span the ratio between the TW Hya disk (Hily-Blant et al., 2019) and prestellar cores (Magalhães et al., 2018). The HCN/HC15N Class I measurements are higher by factors of than the ratios measured in a sample of five Class II disks (spanning from 80 to 160, Guzmán et al., 2017) and in comets (with an average ratio of , Jehin et al., 2009; Mumma & Charnley, 2011; Bockelée-Morvan et al., 2015; Shinnaka et al., 2016, see also the compilation made in Fig. A1 of Hily-Blant et al. (2017)). However, the ratio may be somewhat overestimated in I-04016 and I-04169 where HC15N was only tentatively detected (see Table 3).
Moreover, these are all source-averaged ratios. New higher-resolution measurements of the HCN/HC15N toward the TW Hya disk found that the isotopic HCN ratio varies from to from inner to outer radii (Hily-Blant et al., 2019). These new results suggest that the isotopic fractionation is occurring within the Class II disk stage resulting in 15N enrichment from outer to inner disk regions where comets are supposed to originate. This ratio may then also be a good tracer of how exposed the disk is to UV radiation in the younger Class I disks, but high-resolution Class I disk observations are needed to confirm this.
3.3.4 CN/HCN: Probe Of The UV-field Strength?
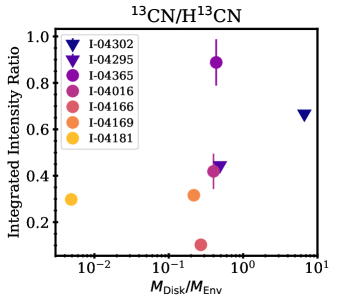
The CN/HCN ratio is known to be highly correlated with UV-field strength of the environment it probes (e.g., Schilke et al., 1992; Fuente et al., 2003; Riaz et al., 2018; Bublitz et al., 2019). In protostellar sources in particular, it has been shown to probe the UV flux from the accretion regions of the embedded protostar and its forming circumstellar disk (e.g., Stäuber et al., 2007). In these regions where the stellar FUV flux is higher than the interstellar UV radiation field, the CN/HCN ratio can be enhanced through photodissociation of HCN driven by Ly radiation from the central star (Bergin et al., 2003), as mentioned earlier (§ 3.2). CN/HCN line ratios have been reported in Class II T Tauri (DM Tau; Dutrey et al., 1997) and Herbig Ae disks (MWC 480 and HD 163296; Thi et al., 2004; Chapillon et al., 2012). In Class II disks the disk averaged CN/HCN does not vary much from one disk to another (Öberg et al., 2011), however, but it does vary within disks (Guzmán et al., 2015).
Figure 10 shows the integrated line flux ratio of 13CN/H13CN of our Class I source sample, which varies by almost one order of magnitude across our source sample. The source with the lowest 13CN/H13CN ratios, is the one that we previously identified as the coldest of our sample due to the high intensity of deuterated species and to its high HNC/HCN ratio. The highest 13CN/H13CN ratio is found in I-04365.
Based on the 13CN/H13CN line ratio as a proxy for the CN/HCN abundance ratio and assuming that the latter is a robust UV-field strength probe, I-04365 should be the most exposed sources to UV radiation. However, the H13CN/HC15N ratio, also proposed as a probe for the UV-field strength (see Section 3.3.3), is found to be the lowest in I-04016. I-04016 and I-04365 are the two most luminous sources of our sample (see Table 1). Thus, while the results found with the 13CN/H13CN and H13CN/HC15N ratios tend to be consistent, the differences found might indicate that either one of these ratios also depends on other parameters; or that each of these ratios trace different layers or components of the Class I source probed. Additional observations are required to test these scenarios.
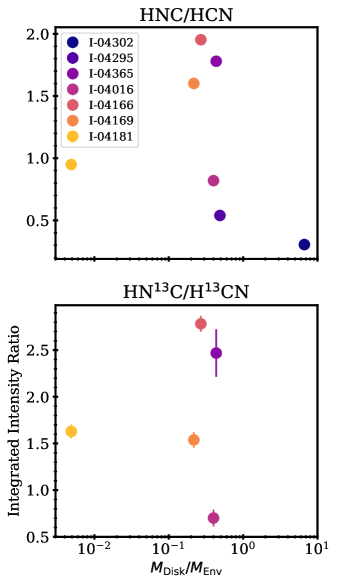
3.3.5 HNC/HCN: A Probe Of Temperature?
The HNC/HCN line ratio is suggested to be a direct probe of the gas kinetic temperature, such that a higher ratio probes colder material (e.g., Baan et al., 2008; Hacar et al., 2019). In Fig. 11 we show the HNC/HCN and HN13C/H13CN line ratios. When comparing the top and bottom panels of this figure, we see that the order of the two ratios from one source to another is generally replicated. The lowest ratios are found in the sources with the highest disk-to-envelope mass ratios, suggesting they are overall warmest. Among the envelope dominated sources, there is no trend with disk-to-envelope mass ratio. However, this is not surprising since source luminosity should also play a large role for setting the temperature. In fact, we do see the highest HNC/HCN ratio toward the lowest luminosity source, I-04166, which is also the coldest source of our sample (see Table 1). Interestingly, the H13CN/HC15N is also found to be the highest in this source, highlighting the fact that the latter is indeed related to the luminosity of the source and that 15N fractionation of HCN is less efficient at low temperature (see Section 3.3.3).
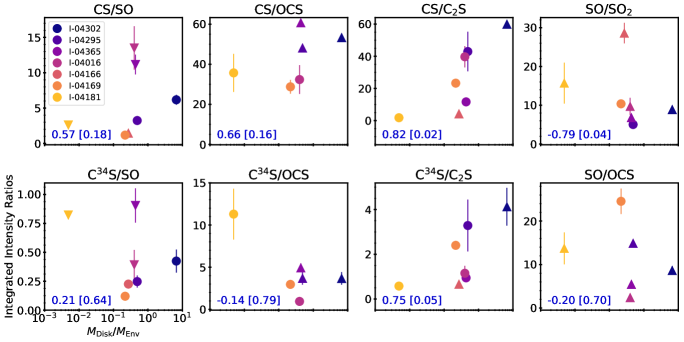
3.3.6 Sulfur-bearing Species Ratios
Sulfur-bearing species ratios have long been thought to be powerful diagnostics to probe both the chemistry and the physics of their environments. For instance, the CS/SO ratio has been proposed as a probe for the elemental C/O ratio (e.g Swade, 1989; Bergin et al., 1997; Fuente et al., 2019). Sulfur-bearing ratios are also thought to be good chemical clocks (e.g., SO/\ceSO2, CS/OCS, SO/OCS), because of their rapid chemical evolution with gas temperature and density (e.g., Charnley, 1997; Hatchell et al., 1998; Viti et al., 2004; Herpin et al., 2009; Wakelam et al., 2011; Vidal & Wakelam, 2018). This idea came up from hot core/corino theory, with the hypothesis that the bulk of the sulfur reservoir is locked onto grain mantles in previous evolutionary stage and then released in the gas phase during the hot core/corino formation under the form of \ceH2S, SO and atomic S. This is supposed to initiate an active S-chemistry, where \ceSO2 is a direct product of SO, through the radiative association of O and SO and the neutral-neutral reaction \ceOH +SO -¿ SO2 + H, making the SO/\ceSO2 ratio an ideal chemical clock for such astrophysical objects. In the gas phase, OCS is mainly formed through the radiative association of S and CO, and one of the formation pathways for CS is the reaction \ceSO + C, justifying that CS/OCS and SO/OCS were also claimed as additional chemical evolutionary clocks. Finally, finding out whether sulfur is reduced or oxidized in planet-forming environments is interesting for origins of life chemistry (Patel et al., 2015).
Figure 12 shows the S-bearing integrated line flux ratios of CS/SO, CS/OCS, CS/\ceC2S, SO/OCS, and SO/\ceSO2 with corresponding C34S ratios as functions of increasing disk-to-envelope mass ratio across the Class I sample. These ratios are also found to vary by several orders of magnitude from one source to another, but only CS/\ceC2S (and C34S/\ceC2S) show a clear positive correlation with increasing disk-to-envelope mass ratio, respectively. This is a priori counter-intuitive because, for instance, \ceC2S can be produced from the reaction \ceCS + CH -¿ C2S + H in the gas phase (see the KIDA database222http://kida.obs.u-bordeaux1.fr/). Hence, one would rather expect an increase in carbon chains with evolution. However, it should be noted that the chemistry of \ceC2S has remained poorly studied experimentally and theoretically so far.
4 discussion
4.1 Chemical Differentiation Within Our Sample
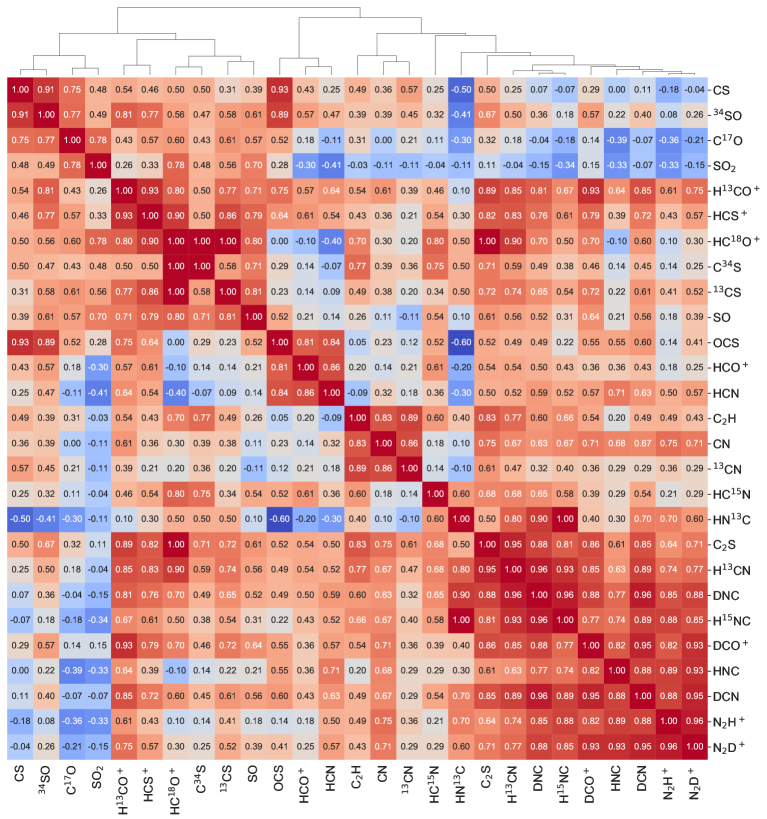
In Section 3, we explored specific line emission patterns within our sample. In this sub-section we investigate global patterns of chemical differentiation. Fig. 13 shows a cluster correlation matrix of all sources and line fluxes presented in this work, based on Spearman’s correlation coefficients. This correlation matrix method produces a table containing the correlation coefficients in between each species, allowing us to simultaneously assess their interdependence. The clustering is then used to arrange and group the species by correlation coefficients, as illustrated by the dendrogram in the figure.
This global statistical representation highlights several clusters of correlated molecules with two or more sub-clusters each. At the bottom right of the plot lies the biggest cluster consisting of \ceN2D+, \ceN2H+, DCN, HNC, \ceDCO+, H15NC, DNC, H13CN, \ceC2S, and HN13C, which are readily identified with dense and cold gas, since these species are known to have high critical densities (i.e., tracing dense gas, Shirley, 2015), and were observed in their 1-0 ground-state transition in our survey (i.e., tracing cold gas). Furthermore, deuterated species and especially \ceN2D+ are characteristics of cold gas for chemical reasons. Bright HNC emission is also associated with cold gas, while HCN isotopologues are more of dense gas tracers. But, the fact that they show up in the same cluster may suggest that sources that are cold are also more likely to have large reservoirs of dense gas. In either case, the first differentiating factor among Class I sources affecting their temperature is whether or not they have a large cool gas reservoir.
At the top left of the figure lies the second biggest cluster, overall less strongly correlated than the previous one, but composed of several highly correlated sub-clusters. It contains most of the S-bearing species but OCS and \ceC2S. With its abundance in oxygenated S-bearing species, this molecular cluster is probably characteristic of shock induced chemistry tracers, which appear to be closely correlated with CS and isotopologues, C17O, and with ions such as \ceH13CO+ and \ceHC18O+. The coupling of these last species with shock tracers could either be due to an evolutionary effect, or to the fact that sources with shocks may also have more ionized gas and/or more CO in the gas-phase. C17O (our proxy of CO in the gas phase, see Section 3.1) is indeed found to be the brightest in I-04169, where most S-bearing species and \ceH13CO+ are also the brightest.
Finally, two smaller clusters lie in the center of the matrix: (i) a first one made of (i) \ceHCO+, OCS, and HCN; and (ii) another one made of CN, \ce^13CN, and \ceC2H. Interestingly, the first molecular cluster is however barely correlated with the fainter isotopologues of \ceHCO+ and HCN, which suggests that the correlations of these molecules are dominated by excitation and opacity effects rather than chemical relationships. The second cluster contains UV-driven dense gas tracers, with CN and \ceC2H being commonly observed in UV-enhanced environments (e.g., Kastner et al., 2015; Bergin et al., 2016; Cazzoletti et al., 2019; van Terwisga et al., 2019; Bergner et al., 2019; Miotello et al., 2019).
4.2 \ceSO2 Versus C17O In Class I Sources
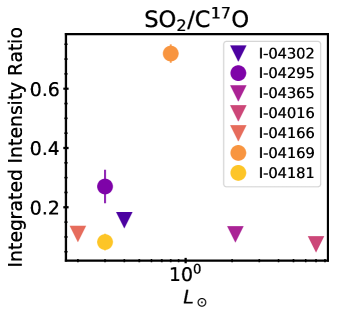
A recent study of twelve low-mass Class I sources located in the Ophiuchus molecular cloud shed light on the chemical differentiation between \ceSO2 and \ceC17O across their source sample (Artur de la Villarmois et al., 2019). \ceSO2 emission was found to be the brightest toward the most luminous sources, whereas the opposite was observed for \ceC17O. The fact that these two molecules are not tracing similar environments is not surprising, since these two molecules are known to trace different physical conditions, where the former is often associated with outflows and shocked gas (Jørgensen et al., 2004; Podio et al., 2015), whereas the latter is rather tracing denser and colder gas (Caselli et al., 1999; Tafalla et al., 2002; Redman et al., 2002). However, Artur de la Villarmois et al. (2019) propose that in Class I sources, the ratio of these two molecules could provide an interesting evolution diagnostic, assuming that the luminosity of the source is linked to the evolutionary stage of the source.
Figure. 14 represents the integrated line flux ratios \ceSO2/\ceC17O across our Class I sample as function of the luminosity of the sources. First, we can see that in our sample the luminosity and disk-to-envelope mass ratio are not correlated and luminosity alone is thus not likely a good evolutionary indicator here. For the sources where the \ceSO2 line we targeted here is detected (i.e., 4/7 in our sample), there is a noticeable increase in the \ceSO2/\ceC17O ratio with luminosity, but the highest luminosity sources present informative upper limits on this ratio which dramatically breaks the trend.
4.3 Class 0 versus Class I versus Class II chemistry
As opposed to Class I systems, many more spectral surveys have been performed to study the chemistry of the earliest stages of star formation, i.e. Class 0 objects – e.g., TIMASSS (Caux et al., 2011), PILS (Jørgensen et al., 2016), ASAI (Lefloch et al., 2018), SOLIS (Ceccarelli et al. 2017) – and of late planet-forming disks, i.e. Class II objects – DISCS (Öberg et al., 2010, 2011), CID (Guilloteau et al., 2016). The question that is still pending is to determine if the chemical composition of Class I objects is more Class 0-like, believed to be associated with \ceCH3OH and long carbon chains (e.g., Bergner et al., 2017; Law et al., 2018) or Class II-like, dominated by small molecules and an O-poor organic chemistry (e.g., Öberg et al., 2011; Guilloteau et al., 2016). Although the non-detection of larger molecules in Class II objects could be due to a detection bias, as the column densities typically decrease from Class 0 to Class II stages, non-oxygenated complex molecules, such as \ceHC3N and \ceCH3CN, are commonly observed in Class II disks (e.g., Bergner et al., 2018) as compared to O-containing complex molecules, such as \ceCH3OH, therefore highly favoring that disk organic chemistry is indeed O-poor (e.g., Le Gal et al., 2019a).
In the present work, we focused on small () molecules, with the detections of a wide variety of C, N, O, and S carriers - namely CO, \ceHCO+, HCN, HNC, CN, \ceN2H+, \ceC2H, CS, SO, \ceHCS+, \ceC2S, \ceSO2, OCS - and some of their D, 13C, 15N, 18O, 17O, and 34S isotopologues. This set of detections is thus already providing interesting information regarding the fact that Class I systems are richer than Class II objects in small molecules, since all the Class II disk species detected so far are also present in Class I stage and that, in addition, oxygen-bearing species are also detected in Class I stage, such as SO, \ceSO2, and OCS. In particular, we note that SO is systematically detected in all the sources of the Class I sample targeted here, contrary to Class II disks where it has only been reported toward a few young disks presenting active accretion signs (Fuente et al., 2010; Guilloteau et al., 2016; Pacheco-Vázquez et al., 2016; Booth et al., 2018).
However, interferometric observations are needed to distinguish which source components are traced by each of these species. This would be, in particular, beneficial to better understand the lack of O-bearing species in Class II disks, such as the lack of oxygenated S-bearing species reported so far (e.g., Semenov et al., 2018; Le Gal et al., 2019b). As for the comparison with Class 0 objects, complex organic detections from the same Class I survey will be presented in a forthcoming study and should thus allow to identify if long carbon chain and/or complex organic molecules are still present in Class I stage and in which quantities and proportions as compared to small organics.
5 Summary and Conclusion
We presented a new single-dish 3mm spectral line survey carried out with the IRAM-30m telescope toward a sample of seven Class I YSOs. Our main findings are summarized below:
-
1.
Our 3mm survey found that Class I YSOs are molecule-rich, considering the large number of spectral lines we found (see Fig. 1). We report the detections of twenty-seven spectral lines characterizing the main small () molecules of our survey - namely CO, \ceHCO+, HCN, HNC, CN, \ceN2H+, \ceC2H, CS, SO, \ceHCS+, \ceC2S, \ceSO2, OCS, including some of their D, 13C, 15N, 18O, 17O, and 34S isotopologues.
-
2.
For most species, integrated line intensities vary by 1-2 orders of magnitude across the source sample, even within the central narrow range of disk-to-envelope mass ratios varying from 0.2 to 0.5. There is a general negative trend in line intensity with increasing disk-to-envelope ratio, used as a proxy for the Class I evolutionary stage, but the more salient point is the large intensity variations found among sources with similar total masses.
-
3.
Line flux ratios proposed to trace C/N/O gas-phase ratios, do not show clear monotonic trends with disk-to-envelope mass ratio. A tentative negative correlation between \ceC2H/HCN and the disk-to-envelope mass ratio may indicate a decreasing C/N fraction due to C sequestration into grain mantles, although other scenarios, e.g. driven by UV-penetration, might also be possible.
-
4.
Line flux ratios that probe deuterium fractionation are rather constant across the Class I sample, which indicates similar thermal histories and/or current thermal structure toward Class I objects. Higher angular and spectral resolution observations are required to corroborate these conclusions.
-
5.
Comparing the HCN/HC15N measured in our Class I sample with ratios from other astrophysical environments, we found that the Class I ratios span between prestellar core and Class II disk values. This might either be indicative of the span in evolution of our sample, if the isotopic ratio is inherited; or of the span in physical properties of our sample, if the HCN/HC15N is reprocessed in situ, since this ratio is likely to be strongly altered with UV radiation in un-shielded environments where the visual extinction lies within 1 to 3 magnitudes (e.g., Heays et al., 2014).
-
6.
The CN/HCN ratio, proposed as a UV-field strength diagnostic, varies by almost one order of magnitude across our source sample. Its highest values are reached in I-04365 suggesting that this source might be the most UV-illuminated, but detailed abundance modelling is needed to confirm.
-
7.
The HNC/HCN ratio, proposed as a gas temperature proxy, is lower toward the sources with higher disk-to-envelope ratios, and the highest toward the source with the lowest luminosity and bolometric temperature, I-04166, where species characteristic of cold gas are the brightest.
-
8.
We explored the use of ratios of S-bearing species – CS/SO, CS/OCS, CS/\ceC2S, SO/\ceSO2, and SO/OCS – as tracers of the C/O elemental ratio and chemical evolutionary stage. Only CS/\ceC2S and SO/\ceSO2 show correlations with the disk-to-envelope mass ratio, which are found to be opposite. These opposite trends could indicate that these ratios probe different physical components of the Class I sources, but it could also be due to oxidized versus reduced S-chemistry. Higher angular resolution observations are required to further explored these results.
-
9.
To illustrate the chemical differentiation within our sample, we built a cluster correlation matrix that highlights three main groups of correlated species: (i) dense cold gas tracers, (ii) shocked gas tracers, and (iii) dense ionized gas tracers - likely probing more UV-illuminated regions than the previous ones.
-
10.
To compare our results to other Class I surveys, we focused on the \ceSO2/C17O ratio proposed to be a Class I evolutionary tracer, assuming that the latter is correlated with source luminosity (Artur de la Villarmois et al., 2019). First, in our sample, the disk-to-envelope mass ratio that we proposed as a proxy for evolutionary stage is not correlated with source luminosity. Second, although there could be a tentative correlation in between this ratio and source luminosity within our sample, the fact that the ratios derived in the highest luminosity sources rely on upper limits breaks the trend.
-
11.
Finally, we discuss the similarities and differences we found when comparing our Class I chemical results to Class 0 and Class II chemistry. Class I sources are found to be more chemically rich and diverse than Class II sources, the latter being known to harbor an O-poor organic chemistry. Class 0 objects are usually associated with more complex molecules and long carbon chains. However, in the present work we focused on small () molecules. The composition in bigger and more complex organic molecules within the same sample of Class I sources will be investigated in a forthcoming study.
These results already provide important information on the chemical content and the relationship between Class I chemistry, evolutionary stage and other source properties. Since all sources are located in the same star-forming region, our analysis avoids cloud-to-cloud background variations, but as a result, it may not be representative of all regions of the sky. Additional observations are required to extend this Class I sample and increase the statistics and demography on Class I YSO chemistry. Interferometric observations will be beneficial to elucidate the contributions of envelope and disk chemistry to the observed emission lines. Future work on complex organics in the same sample should also provide additional clues on the evolution and chemical content of these objects.
Appendix A Optical Depth Effects
Line optical depth can be assessed when several isotopologues of the same line are detected or when the line possesses a hyperfine pattern that is resolved by the observations. In this appendix, we investigate the line opacity of some of the molecular species we detected possessing one of these characteristics and for which puzzling results were found. For instance, the brightest lines of CS, HCN, and \ceHCO+ occur in different sources than their respective fainter isotopologues. Similarly, the brightest \ceH^13CO+ and \ceHC^18O+ lines also occur in different sources. Furthermore, it seems that the more abundant isotopologues \ceH^13CO+ and CS are brighter in the source with the second smallest disk-to-envelope ratio, I-04169, whereas the rarer ones are brighter in the one with the smallest ratio, I-04181. All these results could be due to optical depth effects coming either from the lines themselves, or even from the dust continuum. Dust opacity estimate being out of the scope of this work, we focus here on line opacity study.
A.1 Isotopologue Ratios
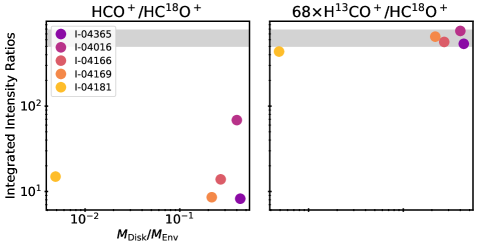
To investigate the opacity of the \ceHCO+ and \ceH^13CO+ lines, we derived their isotopologue line flux ratios with the \ceHC^18O+ line, which is expected to be thin. As depicted in Fig. 15, across the seven Class I sources of our sample, \ceHCO+/\ceHC^18O+ line ratio does not exceed 60. Across the five sources of our sample where \ceHC^18O+ is detected, the \ceH^13CO+/\ceHC^18O+ ratio varies from 11.2 (in I-04016) to 6.4 (in I-04181) (see Table 3), which leads to an \ceHCO+/\ceHC^18O+ ratio varying from 762 (in I-04016) to 436 (in I-04181), assuming the local ISM 12C/13C ratio of (Milam et al., 2005; Asplund et al., 2009; Manfroid et al., 2009). In the ISM, the 16O/18O ratio is found to be (Wilson, 1999), close to the Solar System value of 530 in the Solar wind (McKeegan et al., 2011), 511 10 in the photosphere of the Sun (Ayres et al., 2013), and in comets (Jehin et al., 2009; Bockelée-Morvan et al., 2012) and meteorites (Lodders, 2003). In the diffuse ISM, the 16O/18O ratio is found to be a bit higher, with a value of derived from the \ceHCO+/\ceHC^18O+ ratio (Lucas & Liszt, 1998). Hence, these results confirm that \ceHCO+ is highly thick. On the contrary, the \ceH^13CO+ line seems to be rather thin except in one source, I-04181. However, variation in the 12C/13C and/or 16O/18O isotopic ratios in Class I YSOs cannot be excluded. Higher spatial resolution observations are required to disentangle between these two scenarios, to determine whether the lines are tracing the same regions and physical components of the sources.
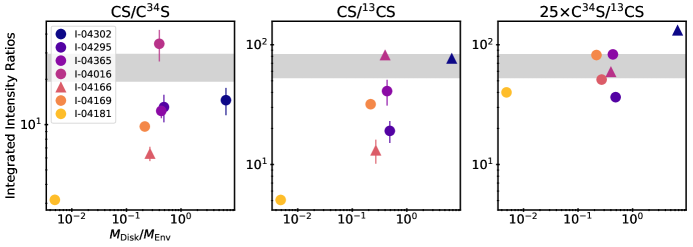
Similarly, in Fig. 16 we compare the CS/C34S, CS/13CS, and C34S/13CS, isotopologue line flux ratios with the elemental 32S/34S in the vicinity of the Sun (Chin et al., 1996) and 12C/13C in the local ISM (Milam et al., 2005; Asplund et al., 2009; Manfroid et al., 2009). The CS/13CS and CS/C34S isotopologue ratios are found to be lower than the elemental ratios in 5/7 and 6/7 sources, respectively, from a factor of two up to one order of magnitude in I-04181, the source with the smallest disk-to-envelope ratio. The isotopologue ratios are only found to be compatible with elemental ratios in I-04016, for both of them, and in I-04302, for the CS/13CS. As for the C34S/13CS ratios in all seven sources, they are all within a factor of two of the assumed elemental isotopic ratios, which is a very reasonable factor of uncertainty due to fractionation. Thus, it is very likely that both fainter isotopologues C34S and 13CS are optically thin in our source sample. Hence, the fact that the brightest lines of CS appear in a different source than its fainter isotopologues is indeed likely due to optical depth effects.
A.2 Resolved hyperfine structure
HCN, H13CN, and \ceN2H+ lines split into a resolved set of hyperfine (hf) components, whose relative opacities are given by their Einstein coefficient for spontaneous decay and level degeneracy. In the LTE approximation, assuming that for each species all of the hf lines have the same excitation temperature, they can be used to infer the total opacity of the hf multiplet. Each hf component at rest frequency has an opacity that scales accordingly with its relative intensity . Assuming Gaussian profiles, the total opacity can thus be written as follows:
| (A1) |
where the sum is over all hf components, is the systemic source velocity, and the velocity shift of a particular hf component . Considering these assumptions, we derived the line opacity of the HCN, H13CN, and \ceN2H+ lines toward the sources of our sample where their hyperfine patterns are well-resolved (see Fig. 3), using LTE modeling through the CASSIS tool. The results are listed in Table 4 and shown for each molecule for one source, I-04166, in Fig. 17, for illustration. HCN is found to be highly optically thick in 4/7 sources, and marginally optically thick in the remaining three sources. \ceH^13CN and \ceN2H+ are found to be optically thin in all sources where they are detected.
| Species | Opacity | ||||||
|---|---|---|---|---|---|---|---|
| I-04302 | I-04295 | I-04365 | I-04016 | I-04166 | I-04169 | I-04181 | |
| HCN | |||||||
| \ceH^13CN | …(a) | … | |||||
| \ceN2H+ | … | ||||||
References
- Aikawa et al. (2018) Aikawa, Y., Furuya, K., Hincelin, U., & Herbst, E. 2018, ApJ, 855, 119
- ALMA Partnership et al. (2015) ALMA Partnership, Brogan, C. L., Pérez, L. M., et al. 2015, ApJ, 808, L3
- Andrews (2020) Andrews, S. M. 2020, arXiv e-prints, arXiv:2001.05007
- Andrews & Williams (2005) Andrews, S. M., & Williams, J. P. 2005, ApJ, 631, 1134
- Andrews et al. (2018) Andrews, S. M., Huang, J., Pérez, L. M., et al. 2018, arXiv e-prints, arXiv:1812.04040
- Ansdell et al. (2016) Ansdell, M., Williams, J. P., van der Marel, N., et al. 2016, ApJ, 828, 46
- Artur de la Villarmois et al. (2019) Artur de la Villarmois, E., Jørgensen, J. K., Kristensen, L. E., et al. 2019, A&A, 626, A71
- Aso et al. (2015) Aso, Y., Ohashi, N., Saigo, K., et al. 2015, ApJ, 812, 27
- Asplund et al. (2009) Asplund, M., Grevesse, N., Sauval, A. J., & Scott, P. 2009, ARA&A, 47, 481
- Ayres et al. (2013) Ayres, T. R., Lyons, J. R., Ludwig, H. G., Caffau, E., & Wedemeyer-Böhm, S. 2013, ApJ, 765, 46
- Baan et al. (2008) Baan, W. A., Henkel, C., Loenen, A. F., Baudry, A., & Wiklind, T. 2008, A&A, 477, 747
- Barenfeld et al. (2016) Barenfeld, S. A., Carpenter, J. M., Ricci, L., & Isella, A. 2016, ApJ, 827, 142
- Beck (2007) Beck, T. L. 2007, AJ, 133, 1673
- Benson & Myers (1989) Benson, P. J., & Myers, P. C. 1989, ApJS, 71, 89
- Bergin et al. (2003) Bergin, E., Calvet, N., D’Alessio, P., & Herczeg, G. J. 2003, ApJ, 591, L159
- Bergin et al. (2016) Bergin, E. A., Du, F., Cleeves, L. I., et al. 2016, ApJ, 831, 101
- Bergin et al. (1997) Bergin, E. A., Goldsmith, P. F., Snell, R. L., & Langer, W. D. 1997, ApJ, 482, 285
- Bergner et al. (2018) Bergner, J. B., Guzmán, V. G., Öberg, K. I., Loomis, R. A., & Pegues, J. 2018, ApJ, 857, 69
- Bergner et al. (2019) Bergner, J. B., Öberg, K. I., Bergin, E. A., et al. 2019, ApJ, 876, 25
- Bergner et al. (2017) Bergner, J. B., Öberg, K. I., Garrod, R. T., & Graninger, D. M. 2017, ApJ, 841, 120
- Bjerkeli et al. (2016) Bjerkeli, P., van der Wiel, M. H. D., Harsono, D., Ramsey, J. P., & Jørgensen, J. K. 2016, Nature, 540, 406
- Bockelée-Morvan et al. (2012) Bockelée-Morvan, D., Biver, N., Swinyard, B., et al. 2012, A&A, 544, L15
- Bockelée-Morvan et al. (2015) Bockelée-Morvan, D., Calmonte, U., Charnley, S., et al. 2015, Space Sci. Rev., 197, 47
- Bontemps et al. (1996) Bontemps, S., Andre, P., Terebey, S., & Cabrit, S. 1996, A&A, 311, 858
- Booth et al. (2018) Booth, A. S., Walsh, C., Kama, M., et al. 2018, A&A, 611, A16
- Brinch et al. (2007a) Brinch, C., Crapsi, A., Hogerheijde, M. R., & Jørgensen, J. K. 2007a, A&A, 461, 1037
- Brinch et al. (2007b) Brinch, C., Crapsi, A., Jørgensen, J. K., Hogerheijde, M. R., & Hill, T. 2007b, A&A, 475, 915
- Bublitz et al. (2019) Bublitz, J., Kastner, J. H., Santander-García, M., et al. 2019, A&A, 625, A101
- Carter et al. (2012) Carter, M., Lazareff, B., Maier, D., et al. 2012, A&A, 538, A89
- Caselli (2002) Caselli, P. 2002, Planet. Space Sci., 50, 1133
- Caselli & Ceccarelli (2012) Caselli, P., & Ceccarelli, C. 2012, A&A Rev., 20, 56
- Caselli et al. (1999) Caselli, P., Walmsley, C. M., Tafalla, M., Dore, L., & Myers, P. C. 1999, ApJ, 523, L165
- Caux et al. (2011) Caux, E., Kahane, C., Castets, A., et al. 2011, A&A, 532, A23
- Cazzoletti et al. (2019) Cazzoletti, P., Manara, C. F., Baobab Liu, H., et al. 2019, A&A, 626, A11
- Ceccarelli et al. (2014) Ceccarelli, C., Caselli, P., Bockelée-Morvan, D., et al. 2014, in Protostars and Planets VI, ed. H. Beuther, R. S. Klessen, C. P. Dullemond, & T. Henning, 859
- Chandler et al. (1995) Chandler, C. J., Terebey, S., Barsony, M., & Moore, T. J. T. 1995, Ap&SS, 224, 109
- Chapillon et al. (2012) Chapillon, E., Guilloteau, S., Dutrey, A., Piétu, V., & Guélin, M. 2012, A&A, 537, A60
- Charnley (1997) Charnley, S. B. 1997, ApJ, 481, 396
- Chiang & Goldreich (1999) Chiang, E. I., & Goldreich, r. 1999, ApJ, 519, 279
- Chin et al. (1996) Chin, Y.-N., Henkel, C., Whiteoak, J. B., Langer, N., & Churchwell, E. B. 1996, A&A, 305, 960
- Clayton (2002) Clayton, R. N. 2002, Nature, 415, 860
- Cleeves et al. (2018) Cleeves, L. I., Öberg, K. I., Wilner, D. J., et al. 2018, ApJ, 865, 155
- Connelley & Greene (2010) Connelley, M. S., & Greene, T. P. 2010, AJ, 140, 1214
- Dalgarno & Lepp (1984) Dalgarno, A., & Lepp, S. 1984, ApJ, 287, L47
- Davis et al. (2010) Davis, C. J., Chrysostomou, A., Hatchell, J., et al. 2010, MNRAS, 405, 759
- Du et al. (2015) Du, F., Bergin, E. A., & Hogerheijde, M. R. 2015, ApJ, 807, L32
- Dullemond et al. (2007) Dullemond, C. P., Hollenbach, D., Kamp, I., & D’Alessio, P. 2007, in Protostars and Planets V, ed. B. Reipurth, D. Jewitt, & K. Keil, 555
- Dullemond et al. (2019) Dullemond, C. P., Küffmeier, M., Goicovic, F., et al. 2019, A&A, 628, A20
- Dutrey et al. (1997) Dutrey, A., Guilloteau, S., & Guelin, M. 1997, A&A, 317, L55
- Dutrey et al. (2014) Dutrey, A., Semenov, D., Chapillon, E., et al. 2014, Protostars and Planets VI, 317
- Eisner (2012) Eisner, J. A. 2012, ApJ, 755, 23
- Eisner et al. (2018) Eisner, J. A., Arce, H. G., Ballering, N. P., et al. 2018, ApJ, 860, 77
- Feigelson & Montmerle (1999) Feigelson, E. D., & Montmerle, T. 1999, ARA&A, 37, 363
- Fuente et al. (2010) Fuente, A., Cernicharo, J., Agúndez, M., et al. 2010, A&A, 524, A19
- Fuente et al. (2003) Fuente, A., Rodrıguez-Franco, A., Garcıa-Burillo, S., Martın-Pintado, J., & Black, J. H. 2003, A&A, 406, 899
- Fuente et al. (2019) Fuente, A., Navarro, D. G., Caselli, P., et al. 2019, A&A, 624, A105
- Furlan et al. (2008) Furlan, E., McClure, M., Calvet, N., et al. 2008, ApJS, 176, 184
- Gaia Collaboration (2018) Gaia Collaboration. 2018, VizieR Online Data Catalog, I/345
- Galli et al. (2019) Galli, P. A. B., Loinard, L., Bouy, H., et al. 2019, A&A, 630, A137
- Gildas Team (2013) Gildas Team. 2013, GILDAS: Grenoble Image and Line Data Analysis Software, , , ascl:1305.010
- Gorti & Hollenbach (2009) Gorti, U., & Hollenbach, D. 2009, ApJ, 690, 1539
- Green et al. (2013) Green, J. D., Evans, Neal J., I., Jørgensen, J. K., et al. 2013, ApJ, 770, 123
- Guilloteau et al. (2016) Guilloteau, S., Reboussin, L., Dutrey, A., et al. 2016, A&A, 592, A124
- Guzmán et al. (2017) Guzmán, V. V., Öberg, K. I., Huang, J., Loomis, R., & Qi, C. 2017, ApJ, 836, 30
- Guzmán et al. (2015) Guzmán, V. V., Öberg, K. I., Loomis, R., & Qi, C. 2015, ApJ, 814, 53
- Hacar et al. (2019) Hacar, A., Bosman, A. D., & van Dishoeck, E. F. 2019, arXiv e-prints, arXiv:1910.13754
- Hacar et al. (2013) Hacar, A., Tafalla, M., Kauffmann, J., & Kovács, A. 2013, A&A, 554, A55
- Harsono et al. (2018) Harsono, D., Bjerkeli, P., van der Wiel, M. H. D., et al. 2018, Nature Astronomy, 2, 646
- Harsono et al. (2014) Harsono, D., Jørgensen, J. K., van Dishoeck, E. F., et al. 2014, A&A, 562, A77
- Hatchell et al. (1998) Hatchell, J., Thompson, M. A., Millar, T. J., & MacDonald, G. H. 1998, A&A, 338, 713
- Hayashi (1981) Hayashi, C. 1981, Progress of Theoretical Physics Supplement, 70, 35
- Heays et al. (2014) Heays, A. N., Visser, R., Gredel, R., et al. 2014, A&A, 562, A61
- Herpin et al. (2009) Herpin, F., Marseille, M., Wakelam, V., Bontemps, S., & Lis, D. C. 2009, A&A, 504, 853
- Hily-Blant et al. (2017) Hily-Blant, P., Magalhaes, V., Kastner, J., et al. 2017, A&A, 603, L6
- Hily-Blant et al. (2019) Hily-Blant, P., Magalhaes de Souza, V., Kastner, J., & Forveille, T. 2019, arXiv e-prints, arXiv:1911.06676
- Hogerheijde (2001) Hogerheijde, M. R. 2001, ApJ, 553, 618
- Hogerheijde & Sandell (2000) Hogerheijde, M. R., & Sandell, G. 2000, ApJ, 534, 880
- Hogerheijde et al. (1998) Hogerheijde, M. R., van Dishoeck, E. F., Blake, G. A., & van Langevelde, H. J. 1998, ApJ, 502, 315
- Huang & Öberg (2015) Huang, J., & Öberg, K. I. 2015, ApJ, 809, L26
- Huang et al. (2017) Huang, J., Öberg, K. I., Qi, C., et al. 2017, ApJ, 835, 231
- Huang et al. (2018) Huang, J., Andrews, S. M., Dullemond, C. P., et al. 2018, ApJ, 869, L42
- Hunter (2007) Hunter, J. D. 2007, Computing in Science Engineering, 9, 90
- Igea & Glassgold (1999) Igea, J., & Glassgold, A. E. 1999, ApJ, 518, 848
- Jacobsen et al. (2019) Jacobsen, S. K., Jørgensen, J. K., Di Francesco, J., et al. 2019, A&A, 629, A29
- Jehin et al. (2009) Jehin, E., Manfroid, J., Hutsemékers, D., Arpigny, C., & Zucconi, J. M. 2009, Earth Moon and Planets, 105, 167
- Jonkheid et al. (2004) Jonkheid, B., Faas, F. G. A., van Zadelhoff, G. J., & van Dishoeck, E. F. 2004, A&A, 428, 511
- Jørgensen et al. (2004) Jørgensen, J. K., Schöier, F. L., & van Dishoeck, E. F. 2004, A&A, 416, 603
- Jørgensen et al. (2016) Jørgensen, J. K., van der Wiel, M. H. D., Coutens, A., et al. 2016, A&A, 595, A117
- Kastner et al. (2015) Kastner, J. H., Qi, C., Gorti, U., et al. 2015, ApJ, 806, 75
- Klein et al. (2012) Klein, B., Hochgürtel, S., Krämer, I., et al. 2012, A&A, 542, L3
- Kuffmeier et al. (2020) Kuffmeier, M., Goicovic, F. G., & Dullemond, C. P. 2020, A&A, 633, A3
- Kuffmeier et al. (2017) Kuffmeier, M., Haugbølle, T., & Nordlund, Å. 2017, ApJ, 846, 7
- Lada & Wilking (1984) Lada, C. J., & Wilking, B. A. 1984, ApJ, 287, 610
- Law et al. (2018) Law, C. J., Öberg, K. I., Bergner, J. B., & Graninger, D. 2018, ApJ, 863, 88
- Law et al. (2017) Law, C. J., Ricci, L., Andrews, S. M., Wilner, D. J., & Qi, C. 2017, AJ, 154, 255
- Le Gal et al. (2019a) Le Gal, R., Brady, M. T., Öberg, K. I., Roueff, E., & Le Petit, F. 2019a, ApJ, 886, 86
- Le Gal et al. (2019b) Le Gal, R., Öberg, K. I., Loomis, R. A., Pegues, J., & Bergner, J. B. 2019b, ApJ, 876, 72
- Lefloch et al. (2018) Lefloch, B., Bachiller, R., Ceccarelli, C., et al. 2018, MNRAS, 477, 4792
- Liang et al. (2007) Liang, M.-C., Heays, A. N., Lewis, B. R., Gibson, S. T., & Yung, Y. L. 2007, ApJ, 664, L115
- Lodders (2003) Lodders, K. 2003, ApJ, 591, 1220
- Long et al. (2017) Long, F., Herczeg, G. J., Pascucci, I., et al. 2017, ApJ, 844, 99
- Long et al. (2018) Long, F., Pinilla, P., Herczeg, G. J., et al. 2018, ApJ, 869, 17
- Lubowich et al. (2000) Lubowich, D. A., Pasachoff, J. M., Balonek, T. J., et al. 2000, Nature, 405, 1025
- Lucas & Roche (1997) Lucas, P. W., & Roche, P. F. 1997, MNRAS, 286, 895
- Lucas & Liszt (1998) Lucas, R., & Liszt, H. 1998, A&A, 337, 246
- Magalhães et al. (2018) Magalhães, V. S., Hily-Blant, P., Faure, A., Hernand ez-Vera, M., & Lique, F. 2018, A&A, 615, A52
- Manara et al. (2018) Manara, C. F., Morbidelli, A., & Guillot, T. 2018, A&A, 618, L3
- Manfroid et al. (2009) Manfroid, J., Jehin, E., Hutsemékers, D., et al. 2009, A&A, 503, 613
- McKeegan et al. (2011) McKeegan, K. D., Kallio, A. P. A., Heber, V. S., et al. 2011, Science, 332, 1528
- McKinney (2010) McKinney, W. 2010, in Proceedings of the 9th Python in Science Conference, ed. S. van der Walt & J. Millman, 51 – 56
- Milam et al. (2005) Milam, S. N., Savage, C., Brewster, M. A., Ziurys, L. M., & Wyckoff, S. 2005, ApJ, 634, 1126
- Miotello et al. (2019) Miotello, A., Facchini, S., van Dishoeck, E. F., et al. 2019, A&A, 631, A69
- Müller et al. (2005) Müller, H. S. P., Schlöder, F., Stutzki, J., & Winnewisser, G. 2005, Journal of Molecular Structure, 742, 215
- Müller et al. (2001) Müller, H. S. P., Thorwirth, S., Roth, D. A., & Winnewisser, G. 2001, A&A, 370, L49
- Mumma & Charnley (2011) Mumma, M. J., & Charnley, S. B. 2011, ARA&A, 49, 471
- Myers et al. (1988) Myers, P. C., Heyer, M., Snell, R. L., & Goldsmith, P. F. 1988, ApJ, 324, 907
- Öberg et al. (2015) Öberg, K. I., Furuya, K., Loomis, R., et al. 2015, ApJ, 810, 112
- Öberg et al. (2010) Öberg, K. I., Qi, C., Fogel, J. K. J., et al. 2010, ApJ, 720, 480
- Öberg et al. (2011) Öberg, K. I., Qi, C., Fogel, J. K. J., et al. 2011, ApJ, 734, 98
- Ohashi et al. (1997) Ohashi, N., Hayashi, M., Ho, P. T. P., et al. 1997, ApJ, 488, 317
- Pacheco-Vázquez et al. (2016) Pacheco-Vázquez, S., Fuente, A., Baruteau, C., et al. 2016, A&A, 589, A60
- Patel et al. (2015) Patel, B. H., Percivalle, C., Ritson, D. J., Duffy, C. D., & Sutherland, J. D. 2015, Nature Chemistry, 7, 301 EP . https://doi.org/10.1038/nchem.2202
- Pety (2005) Pety, J. 2005, in SF2A-2005: Semaine de l’Astrophysique Francaise, ed. F. Casoli, T. Contini, J. M. Hameury, & L. Pagani, 721
- Podio et al. (2015) Podio, L., Codella, C., Gueth, F., et al. 2015, A&A, 581, A85
- Redman et al. (2002) Redman, M. P., Rawlings, J. M. C., Nutter, D. J., Ward-Thompson, D., & Williams, D. A. 2002, MNRAS, 337, L17
- Riaz et al. (2018) Riaz, B., Thi, W. F., & Caselli, P. 2018, MNRAS, 481, 4662
- Roberts et al. (2003) Roberts, H., Herbst, E., & Millar, T. J. 2003, ApJ, 591, L41
- Roueff et al. (2015) Roueff, E., Loison, J. C., & Hickson, K. M. 2015, A&A, 576, A99
- Sakai et al. (2014) Sakai, N., Sakai, T., Hirota, T., et al. 2014, Nature, 507, 78
- Salinas et al. (2017) Salinas, V. N., Hogerheijde, M. R., Mathews, G. S., et al. 2017, A&A, 606, A125
- Santiago-García et al. (2009) Santiago-García, J., Tafalla, M., Johnstone, D., & Bachiller, R. 2009, A&A, 495, 169
- Schilke et al. (1992) Schilke, P., Walmsley, C. M., Pineau Des Forets, G., et al. 1992, A&A, 256, 595
- Semenov et al. (2018) Semenov, D., Favre, C., Fedele, D., et al. 2018, A&A, 617, A28
- Sheehan & Eisner (2017) Sheehan, P. D., & Eisner, J. A. 2017, ApJ, 851, 45
- Sheehan & Eisner (2018) —. 2018, ApJ, 857, 18
- Shinnaka et al. (2016) Shinnaka, Y., Kawakita, H., Jehin, E., et al. 2016, MNRAS, 462, S195
- Shirley (2015) Shirley, Y. L. 2015, PASP, 127, 299
- Stäuber et al. (2007) Stäuber, P., Benz, A. O., Jørgensen, J. K., et al. 2007, A&A, 466, 977
- Swade (1989) Swade, D. A. 1989, ApJ, 345, 828
- Tafalla et al. (2002) Tafalla, M., Myers, P. C., Caselli, P., Walmsley, C. M., & Comito, C. 2002, ApJ, 569, 815
- Tafalla et al. (2004) Tafalla, M., Santiago, J., Johnstone, D., & Bachiller, R. 2004, A&A, 423, L21
- Tafalla et al. (2017) Tafalla, M., Su, Y. N., Shang, H., et al. 2017, A&A, 597, A119
- Takakuwa et al. (2017) Takakuwa, S., Saigo, K., Matsumoto, T., et al. 2017, ApJ, 837, 86
- Tazzari et al. (2017) Tazzari, M., Testi, L., Natta, A., et al. 2017, A&A, 606, A88
- Terzieva & Herbst (2000) Terzieva, R., & Herbst, E. 2000, MNRAS, 317, 563
- Thi et al. (2004) Thi, W. F., van Zadelhoff, G. J., & van Dishoeck, E. F. 2004, A&A, 425, 955
- van der Walt et al. (2011) van der Walt, S., Colbert, S. C., & Varoquaux, G. 2011, Computing in Science and Engineering, 13, 22
- van Dishoeck & Blake (1998) van Dishoeck, E. F., & Blake, G. A. 1998, ARA&A, 36, 317
- van Terwisga et al. (2019) van Terwisga, S. E., van Dishoeck, E. F., Cazzoletti, P., et al. 2019, A&A, 623, A150
- Vidal & Wakelam (2018) Vidal, T. H. G., & Wakelam, V. 2018, MNRAS, 474, 5575
- Virtanen et al. (2020) Virtanen, P., Gommers, R., Oliphant, T. E., et al. 2020, Nature Methods, 17, 261
- Viti et al. (2004) Viti, S., Collings, M. P., Dever, J. W., McCoustra, M. R. S., & Williams, D. A. 2004, MNRAS, 354, 1141
- Wakelam et al. (2011) Wakelam, V., Hersant, F., & Herpin, F. 2011, A&A, 529, A112
- Wang et al. (2019) Wang, L.-Y., Shang, H., & Chiang, T.-Y. 2019, ApJ, 874, 31
- Wang et al. (2014) Wang, L.-Y., Shang, H., Su, Y.-N., et al. 2014, ApJ, 780, 49
- Waskom et al. (2018) Waskom, M., Botvinnik, O., O’Kane, D., et al. 2018, mwaskom/seaborn: v0.9.0 (July 2018), vv0.9.0, Zenodo, doi:10.5281/zenodo.1313201. https://doi.org/10.5281/zenodo.1313201
- Wasserstein & Lazar (2016) Wasserstein, R. L., & Lazar, N. A. 2016, The American Statistician, 70, 129. https://doi.org/10.1080/00031305.2016.1154108
- Weidenschilling (1977) Weidenschilling, S. J. 1977, Ap&SS, 51, 153
- White et al. (2007) White, R. J., Greene, T. P., Doppmann, G. W., Covey, K. R., & Hillenbrand, L. A. 2007, in Protostars and Planets V, ed. B. Reipurth, D. Jewitt, & K. Keil, 117
- Willacy (2007) Willacy, K. 2007, ApJ, 660, 441
- Wilson (1999) Wilson, T. L. 1999, Reports on Progress in Physics, 62, 143
- Wirström & Charnley (2018) Wirström, E. S., & Charnley, S. B. 2018, MNRAS, 474, 3720
- Woitke et al. (2010) Woitke, P., Pinte, C., Tilling, I., et al. 2010, MNRAS, 405, L26
- Woitke et al. (2016) Woitke, P., Min, M., Pinte, C., et al. 2016, A&A, 586, A103
- Wolf et al. (2003) Wolf, S., Padgett, D. L., & Stapelfeldt, K. R. 2003, ApJ, 588, 373
- Yen et al. (2017) Yen, H.-W., Koch, P. M., Takakuwa, S., et al. 2017, ApJ, 834, 178
- Yen et al. (2013) Yen, H.-W., Takakuwa, S., Ohashi, N., & Ho, P. T. P. 2013, ApJ, 772, 22
- Yen et al. (2014) Yen, H.-W., Takakuwa, S., Ohashi, N., et al. 2014, ApJ, 793, 1
- Young et al. (2003) Young, C. H., Shirley, Y. L., Evans, Neal J., I., & Rawlings, J. M. C. 2003, ApJS, 145, 111
- Yu et al. (2017a) Yu, M., Evans, Neal J., I., Dodson-Robinson, S. E., Willacy, K., & Turner, N. J. 2017a, ApJ, 841, 39
- Yu et al. (2017b) —. 2017b, ApJ, 850, 169
- Zhang et al. (2019) Zhang, K., Bergin, E. A., Schwarz, K., Krijt, S., & Ciesla, F. 2019, ApJ, 883, 98