Using graph theory and social media data to assess cultural ecosystem services in coastal areas: Method development and application111© 2020. This manuscript version is made available under the CC-BY-NC-ND 4.0 license http://creativecommons.org/licenses/by-nc-nd/4.0/
Abstract
The use of social media (SM) data has emerged as a promising tool for the assessment of cultural ecosystem services (CES). Most studies have focused on the use of single SM platforms and on the analysis of photo content to assess the demand for CES. Here, we introduce a novel methodology for the assessment of CES using SM data through the application of graph theory network analyses (GTNA) on hashtags associated to SM posts and compare it to photo content analysis. We applied the proposed methodology on two SM platforms, Instagram and Twitter, on three worldwide known case study areas, namely Great Barrier Reef, Galapagos Islands and Easter Island. Our results indicate that the analysis of hashtags through graph theory offers similar capabilities to photo content analysis in the assessment of CES provision and the identification of CES providers. More importantly, GTNA provides greater capabilities at identifying relational values and eudaimonic aspects associated to nature, elusive aspects for photo content analysis. In addition, GTNA contributes to the reduction of the interpreter’s bias associated to photo content analyses, since GTNA is based on the tags provided by the users themselves. The study also highlights the importance of considering data from different social media platforms, as the type of users and the information offered by these platforms can show different CES attributes. The ease of application and short computing processing times involved in the application of GTNA makes it a cost-effective method with the potential of being applied to large geographical scales.
Running page head: Graph theory to assess CES from social media
Key words: Relational values, Eudaimonia, Marine and coastal areas, Graph theory, Network analysis, Deep learning, Ecosystem services bundles
Introduction
Humans are deeply connected to the largest biome of the planet—the Ocean. For centuries, humans have lived in coastal communities where people fished, gleaned and hunted to support their livelihoods (Erlandson and Rick, 2010). Humans are highly dependent on the benefits and services provided by ecosystems (McMichael et al., 2005). Living by the coast shapes cultures and identities whose actions influence the marine and coastal physical environments to which coastal communities are connected to (Klain et al., 2014). Marine and coastal ecosystem services (ES), such as food provision, climate regulation or the creation of opportunities for recreation and relaxation, are fundamental elements in the maintenance of human wellbeing (Selig et al., 2019). Human interactions with coasts can also affect mental health in many ways, and the forms of evidence include positive effects related to happiness, social interactions, social cohesion and engagement; a sense of meaning and purpose in life; and decreases in mental distress (Bratman et al., 2019).
Cultural ecosystem services (CES) are some of the benefits people can most directly relate to, since most human-nature interactions fall within the CES category (Garcia Rodrigues et al., 2017; Leenhardt et al., 2015). However, marine ecosystem services [and CES in particular] have been impacted at unprecedented rates by climate change (namely in the form of ocean warming, ocean acidification, deoxygenation, and sea level rise) and direct anthropogenic activities (e.g. fishing, pollution and habitat degradation) (IPBES, 2019). In addition, CES are often overlooked in conservation and management schemes for marine and coastal areas (Chan et al., 2012; Everard et al., 2010; Garcia Rodrigues et al., 2017). Defining human-nature interactions in coastal areas and the type of CES offered, e.g. the activities people undertake, what they value, what habitats or species attract most attention, at scales relevant for marine and coastal management is time consuming and often requires resources which are not generally available (Waldron et al., 2013). In recent years, social media data, that is, data created and shared by users on social media platforms, has emerged as a potential useful source of information in environmental research, management and conservation (Di Minin et al., 2015; Ghermandi and Sinclair, 2019; Toivonen et al., 2019). Among the most popular social media networking sites we find Facebook, YouTube, Instagram, Twitter or Flickr (Di Minin et al., 2015; Toivonen et al., 2019). Typically, social media users share data in the form of tags, text, images or videos depending on the platform of choice. As an example, Instagram users generally share images often complemented with a short text and relevant tags selected by the user. In comparison, Twitter works as a micro-blogging platform, where users share short messages (currently limited to 270 characters) sometimes accompanied by an image. In addition to differences in data content type, there are also differences in users’ demographic characteristics between social media platforms, e.g., the proportion of females, young adults and teenagers is higher in Instagram than in Twitter (PRC, 2019). Despite differences in data content and user types, social media data mining and analysis has proven very valuable as it can provide information on how people interact with their environment, including interactions with nature (Di Minin et al., 2015; Mancini et al., 2018) people’s preferences for nature-based experiences (Hausmann et al., 2017; Oteros-Rozas et al., 2018), visitation patterns in conservation areas (Tenkanen et al., 2017; Wood et al., 2013) or on mapping CES (Clemente et al., 2019; Richards and Friess, 2015). So far, however, while the number of studies focusing on the terrestrial environment is increasing, few had marine and coastal areas within their scope (Ghermandi and Sinclair, 2019; Toivonen et al., 2019).
Generally, social media data mining studies have restricted their scope to a single social media platform (Ghermandi and Sinclair, 2019; Toivonen et al., 2019), therefore limiting their assessments to particular data formats, to certain sectors of the population (PRC, 2019), or to particular user’s needs and behaviours (Manikonda et al., 2016; Tenkanen et al., 2017). Logically, most studies have relied on social media platforms that offer easy data access such as Flickr. Flickr, a social media platform popular among nature photographers with over 90 million monthly active users (2018), allows unrestricted access to user posted content for non-commercial use through their Application Programming Interface (API). On the other hand, Instagram, the most popular social media platform (1 billion monthly active users in 2018) after Facebook (2.26 billion users) (Ortiz-Ospina, 2019), has increasingly restricted content access through their API since 2016. As a consequence, the majority of studies have relied on Flickr as a source of data (Ghermandi and Sinclair, 2019; Toivonen et al., 2019). However, due to limited user numbers and post frequency, the amount of observations provided by Flickr is sometimes too low to adequately represent visitor rates in natural areas, as opposed to the higher representativeness achieved through the use of Instagram (Tenkanen et al., 2017). In addition, Flickr predominantly contains nature and wildlife photography, while pictures including people are more frequent in Instagram (Tenkanen et al., 2017). Therefore, limiting analysis to Flickr data could lead to an over-representation of particular CES (e.g. wildlife observation) while under-representing others, such as people actively engaging with nature through an activity (e.g. recreational activities).
Regarding the methodological approaches used in the analysis of social media data, a high proportion of studies have used images as a primary source of information to assess the benefits associated to an area and their spatial distribution (Wood et al., 2013). Geolocation of post images has been used to assess the spatial distribution of the supply and demand of CES (e.g. Clemente et al., 2019), while photo content analysis provides information of the type of CES provided by a particular area. Most studies have relied on the manual classification of photo content; however, this is extremely time consuming. Recently, new methodologies based on artificial intelligence and deep-learning approaches have increasingly facilitated the automatic description of photo content (e.g. Lee et al., 2019), reducing data processing time to a fraction. While the application of artificial intelligence represents a milestone in the analysis of photo content, it still presents some challenges in its application and outcomes (Lee et al., 2019).
To advance in the assessment of CES provided by nature through social media data, we present a novel methodology based on the analysis of text information associated to social media posts (i.e. hashtags) through the application of graph theory network analysis techniques. Graph theory is defined as the mathematical study of the interaction of a system of connected elements (Berge, 1962; Köning, 1937). By investigating the characteristics and interactions of predominant hashtags through the principles of graph theory, we can widen our understanding of how social network users perceive the CES provided by nature. We will compare the outcomes of the application of graph theory network analysis to image content analysis to assess the suitability and cost-effectiveness of the methods. In addition, to attain a more holistic assessment of CES provision, we will ascertain the diversity and complementarity of the outcomes stemming from different social media platforms.
The study focuses on three worldwide iconic coastal areas as case-studies to illustrate the application of the proposed method, namely the Great Barrier Reef (GBR) Marine Park in Australia, the Galapagos Islands National Park in Ecuador and Easter Island National Park in Chile. These areas include emblematic marine protected areas but also protected terrestrial ecosystems. Two social media platforms, Instagram and Twitter, were used as data sources. The high number of users associated to these platforms and the markedly different content format and user’s needs and behaviours between platforms (Manikonda et al., 2016) are expected to illustrate the diversity of CES stemming from the case-study areas.
The main objectives of the study were (i) to illustrate the application of a novel methodology to assess the demand of CES through graph theory network analysis, (ii) to compare the proposed methodology to existing image content analysis techniques, and (iii) to explore the complementarity of information extracted from different social media platforms.
To achieve these objectives, hashtag data from Instagram and Twitter were analysed using graph theory analysis to identify emerging patterns in CES demand. Additionally, manual and automatic identification of Instagram image content was conducted for comparative purposes to assess the alignment between both approaches. This exhaustive comparison of remote assessment of CES allows insights into the most cost-efficient techniques to undertake large-scale assessments of social perceptions on ecosystems.
Methods
Data acquisition
In June 2019, ten thousand posts were downloaded from Instagram for each of the three case-study areas; similarly, ten thousand posts were downloaded from Twitter per case study. After running a set of trials with varying number of downloaded posts, the authors settled for 10,000 posts, as these were sufficient to capture the most frequently used hashtags in each of the study areas. Instagram and Twitter posts were downloaded through the corresponding application programming interface (API). The Instagram public API is suitable for hashtag-based data extraction, while Twitter required a developer account to access the full history and volume of tweets. A specific development in R was made by the authors for each API, both extracted similar data from social media platforms. The API works as a keyword search method. For each case study, a search query was executed, obtaining a set of 10,000 posts for each area and platform that included the name of the area (i.e. query) as a hashtag as part of the post.
Relevant hashtags were used to extract the posts associated to the case-studies: the hashtags “#greatbarrierreef” and “#galapagos” were used as queries for the GBR Marine Park and the Galapagos Islands National Park respectively. While these hashtags represent the most frequent way social media users refer to these areas in Instagram and Twitter, based on the authors’ observations, Easter Island was frequently referred to as “#easterisland”, “#rapanui” and “#isladepascua”, the last two representing the local names of the area. Therefore, three separate posts’ downloads were performed for Easter Island using each of the three queries. Downloaded data for this area were merged for subsequent analysis. Resulting datasets for each case study were stored locally in a relational database.
Posts often contain non-relevant information as social media platforms are frequently used as marketing and advertisement tools to reach a wider public and often bots (automated data generating algorithms and advertisements) are used to created large volumes of automated posts. Datasets were filtered and cleaned in order to retain only relevant information for further analysis (Di Minin et al., 2018; Varol et al., 2017). Non-relevant hashtags, mostly related to advertisement, were discarded.
Since the main aim of the present study was to assess the type of CES provided by the case-study areas, regardless of the user’s nationality, hashtags with a high frequency of appearance were translated to English language. In addition, hashtags were scanned for spelling mistakes and variations of the same word (e.g. bird - birds, traveller - traveler) in order to standardise the dataset and avoid duplicates.
Image content analysis
For each case study, photos associated to the original 10,000 posts were also downloaded and stored for image content analysis. Two types of analyses were performed, and their results compared: a manual procedure, undertaken by the authors of this paper, and an automatic procedure through machine learning technology.
Manual image content analysis
The content of each image was visualised, analysed and classified using an objective coding approach. To classify the CES in the case studies, we adopted and modified the classification developed by Retka et al. (2019) (table 1). In addition to the CES classification, we recorded information on whether the photographs were taken above or below water, on specific activities and on predominant habitat types and species appearing on the photographs (Appendix 1).
A random subsample of the photographs was drawn for each of the case-studies for the image content assessment. To determine the minimum number of photographs needed to assess the type of CES provided in each case-study, cumulative frequency distributions were calculated and plotted for each type of CES per case-study. Random sets of 10 photographs were assessed to quantify the presence of the different ES classes. Additional sets of 10 photographs were sub-sampled and classified until the cumulative average of the percentage of CES classes stabilised.
To assess the consistency of the classification criteria and the level of agreement between the reviewers, a subsample of 75 random photographs across the three case studies was evaluated by each reviewer. Cohen’s Kappa coefficient (Cohen, 1960) was used to assess the level of agreement between the reviewers.
[table 1]
Automated image content analysis
The same set of photographs analysed manually was assessed through Microsoft Captionbot Computer Vision’s REST API (https://azure.microsoft.com/en-gb/services/cognitive-services/computer-vision/). CaptionBot is a free cognitive tool based on ComputerVision, a Microsoft Azure cognitive service that distills relevant information from images. CaptionBot does not require users to have experience in machine learning but it provides powerful capabilities in content discovery, text extraction and visual data processing to tag content from objects to concepts, or extracting printed or handwritten text. Our intention was to create an AI-based workflow using tools that were low cost but equally adaptable and flexible. CaptionBot analyse Image method and Python (https://docs.microsoft.com/en-gb/azure/cognitive-services/Computer-vision/quickstarts/python-disk) were used to obtain a JSON document containing the predictive response with regards to the image content. The algorithm predictive response of the content of the photographs was extracted in a natural language format (e.g. “I think it’s a turtle swimming under water”, “I’m not sure but I think it’s a man walking on the beach”). Based on the information provided by Captionbot, the authors allocated each of the photographs to one of the established CES classes. The level of classification agreement between the manual and automatic classification was assessed using Cohen’s Kappa coefficient (Cohen, 1960).
Graph theory network analysis
The analysis of networks using graph theory can be described as the analysis of existing relationships between the different elements contained in a network. The term vertex is used to describe the elements in a network, while the term edge is used to refer to the connections between the different vertices in a network. In our case, vertices are represented by hashtags, while edges illustrate the connections between hashtags (e.g. the hashtags included in the same posts and the frequency of those connections).
To assess relationships between hashtags and identify emerging properties within the networks, we used centrality measures and community structure detection algorithms. In networks consisting of several vertices, some of them play a decisive role in facilitating a large number of network connections. Such vertices are central in network organization and are often identified by a range of metrics known as centrality measures. Centrality measures are useful to determine the relative importance of vertices and edges within the overall network (Freeman, 1978). However, there are multiple interpretations of what makes a vertex important and there are therefore many measures of centrality (Freeman, 1978). Some commonly used measures of centrality are: Degree; Betweenness; Closeness; Eigenvector centrality; Kleinberg’s hub centrality score (Hub score); Kleinberg’s authority centrality score (Authority score); and Page Rank. Conceptually, the simplest form of centrality is Degree centrality, which represents the number of edges connected to a vertex. In a social media network, where vertices are represented by hashtags, the Degree centrality of a hashtag accounts for the number of connections a hashtag has with other hashtags in the network. However, not all connections are equally important. Connections with well-connected vertices are more important than connections to vertices that are poorly connected to others. Thus, a vertex is important if it is connected to important neighbors, this is defined as Eigenvector centrality. Therefore, it can happen that a vertex with high Degree centrality has low Eigenvector values, e.g. a vertex could have many links (i.e. high Degree) to poorly connected vertices (i.e. low Eigenvector). Likewise, a vertex with few connections could have a high Eigenvector centrality value if those few connections were to well-connected vertices.
In this study we focus on Eigenvector centrality measure to illustrate social media data network structure. Eigenvector is a useful measure for the analysis of hashtags in a social media network because it does not necessarily highlight words with the highest frequency of occurrence (e.g. #instagram, #instatravel, #instaphoto, #twitterpic), which might not be necessarily informative. Eigenvector highlights hashtags that are well connected with other hashtags related to the query search, therefore, allows the emergence of relevant hashtags to understand the structure of the network.
In graph theory, a community is defined as a group of vertices where the density of the edges between the vertices inside the group is greater than the connections with the rest of the network. Vertices pertaining to the same community display similar centrality measure values. Generally, connections between vertices within the same community are stronger than connections between vertices of different communities. Here, in order to identify CES bundles, we organized the networks into communities. Graphs depicting the social networks are composed of vertices representing words. Word communities are the grammatical contexts in which these words appear together. If the words are mentioned frequently in the same context, they will form a community in the graph. If they appear in different contexts, they will move away from each other. To detect these communities, we applied the fast greedy modularity optimization algorithm (Clauset et al., 2004).
Data mining, analyses and graphical outputs were generated using R, a free and open source software (R Core Team, 2019). Specific R packages were used to create hashtags networks, calculate centrality measures and detect community structure (igraph, Csardi and Nepusz, 2006) and to create network visualisations (ggraph v2.0., Pedersen, 2020). In the community graphs, the order and distance of the communities to the centre does not imply a greater degree of importance, it is a result of the visualisation method.
Results
The focus of this study was to develop an innovative methodology for CES assessment using social media and to compare it to existing methodologies. For brevity and clarity, the results section focuses particularly on one of the case-studies (GBR) to fully illustrate the type of information obtained using graph theory network analysis, while Galapagos and Easter Island are more succinctly explained (see Appendix 2 for figures).
We first present results for the more direct and traditional methodology of manual photo content analysis, move onto the automatic analysis of photographs and finally report on the results obtained through our proposed methodology. Results focus on ascertaining the type of CES provided by each case study.
Image Analysis
Manual image content analysis
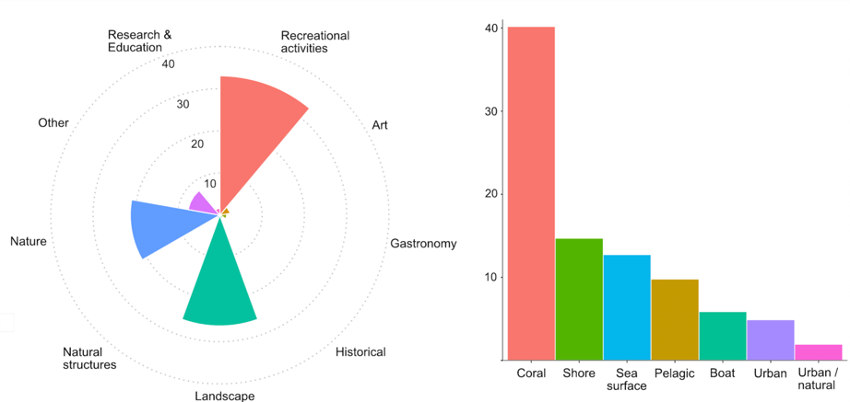
A comparison of the 3 case studies revealed that the proportion of underwater photographs in GBR (45%) was markedly greater than in Easter Island (11%) or Galapagos (8%). The predominant CES classes in GBR were related to recreational activities (33%), the appreciation of the landscape and seascape (26%) and nature (21%), where the main subject of the photographs was either fauna or flora. Snorkelling (14%), wildlife (14%), diving (11%), and habitat appreciation (7%) comprised the most popular activities depicted in the photographs (Figure 1). In GBR approximately 40% of the photographs coral reefs featured as the main habitat and fish were the dominant animal group (17%), featuring either underwater or as recreational fishing trophies (Figure 1).
In Galapagos, predominant CES classes were nature (49%), landscape appreciation (19%) and recreational activities (12%). Nature appreciation mainly focused on iconic wild animals: marine iguanas and giant tortoises appeared on 21% of the photographs, birds on 18% and marine mammals on 11% of the photos (Appendix 2, Figure 1). Of the 3 case-studies, Galapagos was the area with the greatest proportion of pictures focusing on wildlife (Galapagos 57%, GBR 31%, and Easter Island 3%). No particular habitat was frequently depicted, however 27% of photographs focused on the coastal shore fringe.
In Easter Island, a high proportion of photographs (38%) were classified within the historical monuments class (as Easter Island statues featured frequently in photographs), followed by landscape appreciation (13%) and natural structures (11%), such as volcano craters and cliffs. Most photographs depicted grass fields (44%) or shorelines (16%) (Appendix 2, Figure 2). Inter-reviewer Cohen’s kappa coefficient was high (0.87).
| CES Category | Description |
|---|---|
| 1. Artistic or cultural expressions and appreciation | Photographs representing people in artistic activities or their products |
| 2. Living cultural heritage | Photographs representing people in cultural activities |
| 3. Gastronomy | Photographs representing typical meals/foods related to the area |
| 4. Historical monuments | Photographs depicting historical infrastructures (e.g. historical buildings, ruins) |
| 5. Landscape appreciation | Photographs for which the main focus is a wide and large scale view of the landscape |
| 6. Nature appreciation | Photographs focusing on fauna or flora |
| 7. Natural structures and monuments | Photographs depicting a specific and well-defined landscape structure (e.g. cliff, cave) |
| 8. Religious, spiritual or ceremonial activities | Photographs representing religious or spiritual monuments or activities (e.g. church, indigenous ritual) |
| 9. Research & education | Photographs showing research or education activities or equipment |
| 10. Social recreation | Photographs representing groups of people in an informal or non-dedicated recreative social environment |
| 11. Activity recreation | Photographs showing people in a specific sports related activity |
| 12. Other | Photographs that do not fit the above criteria |
Automated image analysis
The use of Microsoft Captionbot Computer Vision’s REST API for the automatic analysis of photograph content was deemed not satisfactory. Cohen’s Kappa coefficient values were low for all three case studies, denoting that the level of agreement between the manual content analysis performed by the authors and that of Captionbot was weak (GBR = 0.51, Galapagos = 0.61, Easter Island = 0.40).
Although overall CES class percentages were similar between the manual and the automatic classification, the classification of individual pictures was different, in GBR 61% of the pictures were equally classified, in Galapagos 72% and in Easter Island 46%.
Captionbot capability of correctly describing photo content differed between CES classes, as some classes were easier to capture than others. While image content related to landscape, nature, recreational activities or social interactions was identified by the algorithm, it failed to detect CES classes related to research and education, spirituality, art or historical monuments/heritage.
Network analysis
Great Barrier Reef
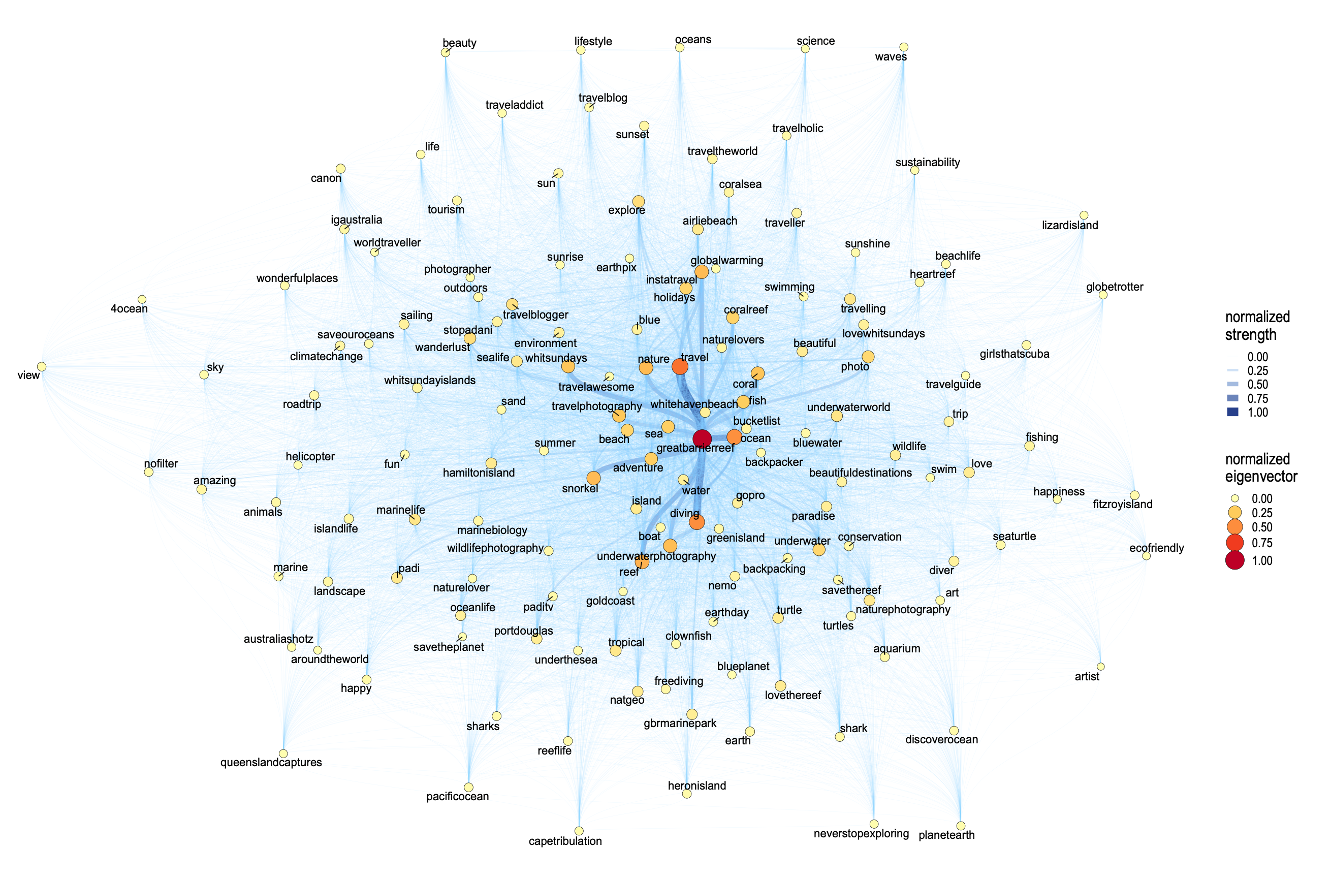
In GBR, the Instagram graph visualization based on Eigenvector centrality indicated that concepts related to underwater activities (e.g. diving, snorkel, underwater photography hashtags), underwater life (e.g. reef, coral, fish) and travel (e.g. travel, holidays) occupied central positions within the network structure and were frequently related to the “greatbarrierreef” hashtag (i.e. the query). These hashtags had high Eigenvector values, indicating that they frequently appeared on GBR related posts and at the same time were related to concepts also appearing frequently. In addition, high Eigenvector values revealed geographical locations frequently related to popular hashtags, e.g. “whitsundays” was well connected to “nature”. Concepts related to positive and “feel-good” aspects (e.g. love, happiness, beach life, fun) were often located surrounding the core concepts on the centre although did not occupy central positions. Hashtags related to environmental awareness also featured as part of the network (e.g. global warming) but did not occupy a central position in the structure (Figure 2).
In GBR, the community detection algorithm grouped the different hashtags into 3 overarching themes (Figure 3). Hashtags in the first community were mainly related to the underwater marine world (e.g. reef, ocean life, shark) and associated recreational activities (e.g., free diving, snorkel, underwater photography), as well as to concepts related to environmental conservation (e.g. sustainability, conservation, earth day). This community identified key habitats and species as providers of CES, such as coral, fish, turtles or sharks.
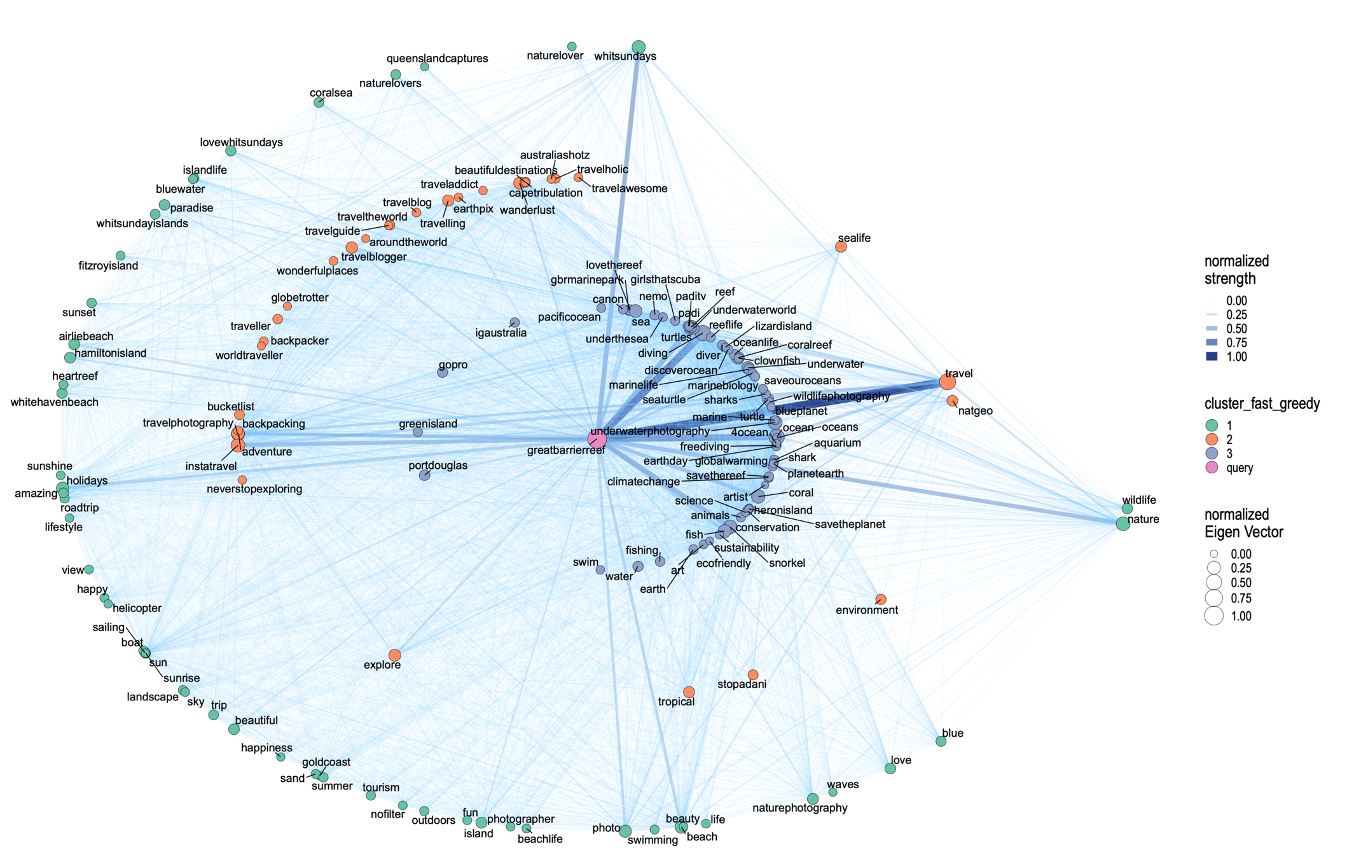
In addition, cognitive services also featured in this community (e.g. science, marine biology) with lower eigenvector values. The second community was predominantly dominated by hashtags related to travelling (e.g. travel, wanderlust, travelholic) and what travelling allows, such as fulfilling life long wishes (e.g. bucket list), reaching remote places (e.g. wonderful places, around the world, beautiful destinations) or creating feelings of adventure (e.g. explore, adventure, never stop exploring). In the third community, hashtags with greater Eigenvector values were related to the provision of nature and wildlife holidays, the feelings those experiences create (e.g. fun, happiness, love), activities enjoyed (e.g. swimming, outdoors, boat, sailing), memorable moments and places and descriptions associated to them (e.g. sunset, sunrise, beauty, amazing).
In the Eigenvector-based Twitter visualization, hashtags with greater Eigenvector values and most frequently connected to the query (“greatbarrierreef”), mainly revolved around climate change (e.g. climate action, climate crisis, climate emergency) and the environment (e.g. coral, ocean, reef, nature), creating a strong environmental awareness theme (Figure 4).
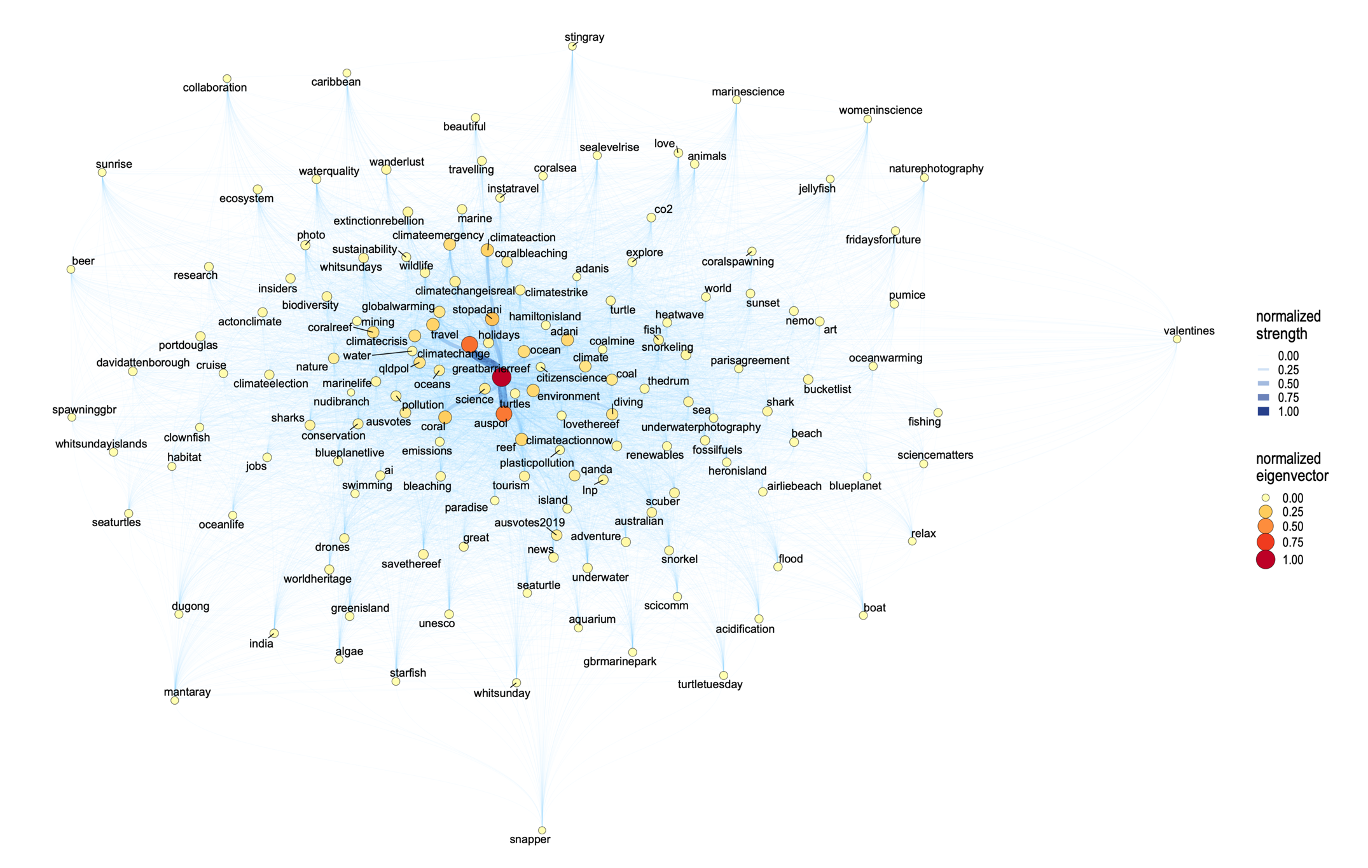
Hashtags related to underwater activities and specific underwater life were present in the network, although they were mostly located towards the periphery of the network, displaying a more secondary role.
Three communities were detected in the Twitter GBR network (Figure 5).
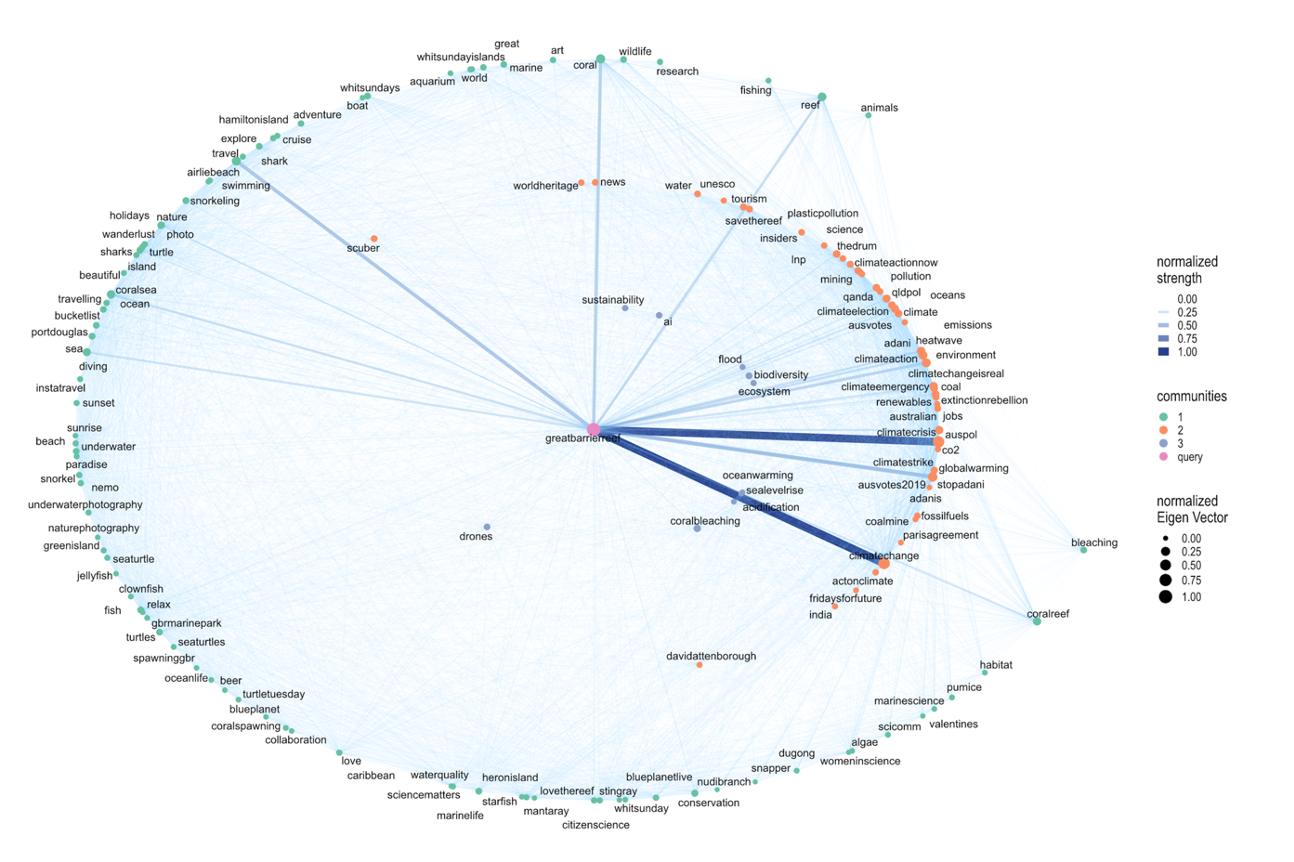
The community closest to the centre was dominated by marine environmental science concepts (e.g. bleaching, sea level rise, ocean warming, acidification) and marine life (e.g. shark, reef, algae). The second community followed a political discourse around climate change and action for change and sustainability (e.g. Fridays for future, climate strike, renewables, extinction rebellion). The third community rotated around holidays, travelling and memorable moments (e.g. beach, paradise, sunset), recreational activities (e.g. boat, scuba, snorkelling) and marine life (e.g. snapper, nudibranch, starfish).
Galapagos
In Galapagos’ Eigenvector-based Instagram visualization, the vertices with greatest Eigenvector values were related to nature and wildlife concepts in general and to specific animal groups in particular (e.g. sea lion, birds, iguana, tortoise). Travel, photography and diving were also prominent hashtags within the network. However, overall, the Galapagos network was mostly dominated by wildlife related hashtags (Figure 3, Appendix 2).
In Galapagos Instagram network, hashtags were grouped into five communities (Figure 4, Appendix 2). The first community was dominated by hashtags related to the marine environment, underwater marine life and associated recreational activities. Hashtags in the second community revolved around travel and the desire for travelling, in a similar way as in GBR. The third community also centred on travelling but from an adventurous and laidback approach. The fourth community was dominated by wildlife and nature aspects, as well as by the love for nature and conservation values. A high number of hashtags representing different animal groups were allocated to this community. The fifth community related to life and nice feelings.
In Galapagos’ Eigenvector-based Twitter visualization (Figure 5, Appendix 2), hashtags with greater Eigenvector values were similar to those in Instagram. Nature, wildlife and travel concepts occupied the most central positions in the network and had greater Eigenvector values. Hashtags referring to iconic animals were also centrally positioned.
Hashtags were clustered into two big groups by the community detection algorithm (Figure 6, Appendix 2). In the community closer to the centre, all hashtags had similar eigenvector values and turned around iconic wildlife groups and recreational activities. The second community revolved around travelling to locations that enable the enjoyment of wildlife and nature.
Easter Island
Instagram Easter Island’s network was dominated by concepts related to travelling, culture and cultural identity, which occupied central positions in the Eigenvector-based visualisation (Figure 7, Appendix 2). Photography and aesthetics concepts also featured frequently although they were not central.
Hashtags were grouped into four communities (Figure 8, Appendix 2). The central community was explicitly related to underwater recreational activities, in particular diving and underwater photography. The second community mostly revolved around the cultural heritage of Easter Island as it included hashtags such as music, sculpture, architecture or archaeology. The third community was dominated by travel related hashtags. The last community was more heterogeneous as it bundled concepts of cultural identity, nature and “living a good life” concepts.
In Twitter, aside from the hashtags used to build the network, the hashtag “chile” (country where the case-study is located) and “moai” (the monolithic human figures carved by the Rapanui people), the rest of the hashtags had low Eigenvector values (Figure 9, Appendix 2). Hashtags related to travel, aesthetics, heritage and holidays were located in central positions; however, their associated Eigenvector values were low, and no particular trend was noticeable. Concepts related to aspects related to living a meaningful life were located towards the periphery of the network.
The resulting communities from Easter Island Twitter’s network presented a more miscellaneous typology and were not as defined as the ones in the other two case-studies (Figure 10, Appendix 2). Hashtags were grouped into three communities. Starting from the centre, the first community revolved mainly around historical and cultural heritage. No discernible overall discourse was detected in the second community, as it bundled hashtags related to travel, photography and nature, among others. The majority of hashtags in the third cluster were in Spanish language and no obvious pattern emerged from this cluster.
Discussion
The focus of this study was to introduce a novel methodology for CES assessment using social media and to compare it to existing methods, and to validate an efficient methodology for a more encompassing local and global CES assessments in marine and coastal areas. The analysis of social media data from two different platforms and the application of different methodological approaches allowed us to establish comparisons in terms of the outputs obtained and the cost-effectiveness of the methods used.
In summary, the use of graph theory to analyse social media data provided a more holistic perspective on the assessment of CES, including a range of values, from tangible recreational activities to intangible values related to feelings and perceptions. Manual image content analysis provided a thorough assessment of uses, values and ecosystem preferences, but failed short to capture intangible aspects such as relational values.
As in previous studies, we ascertained how the manual image content analysis of social media photographs provides in-depth information on the CES classes (e.g., Oteros-Rozas et al., 2018), activities (e.g., Wood et al., 2013) and benefits (e.g., Gliozzo et al., 2016) arising from specific areas, as well as on the habitat types and species providing those benefits (e.g., Sbragaglia et al., 2019). However, the application of this method is extremely time consuming (approximately, 2-4 min per picture) and while it might be a suitable approach for small geographical scale applications (e.g., Clemente et al., 2019; Hausmann et al., 2017; Retka et al., 2019; Schirpke et al., 2018), it is not a cost-effective methodology for large scale assessments.
The automatic alternative for photo content identification through the application of Captionbot automated image recognition using natural language outputs was considered not satisfactory, as the level of agreement between human and machine-based CES classification was too low. That is not to say that the application of machine learning techniques for automated image recognition in general is not suitable for CES assessments, as there is an increasing number of studies that have successfully applied it in terrestrial areas (e.g.,Lee et al., 2019; Oteros-Rozas et al., 2018). Several factors might have contributed to the low quality of our results. As a rule of thumb, the higher the number of pictures used in the training of machine learning algorithms, the more accurate the predictive results are (Mikołajczyk and Grochowski, 2018). Therefore, accurate results are most frequent for those environments for which considerable volumes of photographs are available. In general, while terrestrial pictures are overly abundant, pictures related to underwater environments are fewer in comparison, mainly due to the more restrictive nature of this environment, therefore limiting the accuracy levels available for those contexts. A second factor influencing the quality of the results is the automatic classification algorithm used, as it will determine the finesse of the results obtained (Martin-Abadal et al., 2020). The level and types of CES classes detected through machine learning can range from coarse levels of CES classifications (Richards et al., 2018), that might fall short in terms of management applicability, to more holistic classifications including the detection of existence values (Lee et al., 2019). Finally, a different automated recognition approach might have contributed to the achievement of better results in our study. As an alternative to focusing on the single output in the form of natural language for each of the photographs used here, the automatic assignation of multiple tags for each picture and subsequent analysis of the tags might have generated different results (e.g., Lee et al., 2019). However, the greatest challenge in the use of automatic picture classification for CES assessment is that algorithms are not yet capable of capturing intangible aspects such as spiritual or cultural heritage values. More important perhaps, is the fact that photographs cannot always convey elusive aspects such as feelings, social ties or cognitive values (Lee et al., 2019). Comparatively, we have shown how the use of graph theory network analysis on user’s text has the capacity of encompassing those aspects.
The application of graph theory network analysis revealed the most frequent concepts arising from each of the case study areas and the interactions between them. This approach facilitated the identification of the most popular hashtags, provided information on which popular hashtags were related to other popular hashtags and how the different hashtags grouped together. It provided information on three different fronts; (i) what the main CES stemming from the area were and how different services tended to appear together as CES bundles; (ii) on ES providers (ESP), that is, the main elements, including habitats, species or natural structures supporting CES; and (iii) finally, on the frequency of linkages between geographical hashtags and activities or benefits hashtags allowing the extraction of information regarding popular places where there is demand for particular CES. Previous social media image analysis studies have also demonstrated the capacity to identify CES bundles (Oteros-Rozas et al., 2018), ESP providers (Arbieu et al., 2018; Hausmann et al., 2017) and the spatial distribution of CES provision and demand (Clemente et al., 2019; Fischer et al., 2018; Gosal et al., 2019). However, while the analysis of photographs mostly offers a vision of “what the eye can see”, the analysis of associated text offers a perspective beyond the material or instrumental values associated to nature to move into the realm of relational values.
The concept of relational values, introduced by Chan et al. (2016), broadens the notions of intrinsic and instrumental values to include the values relative to the meaningfulness of relationships between people and nature (Stenseke, 2018). The hope is that the adoption of a relational value framework will be more inclusive of known aspects of wellbeing, such as connections to others and to nature or place attachment and identity (Chan et al., 2016). Along these lines, concepts or relations related to nature-inclusive eudaimonia are also a form of relational values (Knippenberg et al., 2018). Eudaimonic values can be defined as the values associated with living a good and meaningful life (Ryan and Deci, 2001; Ryff and Singer, 2008). “Nature-inclusive eudaimonia”, as introduced by Knippenberg (2018), goes further and encompasses a flourishing life in which nature is an integral part of wellbeing. Here, we show how the analysis of hashtags through graph theory network offers a description made by the user itself that often includes relational values aspects.
Previous studies based on social media image analysis have already made some first steps towards capturing values pertaining to the realm of relational values, such as existence (Martínez Pastur et al., 2016), spiritual or social values and relations (Oteros-Rozas et al., 2018). However, these studies have been based on proxies, such as the presence of places serving as meeting points with friends being equal to social values (Oteros-Rozas et al., 2018), or the assumption that pictures focusing on nature appreciation are equivalent to an existence value (Martínez Pastur et al., 2016). Although these assumptions and associations might be sound, they are inherently linked to a researcher’s interpretation bias, therefore perhaps not fully or rightly capturing the meaning of the picture. Conversely, the analysis of users’ posts allows to capture eudaimonic notions of living a good life through sharing experiences with those who are more important to us (family, friends…), positive feelings emerging from being in contact with and surrounded by nature (e.g., happiness, fun, love), the love for nature (e.g., nature lovers, love the reef), the urge and need to preserve nature (e.g., save our oceans, save the planet) or cultural identity aspects (e.g., tapati, chilepo) in descriptions made by the users, minimizing thus interpreter’s bias. We, therefore, conclude that the use of graph theory network analysis on social media hashtags offers a different level of nuanced comprehension of relational value aspects when compared to the analysis of photo content. It offers a window through which we can contemplate the different relational aspects that people experience when in contact with nature, minimising the potential distortions associated to interpreter’s bias.
Despite the potential of social media data, our results show that the consideration of outputs stemming from different platforms is an important aspect to consider. Although the themes emerging from Instagram and Twitter were similar, their magnitude of centrality, and therefore importance, differed within the case studies analysed. While Twitter generally reflected what users’ thought, including their political and environmental views and concerns, Instagram contained information at a more emotional and relational level, as it focused on what people do and want to show. These aspects have also been captured by other studies, as Manikonda et al. (2016) describes it through the expression “tweeting the mind and instagramming the heart” (Manikonda et al., 2016). Therefore, the selection of social media platform will be conditioned by the goals of the study, as well as target population group. Nevertheless, we argue that data integration offers a more comprehensive understanding of the different values held be people on nature. It is also important to highlight that in general, studies based on social media data will be restricted by the volume of posts available for the areas under study.
Generally, CES assessment studies using social media data make use of geo-located photographs. This allows for the identification of spatial distribution patterns of CES demand (e.g., Clemente et al., 2019), which is relevant in terms of natural areas conservation and management. Due to Instagram and Twitter privacy policy, the download of geo-tagged data was not possible in our study. However, although not as precise as the use of geo-tagged photographs, the recurrent presence of geographical or places hashtags, frequently appearing together with certain activities (e.g. diving, hiking) also allows for the identification of hotspots of activity. Despite this shortcoming, we conclude that the application of graph theory network analysis on social media data can be considered a cost-effective method due to the short time needed to process the data and its applicability at multiple spatial scales, as it can be used at local to global scales through the simultaneous analysis of different locations.
Emerging patterns have the potential to be useful for managers and policy makers to (i) identify and establish relationships between subjective CES perceptions in the area; (ii) identify potential trade-offs between different CES and between CES and other ES; (iii) and to identify policy measures needed to preserve CES.
Conclusions
Social media data has emerged as a powerful source of information to assess the indirect provision of CES. Generally, studies focus on the analysis of data stemming from single platforms. In addition, the most widely used method is based on the analysis of photo content, which offers a partial vision of the range of CES offered by nature. Partial in terms of the type of captured values and associated interpreter’s bias. Here, we introduce graph theory network analysis as a novel way to analyse different sources of social media data to asses CES. We conclude that the analysis of hashtags associated to social media posts using graph theory offer information, not only on the instrumental values associated to nature, but go further and provide useful information on human-nature relational aspects and eudaimonic concepts. These are aspects that photo content analysis has not yet been able to fully capture. We also highlight the importance of considering data from different social media platforms as the type of users and information offered by the different platforms highlight different CES aspects. Resulting networks are a reflection of the interactions between the social media platform used and the environmental and cultural characteristics of the area under consideration. As an example, in Instagram, GBR users tend to share their coral reef diving experiences, highlighting aspects of adventure and discovery. While in Easter Island, Twitter highlights aspects related to cultural heritage preservation. Thus, the combination of the social media platform and the cultural and environmental characteristics of the area, establish a framework of content possibilities from which the users tend to highlight certain aspects. The ease of application and short computing processing times involved in the retrieval and analysis of the data makes the use of graph theory network a cost-effective method with the potential of being applied to large geographical scales.
Acknowledgements
This work is a result of the ECOMAR Network, “Evaluation and monitoring of marine ecosystem services in Iberoamérica” (project number 417RT0528) funded by the CYTED program. During the time of the study and writing period ARF was supported by a H2020-Marie Skłodowska-Curie Action MSCA-IF-2014 (ref. 655475); AOA was supported by a H2020-Marie Skłodowska-Curie Action MSCA-IF-2016 (ref. 746361). SdJ was supported by a H2020-Marie Skłodowska-Curie Action MSCA-IF-2016 (ref. 743545). PP was funded by the Xunta de Galicia (RECREGES II Project, Grant ED481B2018/ 017).
References
Arbieu, U., Grünewald, C., Martín-López, B., Schleuning, M., Böhning-Gaese, K., 2018. Large mammal diversity matters for wildlife tourism in Southern African Protected Areas: Insights for management. Ecosyst. Serv. 31, 481–490. https://doi.org/10.1016/j.ecoser.2017.11.006
Berge, C., 1962. The theory of graphs and its applications. Bull. Math. Biophys. 24, 441–443. https://doi.org/10.1007/bf02478000
Bratman, G.N., Anderson, C.B., Berman, M.G., Cochran, B., de Vries, S., Flanders, J., Folke, C., Frumkin, H., Gross, J.J., Hartig, T., Kahn, P.H., Kuo, M., Lawler, J.J., Levin, P.S., Lindahl, T., Meyer-Lindenberg, A., Mitchell, R., Ouyang, Z., Roe, J., Scarlett, L., Smith, J.R., van den Bosch, M., Wheeler, B.W., White, M.P., Zheng, H., Daily, G.C., 2019. Nature and mental health: An ecosystem service perspective. Sci. Adv. 5, eaax0903. https://doi.org/10.1126/sciadv.aax0903
Chan, K.M.A., Balvanera, P., Benessaiah, K., Chapman, M., Díaz, S., Gómez-Baggethun, E., Gould, R., Hannahs, N., Jax, K., Klain, S., Luck, G.W., Martín-López, B., Muraca, B., Norton, B., Ott, K., Pascual, U., Satterfield, T., Tadaki, M., Taggart, J., Turner, N., 2016. Why protect nature? Rethinking values and the environment. Proc. Natl. Acad. Sci. U. S. A. 113, 1462–1465. https://doi.org/10.1073/pnas.1525002113
Chan, K.M.A., Guerry, A.D., Balvanera, P., Klain, S., Satterfield, T., Basurto, X., Bostrom, A., Chuenpagdee, R., Gould, R., Halpern, B.S., Hannahs, N., Levine, J., Norton, B., Ruckelshaus, M., Russell, R., Tam, J., Woodside, U., 2012. Where are Cultural and Social in Ecosystem Services? A Framework for Constructive Engagement. Bioscience 62, 744–756. https://doi.org/10.1525/bio.2012.62.8.7
Clauset, A., Newman, M.E.J., Moore, C., 2004. Finding community structure in very large networks. Phys. Rev. E - Stat. Physics, Plasmas, Fluids, Relat. Interdiscip. Top. 70, 6. https://doi.org/10.1103/PhysRevE.70.066111
Clemente, P., Calvache, M., Antunes, P., Santos, R., Cerdeira, J.O., Martins, M.J., 2019. Combining social media photographs and species distribution models to map cultural ecosystem services: The case of a Natural Park in Portugal. Ecol. Indic. 96, 59–68. https://doi.org/10.1016/j.ecolind.2018.08.043
Cohen, J., 1960. A Coefficient of Agreement for Nominal Scales. Educ. Psychol. Meas. 20, 37–46. https://doi.org/10.1177/001316446002000104
Csardi, G., Nepusz, T., 2006. The igraph software package for complex network research. Interjournal Complex Sy, 1695.
Di Minin, E., Fink, C., Tenkanen, H., Hiippala, T., 2018. Machine learning for tracking illegal wildlife trade on social media. Nat. Ecol. Evol. https://doi.org/10.1038/s41559-018-0466-x
Di Minin, E., Tenkanen, H., Toivonen, T., 2015. Prospects and challenges for social media data in conservation science. Front. Environ. Sci. 3, 63. https://doi.org/10.3389/fenvs.2015.00063
Erlandson, J.M., Rick, T.C., 2010. Archaeology Meets Marine Ecology: The Antiquity of Maritime Cultures and Human Impacts on Marine Fisheries and Ecosystems. Ann. Rev. Mar. Sci. 2, 231–251. https://doi.org/10.1146/annurev.marine.010908.163749
Everard, M., Jones, L., Watts, B., 2010. Have we neglected the societal importance of sand dunes? An ecosystem services perspective. Aquat. Conserv. Mar. Freshw. Ecosyst. 20, 476–487. https://doi.org/10.1002/aqc.1114
Fischer, L.K., Honold, J., Botzat, A., Brinkmeyer, D., Cvejić, R., Delshammar, T., Elands, B., Haase, D., Kabisch, N., Karle, S.J., Lafortezza, R., Nastran, M., Nielsen, A.B., van der Jagt, A.P., Vierikko, K., Kowarik, I., 2018. Recreational ecosystem services in European cities: Sociocultural and geographical contexts matter for park use. Ecosyst. Serv. 31, 455–467. https://doi.org/10.1016/j.ecoser.2018.01.015
Freeman, L.C., 1978. Centrality in social networks conceptual clarification. Soc. Networks 1, 215–239. https://doi.org/10.1016/0378-8733(78)90021-7
Garcia Rodrigues, J., Conides, A., Rivero Rodriguez, S., Raicevich, S., Pita, P., Kleisner, K., Pita, C., Lopes, P., Alonso Roldán, V., Ramos, S., Klaoudatos, D., Outeiro, L., Armstrong, C., Teneva, L., Stefanski, S., Böhnke-Henrichs, A., Kruse, M., Lillebø, A., Bennett, E., Belgrano, A., Murillas, A., Sousa Pinto, I., Burkhard, B., Villasante, S., 2017. Marine and Coastal Cultural Ecosystem Services: knowledge gaps and research priorities. One Ecosyst. 2. https://doi.org/10.3897/oneeco.2.e12290
Ghermandi, A., Sinclair, M., 2019. Passive crowdsourcing of social media in environmental research: A systematic map. Glob. Environ. Chang. 55, 36–47. https://doi.org/10.1016/j.gloenvcha.2019.02.003
Gliozzo, G., Pettorelli, N., Muki Haklay, M., 2016. Using crowdsourced imagery to detect cultural ecosystem services: A case study in South Wales, UK. Ecol. Soc. 21. https://doi.org/10.5751/ES-08436-210306
Gosal, A.S., Geijzendorffer, I.R., Václavík, T., Poulin, B., Ziv, G., 2019. Using social media, machine learning and natural language processing to map multiple recreational beneficiaries. Ecosyst. Serv. 38, 100958. https://doi.org/10.1016/J.ECOSER.2019.100958
Hausmann, A., Toivonen, T., Slotow, R., Tenkanen, H., Moilanen, A., Heikinheimo, V., Di Minin, E., 2017. Social Media Data Can Be Used to Understand Tourists’ Preferences for Nature-Based Experiences in Protected Areas. Conserv. Lett. https://doi.org/10.1111/conl.12343
IPBES, 2019. Summary for policymakers of the regional assessment report on biodiversity and ecosystem services for Asia and the Pacific of the Intergovernmental Science-Policy Platform on Biodiversity and Ecosystem Services, IPBES.
Klain, S.C., Satterfield, T.A., Chan, K.M.A., 2014. What matters and why? Ecosystem services and their bundled qualities. Ecol. Econ. 107, 310–320. https://doi.org/10.1016/j.ecolecon.2014.09.003
Knippenberg, L., de Groot, W.T., van den Born, R.J., Knights, P., Muraca, B., 2018. Relational value, partnership, eudaimonia: a review. Curr. Opin. Environ. Sustain. 35, 39–45. https://doi.org/10.1016/j.cosust.2018.10.022
Köning, D., 1937. Theorie der endlichen und unendlichen Graphen. Monatshefte für Math. und Phys. 46, A17–A18. https://doi.org/10.1007/bf01792729
Lee, H., Seo, B., Koellner, T., Lautenbach, S., 2019. Mapping cultural ecosystem services 2.0 – Potential and shortcomings from unlabeled crowd sourced images. Ecol. Indic. 96, 505–515. https://doi.org/10.1016/j.ecolind.2018.08.035
Leenhardt, P., Low, N., Pascal, N., Micheli, F., Claudet, J., 2015. The role of marine protected areas in providing ecosystem services, Aquatic Functional Biodiversity: An Ecological and Evolutionary Perspective. https://doi.org/10.1016/B978-0-12-417015-5.00009-8
Mancini, F., Coghill, G.M., Lusseau, D., 2018. Using social media to quantify spatial and temporal dynamics of nature-based recreational activities. PLoS One 13. https://doi.org/10.1371/journal.pone.0200565
Manikonda, L., Meduri, V.V., Kambhampati, S., 2016. Tweeting the Mind and Instagramming the Heart: Exploring Differentiated Content Sharing on Social Media, in: Proceedings of the Tenth International AAAI Conference on Web and Social Media (ICWSM 2016). pp. 639–642.
Martin-Abadal, M., Ruiz-Frau, A., Hinz, H., Gonzalez-Cid, Y., 2020. Jellytoring: Real-Time Jellyfish Monitoring Based on Deep Learning Object Detection. Sensors 2020, Vol. 20, Page 1708 20, 1708. https://doi.org/10.3390/S20061708
Martínez Pastur, G., Peri, P.L., Lencinas, M. V., García-Llorente, M., Martín-López, B., 2016. Spatial patterns of cultural ecosystem services provision in Southern Patagonia. Landsc. Ecol. 31, 383–399. https://doi.org/10.1007/s10980-015-0254-9
McMichael, A., Scholes, R., Hefny, M., Pereira, E., Palm, C., Foale, S., 2005. Linking ecosystem services and human well-being, in: Norgaard, R., Wilbanks, T. (Eds.), Ecosystems and Human Well-Being : Multi-Scale Assessments. Millenium Ecosystem Assessment Series, 4. Island Press, Washington, DC, USA, pp. 43–60. https://doi.org/30
Mikołajczyk, A., Grochowski, M., 2018. Data augmentation for improving deep learning in image classification problem, in: 2018 International Interdisciplinary PhD Workshop, IIPhDW 2018. Institute of Electrical and Electronics Engineers Inc., pp. 117–122. https://doi.org/10.1109/IIPHDW.2018.8388338
Ortiz-Ospina, E., 2019. The rise of social media - Our World in Data [WWW Document]. URL https://ourworldindata.org/rise-of-social-media (accessed 3.21.20).
Oteros-Rozas, E., Martín-López, B., Fagerholm, N., Bieling, C., Plieninger, T., 2018. Using social media photos to explore the relation between cultural ecosystem services and landscape features across five European sites. Ecol. Indic. 94, 74–86. https://doi.org/10.1016/j.ecolind.2017.02.009
Pedersen, T.L., 2020. ggraph: An Implementation of Grammar of Graphics for Graphs and Networks.
PRC, 2019. Use of different online platforms by demographic groups.
R Core Team, 2019. R: A language and environment for statistical computing.
Retka, J., Jepson, P., Ladle, R.J., Malhado, A.C.M., Vieira, F.A.S., Normande, I.C., Souza, C.N., Bragagnolo, C., Correia, R.A., 2019. Assessing cultural ecosystem services of a large marine protected area through social media photographs. Ocean Coast. Manag. 176, 40–48. https://doi.org/10.1016/j.ocecoaman.2019.04.018
Richards, D.R., Friess, D.A., 2015. A rapid indicator of cultural ecosystem service usage at a fine spatial scale: Content analysis of social media photographs. Ecol. Indic. 53, 187–195. https://doi.org/10.1016/j.ecolind.2015.01.034
Richards, D.R., Tunçer, B., Tunçer, B., 2018. Using image recognition to automate assessment of cultural ecosystem services from social media photographs. Ecosyst. Serv. 31, 318–325. https://doi.org/10.1016/j.ecoser.2017.09.004
Ryan, R.M., Deci, E.L., 2001. On Happiness and Human Potentials: A Review of Research on Hedonic and Eudaimonic Well-Being. Annu. Rev. Psychol. 52, 141–166. https://doi.org/10.1146/annurev.psych.52.1.141
Ryff, C.D., Singer, B.H., 2008. Know thyself and become what you are: A eudaimonic approach to psychological well-being. J. Happiness Stud. 9, 13–39. https://doi.org/10.1007/s10902-006-9019-0
Sbragaglia, V., Correia, R.A., Coco, S., Arlinghaus, R., 2019. Data mining on YouTube reveals fisher group-specific harvesting patterns and social engagement in recreational anglers and spearfishers. ICES J. Mar. Sci. https://doi.org/10.1093/icesjms/fsz100
Schirpke, U., Meisch, C., Marsoner, T., Tappeiner, U., 2018. Revealing spatial and temporal patterns of outdoor recreation in the European Alps and their surroundings. Ecosyst. Serv. 31, 336–350. https://doi.org/10.1016/J.ECOSER.2017.11.017
Selig, E.R., Hole, D.G., Allison, E.H., Arkema, K.K., McKinnon, M.C., Chu, J., de Sherbinin, A., Fisher, B., Glew, L., Holland, M.B., Ingram, J.C., Rao, N.S., Russell, R.B., Srebotnjak, T., Teh, L.C.L., Troëng, S., Turner, W.R., Zvoleff, A., 2019. Mapping global human dependence on marine ecosystems. Conserv. Lett. https://doi.org/10.1111/conl.12617
Stenseke, M., 2018. Connecting ‘relational values’ and relational landscape approaches. Curr. Opin. Environ. Sustain. 35, 82–88. https://doi.org/10.1016/j.cosust.2018.10.025
Tenkanen, H., Di Minin, E., Heikinheimo, V., Hausmann, A., Herbst, M., Kajala, L., Toivonen, T., 2017. Instagram, Flickr, or Twitter: Assessing the usability of social media data for visitor monitoring in protected areas. Sci. Rep. 7, 17615. https://doi.org/10.1038/s41598-017-18007-4
Toivonen, T., Heikinheimo, V., Fink, C., Hausmann, A., Hiippala, T., Järv, O., Tenkanen, H., Di Minin, E., 2019. Social media data for conservation science: A methodological overview. Biol. Conserv. 233, 298–315. https://doi.org/10.1016/j.biocon.2019.01.023
Varol, O., Ferrara, E., Davis, C.A., Menczer, F., Flammini, A., 2017. Online Human-Bot Interactions: Detection, Estimation, and Characterization. Elev. Int. AAAI Conf. Web Soc. Media.
Waldron, A., Mooers, A.O., Miller, D.C., Nibbelink, N., Redding, D., Kuhn, T.S., Roberts, J.T., Gittleman, J.L., 2013. Targeting global conservation funding to limit immediate biodiversity declines. Proc. Natl. Acad. Sci. 110, 12144–12148. https://doi.org/10.1073/pnas.1221370110
Wood, S.A., Guerry, A.D., Silver, J.M., Lacayo, M., 2013. Using social media to quantify nature-based tourism and recreation. Sci. Rep. 3. https://doi.org/10.1038/srep02976
See pages 1-5 of appendix1.pdf See pages 1-10 of appendix2_lowres.pdf