Scaling relations for dark matter core density and radius from Chandra X-ray cluster sample
Abstract
A large number of studies have found that the dark matter surface density, given by the product of the dark matter core radius () and core density () is approximately constant for a wide range of galaxy systems. However, there has been only one systematic study of this ansatz for galaxy clusters by Chan Chan (2014), who found that the surface density for clusters is not constant and . We carry out this test for an X-ray sample of 12 relaxed clusters from Chandra observations, studied by Vikhlinin et al Vikhlinin et al. (2006), implementing the same procedure as in Ref. Chan (2014), but also accounting for the gas and star mass. We find that , with an intrinsic scatter of about 18%. Therefore, the dark matter surface density for our cluster data shows deviations from a constant value at only about 1.4.
I Introduction
The current concordance (CDM) cosmological model consisting of 25% cold dark matter and 70% dark energy, agrees very well with Planck CMB and large scale structure observations Aghanim et al. (2018). However, at scales smaller than about 1 Mpc, the cold dark matter paradigm runs into a number of problems such as the core/cusp problem, missing satellite problem (although see Kim et al. (2018)), too big to fail problem, satellites plane problem etc. (See Refs. Bullock and Boylan-Kolchin (2017); Weinberg et al. (2015); Tulin and Yu (2018) for recent reviews on this subject). We also note that some of these problem can be ameliorated using various baryonic physics effects Oh et al. (2011); Martizzi et al. (2012); Ogiya and Mori (2011); Chan et al. (2015). At a more fundamental level, another issue with the CDM model is that there is no laboratory evidence for any cold dark matter candidate Merritt (2017). Furthermore, LHC or other particle physics experiments have yet to find experimental evidence for theories beyond the Standard Model of Particle Physics, which predict such cold dark matter candidates Merritt (2017). Therefore, a large number of theoretical alternatives to CDM model have been proposed, and a variety of observational tests devised to test these myriad alternatives.
An intriguing observational result discovered more than a decade ago is that the dark matter halo surface density is constant, for a wide variety of systems spanning over 18 orders in blue magnitude for a diverse suite of galaxies, such as spiral galaxies, low surface brightness galaxies, dwarf spheroidal satellites of Milky way Kormendy and Freeman (2004); Donato et al. (2009); Gentile et al. (2009); Walker et al. (2010); Salucci et al. (2012); Hartwick (2012); Kormendy and Freeman (2016); Hayashi and Chiba (2015); Burkert (2015); Salucci (2019) etc. See however Refs. Boyarsky et al. (2010); Napolitano et al. (2010); Cardone and Tortora (2010); Del Popolo et al. (2013); Saburova and Del Popolo (2014); Del Popolo and Lee (2017); Zhou et al. (2020) and references therein, which dispute these claims and argue for a mild dependence of the dark matter surface density with halo mass and other galaxy properties. These results for a constant dark matter surface density were obtained by fitting the dark matter distribution in these systems to a cored profile, either Burkert Burkert (1995), pseudo-isothermal profile Kormendy and Freeman (2004), or a simple isothermal sphere Spano et al. (2008). All these cored profiles can be parameterized by a central density () and core radius (); and the halo surface density is defined as the product of and . The existence of a constant dark matter surface density was found to be independent of which cored profile was used Donato et al. (2009). Alternately, some groups have also calculated a variant of the above dark matter halo density, which has been referred to as the dark matter column density Boyarsky et al. (2010); Del Popolo et al. (2013) 111See Eq. 1 of Ref. Boyarsky et al. (2010) for the definition of dark matter column density., whose value remains roughly invariant with respect to the choice of the dark matter profile. This column density is equivalent to the product of and for a Burkert profile Del Popolo et al. (2013), and provides a more precise value of the surface density for non-cored profiles, such as the widely used NFW profile Navarro et al. (1997). The best-fit values for the dark matter surface density for single galaxy systems using the latest observational data is given by Salucci (2019).
A large number of theoretical explanations have been proposed to explain the constancy of dark matter halo density. Within the standard CDM model, some explanations include: transformation of cusps to cores due to dynamical feedback processes Ogiya et al. (2014), self-similar secondary infall model Del Popolo (2009); Boyarsky et al. (2010); Del Popolo et al. (2013); Del Popolo and Lee (2017), dark matter-baryon interactions Famaey et al. (2018), non-violent relaxation of galactic haloes Baushev (2014). Some explanations beyond CDM include ultralight scalar dark matter Ureña-López et al. (2017), super-fluid dark matter Berezhiani et al. (2018), self-interacting dark matter Lin and Loeb (2016); Kamada et al. (2017); Bondarenko et al. (2018); Tulin and Yu (2018), MOND Milgrom (2009), etc. A constant halo surface density is also in tension with fuzzy dark matter models Burkert (2020).
It behooves us to test the same relation for galaxy clusters. Galaxy clusters are the most massive collapsed objects in the universe and are a wonderful laboratory for a wide range of topics from cosmology to galaxy evolution Allen et al. (2011); Vikhlinin et al. (2014). In the last two decades a large number of new galaxy clusters have been discovered through dedicated optical, X-ray, and SZ surveys, which have provided a wealth of information on Astrophysics and Cosmology. However, tests of the constancy of dark matter surface density for galaxy clusters have been very few.
The first such study for galaxy clusters was done by Boyarsky et al Boyarsky et al. (2009), who used the dark matter profiles from literature for 130 galaxy clusters and showed that the dark matter column density () goes as , where is the mass within the density contrast at White (2001), where the density contrast () is defined with respect to the critical density. Hartwick Hartwick (2012) used the generalized NFW profile Navarro et al. (1997) fits in Ref. Newman et al. (2009) (using strong and weak lensing data) for the Abell 611 cluster, and found that . This is about twenty times larger than the corresponding value obtained for galaxies Salucci (2019). Lin and Loeb Lin and Loeb (2016) estimated for the Phoenix cluster, using multi-wavelength data obtained by the SPT collaboration McDonald et al. (2012). Using a model for self-interacting dark matter including annihilations, they also predicted the following relation between the surface density and Lin and Loeb (2016)
| (1) |
Del Popolo et al also predicted Del Popolo et al. (2013); Del Popolo and Lee (2017) a similar relation between the dark matter column density and , within the context of a secondary infall model Del Popolo (2009) valid for cluster scale haloes
| (2) |
The first systematic study of the correlation between and for an X-ray selected cluster sample, and without explictly assuming any dark matter density model, was done by Chan Chan (2014) (C14, hereafter). C14 first considered the X-ray selected HIFLUGCS cluster catalog consisting of ASCA and ROSAT observations Chen et al. (2007). They considered 106 relaxed clusters from this catalog. From the hydrostatic equilibrium equation and parametric models for the gas density and temperature profiles, the total mass () was obtained as a function of radius. The total density as a function of radius () was then obtained from the total mass, assuming spherical symmetry.
One premise in C14 is that the total mass is dominated by the dark matter contribution, while the stellar and gas mass can be ignored. was obtained from extrapolating the dark matter density distribution to . The core radius was obtained by finding the radius () at which . This emulates the definition of in the Burkert profile Burkert (1995). Therefore, the estimate of core density and radius was done in C14 without explicitly positing any dark matter profile. We note that from weak and strong lensing observations, galaxy clusters are estimated to have cored or shallower than cuspy NFW dark matter profiles Newman et al. (2013); Del Popolo (2014). However, these results have been disputed Schaller et al. (2015), and some works have also found evidence for cuspy haloes in clusters Caminha et al. (2017). Therefore, there is no consensus on this issue Andrade et al. (2019). Nevertheless, no explicit assumptions about the dark matter profile was made in C14, while obtaining the dark matter core density and radius, although the gas density models used for deducing this, were initially motivated from assuming isothermality and a King profile for the total mass distribution in galaxy clusters. We also note that in some models, for example the cusp to core transformation model Ogiya et al. (2014) or the self-interacting dark matter with annihilations Lin and Loeb (2016), the product of the core density and core radius for the cored profile is same as the product of scale density and scale radius of cuspy NFW-like profiles.
In their analysis, C14 used two different density profiles (single- and double- model) for the gas density. They also did separate fits for both the cool-core and the non cool-core clusters. Using the double- model, they obtained for the HIFLUGCS sample. Results from fits with other profiles for the same sample as well as other samples can be found in C14. Therefore, their result shows that the dark matter surface density is not constant for clusters. C14 also carried out a similar analysis on the LOCUSS cluster sample analyzed in Shan et al Shan et al. (2010) and found that . Therefore, these results indicate that unlike single-galaxy systems, the dark matter surface density is not constant for galaxy clusters and is about an order of magnitude larger than for single galaxy systems.
We now implement the procedure recommended in C14 to determine and for a catalog of 12 galaxy clusters, selected using pointed X-ray and archival ROSAT observations by Vikhlinin et al Vikhlinin et al. (2006) (V06, hereafter). Detailed parametric profiles for gas density and temperature profiles have been compiled by V06. This cluster sample has been used to constrain a plethora of modified gravity theories and also to test non-standard alternatives to CDM model Rahvar and Mashhoon (2014); Hodson et al. (2017); Bernal et al. (2017); Edmonds et al. (2018); Hodson and Zhao (2017). We have also previously used this sample to constrain the graviton mass Gupta and Desai (2019) as well as to assess the importance of relativistic corrections to hydrostatic mass estimates Gupta and Desai (2020). Our work improves upon C14 in that, we account for the baryonic mass distribution while estimating the dark matter halo properties.
The outline of this manuscript is as follows. We describe the V06 cluster sample and associated models for the density and temperature profile in Sect. II. Our analysis and results for the relation between core radius and density can be found in Sect. III. Comparison with various theoretical scenarios is discussed in Sect. IV. We also test for dependence vs in Sect. V. We conclude in Sect. VI.
II Details of Chandra X-ray sample
V06 (See also Ref. Vikhlinin et al. (2005)) derived density and temperature profiles for a total of 13 nearby relaxed galaxy clusters (A133, A262, A383, A478, A907, A1413, A1795, A1991, A2029, A2390, MKW4, RXJ1159+55531, USGC 2152) using measurements obtained from pointed observations with the Chandra X-ray satellite. The redshifts of these clusters range approximately upto . These measurements extended up to very large radii of about for some of the clusters. For lower redshift clusters, because of Chandra’s limited field of view, archival ROSAT observations between 0.7-2.0 keV were used as a second independent data set to model the gas density distribution at large radii. The list of clusters for which ROSAT archival observations were used in conjunction with pointed Chandra observations include A133, A262, A478, A1795, A1991, A2029, and MKW 4. The redshifts of these clusters range approximately upto . These measurements extended up to very large radii of about for some of the clusters. The typical Chandra exposure times ranged from 30-130 ksecs. The temperatures span the range between 1 and 10 keV and masses from . V06 provided analytical estimates for the 3-D gas density and temperature profiles used to reconstruct the masses. The accuracy of mass reconstruction, tested with simulations was estimated to be within a few percent. From this sample of 13 clusters, we skipped USGC 2152 for our analysis, as all the relevant data was not available to us. More details about this cluster sample can be found in V06.
We now describe the three-dimensional models proposed by V06, for the gas density and temperature projected along the line of sight. These models can fit the observed X-ray surface brightness and projected temperature profiles. These parametric models are then used to derive the total gravitating mass of the clusters.
II.1 Gas Density Model
The analytic expression used for the three-dimensional gas density distribution is a modified version of the single--model (Cavaliere and Fusco-Femiano, 1978). These modifications were introduced to account for some additional features in the observed X-ray emission, such as a power-law cusp at the center and a steepening of the X-ray brightness for . To model the core region, a second -profile was added to increase the modeling freedom. This modified emission -profile is then defined as,
| (3) |
where and denote the number density of protons and electrons respectively. The model in Eq. 3 can independently fit the inner and outer cluster regions, and all the clusters in V06 sample were adequately fit with a fixed value of equal to three. A detailed description of all the other parameters in Eq. 3, as well as their values can be found in V06. The density and radius related constants used to parametrize Eq. 3, scale with the dimensionless Hubble parameter as and respectively. V06 has used =72 km/sec/Mpc. We have used the same values for the best-fit parameters of all the terms in Eq. 3 as in V06, where they can be found in Table 2. V06 however notes that the parameters in Eq. 3 are correlated, leading to degeneracies. However, the analytical expression in Eq. 3 can adequately model the X-ray brightness for all clusters. No errors for individual fit parameters have been provided in V06. The statistical uncertainties have been estimated using Monte Carlo simulations and found to be less than 9% Vikhlinin et al. (2006).
From the gas particle number density profile given by Eq. 3, the gas mass density can be obtained by assuming a cosmic plasma with primordial Helium abundance and abundances of heavier elements as,
| (4) |
II.2 Temperature Profile Model
To calculate the total dynamical mass, we need the three-dimensional temperature radial profile, whereas X-ray observations can only constrain the projected two-dimensional profile. The reconstructed temperature profile in V06 consists of two different functions, one to model the central part and another to model the region outside the central cooling zone. A broken power law is used to model the temperature outside the central cooling region and is given as,
| (5) |
The temperature decline in the central region can be expressed as (Allen et al., 2001a),
| (6) |
The three-dimensional temperature profile of the cluster is given:
| (7) |
Due to the large number (nine) of free parameters in the model, Eq. 7 can adequately describe any smooth trend in temperature profile. However, there are also degeneracies between the parameters. Therefore, again no errors were provided in V06 for the individual parameters describing the temperature profile. For doing the fits, the temperature data below an inner cutoff radius (usually between 10-40 kpc, with exact values tabulated in V06) was excluded because the intracluster medium is expected to be multiphase at such small radii Vikhlinin et al. (2006). The best-fit parameters for this model can be found in Table 3 of V06. As can be seen in Figs 3-14 of V06, the analytical temperature agrees very well with the projected temperatures for all clusters for all radii greater than the inner cutoff radius.
II.3 Mass and Density Profile in Clusters
The total mass of the galaxy cluster can be derived through hydrostatic equilibrium equation, given the temperature and gas density models Allen et al. (2011),
| (8) |
where is the mass within radius ; and denote the gas temperature and density; is the mean molecular weight equal to 0.5954 as in V06, and is the mass of the proton.
We can estimate the total dark matter mass distribution by subtracting the gas and stellar mass from the total mass, given by Eq. 8. The gas mass can be simply obtained by assuming spherical symmetry and integrating the gas density profile ( from Eq. 4)
| (9) |
The gas mass and total mass can hence be robustly determined for each cluster using Eq. 9 and 8. V06 however cautions that A2390 reveals X-ray cavities at small radii due to AGN activity Allen et al. (2001b). Therefore, its gas mass will be overestimated and the total mass underestimated. We do not account for this in our estimates of the dark matter core radius and density for this cluster.
To calculate the stellar mass at any radius (), we first estimate the star mass at , where is the radius at which the overdensity is equal to 500, where overdensity is again defined relative to the critical density for an Einstein-DeSitter universe at the cluster redshift . This star mass at was estimated using the empirical relation proposed in Ref. Lin et al. (2012), assuming =71 km/sec/Mpc
| (10) |
The above empirical relation was determining by comparing and star mass for a sample of about 100 clusters in the redshift range . was determined using the - scaling relation from Kravtsov et al. (2006). The stellar mass was estimated from the WISE or 2MASS (depending on the redshift range) luminosity and the Bruzual-Charlot stellar population synthesis models Bruzual and Charlot (2003). Lin et al also find no redshift evolution of this empirical relation Lin et al. (2012). To estimate the star mass at , for each cluster, we used tabulated for each cluster in V06. was estimated for every cluster using the cosmological parameters used in V06 : and . From Eq. 10, one can estimate the star mass at any radius, by assuming an isothermal profile Rahvar and Mashhoon (2014)
| (11) |
Alternately, the stellar mass can also be estimated using the stellar-to-gas mass relation obtained in Chiu et al Chiu et al. (2018), as used in Ref. Tian et al. (2020). However, since the stellar mass contribution to the total mass is negligible, this will not make a large difference to the final result.
Therefore, once we estimate the star and gas mass, we can determine the total dark matter mass distribution () at any radius () by subtracting the gas and star mass from the total mass distribution () calculated in Eq. 8:
| (12) |
From Eq. 12, the density profile of the dark matter halo can be easily calculated by assuming spherical symmetry:
| (13) |
To obtain and from , we follow the same prescription as in C14, which we now describe. To recap, is estimated from the dark matter density at the centre of the cluster. Therefore, similar to C14, we extrapolated our dark matter density profile (obtained from Eq. 13) to in order to calculate . The core radius was estimated by determining the radius at which the local dark matter density (defined in Eq. 13) reaches a quarter of its central value. As mentioned earlier, this is how is defined in the Burkert profile (Burkert, 1995, 2000; Gentile et al., 2009).
In this work and similar to C14, we also estimate and in a model-independent way without explicitly positing any dark matter profile. However, we should point out that the single- profile (used in C14 and also the starting point for Eq. 3) for the gas distribution, was originally derived from the equation of hydrostatic equilibrium for an isothermal gas, and assuming that the total cluster matter distribution is based on King profile Cavaliere and Fusco-Femiano (1978). Both C14 and this work have used an augmented version of this (double and modified -profile) to fit the X-ray observations. Nevertheless, the same -profile is also usually used in testing modified gravity theories or alternatives to CDM with galaxy cluster observations Rahvar and Mashhoon (2014); Gupta and Desai (2020); Hodson and Zhao (2017); Hodson et al. (2017). However, a truly ab-initio determination of the dark matter halo surface density is not possible.
We note that we have assumed spherical symmetry in the calculation of gas and total mass. Although we expect galaxy clusters to be triaxial Jing and Suto (2002); Limousin et al. (2013); Battaglia et al. (2012), one usually resorts to spherically averaged measurements of clusters, including in V06 and C14, and also for all other tests of modified gravity using relaxed clusters. This is due to the simplicity and the assumption that errors due to non-spherical effects are small. Furthermore, the intrinsic shapes and orientation of clusters are not directly observable and reconstructing them from X-ray images, which are inherently 2-D in nature can be very challenging Limousin et al. (2013); Shankar and Khatri (2019). Nevertheless, a large number of groups have investigated the errors in the determination of the total mass due to spherical symmetry assumption Piffaretti et al. (2003); Gavazzi (2005); Clowe et al. (2004); Battaglia et al. (2012); Buote and Humphrey (2012a, b); Limousin et al. (2013) (and references therein). The actual error depends on the intrinsic shape of the cluster and orientation along the line of sight. All these groups find that spherical averaging causes errors for all different intrinsic shapes and viewing orientations Piffaretti et al. (2003); Gavazzi (2005); Clowe et al. (2004); Battaglia et al. (2012); Buote and Humphrey (2012a, b); Limousin et al. (2013). We therefore expect the same for the clusters in V06 sample.
We now use Eq. 13 to determine and for the 12 clusters in V06. Errors in the observed gas temperature at a fixed number of radii have also been provided in V06 and made available to us (A. Vikhlinin, private communication). These were used to propagate the errors in the values of and , by varying the temperatures within the error bars. As no errors in the parameters of the gas and temperature density profile have been provided in V06, these were not used to calculate the errors in and .
III Analysis and Results
III.1 Determination of scaling relations
The resulting values of and along with error bars for each of the 12 clusters estimated using the procedure outlined in Sect. II.3 can be found in Table 1. We note that our values for and are of the same order of magnitude as for other galaxy cluster systems estimated in C14. Our estimated dark matter surface density is about an order of magnitude larger than that found for galaxy systems Donato et al. (2009); Salucci (2019).
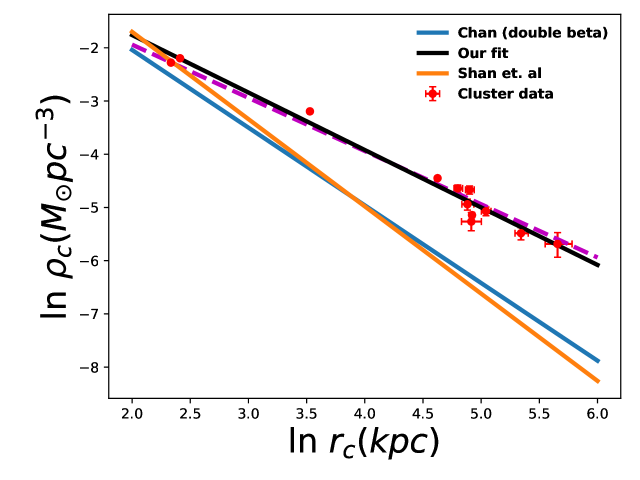
Figure 1 shows the log versus log plot, and we observe a tight scaling relation between the two. We also find that is inversely proportion to in agreement with C14. To determine the scaling relation between the two, we perform a linear regression () in log-log space. Here, and . Unlike C14, we also allow for an intrinsic scatter () in the linear fit. This intrinsic scatter is treated as a free parameter and is added in quadrature to the observational uncertainties ( and ). It can be determined along with the slope and intercept by maximizing the log-likelihood Tian et al. (2020); Hoekstra et al. (2012). The log-likelihood function () can be written as,
| (14) | |||||
| (15) |
The maximization of the log-likelihood was done using the emcee MCMC sampler Foreman-Mackey et al. (2013) with uniform priors. Our best-fit value for the scaling relation is as follows:
| (16) |
with an intrinsic scatter, . Therefore, we obtain a much shallower slope for the core density-radius scaling relation compared to the slope obtained in C14, who found for the HIFLUGCS sample, after assuming a double-beta profiles. Our results show deviations from a constant dark matter surface density at only about 1.3-1.4. A comparison of our result with the previous fits carried out in C14 can be found in Table 2. As we can see all the fits done in C14 show a much steeper slope than our result.
| Cluster | ||
|---|---|---|
| kpc | ||
| A133 | 11.68 | 102.01 |
| A262 | 5.17 | 136.36 |
| A383 | 9.63 | 121.45 |
| A478 | 3.39 | 286.14 |
| A907 | 4.15 | 208.96 |
| A1413 | 6.27 | 154.68 |
| A1795 | 7.15 | 131.89 |
| A1991 | 111.22 | 11.15 |
| A2029 | 9.39 | 134.31 |
| A2390 | 5.83 | 137.18 |
| RX J1159+5531 | 41.06 | 34.07 |
| MKW 4 | 102.4 | 10.31 |
| Slope | Intercept | Cluster Sample |
|---|---|---|
| ROSAT (single- profile) | ||
| ROSAT (double- profile) | ||
| ROSAT (cool-core clusters) | ||
| ROSAT (non cool-core clusters) | ||
| LOCUSS | ||
| Chandra (this work) |
III.2 Comparison with C14
Given the large discrepancies in the slope of our scaling relation with respect to C14, we investigate the reason for these differences. As mentioned earlier, C14 assumed that the dark matter mass in cluster is the same as the total mass. This assumption is not correct, as the gas mass fraction in the Chandra cluster sample ranges from (10-15)% Vikhlinin et al. (2006). Furthermore, C14 did not account for any intrinsic scatter in the scaling relation. Instead, the slope and intercept were determined using the BCES method Akritas and Bershady (1996). Among the multiple implementations of the BCES technique Akritas and Bershady (1996), C14 used the bisector method.
To reconcile the differences between our result and C14, we now redo our analysis in exactly the same way as C14, and also try a few variants to understand the impact of each of the different assumptions between our methods. Therefore, for this set of relaxed clusters, we also carried out the same analysis with the BCES-bisector method, without subtracting the gas and stellar contribution as well as by subtracting these contributions. We implemented the BCES-bisector technique using the bces module Akritas and Bershady (1996); Nemmen et al. (2012) in Python 222https://github.com/rsnemmen/BCES. We note that the BCES method Akritas and Bershady (1996) does not account for intrinsic scatter, when the abscissa contains errors Ascenso et al. (2012). Furthermore, the authors of the bces module have also cautioned against using the bisector method in BCES, as this method is self-inconsistent Hogg et al. (2010).
Finally, we also did a fit with the same likelihood as in Eq. 14, without accounting for intrinsic scatter but by subtracting the gas and star mass, and also vice-versa. Again, we used the emcee Foreman-Mackey et al. (2013) module for carrying out the maximization of the log likelihood. A summary of the resulting slopes using these different combinations of assumptions can be found in Table 1.
When we implement the BCES method, and do not subtract the gas and star mass (which exactly duplicates the C14 procedure), our value for the slope is consistent with the value found by C14 for the ROSAT sample. Even when we maximize the log-likelihood, we get a value for the slope closer to that found in C14. With both the BCES method and the maximization of the log likelihood (without intrinsic scatter), we get a near constant value for the dark matter surface density, only when we subtract the gas and star mass. Finally, if we do not subtract the gas and star mass, but do a fit using Eq. 12 to allow for intrinsic scatter, we get a slope consistent with -1 (within ).
Therefore, we conclude that we can reproduce nearly the same value for the slope of the regression relation between and as C14, when we use the BCES-bisector method (which does not fit for an intrinsic scatter), and also assume that the total dark matter mass is the same as the total cluster mass. However, to correctly estimate the scaling relations, one must subtract the gas and star mass estimates and also allow for an intrinsic scatter as we have done.
| Method | Gas/Star Mass | Slope |
|---|---|---|
| Subtracted? | ||
| BCES Method | No | |
| BCES Method | Yes | |
| W/o Intrinsic Scatter | No | |
| W/o Intrinsic Scatter | Yes | |
| With Intrinsic Scatter | No |
IV Comparison with theoretical models
Our results from the previous section show that we see deviations from a constant halo surface density only at about 1.4. However, the resulting value of our halo surface density is about ten times larger than for galaxies. We briefly discuss some theoretical models which are consistent with such a scenario.
The problems with CDM at small scales can be solved by self-interacting dark matter with a velocity-dependent cross-section ranging from on galaxy scales to on cluster scales Kaplinghat et al. (2016); Tulin and Yu (2018). C14 had argued that such velocity-dependent self-interacting cross-sections for dark matter (SIDM) Vogelsberger et al. (2012); Loeb and Weiner (2011); Rocha et al. (2013); Kaplinghat et al. (2016) are ruled out, if the observed core is produced due to dark matter self-interactions. The reason for this is that their scaling relations using the ROSAT sample showed that the halo surface density scales with as . However, combining the and scaling relations in Rocha et al. (2013), one gets that the halo surface density scales with , showing the opposite trend. However, as we showed in the previous section, C14’s scaling relation was obtained using incorrect assumptions. Furthermore, one cannot rule out SIDM, by comparing only cluster-based halo scaling relations with simulations, since the dynamic range for using only clusters is not large enough to test the scaling relations over a wide range of values.
Using cosmological simulations of self-interacting dark matter, Rocha et al Rocha et al. (2013) showed that correctly predicts cluster scale halo surface densities comparable to the observed ones in this work. Kamada et al Kamada et al. (2017) pointed out that for of 3 , the halo surface density for galaxies scales as , and assuming in the range of 20-100 km/sec, one gets values for the halo surface density for galaxies in the same ballpark as found by observations Donato et al. (2009); Salucci (2019). For galaxy clusters is usually about one to two orders of magnitude larger than for galaxies. Therefore, a simple extrapolation (along with a gradual decrease in cross-section as a function of velocity) to cluster scales should provide the correct order of magnitude for the halo surface density on cluster scales. Of course, a more detailed comparison is beyond the scope of this work and one would need to calculate the surface density using mock catalogs from the latest SIDM simulations.
Lin and Loeb Lin and Loeb (2016) proposed another semi-analytical model of self-interacting dark matter involving dark matter annihilations, wherein they provided an empirical formula for the dark matter core halo surface density as a function of halo mass (Eq. 1). They showed that this halo density agrees with galaxy scale observations Donato et al. (2009); Salucci (2019) as well with the data for one galaxy cluster (Phoenix) McDonald et al. (2012). Since our halo surface densities are approximately the same as that for the Phoenix cluster, we argue that the model proposed in Ref. Lin and Loeb (2016) correctly predicts the one order of magnitude increase in the observed surface density, as we go from galaxy-scale to cluster-scale haloes. This model also predicts a mild dependence on , which we test in the next section.
Del Popolo et al have argued in a series of works Del Popolo et al. (2013); Del Popolo (2014); Del Popolo and Lee (2017); Zhou et al. (2020) that Eq. 2, which can be explained within the context of the secondary infall model Del Popolo (2009) agrees with halo surface density of galaxies as well as clusters by comparing with the data for galaxies in Ref. Donato et al. (2009); Gentile et al. (2009) along with additional data sets Napolitano et al. (2010); Del Popolo et al. (2013); Saburova and Del Popolo (2014) (which they analyzed themselves), and also with galaxy cluster data compiled in Ref. Boyarsky et al. (2010). They however fit the column density instead of the surface density, and find that the column density shows a mild dependence on the galaxy mass and galaxy magnitude, which can be easily explained using their model. We also note that Eq. 2 gives the right order of magnitude for the halo surface density, which we obtain for the Chandra cluster sample.
For other models within and beyond CDM, which explain a constant halo surface density on galactic scales Ogiya et al. (2014); Famaey et al. (2018); Baushev (2014); Ureña-López et al. (2017); Berezhiani et al. (2018); Milgrom (2009), we could not find any definitive predictions therein for cluster scale halo surface densities.
Finally, we note that most recently, Burkert pointed out that for fuzzy dark matter models, the halo surface density scales inversely with the cube of the core radius and is therefore in complete disagreement with observations Burkert (2020). Hence, the constant dark matter surface density observations Donato et al. (2009); Salucci (2019) are in conflict with fuzzy dark matter scenarios.
Therefore, we conclude that the results in this work in conjunction with the constant halo surface density values on galaxy scales, are consistent with velocity-dependent self-interacting dark matter models as well as the secondary infall model (within CDM), but are in tension with fuzzy dark matter. For a more definitive test with various theoretical models one needs to extend this analysis to galaxy groups, which bridge the mass gap between galaxies and clusters, and then compare with predictions from simulations.
V Dependence on
We now use our results for and to check for correlation with , as suggested in some works Del Popolo et al. (2013); Lin and Loeb (2016). The first step in doing this is to estimate from . In V06, the masses () and concentration parameters () for the overdensity (with respect to the critical density) level and its corresponding radius () have already been derived, where was obtained using the mass-concentration relations in Dolag et al. (2004). We have determined the values using same prescription as in Ref. Amodeo et al. (2017), which assumes an NFW profile
| (17) |
where is a function of the concentration and the over-density (), and is given by Amodeo et al. (2017)
The concentration at , was obtained by solving for the following equation
| (18) |
where the NFW density scale parameter () and scale radius were fixed for each cluster and is given by
and is determined from
The values for the clusters A262 and MKW4 were unavailable in V06. Hence, we calculated it by extrapolating the mass profiles to the corresponding values. To calculate the error in , we propagated the errors in and provided in V06.
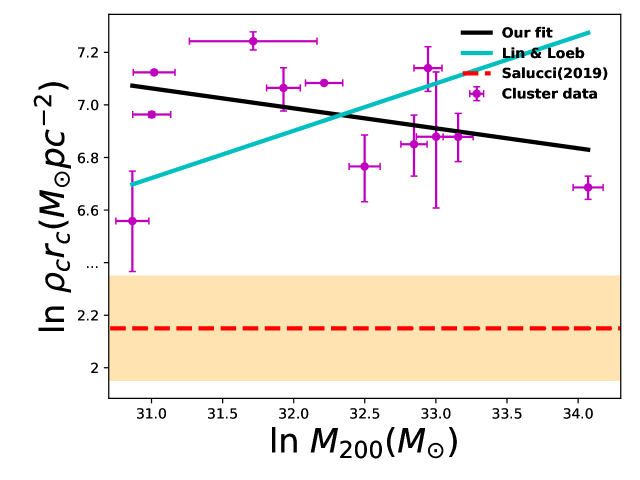
The relation between the dark matter column density, and in logarithmic space is shown in Fig 2. We have again done a linear regression with and ; and maximized the log-likelihood function (same as Eq. 14) using the emcee MCMC sampler with uniform priors. The best-fit parameters thus obtained are,
| (19) |
The intrinsic scatter for this fit is . We now fit this data to two scaling relations predicted by two independent theoretical scenarios proposed in literature for the dark matter halo surface density. Del Popolo et al Del Popolo (2014) found after applying the secondary infall model proposed in Ref. Del Popolo (2009) to cluster data Boyarsky et al. (2009), that , where is the dark matter column density. Lin and Loeb deduced from numerical simulations of self-interacting dark matter with annihilations, that , where is the product of the halo core density and radius Lin and Loeb (2016). However, we should caution that although the definition of core density in Lin and Loeb (2016) is same as ours, the core radius defined in Ref. Lin and Loeb (2016) could differ from the definition in Burkert profile depending on the initial scale radius in the dark matter halo profile Lin and Loeb (2016). Similarly in Eq 2 is the dark matter column density, whereas what we have estimated is the dark matter halo surface density. Although, both give about the same values for both cuspy and cored profiles Del Popolo et al. (2013), they are not exactly the same quantities. Nevertheless, we would like to test for the correlation with as predicted in both these works. We note that in the Lin and Loeb model Lin and Loeb (2016), there is also a slight dependence of the surface density as a function of redshift (See Fig. 2 of Ref. Lin and Loeb (2016)). However, since no analytic formula for the variation with redshift is provided, we do not account for this. We further point out these two relations are not exhaustive and other proposed scaling relations for the dark matter surface density as a function of halo mass are discussed in Ref. Del Popolo et al. (2013).
However, when we compare our estimated surface density with , we find a slight decrease in dark matter core density with , although the decrease with is not significant (cf. Table 4). Therefore, at face value our results would not be consistent with these predictions. To carry out a more definitive test, we now try to fit our data to these relations, by using the same slope (0.18 and 0.16) as predicted by these models, with only the intercept and intrinsic scatter as free parameters. We then do a model comparison with our best fits using AIC and BIC information criterion Liddle (2007). AIC and BIC are defined as follows Liddle (2007):
| (20) | |||||
| (21) |
where is the total number of data points, is the number of free parameters in each model, and is the maximum likelihood. When comparing two models, the model with the smaller value of AIC and BIC is considered the favored one.
The best-fit results for these two scaling relations can be found in Table 4. We find that AIC and BIC between our best-fit and that for other scaling relations is between 6-7, wherein our fit has the lowest value, indicating strong evidence for our fit as compared to the relations proposed in Refs. Del Popolo et al. (2013); Lin and Loeb (2016). We note that we shall obtain poorer fits for other scaling relations, which predict a steeper dependence with halo mass, for eg. Boyarsky et al. (2009). We should however caution that the dynamical range in mass for our cluster sample is not large, and for a more definitive test, lower mass samples should be included.
A comparison of our best-fit along with a fit to the theoretical relation in Lin and Loeb Lin and Loeb (2016) can be found in Fig. 2. In the same figure, we also show for comparison the constant value for the surface density, obtained for single galaxy systems using the latest data Salucci (2019).
| Model | Slope | AIC | BIC | |
|---|---|---|---|---|
| Lin & Loeb Lin and Loeb (2016) | 0.18 | 28% | 12.7 | 14.7 |
| Del Popolo et al Del Popolo et al. (2013) | 0.16 | 26% | 11.6 | 13.6 |
| This work | 17% | 5.1 | 8.0 |
VI Conclusions
A large number of studies in the past decade have found that the dark matter surface density, given by the product of dark matter core radius () and core density () is constant for a wide range of galaxy systems from dwarf galaxies to giant galaxies over 18 orders in blue magnitude. This cannot be trivially predicted by the vanilla CDM model, but it can be easily accommodated in various alternatives to CDM or by invoking various feedback mechanisms in CDM.
However, there have been very few tests of this ansatz for galaxy clusters. The first systematic study of this relation for a large X-ray selected cluster sample was done by C14 using the ROSAT sample studied in Chen et al Chen et al. (2007). They considered a sample of galaxy clusters in hydrostatic equilibrium and using parametric models for gas density and temperature, obtained the total mass density profile. They assumed that this is a proxy for the total dark matter density distribution. For this sample, was obtained by extrapolating the dark matter density distribution to the center of the cluster, whereas, was obtained by determining the radius at which the core density drops by a factor of four. This emulates the definition of core radius in the Burkert cored dark matter profile Burkert (1995). Therefore, this analysis was done without positing any specific dark matter density distribution. C14 did not find a constant dark matter surface density, but found a tight scaling relation between and , given by .
We then carried out a similar analysis as in C14 for a Chandra X-ray sample of 12 relaxed clusters, for which detailed 3-D gas density and temperature profiles were made available by Vikhlinin et al Vikhlinin et al. (2006). One improvement on the analysis in C14, is that we also subtracted the gas and star mass, while non-parameterically reconstructing the dark matter density profile. Furthermore, while determining the scaling relations between the core density and radius, we also accounted for the intrinsic scatter. Our results for the dark matter core density and radius can be found in Table 1. They are of the same order of magnitude as previous estimates for galaxy clusters Chan (2014), and are about an order of magnitude larger than for isolated galaxy systems. The halo surface densities for the cluster scale haloes are in the right ballpark from secondary infall model Del Popolo (2009), as well as velocity-dependent self-interacting dark matter scenarios Tulin and Yu (2018).
We find that . The intrinsic scatter for this relation is about 18 %. Therefore, we get only a marginal deviation from a reciprocal relation between the dark matter core density and radius in contrast to C14 who found a steeper dependence of as a function of . Our estimated dark matter surface density is inconsistent with flat density core at only . A comparison of our result with previous scaling relations found for galaxy clusters can be found in Table 2. We also checked that the discrepancy in our results compared to C14, is because C14 did not subtract the gas and star mass, or account for an intrinsic scatter. If we replicate exactly the same procedure as C14, we can reproduce their scaling relations using the Chandra cluster sample.
We also checked for any dependence of the dark matter surface density with to test some of these predictions in literature Del Popolo et al. (2013); Lin and Loeb (2016), although the exact definition in these works is not the same as the product of the dark matter core radius and density, which we calculated. We find that the dark matter surface density () scales with as , which is in mild disagreement the weak logarithmic increase with predicted in Refs.Del Popolo et al. (2013); Lin and Loeb (2016). However, a more definitive test can only be confirmed using a larger sample covering a wide dynamic range in mass by extending this test to galaxy groups.
Further stringent tests of this relation for clusters should soon be possible, thanks to the recent launch of the e-ROSITA satellite, and the expected discovery of about 100,000 clusters Hofmann et al. (2017).
Acknowledgements
We are grateful to Man-Ho Chan and Antonio Del Popolo for useful correspondence, and Alexey Vikhlinin for providing us the data in V06. We are also thankful to the anonymous referee for several constructive feedback on our manuscript.
References
- Chan (2014) M. H. Chan, Mon. Not. R. Astron. Soc. 442, L14 (2014), eprint 1403.4352.
- Vikhlinin et al. (2006) A. Vikhlinin, A. Kravtsov, W. Forman, C. Jones, M. Markevitch, S. S. Murray, and L. Van Speybroeck, Astrophys. J. 640, 691 (2006), eprint astro-ph/0507092.
- Aghanim et al. (2018) N. Aghanim et al. (Planck) (2018), eprint 1807.06209.
- Kim et al. (2018) S. Y. Kim, A. H. G. Peter, and J. R. Hargis, Phys. Rev. Lett. 121, 211302 (2018), eprint 1711.06267.
- Bullock and Boylan-Kolchin (2017) J. S. Bullock and M. Boylan-Kolchin, Ann. Rev. Astron. Astrophys. 55, 343 (2017), eprint 1707.04256.
- Weinberg et al. (2015) D. H. Weinberg, J. S. Bullock, F. Governato, R. Kuzio de Naray, and A. H. G. Peter, Proceedings of the National Academy of Science 112, 12249 (2015), eprint 1306.0913.
- Tulin and Yu (2018) S. Tulin and H.-B. Yu, Physics Reports 730, 1 (2018), eprint 1705.02358.
- Oh et al. (2011) S.-H. Oh, C. Brook, F. Governato, E. Brinks, L. Mayer, W. J. G. de Blok, A. Brooks, and F. Walter, Astron. J. 142, 24 (2011), eprint 1011.2777.
- Martizzi et al. (2012) D. Martizzi, R. Teyssier, B. Moore, and T. Wentz, Mon. Not. R. Astron. Soc. 422, 3081 (2012), eprint 1112.2752.
- Ogiya and Mori (2011) G. Ogiya and M. Mori, Astrophys. J. Lett. 736, L2 (2011), eprint 1106.2864.
- Chan et al. (2015) T. K. Chan, D. Kereš, J. Oñorbe, P. F. Hopkins, A. L. Muratov, C. A. Faucher-Giguère, and E. Quataert, Mon. Not. R. Astron. Soc. 454, 2981 (2015), eprint 1507.02282.
- Merritt (2017) D. Merritt, Studies in the History and Philosophy of Modern Physics 57, 41 (2017), eprint 1703.02389.
- Kormendy and Freeman (2004) J. Kormendy and K. C. Freeman, in Dark Matter in Galaxies, edited by S. Ryder, D. Pisano, M. Walker, and K. Freeman (2004), vol. 220 of IAU Symposium, p. 377, eprint astro-ph/0407321.
- Donato et al. (2009) F. Donato, G. Gentile, P. Salucci, C. Frigerio Martins, M. I. Wilkinson, G. Gilmore, E. K. Grebel, A. Koch, and R. Wyse, Mon. Not. R. Astron. Soc. 397, 1169 (2009), eprint 0904.4054.
- Gentile et al. (2009) G. Gentile, B. Famaey, H. Zhao, and P. Salucci, Nature (London) 461, 627 (2009), eprint 0909.5203.
- Walker et al. (2010) M. G. Walker, S. S. McGaugh, M. Mateo, E. W. Olszewski, and R. Kuzio de Naray, Astrophys. J. Lett. 717, L87 (2010), eprint 1004.5228.
- Salucci et al. (2012) P. Salucci, M. I. Wilkinson, M. G. Walker, G. F. Gilmore, E. K. Grebel, A. Koch, C. Frigerio Martins, and R. F. G. Wyse, Mon. Not. R. Astron. Soc. 420, 2034 (2012), eprint 1111.1165.
- Hartwick (2012) F. D. A. Hartwick, Astron. J. 144, 174 (2012), eprint 1210.3058.
- Kormendy and Freeman (2016) J. Kormendy and K. C. Freeman, Astrophys. J. 817, 84 (2016), eprint 1411.2170.
- Hayashi and Chiba (2015) K. Hayashi and M. Chiba, Astrophys. J. Lett. 803, L11 (2015), eprint 1503.05279.
- Burkert (2015) A. Burkert, Astrophys. J. 808, 158 (2015), eprint 1501.06604.
- Salucci (2019) P. Salucci, Astronomy and Astrophysics Review 27, 2 (2019), eprint 1811.08843.
- Boyarsky et al. (2010) A. Boyarsky, A. Neronov, O. Ruchayskiy, and I. Tkachev, Phys. Rev. Lett. 104, 191301 (2010), eprint 0911.3396.
- Napolitano et al. (2010) N. R. Napolitano, A. J. Romanowsky, and C. Tortora, Mon. Not. R. Astron. Soc. 405, 2351 (2010), eprint 1003.1716.
- Cardone and Tortora (2010) V. F. Cardone and C. Tortora, Mon. Not. R. Astron. Soc. 409, 1570 (2010), eprint 1007.3673.
- Del Popolo et al. (2013) A. Del Popolo, V. F. Cardone, and G. Belvedere, Mon. Not. R. Astron. Soc. 429, 1080 (2013), eprint 1212.6797.
- Saburova and Del Popolo (2014) A. Saburova and A. Del Popolo, Mon. Not. R. Astron. Soc. 445, 3512 (2014), eprint 1410.3052.
- Del Popolo and Lee (2017) A. Del Popolo and X.-G. Lee, Astronomy Reports 61, 1003 (2017).
- Zhou et al. (2020) Y. Zhou, A. Del Popolo, and Z. Chang, Physics of the Dark Universe 28, 100468 (2020).
- Burkert (1995) A. Burkert, Astrophys. J. Lett. 447, L25 (1995), eprint astro-ph/9504041.
- Spano et al. (2008) M. Spano, M. Marcelin, P. Amram, C. Carignan, B. Epinat, and O. Hernandez, Mon. Not. R. Astron. Soc. 383, 297 (2008), eprint 0710.1345.
- Navarro et al. (1997) J. F. Navarro, C. S. Frenk, and S. D. M. White, Astrophys. J. 490, 493 (1997), eprint astro-ph/9611107.
- Ogiya et al. (2014) G. Ogiya, M. Mori, T. Ishiyama, and A. Burkert, Mon. Not. R. Astron. Soc. 440, L71 (2014), eprint 1309.1646.
- Del Popolo (2009) A. Del Popolo, Astrophys. J. 698, 2093 (2009), eprint 0906.4447.
- Famaey et al. (2018) B. Famaey, J. Khoury, and R. Penco, JCAP 2018, 038 (2018), eprint 1712.01316.
- Baushev (2014) A. N. Baushev, Astron. & Astrophys. 569, A114 (2014), eprint 1309.5162.
- Ureña-López et al. (2017) L. A. Ureña-López, V. H. Robles, and T. Matos, Phys. Rev. D 96, 043005 (2017), eprint 1702.05103.
- Berezhiani et al. (2018) L. Berezhiani, B. Famaey, and J. Khoury, JCAP 2018, 021 (2018), eprint 1711.05748.
- Lin and Loeb (2016) H. W. Lin and A. Loeb, JCAP 2016, 009 (2016), eprint 1506.05471.
- Kamada et al. (2017) A. Kamada, M. Kaplinghat, A. B. Pace, and H.-B. Yu, Phys. Rev. Lett. 119, 111102 (2017), eprint 1611.02716.
- Bondarenko et al. (2018) K. Bondarenko, A. Boyarsky, T. Bringmann, and A. Sokolenko, JCAP 2018, 049 (2018), eprint 1712.06602.
- Milgrom (2009) M. Milgrom, Mon. Not. R. Astron. Soc. 398, 1023 (2009), eprint 0909.5184.
- Burkert (2020) A. Burkert, arXiv e-prints arXiv:2006.11111 (2020), eprint 2006.11111.
- Allen et al. (2011) S. W. Allen, A. E. Evrard, and A. B. Mantz, Ann. Rev. Astron. Astrophys. 49, 409 (2011), eprint 1103.4829.
- Vikhlinin et al. (2014) A. A. Vikhlinin, A. V. Kravtsov, M. L. Markevich, R. A. Sunyaev, and E. M. Churazov, Physics Uspekhi 57, 317-341 (2014).
- Boyarsky et al. (2009) A. Boyarsky, O. Ruchayskiy, D. Iakubovskyi, A. V. Maccio’, and D. Malyshev, arXiv e-prints arXiv:0911.1774 (2009), eprint 0911.1774.
- White (2001) M. White, Astron. & Astrophys. 367, 27 (2001), eprint astro-ph/0011495.
- Newman et al. (2009) A. B. Newman, T. Treu, R. S. Ellis, D. J. Sand , J. Richard, P. J. Marshall, P. Capak, and S. Miyazaki, Astrophys. J. 706, 1078 (2009), eprint 0909.3527.
- McDonald et al. (2012) M. McDonald, M. Bayliss, B. A. Benson, R. J. Foley, J. Ruel, P. Sullivan, S. Veilleux, K. A. Aird, M. L. N. Ashby, M. Bautz, et al., Nature (London) 488, 349 (2012), eprint 1208.2962.
- Chen et al. (2007) Y. Chen, T. H. Reiprich, H. Böhringer, Y. Ikebe, and Y. Y. Zhang, Astron. & Astrophys. 466, 805 (2007), eprint astro-ph/0702482.
- Newman et al. (2013) A. B. Newman, T. Treu, R. S. Ellis, and D. J. Sand , Astrophys. J. 765, 25 (2013), eprint 1209.1392.
- Del Popolo (2014) A. Del Popolo, JCAP 2014, 019 (2014), eprint 1407.4347.
- Schaller et al. (2015) M. Schaller, C. S. Frenk, R. G. Bower, T. Theuns, J. Trayford, R. A. Crain, M. Furlong, J. Schaye, C. Dalla Vecchia, and I. G. McCarthy, Mon. Not. R. Astron. Soc. 452, 343 (2015), eprint 1409.8297.
- Caminha et al. (2017) G. B. Caminha, C. Grillo, P. Rosati, M. Meneghetti, A. Mercurio, S. Ettori, I. Balestra, A. Biviano, K. Umetsu, E. Vanzella, et al., Astron. & Astrophys. 607, A93 (2017), eprint 1707.00690.
- Andrade et al. (2019) K. E. Andrade, Q. Minor, A. Nierenberg, and M. Kaplinghat , Mon. Not. R. Astron. Soc. 487, 1905 (2019), eprint 1901.00507.
- Shan et al. (2010) H. Y. Shan, B. Qin, and H. S. Zhao, Mon. Not. R. Astron. Soc. 408, 1277 (2010), eprint 1006.3484.
- Rahvar and Mashhoon (2014) S. Rahvar and B. Mashhoon, Phys. Rev. D 89, 104011 (2014), eprint 1401.4819.
- Hodson et al. (2017) A. O. Hodson, H. Zhao, J. Khoury, and B. Famaey, Astron. & Astrophys. 607, A108 (2017), eprint 1611.05876.
- Bernal et al. (2017) T. Bernal, V. H. Robles, and T. Matos, Mon. Not. R. Astron. Soc. 468, 3135 (2017), eprint 1609.08644.
- Edmonds et al. (2018) D. Edmonds, D. Farrah, D. Minic, Y. J. Ng, and T. Takeuchi, International Journal of Modern Physics D 27, 1830001-296 (2018), eprint 1709.04388.
- Hodson and Zhao (2017) A. O. Hodson and H. Zhao, Astron. & Astrophys. 598, A127 (2017), eprint 1701.03369.
- Gupta and Desai (2019) S. Gupta and S. Desai, Classical and Quantum Gravity 36, 105001 (2019), eprint 1811.09378.
- Gupta and Desai (2020) S. Gupta and S. Desai, Physics of the Dark Universe 28, 100499 (2020), eprint 1909.07408.
- Vikhlinin et al. (2005) A. Vikhlinin, M. Markevitch, S. S. Murray, C. Jones, W. Forman, and L. Van Speybroeck, Astrophys. J. 628, 655 (2005), eprint astro-ph/0412306.
- Cavaliere and Fusco-Femiano (1978) A. Cavaliere and R. Fusco-Femiano, Astron. & Astrophys. 70, 677 (1978).
- Allen et al. (2001a) S. W. Allen, R. W. Schmidt, and A. C. Fabian, Mon. Not. R. Astron. Soc. 328, L37 (2001a), eprint astro-ph/0110610.
- Allen et al. (2001b) S. W. Allen, S. Ettori, and A. C. Fabian, Mon. Not. R. Astron. Soc. 324, 877 (2001b), eprint astro-ph/0008517.
- Lin et al. (2012) Y.-T. Lin, S. A. Stanford, P. R. M. Eisenhardt, A. Vikhlinin, B. J. Maughan, and A. Kravtsov, Astrophys. J. Lett. 745, L3 (2012), eprint 1112.1705.
- Kravtsov et al. (2006) A. V. Kravtsov, A. Vikhlinin, and D. Nagai, Astrophys. J. 650, 128 (2006), eprint astro-ph/0603205.
- Bruzual and Charlot (2003) G. Bruzual and S. Charlot, Mon. Not. R. Astron. Soc. 344, 1000 (2003), eprint astro-ph/0309134.
- Chiu et al. (2018) I. Chiu, J. J. Mohr, M. McDonald, S. Bocquet, S. Desai, M. Klein, H. Israel, M. L. N. Ashby, A. Stanford, B. A. Benson, et al., Mon. Not. R. Astron. Soc. 478, 3072 (2018), eprint 1711.00917.
- Tian et al. (2020) Y. Tian, K. Umetsu, C.-M. Ko, M. Donahue, and I. N. Chiu, Astrophys. J. 896, 70 (2020), eprint 2001.08340.
- Burkert (2000) A. Burkert, The Astrophysical Journal Letters 534, L143 (2000).
- Jing and Suto (2002) Y. P. Jing and Y. Suto, Astrophys. J. 574, 538 (2002), eprint astro-ph/0202064.
- Limousin et al. (2013) M. Limousin, A. Morandi, M. Sereno, M. Meneghetti, S. Ettori, M. Bartelmann, and T. Verdugo, Space Science Reviews 177, 155 (2013), eprint 1210.3067.
- Battaglia et al. (2012) N. Battaglia, J. R. Bond, C. Pfrommer, and J. L. Sievers, Astrophys. J. 758, 74 (2012), eprint 1109.3709.
- Shankar and Khatri (2019) S. Shankar and R. Khatri, arXiv e-prints arXiv:1908.04454 (2019), eprint 1908.04454.
- Piffaretti et al. (2003) R. Piffaretti, P. Jetzer, and S. Schindler, Astron. & Astrophys. 398, 41 (2003), eprint astro-ph/0211383.
- Gavazzi (2005) R. Gavazzi, Astron. & Astrophys. 443, 793 (2005), eprint astro-ph/0503696.
- Clowe et al. (2004) D. Clowe, G. De Lucia, and L. King, Mon. Not. R. Astron. Soc. 350, 1038 (2004), eprint astro-ph/0402302.
- Buote and Humphrey (2012a) D. A. Buote and P. J. Humphrey, Mon. Not. R. Astron. Soc. 420, 1693 (2012a), eprint 1109.6921.
- Buote and Humphrey (2012b) D. A. Buote and P. J. Humphrey, Mon. Not. R. Astron. Soc. 421, 1399 (2012b), eprint 1109.6656.
- Hoekstra et al. (2012) H. Hoekstra, A. Mahdavi, A. Babul, and C. Bildfell, Mon. Not. R. Astron. Soc. 427, 1298 (2012), eprint 1208.0606.
- Foreman-Mackey et al. (2013) D. Foreman-Mackey, D. W. Hogg, D. Lang, and J. Goodman, Publ. Astron. Soc. Pac. 125, 306 (2013), eprint 1202.3665.
- Akritas and Bershady (1996) M. G. Akritas and M. A. Bershady, Astrophys. J. 470, 706 (1996), eprint astro-ph/9605002.
- Nemmen et al. (2012) R. S. Nemmen, M. Georganopoulos, S. Guiriec, E. T. Meyer, N. Gehrels, and R. M. Sambruna, Science 338, 1445 (2012), eprint 1212.3343.
- Ascenso et al. (2012) J. Ascenso, M. Lombardi, C. J. Lada, and J. Alves, Astron. & Astrophys. 540, A139 (2012), eprint 1203.5257.
- Hogg et al. (2010) D. W. Hogg, J. Bovy, and D. Lang, arXiv e-prints arXiv:1008.4686 (2010), eprint 1008.4686.
- Kaplinghat et al. (2016) M. Kaplinghat, S. Tulin, and H.-B. Yu, Phys. Rev. Lett. 116, 041302 (2016), eprint 1508.03339.
- Vogelsberger et al. (2012) M. Vogelsberger, J. Zavala, and A. Loeb, Mon. Not. R. Astron. Soc. 423, 3740 (2012), eprint 1201.5892.
- Loeb and Weiner (2011) A. Loeb and N. Weiner, Phys. Rev. Lett. 106, 171302 (2011), eprint 1011.6374.
- Rocha et al. (2013) M. Rocha, A. H. G. Peter, J. S. Bullock, M. Kaplinghat, S. Garrison-Kimmel, J. Oñorbe, and L. A. Moustakas, Mon. Not. R. Astron. Soc. 430, 81 (2013), eprint 1208.3025.
- Dolag et al. (2004) K. Dolag, M. Bartelmann, F. Perrotta, C. Baccigalupi, L. Moscardini, M. Meneghetti, and G. Tormen, Astron. & Astrophys. 416, 853 (2004), eprint astro-ph/0309771.
- Amodeo et al. (2017) S. Amodeo, S. Mei, S. A. Stanford, J. G. Bartlett, J.-B. Melin, C. R. Lawrence, R.-R. Chary, H. Shim, F. Marleau, and D. Stern, Astrophys. J. 844, 101 (2017), eprint 1704.07891.
- Liddle (2007) A. R. Liddle, Mon. Not. R. Astron. Soc. 377, L74 (2007), eprint astro-ph/0701113.
- Hofmann et al. (2017) F. Hofmann, J. S. Sanders, N. Clerc, K. Nandra, J. Ridl, K. Dennerl, M. Ramos-Ceja, A. Finoguenov, and T. H. Reiprich, Astron. & Astrophys. 606, A118 (2017), eprint 1708.05205.