New H i observations of KK 69.
Is KK 69 a dwarf galaxy in transition?
Abstract
We present new H i data of the dwarf galaxy KK 69, obtained with the Giant Metrewave Radio Telescope (GMRT) with a signal-to-noise ratio that almost double previous observations. We carried out a Gaussian spectral decomposition and stacking methods to identify the cold neutral medium (CNM) and the warm neutral medium (WNM) of the H i gas. We found that 30% of the total H i gas, which corresponds to a mass of 107 M⊙, is in the CNM phase. The distribution of the H i in KK 69 is not symmetric. Our GMRT H i intensity map of KK 69 overlaid onto a Hubble Space Telescope image reveals an offset of 4 kpc between the H i high-density region and the stellar body, indicating it may be a dwarf transitional galaxy. The offset, along with the potential truncation of the H i body, are evidence of interaction with the central group spiral galaxy NGC 2683, indicating the H i gas is being stripped from KK 69. Additionally, we detected extended H i emission of a dwarf galaxy member of the group as well as a possible new galaxy located near the north-eastern part of the NGC 2683 H i disk.
Keywords galaxies: groups: individual: KK 69, KK 70, NGC 2683 — galaxies: interactions — radio lines: galaxies
1 Introduction
The dwarf transition galaxies share properties with dwarf irregular (dIrr) galaxies (such us the H i content) as well as with dwarf spheroidal (dSph) galaxies (low luminosity and old stellar populations, see for instance Grebel et al. (2003)). In most of these galaxies, a positional offset is observed between the stellar and the H i component. Mateo (1998), Skillman et al. (2003), and Grebel et al. (2003) proposed a classification scheme for dwarf transition galaxies based on H i and flux. According to this classification, dwarf transition galaxies are detected in H i with very little or no flux indicating a gas depletion timescale higher than 100 Gyr. Even though the origin of the dwarf transition galaxies are not fully understood, many studies contemplate the idea that these galaxies could be the precursors of the dSph galaxies (see, e.g. Kormendy and Bender, 2012; Grcevich and Putman, 2009). Hence, the dwarf transition galaxies could serve as a link between the late-type and early-type dwarf galaxies.
The shallow potential well of dwarf galaxies makes their interstellar medium highly susceptible to disruptions by environmental forces as well as internal processes. The star formation bursts are the primary internal reason of disarrangement and mass loss in dwarf galaxies (Larson, 1974; Vader, 1986; Dekel and
Silk, 1986), while the ram-pressure stripping and tidal interactions are the main external mechanisms of gas removal. The efficiency of ram-pressure stripping depends on the intragroup medium density and the velocity of the galaxy through the medium (Gunn and Gott, 1972); it is common to observe a tail feature in the opposite direction to the galaxy motion (Chung et al., 2007). The magnitude of tidal disruptions depend on the mass, relative velocity and orbits between the interacting galaxies. The stripped gas may be found as tidal tails, filaments and even bridges of stars and gas (Higdon, 1996; Koribalski
et al., 2003; Koribalski and
Dickey, 2004; English et al., 2010). The galaxies Phoenix and NGC 5237 are two examples of that. Both are dwarf transition galaxies where the H i gas is offset from the stellar component, but the origin of the displacement seems to be different. In Phoenix, the offset may be the result of the star formation activity (Young et al., 2007). However in NGC 5237, the environmental effects are suspected to be the dominant reason of the offset (Koribalski
et al., 2018).
The internal and external mechanisms mentioned are not only the cause of structural/morphological changes, but they may also influence the future star formation activity in galaxies. Adams and
Oosterloo (2018) have found that almost 10 of the Leo T total mass is in the cold H i phase; conversely, the galaxy is not forming stars intensively. The authors attributed the large cold H i gas detected as a result of the interaction of Leo T with the Milky Way circumgalactic medium. The H i gas constitutes a key component in the evolution of galaxies; especially the CNM phase which is often use to pin-point the future star formation regions. Thus, the presence of the CNM and the columnar density of it, among other parameters, is crucial to better understand the star formation activity in dwarf transition and dIrr galaxies.
The dwarf galaxy KK 69 is part of the Faint Irregular Galaxies GMRT Survey (Begum et al., 2008, FIGGS) and is the only one with characteristics of a dwarf transition galaxy. The velocity resolution of all FIGGS galaxies is 1.7 km s-1. However, the signal-to-noise (SNR) achieved to some of them is not sufficient to perform the decomposition of the cold and warm neutral phases of the interstellar medium. Consequently, new dedicated GMRT H i observations were carried out during November 2015; the SNR obtained is better than the previous one. The KK 69 galaxy is a good laboratory to study the processes leading from a gas-rich to a gas-poor galaxy. We aim to better understand the relationship between the star formation activity and the environmental effects over the KK 69 galaxy evolution.
In the following we introduce the dwarf galaxy KK 69 and its environment (Section 2), we describe our observations and data reduction (Section 3), we present our results (Section 4) followed by the discussion (Section 5) and the summary and outlooks (Section 6).
| Property | KK 69 | KK 70 | N2683 | N2683 | N2683 | NGC | Ref |
| dw1 | dw2 | dw3? | 2683 | ||||
| 08:52:50.80 | 08:55:22.0 | 08:53:26.8 | 08:54:20.5 | 08:53:06 | 08:52:40.9 | 1,2 | |
| +33:47:52.0 | +33:33:33 | +33:18:19 | +33:14:58 | +33:35:20 | +33:25:02 | 1,2 | |
| [kpc] | 3.7 | 1.4 | 1 | 1.2 | 37.5 | 2 | |
| [arcmin] | 1.38 | 0.50 | 0.35 | 0.4 | 13.5 | 2 | |
| [Mpc] | 9.280.28 | 9.180.30 | 9.360.28 | 3 | |||
| 0.13 | 0.13 | 0.13 | 0.12 | 0.14 | 4 | ||
| [mag] | -12.54 | -12.27 | -10.6 | -10.5 | -20.8 | 2 | |
| [] | 1.6 | 1.2 | 0.3 | 1.7 | 3191.5 | * | |
| [deg] | 46 | 17 | 59 | 30 | 90 | 2 | |
| [] | (3.10.3) | (70.9) | 5.3 | (4.50.8) | 5 | ||
| [] | * | ||||||
| [ km s-1] | 38025 | 33565 | 6 |
2 KK 69 and its environment
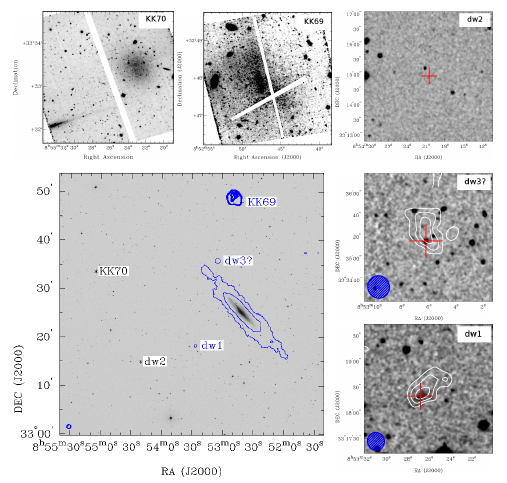
KK 69, along with KK 70, N2683dw1 and N2683dw2, are dwarf companion galaxies of the spiral galaxy NGC 2683 (Karachentsev
et al., 2015; Vollmer et al., 2016). All group members are shown in an optical image in Fig. 1. We summarise the optical properties of the member galaxies in Table LABEL:tab:prop. Karachentsev
et al. (2015) determined a new distance to KK 69 of Mpc using the tip of the red-giant branch (TRGB) method. Hereafter we adopt 9.28 Mpc as the distance to the group; at this distance 1 arcmin is equivalent to 2.7 kpc.
KK69 is also known as LEDA 166095 (see Fig. 1). It was observed with the 100 m single-dish radio telescope at Effelsberg to obtain an integrated H i line flux of = Jy km s-1 (Huchtmeier
et al., 2003). Later, GMRT observations found an H i flux of Jy km s-1 and a systemic velocity of km s-1 Begum et al. (2008). Based on its optical appearance, KK 69 was first cataloged as a possible dSph galaxy by Karachentseva and
Karachentsev (1998), but later on, it was proposed as a dIrr galaxy due to its H i content (Begum et al., 2008; Karachentsev
et al., 2013). The absolute B-band magnitude of = mag means this is the brightest dwarf member of the group. The major axis diameter at the Holmberg isophote, , is 3.7 kpc, and its projected distance from NGC 2683 is 23′ or kpc. We derived a Local Group velocity, = km s-1, which corresponds to a Hubble distance of 5.9 Mpc adopting a value of the Hubble’s constant, km s-1 . The large difference between the distance determined using the TRGB and the ‘Hubble flow’ lets us derive a KK 69 peculiar velocity of km s-1, see also Karachentsev
et al. (2015). The negative peculiar velocity implies that the motion is directed toward us.
KK 70, also known as LEDA 166096 (see Fig. 1), is a dSph galaxy at a distance of Mpc (Karachentsev
et al., 2015). The absolute B-band magnitude is mag, and the major axis diameter at the Holmberg isophote is 1.4 kpc, which is less than half of the value obtained for KK 69. The projected distance to NGC 2683, is 30′ or 82 kpc. An H i non-detection in KK 70 led to an estimation of the upper limit on the H i flux as Jy km s-1. This translates into an H i mass limit of at the distance of the galaxy (Karachentsev
et al., 2014).
N2683dw1 and N2683dw2, hereafter dw1 and dw2, are dIrr and dSph galaxies, assumed to be galaxy members of the NGC 2683 galaxy group (Karachentsev et al., 2015). Their and imply that they are the faintest and smallest members in the group, see Table LABEL:tab:prop. The dw1 galaxy is at a projected distance of 7′ or kpc while dw2 is at a projected distance of 10′ or kpc from the spiral galaxy. The galaxy dw1 is detected in H i; the results are shown in Section 4. Considering the r.m.s. of 1 mJy per 5 km s-1 channel width in Vollmer et al. (2016), we estimated an H i flux upper limit of Jy km s-1 for dw2 assuming a spectral width of 30 km s-1.
NGC 2683 is an edge-on spiral galaxy at a distance of Mpc. It is the most massive galaxy in this group. The is 101.4 Jy km s-1, the linewidths at 20 and 50 of the flux density are = km s-1 and = km s-1(Vollmer et al., 2016).
Using the group distance, the calculated value of its total H i mass is found to be . We derived a Local Group velocity of = km s-1, which corresponds to a Hubble distance of 5 Mpc. The large difference between the distance determined using the TRGB and the ‘Hubble flow’ let us derive a NGC 2683 peculiar velocity of , see also Karachentsev
et al. (2015). Karachentsev and
Kaisin (2010) have estimated the flux of = 4.5 and the star formation rate of .
We estimated, for each galaxy, the luminosity in the blue band using the expression:
where is the distance, is the apparent magnitude, the galactic extinction and is the absolute magnitude of the Sun. We have also determined the SFR, when was possible, using the relation (Kennicutt, 1998).
3 Observations and data Reduction
| Date of observations | 14-15 Nov 2015 | 16-17 Nov 2015 | 2 Jan 2005 |
|---|---|---|---|
| Time on source [min] | 322 | 360 | 258 |
| Pointing centre | |||
| 8:52:50.7 | 8:52:50.69 | ||
| +33:47:51.9 | +33:47:52 | ||
| Flux of calibrator 3C147 [Jy] | 22.20.3 | 22.40.3 | 22.10.02 |
| Flux of calibrator 3C286 [Jy] | 150.2 | 15.20.2 | 14.70.03 |
| Flux of calibrator 741+312 [Jy] | 2.10.03 | 2.30.03 | 2.20.01 |
| Centre frequency [MHz] | 1418.3524 | 1417.1983 | |
| Bandwidth [MHz] | 4.166 | 1 | |
| No. of channels | 512 | 128 | |
| Channel width [MHz] | 0.008138 | 0.007812 | |
| Velocity resolution [km s-1] | 1.7 | 1.65 | |
We observed KK 69 with the Giant Metrewave Radio Telescope (GMRT) in the L band for a total time of 11.2 hours. The observations were carried out during November 2015 in the spectral zoom mode with the GMRT-Software backend. We used a total 4 MHz bandwidth with 512 channels, which results in a spectral resolution of 8.13 kHz, equivalent to 1.7 km s-1 per channel. The flux calibrators 3C286 and 3C147 were observed at the beginning and the end of the run for 15 min each. The source 0741+312 was used as the phase calibrator and was observed for 5 min between the target scans of 45 min on KK 69; see Table 2 for details.
Previous data, as well as the new ones, were flagged and calibrated using the “Flagging and calibration pipeline for GMRT data” (Prasad and
Chengalur, 2011, FLAGCAL) and combined during the imaging process using miriad software package (Sault et al., 1995). In addition, we extensively used the Astronomical Image Processing Software (AIPS) for further analysis and the multi-wavelength imaging software kvis, part of the karma package (Gooch, 1996) for visualisation. GMRT does not do online Doppler tracking. Thus, the AIPS task CVEL was implemented to apply the Doppler shift corrections. We used the miriad task uvlin to subtract the continuum.
To probe the H i structure at various spatial scales, we imaged the visibility cube at different spatial resolutions by appropriately setting the tapering limits. However, since the galaxy is very faint, for all practical purposes of the current study, we used a low spatial resolution image cube. The H i map synthesised beam for natural weighting, considering up to 5 k baselines, is 50394957 ( kpc for a distance of 9.28 Mpc). The r.m.s. in the final combined data cube is 1 mJy beam-1 per 2 km s-1 channel in the center of the field, almost two times better than previous observations (Begum et al., 2008). The 3 and limits over ten channels are 1.51019 atoms cm-2 and M⊙(assuming the gas fills the beam).
We have also made use of the H i VLA reduced data cubes published by Vollmer et al. (2016). The authors studied in detailed the galaxy NGC 2683 and left aside the dwarfs galaxies close to it, which some of them are present in the C+D final cube. The final C+D cube mentioned in their work results as the combination of both VLA array observations. The r.m.s. noise level is 0.3 mJy in a 10.3 km s-1 channel with a resolution of 210200.
4 Results
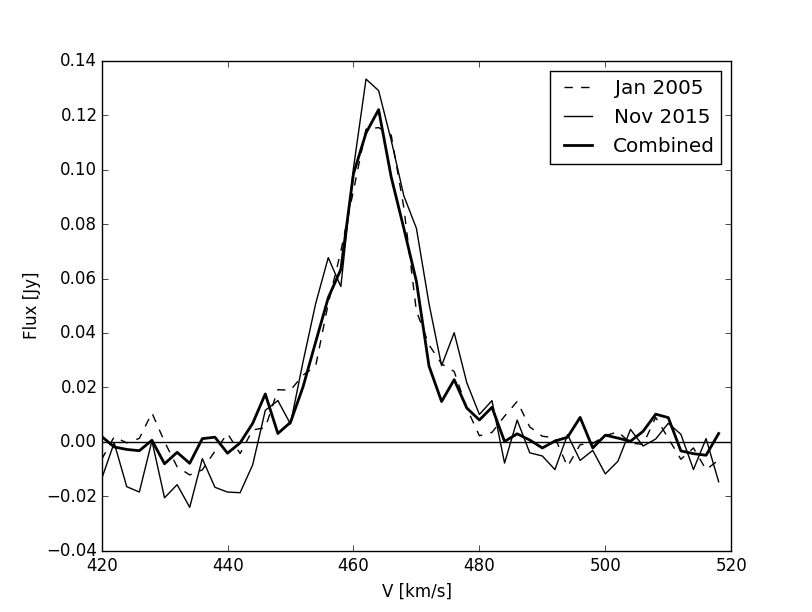
The global H i spectrum of KK 69 has a narrow Gaussian shape, and the H i emission is detected from 440 to 490 km s-1, see Fig. 2. After the primary beam correction of our image cube, we measured a total H i flux of =2.10.3 Jy km s-1; this value corresponds to a total H i mass of =4.2M⊙, at a distance of 9.28 Mpc. The line widths at 20 and 50 of the peak flux density are =22 km s-1 and =12 km s-1 with a systemic velocity of 464 km s-1. These estimations were done using the mbspect task in miriad. The H i properties of KK 69 derived from the GMRT observations are listed in Table 3.
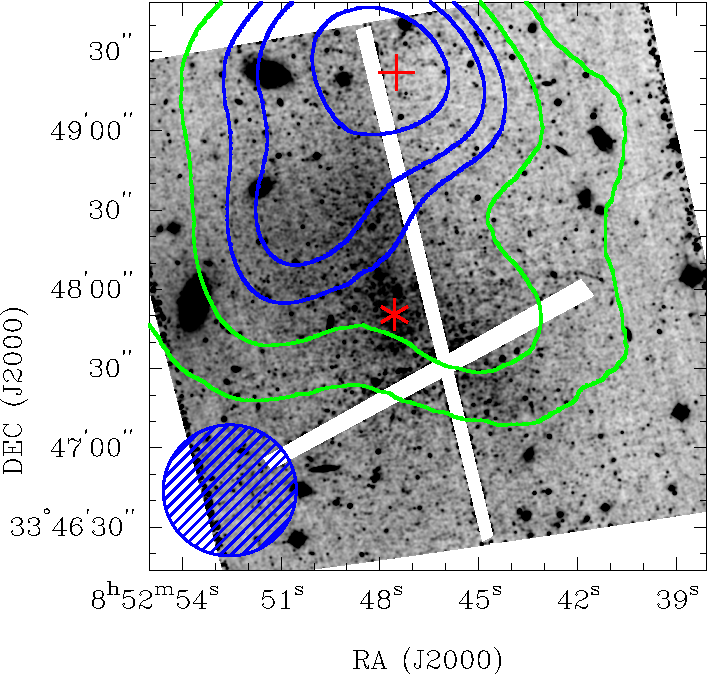
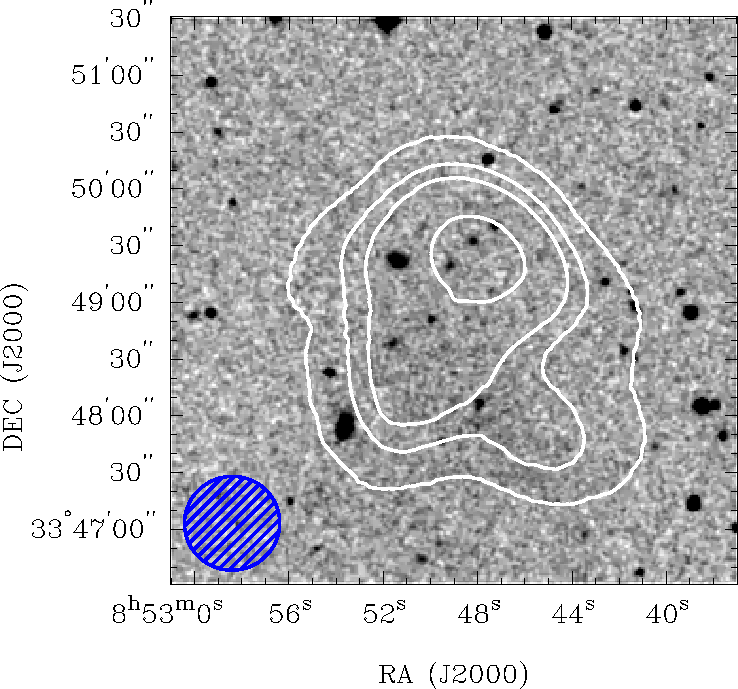
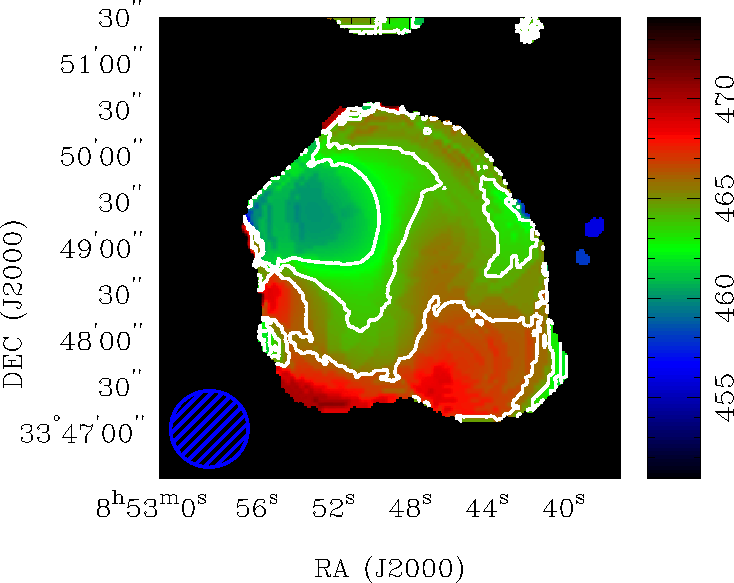
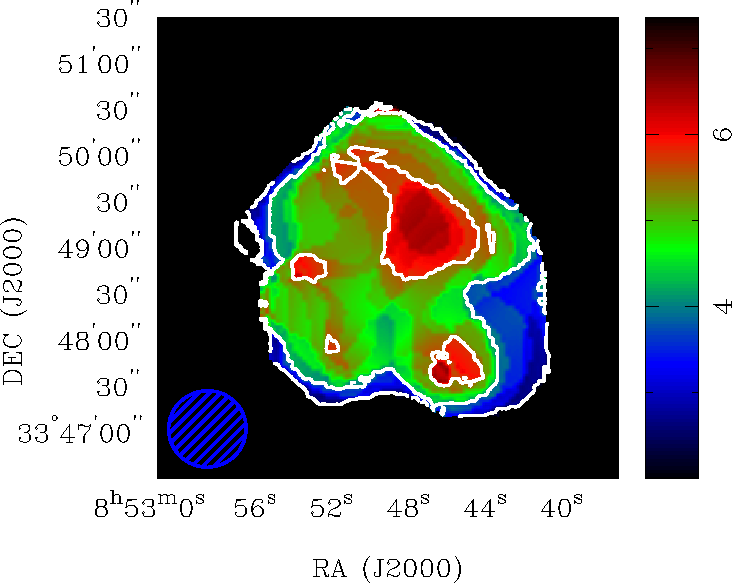
In order to study the H i gas distribution and kinematics in KK 69, we derived different moment maps. Before we did that, we applied a three-point spectral Hanning smoothing to the original spectral cube. We made use of the moment routine in the miriad software with a threshold clip of 3 times the r.m.s of the smoothed cube, see Figs. 3 & 4. The H i distribution in KK 69 is not symmetrical. The moment zero map reveals a shift between the center of the H i distribution and the peak of the H i. Moreover, the KK 69 H i gas is offset towards the northwest of the stellar body, and the H i contours are more compressed, see Figs. 3, while in the south the H i emission is more extended and diffuse. The position of the H i peak is . The displacement measured between the stellar high-density and the H i high-density regions is 1.6′or 4 kpc, assuming the group distance of 9.28 Mpc. The velocity field presented in Fig. 4 shows evidence of a weak velocity gradient, from 450 to 470 km s-1, across the extent of KK 69 with a mean velocity dispersion around of 5.5 km s-1. If we assume that the kinematics of this galaxy is rotationally supported, we can derive a total dynamical mass (Mdyn111=2.31105 r[kpc] (.) of 6107 M⊙. This is just 1.5 larger than the total H i mass of KK 69, which means that the galaxy is not in dynamical equilibrium. Probably, the combination of rotation and turbulence motions describes the velocity field of KK 69 in Fig. 4. High-velocity resolution and high-angular resolution are needed to understand the kinematics of this galaxy better.
After the inspection of the VLA C+D image cube, we discovered the H i counterpart of dw1, and a high-velocity cloud/tiny new galaxy (hereafter dw3?). dw3? is located, in projection, near the north-eastern end of NGC 2683. We used the primary beam corrected image cube to measure the H i flux in each galaxy. The H i flux and the systemic velocity of dw1 are 0.3 Jy km s-1 and km s-1. The total H i mass is . The H i intensity distribution map overlaid onto the DSS R-band magnitude image shows that the stellar and the H i high-density region are coincident, but the centers of the H i distribution and the optical counterpart are offset. A tail feature is observed towards the north-western part of the galaxy, see Fig. 1. We derived a Local Group velocity km s-1, which corresponds to a Hubble distance of 5 Mpc, based on Hubble’s constant. The large difference between the distance, considering dw1 as a group member, and the ‘Hubble flow’ let us derive a peculiar velocity of km s-1. The total H i flux measured for dw3? is 0.6 Jy km s-1. Assuming the group distance, the total H i mass is . Due to the better quality of the optical image given by the R-band of SDSS-DR7 in comparison with the DSS one, we overlaid this onto the H i intensity distribution map of dw3?; the optical image shows a compact reddish/blueish optical counterparts which could be the tip of a more extended and diffuse stellar component. We marked this with a red cross in Fig. 1. The H i properties derived from the VLA C+D image cubes are listed in Table 3.
| Property | KK 69 | dw3? | dw1 | NGC 2683 |
|---|---|---|---|---|
| H i peak | ||||
| 08:52:47.49 | 08:53:06 | 08:53:26 | 08:52:40.9 | |
| +33:49:21.98 | +33:35:20 | +33:18:25 | +33:25:02 | |
| [Jy km s-1] | 2.10.3 | 0.6 | 0.3 | 104 |
| [] | 4.20.6 | 1 | 0.6 | 210 |
| 2 | 0.05 | |||
| 21.40 | 0.90.6 | 0.9 | 26.5 | |
| 5.43.8 | 2.41.6 | 2.4 | 7213 | |
| [ km s-1] | 464 | 467 | 421 | |
| [] | 12 | 23 | 15 | |
| [] | 22 | 35 | 31 | |
| [] | 430 | 422 | 374 | 376 |
| [] |
4.1 The state of the HI gas in KK 69
Theoretical understanding suggests that the interstellar gas would settle in one of the two stable phases, i.e., Cold Neutral Medium (CNM) or Warm Neutral Medium (WNM) under local thermal equilibrium (Field et al., 1969; McKee and Ostriker, 1977; Wolfire et al., 1995, 2003). The CNM would have a temperature of 1000 K with high particle density (1-100 cm-3), whereas the WNM would have a much higher temperature 5000 K with low particle density (0.1-1 cm-3), see Dickey et al. (1978); Payne et al. (1983); Heiles and Troland (2003); Roy et al. (2006). Any gas with an intermediate temperature would quickly move to one of these stable phases by thermal runaway processes. Different emission studies have been carried out in order to identify the existence of the two phases of the ISM.
Young and Lo (1996) decomposed the line-of-sight H i emission spectra of many dwarf galaxies into multiple Gaussian components and found clear shreds of evidence of two components, one with a broad width (8-12 km s-1) and other with a relatively narrow width (6 km s-1). Even though the widths correspond to kinetic temperatures higher than the ones expected from theoretical models, the authors attributed this to a non-thermal broadening by turbulence. The decomposition of the spectra could be done considering either the spatially resolved line profiles or stacking the spectra to create a super-profile.
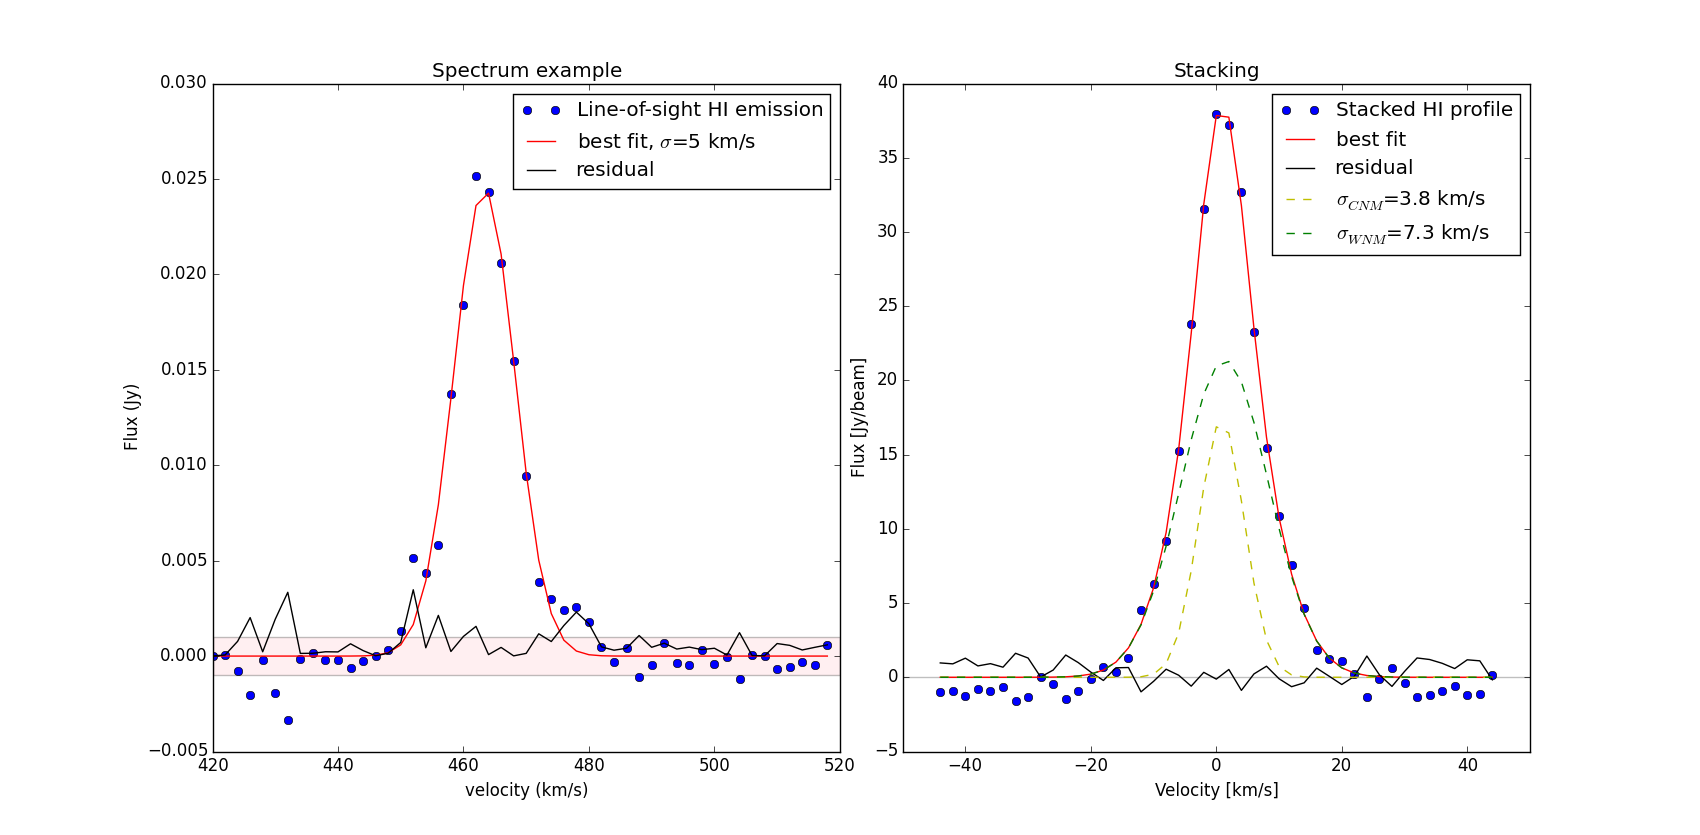
We first implemented the multigauss routine from Patra et al. (2016), adopting the same approach as in previous studies. To guarantee reliable fits, we have only decomposed the spectra with an SNR10, and to avoid any false positive, we use a 95% confidence level for F-test. The high SNR requirement severely restricts the total area over which we could apply the Gaussian decomposition method; in fact, it was equivalent to 4 synthesised beam area. The CNM component was found within the blue contours, as shown in Fig. 3. A single Gaussian component best fits most of the KK 69 spectra with a 6 km s-1, see Fig. 5, with mean velocity dispersion of 5.5 km s-1. A very few line-of-sights were best fitted by Gaussian profiles of widths 8 km s-112 km s-1. This implies that a better signal-to-noise ratio, as well as a better angular resolution, are needed to identify the WNM component directly.
Hence, to get a better signal-to-noise, we stacked the line-of-sight H i spectra. We adopted a similar approach as it is described in Stilp et al. (2013). We fitted the line-of-sight H i spectrum with a Gaussian Hermite Polynomial to locate the centroid of individual spectra. We used the information of the centroids to align all the spectra to a common velocity and stacked them together to produce a high SNR H i spectrum. The thinness of the resultant stacked spectra, in comparison with the total H i profile, implies that no artificial broadening is being created by asymmetric wings. In Fig. 5, we plot the resulting stacked spectra for KK 69. To produce a meaningful fit of the spectra by Gaussian Hermite Polynomial, a minimum SNR of 5 is required (de Blok et al., 2008). The decomposition of the stacked spectrum was carried out using both a single and a double Gaussian. According to the F-test, the two-component Gaussian fit is preferred to a single Gaussian component with a confidence level of better than 95. In Fig. 5 we plot the resulting decomposed components, the narrow and the broad components with velocity dispersion of = km s-1 (T840 K222(3/2)kT=(1/2).), and = km s-1 (T K), respectively. As can be seen from Fig. 5, the residuals look like noise without any significant feature indicating a double Gaussian to be a good representation of the stacked spectra. We found that of the total H i gas is well described by the narrower component while by the broader component.
5 Discussion
We found evidence that KK 69 is a dwarf transition galaxy being transformed from a gas-rich to a gas-poor galaxy. In the following paragraphs we discuss our results taking into account the relation between the interstellar medium and the star formation activity in the galaxy, the role played by the environment and the influence of these phenomena in the galaxy’s evolution.
To characterise in detail the H i gas of KK 69, we run a multi-Gaussian decomposition code and a stacking routine. From the direct decomposition method, we found that most of the H i line-of-sight spectra are best described by a single Gaussian with a velocity dispersion around 5.5 km s-1, which probably corresponds to the CNM component. Certainly, this value is high in comparison with the values present in the literature (3-4 km s-1), but it is similar to the ones obtained for the galaxies GR8, M 81 Dwarf A and NGC 4190 which are the faintest and smallest dwarf galaxies in Warren et al. (2012) sample. The stacking method revealed the presence of two components, one described by a narrow profile and another one by a broad profile, with velocity dispersion of km s-1 and km s-1, respectively. The value is in agreement with the typical velocity dispersion of the cold phase (4.5 km s-1); see Warren et al. (2012). The is smaller than the typical value found for the warm phase by the same authors, but it is similar to the velocity dispersion detected for the WNM component in the dwarf transition galaxy Leo T (Ryan-Weber
et al., 2008; Adams and
Oosterloo, 2018). The main issue regarding the WNM detection is the fact that this component is extended and diffuse.
In Fig. 2, we compared the GMRT integrated H i spectrum of the KK 69 galaxy obtained from 2005 and 2015 observations as well as the combinations of both of them. Even though we carried out a similar data reduction procedure, the flux we measured is 2.10.3 Jy km s-1 which is somewhat lower than the previous value of 3.00.3 Jy km s-1 published by Begum et al. (2008). The total H i flux recovered
after combining the GMRT observations is lower than the detected H i flux using the single-dish (Huchtmeier
et al., 2003). We are probably facing the fact that due to GMRT’s lack of short baselines, the GMRT observations struggle to detect the warmer component of the H i gas, see also Ryan-Weber
et al. (2008).
It is clear that the decomposition of the H i line-of-sight spectra into the CNM and the WNM is not straight forward for this galaxy, but we found evidence that a huge amount of H i gas lies in the CNM phase.
The CNM component is concentrated beyond the bulk of the stellar population, see Fig. 3 blue contours. The CNM distribution in the dwarf galaxies present in Warren et al. (2012) is quite different from the CNM distribution in KK 69. While in the first, the cold component is typically located at H i column densities above 1021 atoms cm-2, in KK 69 it is found at H i column densities above 1020 atoms cm-2; a shared characteristic with the galaxy Leo T (Adams and
Oosterloo, 2018). The H i high-density region of KK 69 contains a CNM column density333 corrected for He abundance. level of 2.41020 atoms cm-2. This value is well below the canonical threshold of star formation of 1021 atoms cm-2, at a linear resolution of 500 pc (Skillman, 1987). Probably, since the observed column density is an average over the telescope beam (2.32.3 kpc) the local column density is higher than the obtained value.
Observation carried out with BTA 6-m telescope by Karachentsev and
Kaisina (2013), detected Hα emission coming from a point source plus a diffuse component, located at the north-west of the stellar high-density region. For KK 69, the authors derived a star formation rate of 10-3.8M☉ yr-1. We looked into the GALEX images, and we found a hint of near-UV (NUV) and far-UV (FUV) emission nearby the H i high-density region.
Considering the SFR we could estimate the gas depletion timescale444; the factor 1.32 takes into account the presence of He. of =86.4 Gyr. If the SFR remains constant, the galaxy will need six times the age of the universe to transform all the H i gas into stars. This value is not as high as the one found in Pegasus (=3220 Gyr) in the Local Group, UGCA 365 (=1250 Gyr) and UKS 1424-469 (=534 Gyr) in the Centaurus A group (Grcevich and
Putman, 2009), but is still high in comparison with the estimate for galaxies forming stars more actively. The second method we implemented was the stacking process. From this method, we found that 30% of the total H i gas in KK 69 remains in the CNM component. Although the KK 69 galaxy has a substantial reservoir of H i gas, in particular CNM which is the main fuel for star formation, a sluggish star formation activity seems to characterise this galaxy.
The estimated metallicity for KK 69 is , following the relation proposed by Ekta and
Chengalur (2010). This low metalled means neither the time-averaged star formation rate chemical evolution has been lower than usual nor the galaxy has lost metal-enriched gas through galactic winds/supernovas. The comparison with the size of the H i gas offset from the stellar body observed in the galaxy Phoenix (Young et al., 2007) as well as the discussed properties of star formation activity in this galaxy, suggests that this latter scenario is less plausible.
The low star formation activity seems to be a general feature in the other dwarf galaxies member of the group.
The dwarf galaxies KK 70, dw2, and dw1 were also observed with the BTA 6-m telescope. No signs of Hα emission were detected for KK 70 by Karachentsev and
Kaisina (2013), and a Hα upper limit flux was estimated for dw2 (Kaisin and
Karachentsev, 2019). On the contrary, Hα emission was detected in dw1 (Kaisin and
Karachentsev, 2014), and this is in agreement with a clear GALEX counterpart. We did not find evidence of UV emission in dw3? after the inspection of GALEX images.
KK 69 is evolving in a particular scenario. The galaxy KK 69 belongs to a small group of galaxies located in the front edge of the Gemini-Leo Void. The main galaxy in this group is NGC 2683, a spiral edge-on galaxy, with some resemblances to the Milky Way and a bunch of neighboring dwarf galaxies. Considering the velocity and its projected distance, dw1 is the closest galaxy to NGC 2683. In Fig. 1, we show the H i distribution of the galaxy dw1. The stellar body and the H i high-density region are coincident, but the H i gas distribution shows a tail appearance towards the north-western direction of the galaxy. The subsequent closest galaxies are dw2, with no H i detection, and dw3?. What is the nature of dw3? ? Is it a high-velocity cloud, or is it a dwarf galaxy close to NGC 2683?. The H i velocity of dw3? is in agreement with the H i systemic velocity of KK 69. The H i size and the H i mass of dw3? are bigger than the values obtained for dw1. The SDSS7 R-band image shown in Fig. 1 exhibits, within the H i distribution, a compact optical counterpart, which could be thought of as the tip of a more extended and diffuse stellar component. From the comparison with the other dwarf galaxies members of the group, we proposed that dw3? is a new dwarf galaxy. Deep optical images are needed to confirm or dismiss the idea of dw3? being a dwarf galaxy.
Assuming that the virial theorem applies in this system, we roughly estimate a virial radius of 240 kpc (White, 2001; Sparke and
Gallagher, 2007). Thus, KK 69, as well as the other dwarf galaxies companions of NGC 2683, are well within the virial radius of NGC 2683. Probably, the interaction of dw1 and dw3? with NGC 2683 is the main mechanism leading the observed bent in the southwestern and northeastern part of the H i disk of NGC 2683. In KK 69, the H i gas is not symmetrically distributed. It is concentrated towards the north-west where the outermost H i contours are more compressed than elsewhere in the galaxy, and in the south-east part of the galaxy, the H i emission is more extended and diffuse, see Fig. 4. The observed morphological segregation in groups such as the Local Group, Centaurus, and Sculptor Group implies that the H i gas is removed from the dwarf galaxies that interact closely with massive galaxies. Given the fact that KK 69 is a gas-rich galaxy well within the virial radius of NGC 2683, the offset observed as well as the compressed contours are likely produced by the interaction of the H i gas disk with the intragroup medium. The idea of KK 69 infalling onto the group is the most probable.
6 Summary and outlooks
We carried out this study using new dedicated H i observations of the dwarf galaxy KK 69, obtained with the GMRT.
By means of a multi-Gaussian decomposition code and a stacking routine, we have found that a considerable amount of H i gas remains in the CNM phase (30%). Even though the galaxy seems to have a huge reservoir of the considered main fuel for star formation, it is not forming stars actively. The low star formation activity is a common characteristic shared with the other dwarf galaxies members of the group.
The GMRT H i observations revealed an offset between the H i gas distribution and the stellar body. Assuming a group distance of 9.28 Mpc, the size of the offset is found to be 4 kpc. The measured H i flux is 2.1 Jy beam-1 km s-1 and thus the total H i mass is . This established that KK 69 is the most H i massive galaxy in this group after NGC 2683. The velocity field presents a weak velocity gradient, but the mean dispersion velocity of the H i gas has a similar amplitude. The galaxy is not under dynamical equilibrium. High-angular resolution observations are needed to understand the kinematics of KK 69 better.
The nearest large neighbour of KK 69 is the spiral galaxy NGC 2683 () with signs of recent external gas accretion. After the inspection of the VLA C+D image cube published by Vollmer et al. (2016), we found the H i counterpart of a dwarf galaxy member of the group (dw1) and a possible new dwarf galaxy (dw3?) located at the north-east of the NGC 2683 H i disk. In both objects, a displacement is observed between the centers of the H i gas and the stellar component. Moreover, dw1 shows a kind of a tail feature in the north-western part. All the dwarf galaxies mentioned are well within the virial radius of NGC 2683. We proposed that tidal interactions are the main responsible mechanism of the observed offset between the stellar component and the H i distribution in the dwarf galaxies member of this group. KK 69 is likely a dwarf transition galaxy in which the H i gas is being stripped from the main body.
Upcoming surveys as for example, WALLABY (Koribalski, 2012), are expected to discover a large number of transition galaxies and with it the possibility of characterising their evolutionary states. X-ray observations are also needed in order to obtain information about the existence of intragroup hot gas and thus the possibility to study the importance of ram-pressure stripping process in low-density environments.
Acknowledgements
The radio data presented here were obtained with the Giant Metrewave Radio Telescope (GMRT). The GMRT is operated by the National Centre for Radio Astrophysics of the Tata Institute of Fundamental Research. JS is greateful to the GMRT and NCRA staff for their hospitality during her stay. This research has made use of the NASA/IPAC extragalactic database (NED) that is operated by the Jet Propulsion Laboratory, California Institute of Technology, under contract with the National Aeronautics and Space Administration and of SIMBAD data base, operated at CDS, Strasbourg, France. This work was partially supported by FCAG-UNLP and ANPCyT project PICT 2012-878.
References
- Adams and Oosterloo (2018) Adams, E.A.K., Oosterloo, T.A.: Astron. Astrophys. 612, 26 (2018). 1712.06636
- Begum et al. (2008) Begum, A., Chengalur, J.N., Karachentsev, I.D., Sharina, M.E., Kaisin, S.S.: Mon. Not. R. Astron. Soc. 386, 1667 (2008). 0802.3982
- Chung et al. (2007) Chung, A., van Gorkom, J.H., Kenney, J.D.P., Vollmer, B.: Astrophys. J. 659, 115 (2007). astro-ph/0703338
- de Blok et al. (2008) de Blok, W.J.G., Walter, F., Brinks, E., Trachternach, C., Oh, S.-H., Kennicutt, R.C. Jr.: Astron. J. 136, 2648 (2008). 0810.2100
- Dekel and Silk (1986) Dekel, A., Silk, J.: Astrophys. J. 303, 39 (1986)
- Dickey et al. (1978) Dickey, J.M., Salpeter, E.E., Terzian, Y.: Astrophys. J. Suppl. Ser. 36, 77 (1978)
- Ekta and Chengalur (2010) Ekta, B., Chengalur, J.N.: Mon. Not. R. Astron. Soc. 403(1), 295 (2010)
- English et al. (2010) English, J., Koribalski, B., Bland-Hawthorn, J., Freeman, K.C., McCain, C.F.: Astron. J. 139, 102 (2010). 0903.2690
- Evans et al. (2010) Evans, I.N., Primini, F.A., Glotfelty, K.J., Anderson, C.S., Bonaventura, N.R., Chen, J.C., Davis, J.E., Doe, S.M., Evans, J.D., Fabbiano, G., Galle, E.C., Gibbs, I. Danny G., Grier, J.D., Hain, R.M., Hall, D.M., Harbo, P.N., He, X.H., Houck, J.C., Karovska, M., Kashyap, V.L., Lauer, J., McCollough, M.L., McDowell, J.C., Miller, J.B., Mitschang, A.W., Morgan, D.L., Mossman, A.E., Nichols, J.S., Nowak, M.A., Plummer, D.A., Refsdal, B.L., Rots, A.H., Siemiginowska, A., Sundheim, B.A., Tibbetts, M.S., Van Stone, D.W., Winkelman, S.L., Zografou, P.: The Astrophysical Journal Supplement Series 189, 37 (2010). 1005.4665
- Field et al. (1969) Field, G.B., Goldsmith, D.W., Habing, H.J.: Astrophys. J. Lett. 155, 149 (1969)
- Gooch (1996) Gooch, R.: In: Jacoby, G.H., Barnes, J. (eds.) Astronomical Data Analysis Software and Systems V. Astronomical Society of the Pacific Conference Series, vol. 101, p. 80 (1996)
- Grcevich and Putman (2009) Grcevich, J., Putman, M.E.: Astrophys. J. 696, 385 (2009). 0901.4975
- Grebel et al. (2003) Grebel, E.K., Gallagher, I. John S., Harbeck, D.: Astron. J. 125, 1926 (2003). astro-ph/0301025
- Gunn and Gott (1972) Gunn, J.E., Gott, I. J. Richard: Astrophys. J. 176, 1 (1972)
- Heiles and Troland (2003) Heiles, C., Troland, T.H.: Astrophys. J. Suppl. Ser. 145, 329 (2003). astro-ph/0207104
- Higdon (1996) Higdon, J.L.: Astrophys. J. 467, 241 (1996)
- Huchtmeier et al. (2003) Huchtmeier, W.K., Karachentsev, I.D., Karachentseva, V.E.: Astron. Astrophys. 401, 483 (2003)
- Humason et al. (1956) Humason, M.L., Mayall, N.U., Sandage, A.R.: Astron. J. 61, 97 (1956)
- Kaisin and Karachentsev (2014) Kaisin, S.S., Karachentsev, I.D.: Astrophysical Bulletin 69, 390 (2014). 1412.5760
- Kaisin and Karachentsev (2019) Kaisin, S.S., Karachentsev, I.D.: Astrophysical Bulletin 74(1), 1 (2019). 1903.02375
- Karachentsev and Kaisina (2013) Karachentsev, I.D., Kaisina, E.I.: Astron. J. 146, 46 (2013). 1305.4791
- Karachentsev et al. (2015) Karachentsev, I.D., Kaisin, S.S., Kaisina, E.I.: Astrophysics 58, 453 (2015). 1512.03151
- Karachentsev et al. (2013) Karachentsev, I.D., Makarov, D.I., Kaisina, E.I.: Astron. J. 145, 101 (2013). 1303.5328
- Karachentsev et al. (2015) Karachentsev, I.D., Riepe, P., Zilch, T., Blauensteiner, M., Elvov, M., Hochleitner, P., Hubl, B., Kerschhuber, G., Küppers, S., Neyer, F., Pölzl, R., Remmel, P., Schneider, O., Sparenberg, R., Trulson, U., Willems, G., Ziegler, H.: Astrophysical Bulletin 70(4), 379 (2015)
- Karachentsev et al. (2015) Karachentsev, I.D., Tully, R.B., Makarova, L.N., Makarov, D.I., Rizzi, L.: Astrophys. J. 805, 144 (2015). 1503.06027
- Karachentsev and Kaisin (2010) Karachentsev, I.D., Kaisin, S.S.: Astron. J. 140(5), 1241 (2010). 1010.2053
- Karachentsev et al. (2014) Karachentsev, I.D., Kaisina, E.I., Makarov, D.I.: Astron. J. 147, 13 (2014). 1310.6838
- Karachentseva and Karachentsev (1998) Karachentseva, V.E., Karachentsev, I.D.: Astron. Astrophys. Suppl. Ser. 127, 409 (1998)
- Kennicutt (1998) Kennicutt, R.C. Jr.: Annu. Rev. Astron. Astrophys. 36, 189 (1998). astro-ph/9807187
- Kennicutt et al. (2008) Kennicutt, R.C. Jr., Lee, J.C., Funes, J.G., J., S., Sakai, S., Akiyama, S.: Astrophys. J. Suppl. Ser. 178, 247 (2008). 0807.2035
- Koribalski and Dickey (2004) Koribalski, B., Dickey, J.M.: Mon. Not. R. Astron. Soc. 348, 1255 (2004)
- Koribalski et al. (2003) Koribalski, B., Gordon, S., Jones, K.: Mon. Not. R. Astron. Soc. 339, 1203 (2003). astro-ph/0211391
- Koribalski (2012) Koribalski, B.S.: Proc. Astron. Soc. Aust. 29(3), 359 (2012). 1206.6916
- Koribalski et al. (2018) Koribalski, B.S., Wang, J., Kamphuis, P., Westmeier, T., Staveley-Smith, L., Oh, S., López-Sánchez, Á.R., Wong, O.I., Ott, J., de Blok, W.J.G., Shao, L.: Mon. Not. R. Astron. Soc., 467 (2018)
- Kormendy and Bender (2012) Kormendy, J., Bender, R.: Astrophys. J. Suppl. Ser. 198, 2 (2012). 1110.4384
- Larson (1974) Larson, R.B.: Mon. Not. R. Astron. Soc. 169, 229 (1974)
- Mateo (1998) Mateo, M.L.: Annual Review of Astronomy and Astrophysics 36, 435 (1998)
- McKee and Ostriker (1977) McKee, C.F., Ostriker, J.P.: Astrophys. J. 218, 148 (1977)
- Patra et al. (2016) Patra, N.N., Chengalur, J.N., Karachentsev, I.D., Kaisin, S.S., Begum, A.: Mon. Not. R. Astron. Soc. 456, 2467 (2016). 1512.06346
- Payne et al. (1983) Payne, H.E., Salpeter, E.E., Terzian, Y.: Astrophys. J. 272, 540 (1983)
- Prasad and Chengalur (2011) Prasad, J., Chengalur, J.: 2011 FLAGCAL: Flagging and Callibration Pipeline for Gmrt Data. Astrophysics Source Code Library. 1112.007
- Roy et al. (2006) Roy, N., Chengalur, J.N., Srianand, R.: Mon. Not. R. Astron. Soc. 365, 1 (2006). astro-ph/0511297
- Ryan-Weber et al. (2008) Ryan-Weber, E.V., Begum, A., Oosterloo, T., Pal, S., Irwin, M.J., Belokurov, V., Evans, N.W., Zucker, D.B.: Mon. Not. R. Astron. Soc. 384(2), 535 (2008). 0711.2979
- Sault et al. (1995) Sault, R.J., Teuben, P.J., Wright, M.C.H.: In: Shaw, R.A., Payne, H.E., Hayes, J.J.E. (eds.) Astronomical Data Analysis Software and Systems IV. Astronomical Society of the Pacific Conference Series, vol. 77, p. 433 (1995). astro-ph/0612759
- Schlegel et al. (1998) Schlegel, D.J., Finkbeiner, D.P., Davis, M.: Astrophys. J. 500, 525 (1998). astro-ph/9710327
- Skillman (1987) Skillman, E.D.: In: NASA Conference Publication, vol. 2466, p. 263 (1987)
- Skillman et al. (2003) Skillman, E.D., Côté, S., Miller, B.W.: Astron. J. 125, 593 (2003). astro-ph/0211447
- Sparke and Gallagher (2007) Sparke, L.S., Gallagher, I. John S.: Galaxies in the Universe, (2007)
- Stilp et al. (2013) Stilp, A.M., Dalcanton, J.J., Skillman, E., Warren, S.R., Ott, J., Koribalski, B.: Astrophys. J. 773, 88 (2013). 1306.2321
- Vader (1986) Vader, J.P.: Astrophys. J. 305, 669 (1986)
- Vollmer et al. (2016) Vollmer, B., Nehlig, F., Ibata, R.: Astron. Astrophys. 586, 98 (2016)
- Warren et al. (2012) Warren, S.R., Skillman, E.D., Stilp, A.M., Dalcanton, J.J., Ott, J., Walter, F., Petersen, E.A., Koribalski, B., West, A.A.: Astrophys. J. 757, 84 (2012). 1208.0983
- White (2001) White, M.: Astron. Astrophys. 367, 27 (2001). astro-ph/0011495
- Whiting et al. (2007) Whiting, A.B., Hau, G.K.T., Irwin, M., Verdugo, M.: Astron. J. 133, 715 (2007). astro-ph/0610551
- Wolfire et al. (1995) Wolfire, M.G., Hollenbach, D., McKee, C.F., Tielens, A.G.G.M., Bakes, E.L.O.: Astrophys. J. 443, 152 (1995)
- Wolfire et al. (2003) Wolfire, M.G., McKee, C.F., Hollenbach, D., Tielens, A.G.G.M.: Astrophys. J. 587, 278 (2003)
- Young and Lo (1996) Young, L.M., Lo, K.Y.: Astrophys. J. 462, 203 (1996)
- Young et al. (2007) Young, L.M., Skillman, E.D., Weisz, D.R., Dolphin, A.E.: Astrophys. J. 659, 331 (2007)