Local nuclear and magnetic order in the two-dimensional spin glass, Mn0.5Fe0.5PS3
Abstract
We present a comprehensive study of the short-ranged nuclear and magnetic order in the two-dimensional spin glass, Mn0.5Fe0.5PS3. Nuclear neutron scattering data reveal a random distribution of Mn2+ and Fe2+ ions within the honeycomb layers, which gives rise to a spin glass state through inducing competition between neighbouring exchange interactions, indicated in magnetic susceptibility data by a cusp at the glass transition, K. Analysis of magnetic diffuse neutron scattering data collected for both single crystal and polycrystalline samples gives further insight into the origin of the spin glass phase, with spin correlations revealing a mixture of satisfied and unsatisfied correlations between magnetic moments within the honeycomb planes, which can be explained by considering the magnetic structures of the parent compounds, MnPS3 and FePS3. We found that, on approaching from above, an ensemble-averaged correlation length of Å developed between satisfied correlations, and below , the glassy behaviour gave rise to a distance-independent correlation between unsatisfied moments. Correlations between the planes were found to be very weak, which mirrored our observations of rod-like structures parallel to the c* axis in our single crystal diffraction measurements, confirming the two-dimensional nature of Mn0.5Fe0.5PS3.
I Introduction
Low-dimensional materials, such as graphene, continue to captivate the scientific community due to the wide range of potential applications they naturally lend themselves to, from optoelectronics to nanocatalysis Tang and Zhou (2013); Wang et al. (2018); Ponraj et al. (2016); Mak and Shan (2016); Kumar and Xu (2018). Whilst their chemical and electronic properties have been studied extensively, examples of two-dimensional magnetic materials that can be exfoliated down to a monolayer, remain relatively scarce Burch et al. (2018); Park (2016). Yet lowering the dimensionality of certain compounds, and combining with, for example the application of pressure, has resulted in the formation of unconventional electronic and magnetic states of matter Dikin et al. (2011); Gong et al. (2017); Wang et al. (2016); Huang et al. (2018); Coak et al. (2020); Haines et al. (2018) that are rarely encountered in their bulk counterparts. Another potential route to attain unconventional magnetic states is to study frustrated magnets Balents (2010); Savary and Balents (2017). In recent years, there has been a surge of research focussed around novel ways to induce frustration on networks of magnetic ions that would not usually show such behaviour. One example is the Kitaev model Kitaev (2006); Hermanns et al. (2018), where highly anisotropic interactions between neighbouring spins generate frustration on a honeycomb network. The search for the theoretically predicted Kitaev quantum spin liquid resulting from such frustrated interactions has so far centred around two main material families, - RuCl3 Banerjee et al. (2016); Kim et al. (2015); Sears et al. (2015); Sandilands et al. (2016) and IrO3 ( = Li, Na) Williams et al. (2016); Ye et al. (2012); Liu et al. (2011), where ultimately deviations from the ideal honeycomb and direct exchange between the transition-metal ions lead these materials to order. Alternatively, frustration may also be induced by increasing the strength of competing ferromagnetic and antiferromagnetic exchange interactions within the honeycomb network, such as in the Heisenberg antiferromagnet Bi3Mn4O12(NO3) Alaei et al. (2017); Onishi et al. (2012); Matsuda et al. (2010); Okumura et al. (2010).
One family of materials that may link these fields are the honeycomb layered metal thiophosphates, MPS3.
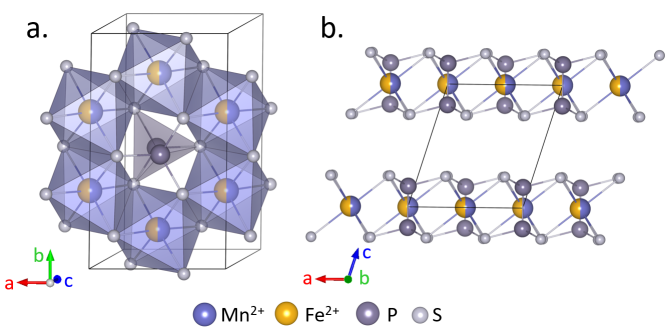
The MPS3 compounds adopt a monoclinic structure in which honeycomb networks of transition-metal (M) ions form in the ab planesOuvrard et al. (1985); Brec et al. (1979) (Figure. 1a.). Each transition-metal ion is contained within an octahedron of sulphur atoms with a pair of phosphorous atoms found at the centre of each honeycomb ring, stacked in an ABC sequence, similar to the CdCl2 structure Wang et al. (2018). These layers are weakly bound by van der Waals interactions Ouvrard et al. (1985) (Figure. 1b.), allowing the layers to either be intercalated Brec et al. (1979); Foot et al. (1987); Grasso and Silipigni (2002) or delaminated to a single monolayer Kuo et al. (2016); Lee et al. (2016).
The magnetic structures of two members of this series, MnPS3 and FePS3, have been well characterised in a number of earlier studies Wang et al. (2018); Joy and Vasudevan (1992); Susner et al. (2017); Brec et al. (1979); Grasso and Silipigni (2002). Although both are quasi-two-dimensional antiferromagnets, the precise details of their respective magnetic structures are deeply reliant on the choice of transition-metal ion residing within the honeycomb layers. Notably, in MnPS3, all nearest-neighbour magnetic moments are coupled antiferromagnetically in the ab planes, whereas in FePS3, there are two ferromagnetic nearest-neighbours and one antiferromagnetic neighbour for every Fe2+ ion within the plane Ressouche et al. (2010); Lançon et al. (2016); Murayama et al. (2016); Wildes et al. (1998); Kurosawa et al. (1983). Furthermore, MnPS3 is well modelled by a Heisenberg Hamiltonian, whilst the magnetic moments in FePS3 are more appropriately described as Ising-like Joy and Vasudevan (1992); Lançon et al. (2016); Wildes et al. (1998).
Creating a solid solution of these compounds, therefore, presents another way to generate magnetic frustration on a honeycomb network. Here, the source of frustration originates from the first nearest-neighbour exchange interaction, which is antiferromagnetic for MnPS3 Wildes et al. (1998) and ferromagnetic for FePS3 Lançon et al. (2016). This frustration may be further compounded by the competition between spin and exchange anisotropies that exist within the magnetic structures of the two end-members. Previous magnetisation and specific heat capacity measurements of Mn0.5Fe0.5PS3 have revealed a spin glass phase exists with the glass transition, , occurring at K Masubuchi et al. (2008); Manríquez et al. (2000); He et al. (2003); Takano et al. (2003). This glassy phase, where frustrated moments are randomly frozen, is thought to arise as a result of the competing magnetic exchange interactions combined with the random site occupancy of the transition-metal ions within the honeycomb layers. The presence of such chemical disorder has been verified using techniques such as Mssbauer spectroscopy He et al. (2003). Other sister compounds have also been reported, for instance Mn0.5Fe0.5PSe3 Bhutani et al. (2020), which despite the presence of chemical disorder and similarity to our material, is not a spin glass due to the very strong spin anisotropy arising from ligand spin-orbit contributions. This results in short-range magnetic order existing between nanoclusters of MnPSe3 and FePSe3-type structures.
However, in the case of Mn0.5Fe0.5PS3, there are still a number of important details surrounding the spin glass phase that remain to be understood, in particular, the nature of its local nuclear and magnetic correlations. In this paper we address these issues through a series of neutron scattering and magnetisation measurements.
II Experimental Methods
Single crystals of Mn0.5Fe0.5PS3 were grown via a three-step process to maximise the homogeneous mixing of manganese and iron constituents. Stoichiometric quantities of elemental powders - Fe (99.998 %, Alfa Aesar), Mn (99.95 %, Alfa Aesar), P (red phosphorous, 99.99 %, Sigma Aldrich) and S (99.998 %, Alfa Aesar) were ground under an argon atmosphere until fine and sealed in quartz tubes, which were evacuated to a mbar Ar gas pressure. Quartz tubes used in each step had an mm inner diameter and were mm in length. The sealed tubes were annealed at for days. The powder from this initial heating stage was then reground in an Ar glove box. The ground powder was sealed in a quartz tube as per the first synthesis step, and annealed at for a further days. Single crystals were grown from the powder via chemical vapour transport. The powder was reground and loaded into quartz tubes with an iodine powder flux agent ( mg of I2 per g of reactants). The tubes were evacuated to mbar vacuum using a molecular diffusion pump and sealed. The sealed tubes were placed in a two-zone furnace and heated to / over hours and held for days before cooling to room temperature over hours. The grown crystals formed shiny black flakes with typical dimensions, cm cm m. The sample stoichiometry and quality were verified with energy dispersive X-ray (EDX) spectroscopy and powder X-ray diffraction (XRD). EDX was performed on a Bruker QUANTAX system combined with a scanning electron microscope (COXEM, EM-30). The quality of single crystals were verified via X-ray Laue diffraction, using an Imaging Plate X-Ray Diffraction (IP-XRD) Laue Camera (IPX Co. Ltd).
Constant wavelength neutron powder diffraction (NPD) data were collected at room temperature on the high-resolution DB diffractometer Hewat (1986) at the Institut Laue-Langevin (ILL), Grenoble Suard and Wildes (2019). The incident wavelength was Å and the scattering was measured over an angular range of o. Nuclear refinements were completed using the GSAS package Toby and Von Dreele (2013). The powder used in these measurements was the powder produced from step two of the growth process. Like previous members of the MPS3 family Wildes et al. (2015), preferred orientation had to be accounted for due to the plate-like nature of Mn0.5Fe0.5PS3 which makes grinding an isotropic powder difficult, and was corrected for via the spherical harmonics (ODF) method.
Magnetisation measurements were carried out on single crystal samples in MPMS and MPMS SQUID magnetometers, Quantum Design. DC measurements were carried out in a fixed- T field, both cooled in zero applied field (ZFC) and field cooled (FC) cycles over a temperature range of to K. To avoid causing strains, the sample was not held in any epoxy or grease, and was instead held between sheets of plastic film.
Single crystals were aligned in orientations parallel and perpendicular to the c* axis on the three-axis spectrometer IN at the ILL. Neutron scattering measurements were performed on powder and single crystal samples using the polarised diffuse scattering D diffractometer Stewart et al. (2009) at the ILL Wildes et al. (2019). The incident neutron wavelength was Å, giving a reciprocal space range of Å-1. Single crystal data were measured as a function of the sample rotation about the normal to the scattering plane. The samples were rotated over a total range of degrees. The technique of -polarisation analysis was used to separate the magnetic, nuclear-coherent (NC) and nuclear spin-incoherent (NSI) components Stewart et al. (2009); Schweika (2010). Full calibration measurements included measurements of an empty and cadmium-filled sample can to estimate the instrumental background, a quartz standard to correct for polarisation inefficiencies and a vanadium standard to normalise the detector efficiencies. Data were placed on an absolute intensity scale (with units b/ster/f.u.) by normalising to the incoherent scattering from the vanadium standard. We verified our normalisation process was correct through Rietveld analysis of the NC cross-sections using FullProf Rodriguez-Carvajal (1993). Magnetic diffuse scattering data were analysed using the programs SPINVERT Paddison and Goodwin (2012); Paddison et al. (2013), SPINCORREL and Scatty Paddison (2019). These software produce refinements to experimental data based on reverse Monte Carlo (RMC) spin simulations. SPINVERT calculations were repeated times to average out statistical noise.
III Results
III.1 Nuclear Structure
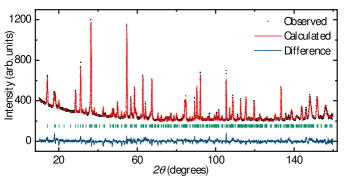
Figure. 2 shows the Rietveld refinement of the monoclinic model against high-resolution NPD data of Mn0.5Fe0.5PS3 collected at K on the DB instrument at the ILL. The refined parameters can be found in Table 1. Refinement of the transition-metal occupancies confirmed that the sample has the expected stoichiometry whereby the honeycomb network is comprised of an approximately equal amount of Mn2+ and Fe2+ ions. Within error, this is in agreement with the EDX results of and for Mn2+ and Fe2+ respectively. The respective neutron scattering lengths for Mn2+ and Fe2+ are fm and fm, which yield excellent contrast. The absence of any diffuse structure within the flat background of the NPD data indicates a lack of any short-range ordering between the Mn2+ and Fe2+ ions, and therefore implies a random distribution of the magnetic ions throughout the average structure.
| Atom | Site | x | y | z | Occ | Uiso (Å2) |
|---|---|---|---|---|---|---|
| Mn1 | 4g | 0 | 0.3354(9) | 0 | 0.520(4) | |
| Fe1 | 4g | 0 | 0.3354(9) | 0 | 0.480(4) | |
| P1 | 4i | 0.0542(8) | 0 | 0.1619(5) | 1.0 | |
| S1 | 4i | 0.738(1) | 0 | 0.2442(8) | 1.0 | |
| S2 | 8j | 0.2358(7) | 0.1661(4) | 0.2503(6) | 1.0 |
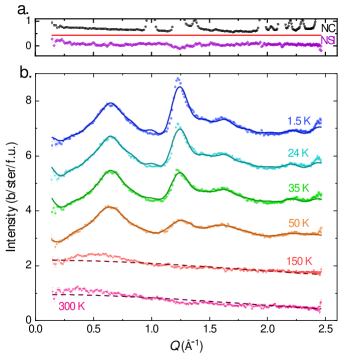
Experimental powder neutron scattering data recorded on D at the ILL are presented in Figure 3. An example of the NC and NSI components are shown in Figure 3a. which were collected at K. The expected NC is slightly lower than the measured values, as shown by the red line, and this may be due to a small systematic error in the estimation of the background. This is possible when using the xyz-method, although it is noteworthy that any residual background will only appear in the NC and NSI contributions as it is self-subtracted from the magnetic contributions. Similarly to the DB data, there is a nearly flat background in the NC measurement, which further confirms the absence of any substantial short-ranged order and therefore an essentially random distribution of Mn2+ and Fe2+ ions exists within the honeycomb layers.
III.2 Magnetic Susceptibility
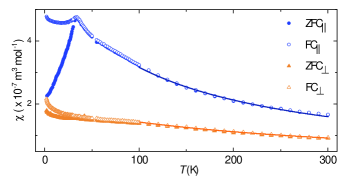
Single crystal magnetisation data are presented in Figure 4 and reveal features concomitant with spin glass behaviour. First, the data show a sharp cusp at K, which corresponds to the glass transition, , and is in accordance with other reports Masubuchi et al. (2008); Takano et al. (2003). Splitting between the FC and ZFC magnetisation occurs below , which is particularly prominent when the applied field is parallel to the c* axis. These data have been fit between and K with a modified Curie-Weiss law, , where m3 mol-1 is a temperature independent background term describing the inherent diamagnetic contribution of Mn0.5Fe0.5PS3Bain and Berry (2008). When the c* axis is parallel and perpendicular to the applied field, the extracted Curie-Weiss constants are K and K respectively. These values are both large and negative, indicating that the dominant interactions in Mn0.5Fe0.5PS3 are antiferromagnetic. The Curie constants, m3 K mol-1 and m3 K mol-1, give effective magnetic moments, and when the applied field is parallel and perpendicular to the c* axis respectively. This is slightly larger than the expected spin-only effective moment, , assuming an average from the mixture of Mn2+ and Fe2+ ions. Although previous magnetisation studies of MnPS3 have shown that the system can be well modelled by a spin-only effective moment, the high-spin state of Fe2+ ions results in a sizeable spin-orbit contribution, seen in both magnetisation Joy and Vasudevan (1992) and neutron Lançon et al. (2016) studies of FePS3. The large difference in the measured susceptibility when the field is applied in different orientations indicates that Mn0.5Fe0.5PS3 is highly anisotropic, similar to the measured magnetic susceptibility of FePS3 with pronounced Ising anisotropy parallel to the c* axis.
III.3 Magnetic Diffuse Scattering
The magnetic cross-sections recorded on D are presented in Figure 3b. and have been vertically shifted by b/ster/f.u. for clarity. The high-temperature data ( K) have been fit using an analytical approximation of the magnetic form factor for Mn2+ ionsBrown (1979), as shown by the dashed lines. This function describes the expected nature of Mn2+ ions when in a purely paramagnetic state. In the paramagnetic regime, the analytical approximations of Mn2+ and Fe2+ are roughly equivalent, therefore to simplify the analysis only one magnetic ion has been used. This function compares with the data reasonably well, however, the associated paramagnetic moment at Å-1 is which is a little low when compared to the expected . This can occur when there is some additional inelastic scattering at energies outside the integration window of D, which may be attributed to persistent critical fluctuations that extend beyond meV, similar to those found in FePS3 Wildes et al. (2012). The noticeable deviation between the function and data, particularly at low , indicates that some residual short-range correlations are still present, even at K.
Below K, there are a mixture of broad and sharp features which are reminiscent of the parent compounds, MnPS3 and FePS3. For instance, the broad feature centred around Å-1 is similar to that observed in FePS3 Lançon et al. (2016); Goossens et al. (2000); Rule et al. (2002, 2003). The magnitude of this feature has little variation below K and therefore suggests that FePS3-type correlations are more or less fully developed above . Furthermore, the sharp peak at Å-1 is similar to that observed in MnPS3 Wildes et al. (1994); Rule et al. (2003). This feature continues to evolve with temperature, thus implying that MnPS3-type correlations are still developing below . These data were fit using the SPINVERT program. A box size of unit cells were constructed with the moments constrained to lie either parallel or antiparallel to the c* axis. The resultant reverse Monte Carlo (RMC) fits are shown in Figure 3b. by the solid lines. The assumption that moments lie along the c* axis is supported by the anisotropy in the paramagnetic susceptibility and the fact that the orientation of ordered moments in the parent compounds align approximately along the c* axis. Specifically in MnPS3 the moments are canted o from the c* axis, whereas in FePS3 ordered moments lie directly along the c* axis Susner et al. (2017); Ressouche et al. (2010). The SPINVERT fits compare to the powdered data well, as they maintain a good balance between fitting all the features, both broad and sharp, within the data. The simplicity of this model is particularly appealing, by allowing the moments to lie only collinear to the c* axis, we were able to not only model these data well but also extend this to our single crystal study. Modelling with more complex models, with more free parameters such as larger box sizes or more rotational degrees of freedom for the magnetic moments, did not produce as good results as the ones presented here, as these additional parameters began to fit the statistical noise. We notice some small anomalies to the fit, such as the small peak emerging at Å-1 and that the intensity of the sharp peak at Å-1 is lower than the measured value, however we are confident in this model as the extracted magnetic moment from SPINVERT, () is in good agreement with the expected moment, (). Additionally, the quality of our later reconstruction of single crystal data indicates that this model is a reliable estimate of the magnetic diffuse scattering of Mn0.5Fe0.5PS3.
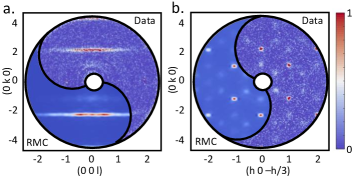
Figure 5 shows the measured single crystal data from D at K. Figure 5a., shows rod-like scattering parallel to the c* axis. These observations coincide with the main feature in our low-temperature powder data, the sharp peak at Å-1. Both of these features are synonymous with two-dimensional structures and thus reflect the two-dimensional nature of Mn0.5Fe0.5PS3. When the c* axis is normal to the scattering plane, as in Figure 5b., we observe strong magnetic intensity, approximately degrees apart, which correspond to the expected magnetic Bragg positions for ordered MnPS3 Ressouche et al. (2010). Additional magnetic Bragg spots are observed at low-temperatures, with the same six-fold rotation, but their intensity is weaker. Single crystal diffraction patterns were produced from fits of our powder data by the Scatty program. A comparison between the experimental data and scattering predicted from the RMC fits is shown in Figure 5, the good agreement indicates that the fit results will give a reliable estimate of the spin correlations in Mn0.5Fe0.5PS3.
III.4 Spin Correlations
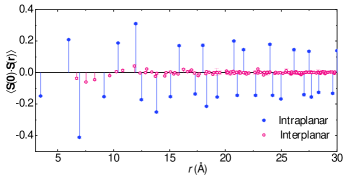
The radial spin correlation functions, , were calculated by SPINCORREL, where is the scalar product of a normalised spin with its neighbour at a vector separation, r Paddison et al. (2013). The function is normalised to equal if all the neighbours at a distance r are ferromagnetically coupled, and equal to if all the neighbours are antiferromagnetically coupled. Figure 6 shows at K split between intra- and interplanar correlations by blue and pink markers respectively.
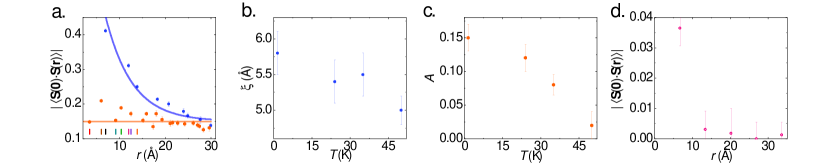
Figure 7a. shows the magnitude, , of the intraplanar correlations where two trends are apparent. The first set of correlations, highlighted by the orange markers, are approximately constant as a function of interatomic spacing, r. The second, shown by the blue markers, decrease in magnitude with increasing r. These two distinct trends in the data were analysed using two different functions. The orange points were averaged out to give a constant, , and the blue markers were fit with an exponential function, , where is the characteristic spin-spin correlation length (Å). The fits for the K data are shown in Figure 7a. Intraplanar correlations were found to be temperature dependent, and the fit values of and as a function of temperature are shown in Figures 7b. and c. respectively.
Figure 7d. shows the magnitude of the interplanar correlations for those neighbours closest to the c* axis, that is the nearest neighbours between parallel planes. The magnitude of these correlations showed no noticeable change with temperature. These correlations are very weak, only the first nearest-neighbour, at Å, has a magnitude significantly greater than zero and that is small at . This weak interaction between adjacent planes reflects the two-dimensional nature of Mn0.5Fe0.5PS3.
IV Discussion
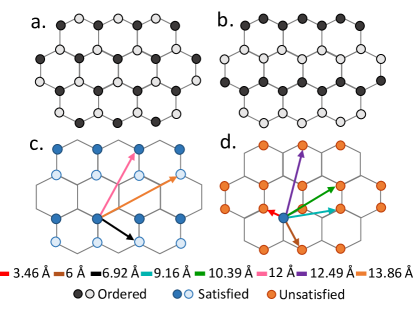
One plausible explanation as to why these two trends exist in Figure 7a. can be understood by considering the magnetic structures of MnPS3 and FePS3. In MnPS3, all the nearest-neighbour interactions within the ab planes are antiferromagnetic, whereas in FePS3, there are two ferromagnetic neighbours and one antiferromagnetic neighbour. This is illustrated in Figure 8a. and b. for MnPS3 and FePS3 respectively, where closed circles represent a spin-up orientation and open circles represent a spin-down orientation of the magnetic moments within the magnetic structures. Despite the differences in the magnetic structures, there are certain magnetic moment orientations that are the same, for which the underlying correlations must be similar. These correlations can thus be considered as satisfied and are illustrated in Figure 8c. Each satisfied correlation gives rise to a defined spin orientation between pairs of magnetic moments, just like in a conventionally ordered magnetic ground state, as shown by the open and closed blue circles. The remaining correlations are competing, and therefore unsatisfied, which are represented by the orange circles in Figure 8d. Figures 8c. and d. show the first eight correlations as given by SPINCORREL plotted from an arbitrary site, where it can be seen that these correlations fall into the two aforementioned groups. Some correlations could fit into either group, such as the shortest interatomic distance, Å, which has three neighbours. Of the three, one correlation is satisfied and the other two are unsatisfied. All neighbours at the distances marked in Figure 8c. have solely satisfied correlations. If any neighbour in a group of equivalent distances has an unsatisfied interaction then it has been assigned to the unsatisfied group in Figure 8d., regardless of how many satisfied correlations that distance may have. Therefore, the correlation occurring at Å has been assigned to the unsatisfied group. These groups are in perfect agreement when compared back to the observed trends in Figure 7a. To illustrate this, we have related the colour of tickmark for the first eight correlations in Figure 7a. with its corresponding arrow in Figure 8.
The average correlation length between satisfied moments is approximately constant below the freezing temperature as shown in Figure 7b. The average correlation length of these correlations, Å is relatively small, as it does not even stretch one unit cell across in the honeycomb. So although there is some short-ranged magnetic order present, ordered interactions within the plane can only be considered between the very closest neighbouring ions, and long-ranged magnetic order does not develop across the honeycomb network. In Figure 7c., we observe that the dropoff of is more pronounced with increasing temperature, becoming approximately zero just above . We can therefore relate that the unsatisfied moments give rise to the glassy behaviour of Mn0.5Fe0.5PS3 and observe that they reach a local level of ordering with continued cooling.
To summarise, the correlations can be separated into three groups. The first, interplanar correlations, are very weak, verifying the two-dimensional character of the compound. The intraplanar correlations may be separated into two subgroups: satisified correlations, between moments that have the same orientations for all equivalent distances in both the MnPS3 and FePS3 structures; and unsatisfied correlations, where moments at equivalent distances have at least one pair that differ between the two structures. The unsatisfied correlations are approximately constant with distance and are temperature-dependent, falling to zero above . The satisfied correlations decrease exponentially with distance, having a characteristic length that is much less temperature-dependent and that persists above the glass temperature.
V Conclusion
In conclusion, we have presented high resolution powder neutron diffraction, DC magnetic susceptibility and magnetic diffuse scattering data for the two-dimensional honeycomb spin glass, Mn0.5Fe0.5PS3. We have confirmed that no short- or long-ranged nuclear ordering is present within the honeycomb layers from the random distribution of Mn2+ and Fe2+ ions. Neutrons were the ideal tool for determining this, as the difference in neutron scattering lengths of Mn2+ and Fe2+ provided a clear contrast, which is not resolvable in other methods, like X-ray diffraction. The presence of the spin glass phase has been validated through DC magnetic susceptibility measurements, through the observation of a characteristic sharp cusp at the glass transition. In modelling and interpreting our magnetic diffuse scattering data we have relied upon the nature of the magnetic structure of the parent compounds, MnPS3 and FePS3. Whilst the differences produced unsatisfied interactions that cause glassy behaviour, similarities were found to be responsible for some local magnetic ordering, both of which are required to understand two emergent trends in the data collected. We confirmed this model through the excellent agreement with measured single crystal data. We have found that Mn0.5Fe0.5PS3 is an near-ideal example of a two-dimensional magnetic material through observing rod-like structures in single crystal data and determining that interactions between the planes were very weak in our analysis of the spin correlations.
VI Data Availability
Raw data sets from ILL experiments can be accessed via links provided in Refs. 49 and 53. Magnetisation data presented in this paper resulting from the UK effort will be made available at https://wrap.warwick.ac.uk/132173.
VII Acknowledgements
J. N. G. and L.C. acknowledge the ILL Graduate School and the EPSRC (DTP) for providing a studentship to J. N. G. This project has received funding from the European Research Council (ERC) under the European Union’s Horizon 2020 research and innovation programme (Grant Agreement No. 681260). This work was supported by the Institute for Basic Science (IBS) in Korea (Grant No. IBS-R009-G1). Work at the CQM was supported by the National Research Foundation of Korea (Grant No. 2020R1A3B2079375). The authors would like to thank Joe Paddison, Paul Goddard, Sin Dutton, Charles Haines, David Jarvis, Cheng Liu, Siddharth Saxena, Inho Hwang, JungHyun Kim and Nahyun Lee for their help and useful discussions.
References
- Tang and Zhou (2013) Q. Tang and Z. Zhou, Prog. Mater. Sci. 58, 1244 (2013).
- Wang et al. (2018) F. Wang, T. A. Shifa, P. Yu, P. He, Y. Liu, F. Wang, Z. Wang, X. Zhan, X. Lou, F. Xia, and J. He, Adv. Funct. Mater. 28, 1802151 (2018).
- Ponraj et al. (2016) J. S. Ponraj, Z.-Q. Xu, S. C. Dhanabalan, H. Mu, Y. Wang, J. Yuan, P. Li, S. Thakur, M. Ashrafi, K. Mccoubrey, Y. Zhang, S. Li, H. Zhang, and Q. Bao, Nanotechnology 27, 462001 (2016).
- Mak and Shan (2016) K. F. Mak and J. Shan, Nat. Photonics 10, 216 (2016).
- Kumar and Xu (2018) A. Kumar and Q. Xu, ChemNanoMat. 4, 28 (2018).
- Burch et al. (2018) K. S. Burch, D. Mandrus, and J.-G. Park, Nature 563, 47 (2018).
- Park (2016) J.-G. Park, J. Phys. Condens. Matter 28, 30 (2016).
- Dikin et al. (2011) D. A. Dikin, M. Mehta, C. W. Bark, C. M. Folkman, C. B. Eom, and V. Chandrasekhar, Phys. Rev. Lett. 107, 056802 (2011).
- Gong et al. (2017) C. Gong, L. Li, Z. Li, H. Ji, A. Stern, Y. Xia, T. Cao, W. Bao, C. Wang, Y. Wang, Z. Q. Qiu, R. J. Cava, S. G. Louie, J. Xia, and X. Zhang, Nature 546, 265 (2017).
- Wang et al. (2016) H. Wang, F. Fan, S. Zhu, and H. Wu, EPL- EUROPHYS LETT 114, 47001 (2016).
- Huang et al. (2018) B. Huang, G. Clark, D. R. Klein, D. MacNeill, E. Navarro-Moratalla, K. L. Seyler, N. Wilson, M. A. McGuire, D. H. Cobden, D. Xiao, W. Yao, P. Jarillo-Herrero, and X. Xu, Nat. Nanotechnol. 13, 544 (2018), 1802.06979 .
- Coak et al. (2020) M. J. Coak, D. M. Jarvis, H. Hamidov, C. R. S. Haines, P. L. Alireza, C. Liu, S. Son, I. Hwang, G. I. Lampronti, D. Daisenberger, P. Nahai-Williamson, A. R. Wildes, S. S. Saxena, and J.-G. Park, J. Phys. Condens. Matter 32, 124003 (2020).
- Haines et al. (2018) C. R. S. Haines, M. J. Coak, A. R. Wildes, G. I. Lampronti, C. Liu, P. Nahai-Williamson, H. Hamidov, D. Daisenberger, and S. S. Saxena, Phys. Rev. Lett. 121, 266801 (2018).
- Balents (2010) L. Balents, Nature 464, 199 (2010).
- Savary and Balents (2017) L. Savary and L. Balents, Rep. Prog. Phys. 80, 016502 (2017).
- Kitaev (2006) A. Kitaev, Ann. Phys. 321, 2 (2006).
- Hermanns et al. (2018) M. Hermanns, I. Kimchi, and J. Knolle, Annu. Rev. Condens. Matter Phys. 9, 1 (2018).
- Banerjee et al. (2016) A. Banerjee, C. A. Bridges, J.-Q. Yan, A. A. Aczel, L. Li, M. B. Stone, G. E. Granroth, M. D. Lumsden, Y. Yiu, J. Knolle, S. Bhattacharjee, D. L. Kovrizhin, R. Moessner, D. A. Tennant, D. G. Mandrus, and S. E. Nagler, Nat. Mater. 15, 733 (2016).
- Kim et al. (2015) H.-S. Kim, V. Vijay Shankar, A. Catuneanu, and H.-Y. Kee, Phys. Rev. B 91, 241110(R) (2015).
- Sears et al. (2015) J. A. Sears, M. Songvilay, K. W. Plumb, J. P. Clancy, Y. Qiu, Y. Zhao, D. Parshall, and Y.-J. Kim, Phys. Rev. B 91, 144420 (2015).
- Sandilands et al. (2016) L. J. Sandilands, Y. Tian, A. A. Reijnders, H.-S. Kim, K. W. Plumb, Y.-J. Kim, H.-Y. Kee, and K. S. Burch, Phys. Rev. B 93, 075144 (2016).
- Williams et al. (2016) S. C. Williams, R. D. Johnson, F. Freund, S. Choi, A. Jesche, I. Kimchi, S. Manni, A. Bombardi, P. Manuel, P. Gegenwart, and R. Coldea, Phys. Rev. B 93, 195158 (2016).
- Ye et al. (2012) F. Ye, S. Chi, H. Cao, B. C. Chakoumakos, J. A. Fernandez-Baca, R. Custelcean, T. F. Qi, O. B. Korneta, and G. Cao, Phys. Rev. B 85, 180403(R) (2012).
- Liu et al. (2011) X. Liu, T. Berlijn, W.-G. Yin, W. Ku, A. Tsvelik, Y.-J. Kim, H. Gretarsson, Y. Singh, P. Gegenwart, and J. P. Hill, Phys. Rev. B 83, 220403(R) (2011).
- Alaei et al. (2017) M. Alaei, H. Mosadeq, I. A. Sarsari, and F. Shahbazi, Phys. Rev. B 96, 140404(R) (2017).
- Onishi et al. (2012) N. Onishi, K. Oka, M. Azuma, Y. Shimakawa, Y. Motome, T. Taniguchi, M. Hiraishi, M. Miyazaki, T. Masuda, A. Koda, K. M. Kojima, and R. Kadono, Phys. Rev. B 85, 184412 (2012).
- Matsuda et al. (2010) M. Matsuda, M. Azuma, M. Tokunaga, Y. Shimakawa, and N. Kumada, Phys. Rev. Lett. 105, 187201 (2010).
- Okumura et al. (2010) S. Okumura, H. Kawamura, T. Okubo, and Y. Motome, J. Phys. Soc. Jpn. 79 (2010).
- Momma and Izumi (2011) K. Momma and F. Izumi, J. Appl. Cryst. 44, 1272 (2011).
- Ouvrard et al. (1985) G. Ouvrard, R. Brec, and J. Rouxel, Mater. Res. Bull. 20, 1181 (1985).
- Brec et al. (1979) R. Brec, D. M. Schleich, G. Ouvrard, A. Louisy, and J. Rouxel, Inorg. Chem. 18, 1814 (1979).
- Foot et al. (1987) P. J. S. Foot, T. Katz, S. N. Patel, B. A. Nevett, A. R. Pieecy, and A. A. Balchin, Phys. Status Solidi A 100, 11 (1987).
- Grasso and Silipigni (2002) V. Grasso and L. Silipigni, Riv. Nuovo Cimento 25, 1 (2002).
- Kuo et al. (2016) C.-T. Kuo, M. Neumann, K. Balamurugan, H. J. Park, S. Kang, H. W. Shiu, J. H. Kang, B. H. Hong, M. Han, T. W. Noh, and J.-G. Park, Sci. Rep. 6, 20904 (2016).
- Lee et al. (2016) S. Lee, K.-Y. Choi, S. Lee, B. H. Park, and J.-G. Park, APL Mater. 4, 086108 (2016).
- Joy and Vasudevan (1992) P. A. Joy and S. Vasudevan, Phys. Rev. B 46, 5134 (1992).
- Susner et al. (2017) M. A. Susner, M. Chyasnavichyus, M. A. McGuire, P. Ganesh, and P. Maksymovych, Adv. Mater. 29, 1602852 (2017).
- Ressouche et al. (2010) E. Ressouche, M. Loire, V. Simonet, R. Ballou, A. Stunault, and A. Wildes, Phys. Rev. B 82, 100408(R) (2010).
- Lançon et al. (2016) D. Lançon, H. C. Walker, E. Ressouche, B. Ouladdiaf, K. C. Rule, G. J. McIntyre, T. J. Hicks, H. M. Rønnow, and A. R. Wildes, Phys. Rev. B 94, 214407 (2016).
- Murayama et al. (2016) C. Murayama, M. Okabe, D. Urushihara, T. Asaka, K. Fukuda, M. Isobe, K. Yamamoto, and Y. Matsushita, J. Appl. Phys. 120, 142114 (2016).
- Wildes et al. (1998) A. R. Wildes, B. Roessli, B. Lebech, and K. W. Godfrey, J. Phys. Condens. 10, 6417 (1998).
- Kurosawa et al. (1983) K. Kurosawa, S. Saito, and Y. Yamaguchi, J. Phys. Soc. Japan 52, 3919 (1983).
- Masubuchi et al. (2008) T. Masubuchi, H. Hoya, T. Watanabe, Y. Takahashi, S. Ban, N. Ohkubo, K. Takase, and Y. Takano, J. Alloys Compd. 460, 668 (2008).
- Manríquez et al. (2000) V. Manríquez, P. Barahona, and O. Peña, Mater. Res. Bull. 35, 1889 (2000).
- He et al. (2003) Y. He, Y. D. Dai, H. Huang, J. Lin, and Y. Hsia, J. Alloys Compd. 359, 41 (2003).
- Takano et al. (2003) Y. Takano, A. Arai, Y. Takahashi, K. Takase, and K. Sekizawa, J. Appl. Phys. 93, 8197 (2003).
- Bhutani et al. (2020) A. Bhutani, J. L. Zuo, R. D. McAuliffe, C. R. dela Cruz, and D. P. Shoemaker, Phys. Rev. Mater. 4, 34411 (2020).
- Hewat (1986) A. W. Hewat, Mater. Sci. Forum 9, 69 (1986).
- Suard and Wildes (2019) E. Suard and A. R. Wildes, ILL, Refer to ILL experiment number EASY-541 (2019).
- Toby and Von Dreele (2013) B. Toby and R. B. Von Dreele, J. Appl. Crystallogr. 46, 544 (2013).
- Wildes et al. (2015) A. R. Wildes, V. Simonet, E. Ressouche, G. J. McIntyre, M. Avdeev, E. Suard, S. A. J. Kimber, D. Lançon, G. Pepe, B. Moubaraki, and T. J. Hicks, Phys. Rev. B 92, 224408 (2015).
- Stewart et al. (2009) J. R. Stewart, P. P. Deen, K. H. Andersen, H. Schober, J.-F. Barthélémy, J. M. Hillier, A. P. Murani, T. Hayes, and B. Lindenau, J. Appl. Crystallogr. 42, 69 (2009).
- Wildes et al. (2019) A. R. Wildes, M. J. Coak, J. N. Graham, and S. S. Saxena, ILL, https://doi.ill.fr/10.5291/ILL-DATA.5-32-870 (2019).
- Schweika (2010) W. Schweika, Journal of Physics: Conference Series 211, 012026 (2010).
- Rodriguez-Carvajal (1993) J. Rodriguez-Carvajal, Physica B. 192 (1993).
- Paddison and Goodwin (2012) J. A. M. Paddison and A. L. Goodwin, Phys. Rev. Lett. 108, 017204 (2012).
- Paddison et al. (2013) J. A. M. Paddison, J. R. Stewart, and A. L. Goodwin, J. Phys. Condens. 25, 454220 (2013).
- Paddison (2019) J. A. M. Paddison, Acta Cryst. A 75, 14 (2019).
- Bain and Berry (2008) G. A. Bain and J. F. Berry, J. Chem. Educ. 85, 532 (2008).
- Brown (1979) P. J. Brown, Electron and Magnetisation Densities in Molecules and Crystals (Plenum Press N. Y., 1979) Chap. Magnetic Neutron Scattering.
- Wildes et al. (2012) A. R. Wildes, K. C. Rule, R. I. Bewley, M. Enderle, and T. J. Hicks, J. Phys.: Condens. Matter 24, 416004 (2012).
- Goossens et al. (2000) D. J. Goossens, A. J. Studer, S. J. Kennedy, and T. J. Hicks, J. Phys. Condens. Matter 12, 4233 (2000).
- Rule et al. (2002) K. C. Rule, S. J. Kennedy, D. J. Goossens, A. M. Mulders, and T. J. Hicks, Appl. Phys. A 74, s811 (2002).
- Rule et al. (2003) K. C. Rule, T. Ersez, S. J. Kennedy, and T. J. Hicks, Physica B Condens. Matter 335, 6 (2003).
- Wildes et al. (1994) A. R. Wildes, S. J. Kennedy, and T. J. Hicks, J. Phys. Condens. Matter 6, L335 (1994).