| Desorption energy of soft particles from a fluid interface† | |
| Hadi Mehrabian,a,b,e Jacco H. Snoeijerb,a and Jens Harting ∗c,d,a | |
| The efficiency of soft particles to stabilize emulsions is examined by measuring their desorption free energy, i.e., the mechanical work required to detach the particle from a fluid interface. Here, we consider rubber-like elastic as well as microgel particles, using coarse-grained molecular dynamics simulations. The energy of desorption is computed for two and three-dimensional configurations by means of the mean thermodynamic integration method. It is shown that the softness affects the particle-interface binding in two opposing directions as compared to rigid particles. On the one hand, a soft particle spreads at the interface and thereby removes a larger unfavorable liquid-liquid contact area compared to rigid particles. On the other hand, softness provides the particle with an additional degree of freedom to get reshaped instead of deforming the interface, resulting in a smaller restoring force during the detachment. It is shown that the first effect prevails so that a soft spherical particle attaches to the fluid interface more strongly than rigid spheres. Finally, we consider microgel particles both in the swollen and in the collapsed state. Surprisingly, we find that the latter has a larger binding energy. All results are rationalised using thermodynamic arguments and thereby offer detailed insights into the desorption energy of soft particles from fluid interfaces. |
b Physics of Fluids Group and J. M. Burgers Centre for Fluid Dynamics, University of Twente, P.O. Box 217, 7500 AE Enschede, The Netherlands
c Helmholtz-Institute Erlangen-Nürnberg for Renewable Energy, Forschungszentrum Jülich, Fürther Str. 248, 90429 Nuremberg, Germany
d Department of Chemical and Biological Engineering and Department of Physics, Friedrich-Alexander-Universität Erlangen-Nürnberg, Fürther Straße 248, 90429 Nürnberg, Germany
e Chemical Engineering Department, Massachusetts Institute of Technology, Cambridge, MA 02139, USA
1 Introduction
Emulsions are common in food, pharmaceutical and cosmetics products. In order to assure their stability and to prevent the separation of the constituting fluid species, they are often stabilized by adding surfactants. An attractive alternative to the potentially hazardous surfactants is to add rigid particles to the emulsion 1, 2, producing so-called Pickering emulsions 3, 4. Pickering emulsions have few advantages over surfactant stabilized emulsions: the adsorption of the particles to the interface is nearly irreversible and they can be made stimulus-responsive by tuning the particle-interface binding 5, 6. Instead of rigid particles, one could think of soft particles as an alternative for producing Pickering emulsions. Soft particles, as their name implies, stretch out at the interface and reduce the unfavorable liquid-liquid contact more efficiently than their rigid counterparts. It is claimed that the softness of a particle increases the stability of the emulsion 7, 8, while others observed that softness does not play a major role in stabilizing them 9.
One aspect of soft particles is their elasticity, allowing them to deform in their adsorbed state. However, in practice one uses microgels that consist of an entangled polymeric network into which the solvent molecules can penetrate 10, 11, 12, 13. This process can be tuned such that a collapse-to-swollen transition takes place when changing e.g. the temperature or the pH value of the solvent. This makes some of them such as pNIPAM microgels stimulus responsive, and hence an attractive option for tunable, reversible stabilization of emulsions. Microgel particles in the collapsed state behave similar to a generic elastic, rubber-like particle. In the swollen state, however, their hydrodynamic diameter increases by 2-3 times, their deformability increases 14, and their surface properties change.
It has been observed that the swollen to collapsed transition destabilizes emulsions 7, although the underlying mechanism for this behavior is not fully understood.
The objective of this paper is to investigate the attachment strength between a soft particle and a fluid interface, to assess the effectiveness of soft particles as an emulsifier for Pickering emulsions. This is obviously a key feature for the stability of Pickering emulsions, but the particle-interface binding strength has so far not been addressed to the best of our knowledge: a stronger binding suggests that particles cover the interface more effectively, and they prefer to remain at the interface under external fluctuations such as shear or compression forces. The most common way to assess the binding between a particle and a fluid interface is to measure the energy required to detach the particle from the interface, the so-called desorption energy 15, 16, 17. The simplest way to estimate the binding strength is based on the additional surface energy created by replacing the particle with the fluid interface. For a rigid particle this gives 18
| (1) |
where , , and , respectively, are the surface tension of the fluid interface, the radius of the particle and the particle-interface contact angle. Using a similar surface area based argument, the desorption energy of soft particles is calculated by quantifying their shape at the interface 19. However, this approach does not account for the intermediate steps of the desorption process during which the interface and particle get deformed, producing extra interfacial area – providing an additional barrier for the desorption. This could make the desorption energy significantly larger 20. In this study, we use computational modeling to characterize the desorption of soft particles from a liquid-liquid interface. There are few challenges in modeling the desorption of soft particles which makes most macroscopic computational modeling techniques inefficient. First, this problem involves contact line dynamics which is a stress singularity for continuum modeling methods and different remedies have been developed to address this issue such as Cahn-Hilliard diffuse interface method (see e.g. 21, 22, 23). Second, it is nearly impossible to capture the molecular scale dynamics of microgel particles such as adsorption and solvation of their polymer chains using any continuum modeling technique. Therefore, a reasonable modelling approach to study the desorption of soft particles is to use coarse grained molecular dynamics simulations which can incorporate molecular details of the particle and the same time capture the macroscopic behaviour. Within the framework of molecular dynamics simulations, we rely on free energy calculation methods to measure the desorption free energy. There are two major routes to determine the change in free energy in molecular mechanics. One approach uses the free energy perturbation method to create alchemical transformations (see e.g. 24, 25), while another one constructs the free energy profile along a geometrical reaction coordinate using methods such as thermodynamic integration or umbrella sampling 26, 27, 28. In this study, we use the thermodynamic integration method to compute the free energy of binding. We construct the force-distance profile by moving particle away from the interface in a quasi-static fashion as is illustrated in Fig. 1. The upper and lower rows, respectively, correspond to collapsed and swollen particles, pulled from a liquid-liquid interface. Figure 1(a) shows the adsorbed state at equilibrium, while Fig. 1(b-d) reveal the intricate deformations during quasi-static intermediate states of the desorption. From these simulations, one can reconstruct the force-distance relation and subsequently the detachment energy is obtained as the mechanical work done by this force 29, measured by integrating the force acting on the particle during its removal from the interface.
In reality, the detachment of a particle from an interface can happen under different scenarios. For example, the particle can be detached from a flat interface 17, 30 or a curved one 20, 31, gravity can impose a length scale on the shape of the interface during the desorption 32, or the presence of other particles can affect the way the interface gets deformed 33. In addition, the particle-to-interface size ratio is important especially for conventional emulsions which contain a range of droplet sizes 20. Therefore, it is challenging to provide a general quantitative theory for the desorption energy, in particular when particles are deformable. The current study serves as a first step to investigate the attachment between a soft particle and a fluid interface, and we therefore restrict ourselves to the simplest possible scenario. Namely, we ignore the impact of gravity which is a reasonable assumption for emulsions stabilized by particles with sizes in the range of tens of nanometres to few micrometres. Additionally, we consider the detachment of a particle from a flat interface while the liquid always wets the bottom of the container, and we ignore dynamic (non-equilibrium) effects by moving the particle away from the interface quasi-statically.
The behavior of microgel particles at the interface, including their swelling/deswelling 34, the effect of compression rate on the surface adsorption 35, their shape 36 etc. has been studied in the past. However, to the best of our knowledge, none of the previous authors have studied the desorption energy of microgel particles. Style et al. 19 used analytical arguments to measure the desorption energy for an elastic particle, but they admit that such arguments fail for microgel particles, which involves nonlinear dynamics. More recently, molecular dynamics have been used to model nanogels, and the role of interfacial properties and cross-linking density is emphasized 37.
The present study is based on molecular dynamics simulations, as it enables to capture the internal polymeric structure of microgel particles. However, this method is computationally costly, and the size of the simulation box should be chosen judiciously. Most of the results are obtained for cylindrical particles in a quasi two-dimensional setup, to alleviate the computational cost. Previous molecular dynamics studies have indeed successfully captured the equilibrium of wetting and adsorption of deformable particles with liquid and solid surfaces 38, 39, 40, 41, 42. For the desorption, however, the particles need to be pulled from the interface. Here we measure the desorption energy using the thermodynamic integration method 43, which is commonly used for similar problems 44, 45, 46. The particle is moved away from a flat interface by applying an external force to its center of mass. We define the particle as a single entity in the GROMACS software, and the external force acting on each bead of the particle is proportional to its mass fraction. After each translational step, the position of the center of mass of the particle is restrained by a spring, and the equilibrium force exerted by the interface on the particle is gathered.
The remainder of the paper is organized as follows. First, we introduce the problem setup and the key features of the computational method. Then, we derive the force-distance relationship for the desorption of a rigid cylindrical particle using the continuum formulation, which serves as a benchmark for our molecular dynamics simulations. Subsequently, we explore the role of softness on the desorption of elastic cylindrical particles in their collapsed state. Next, we study the desorption of elastic spherical particles in a more realistic three-dimensional configuration, and finally, we discuss the role of the swollen to collapse transition on the desorption energy of microgel particles before we conclude the paper.
2 Problem setup and governing parameters
In this section, we describe the problem setup and discuss the details of molecular dynamics simulations and free-energy calculations.
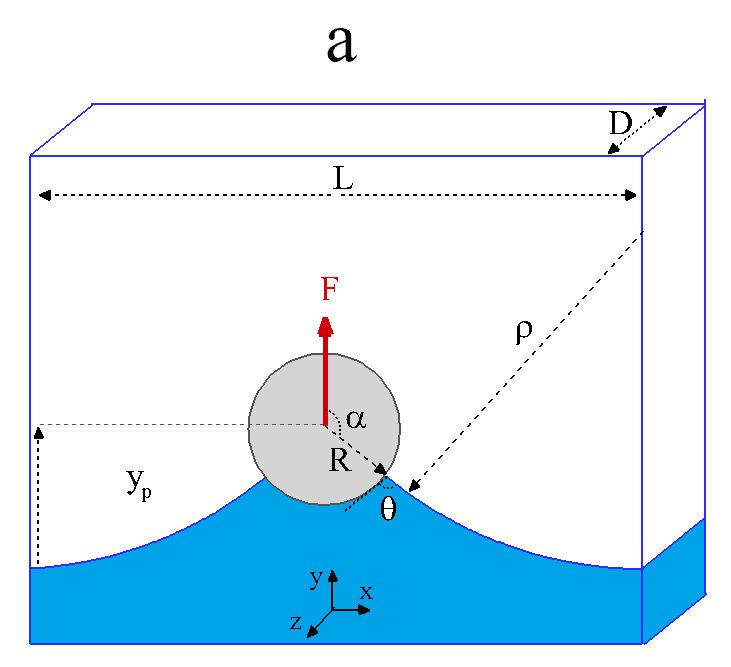
We study the detachment of soft cylindrical and spherical particles from a planar fluid interface in two and three-dimensional settings, respectively. The two-dimensional configuration corresponding to the cylindrical particle is illustrated in Fig. 2(a), in which there are periodic boundary conditions in the and directions. The top and bottom boundaries are walls to prevent the movement of the system’s center of mass in the y-direction. The two liquid phases have the same density, and the lower and upper liquids always wets the bottom, and top of the container, respectively.
In this study, we primarily focus on generic incompressible elastic particles without swelling. For such particles, the problem can be described by seven dimensional quantities. The radius of the particle, , the length of the liquid bath , the width of the liquid bath (Fig. 2(a)), Young’s elasticity modulus of the soft particle, , surface tension of the bath, , and the surface tension between the particle and upper and lower liquid phases, , and , respectively. This will give five dimensionless groups. At large deformations or when swelling of the particles becomes relevant, additional information on the molecular level is required resulting in nonlinear constitutive relations for the macroscopic parameters.
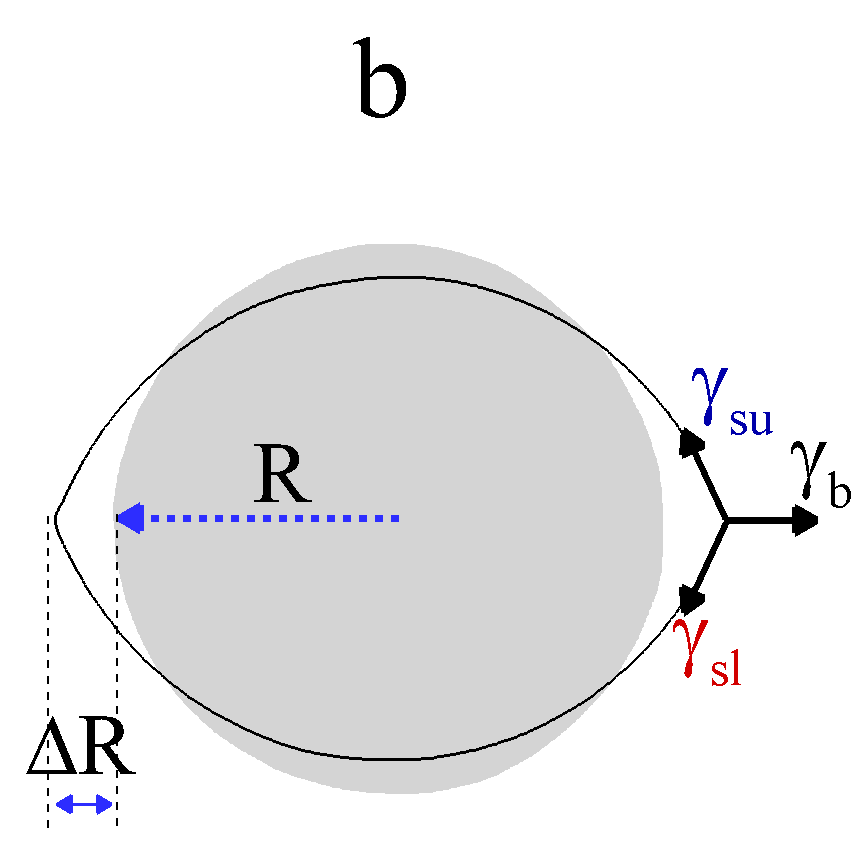
The geometry of the problem is described by two ratios, and , which will be kept fixed during this study. For the two-dimensional configuration, we use and . For the three-dimensional configuration , while the dimensional radius of the particle is . The properties of the particle and of the fluid can be described using three dimensionless parameters to describe the problem: two softness parameters, and , and the wettability indicated by the contact angle . The values of and can be seen as the elastocapillary lengths and , normalised by the particle size. The wetting contrast is quantified by the definition of the Young’s angle on rigid surfaces, i.e. . This makes it possible to compare rigid and soft particles. All particles in this study are up-down symmetric except those discussed in Sec. 5.3. For the symmetric cases, , simply denoted as , for which and .
The deformation of the soft particles plays a central role in the current problem, and has been analysed in detail in our previous work for the case without external forcing42. It was found that the deformation of a soft cylinder at an interface with symmetric wetting, quantified by in Fig. 2(b), is indeed a function of the elastocapillary numbers and . The deformation is zero for rigid particles () and saturates to a maximum extension as the particle gets softer (). The exact relationship between the governing parameters and the deformation is not trivial, but has been characterized in our previous paper42.
3 Molecular dynamics simulations
Molecular dynamics simulations are carried out in single precision using the GROMACS 5 package 47, 48. All restraints were enforced using the GROMACS pull code, and visualizations are done using the VMD package 49. The two liquid phases consist of beads with Lennard-Jones interactions. The soft particle is constructed by crosslinking polymer chains, comprised of bonded beads which interact through Lennard-Jones interactions with the liquid phases. We use the term “beads" to refer to the “coarse-grained particles" in our molecular dynamics simulations in order to avoid the confusion with the soft particle that is in the focus of this study. The full details of the molecular dynamics simulations are presented in our recent paper 42. Therefore, here we describe only the main features of the simulations.
To keep the model simple, we use the modified shifted and truncated Lennard-Jones potential 50 for the interaction between each pair of beads
| (2) |
where is the distance between two beads, is the repulsive core diameter fixed to nm, is the depth of the potential minimum set to 3 kJ/mol, and is the the cut-off radius which is equal to for the two-dimensional configuration and for three-dimensional simulations. We choose a smaller cut-off radius for the three-dimensional setup in order to reduce the computational cost. The parameter is used to separate two liquid phases, and to control the strength of the surface tension between different phases. The soft particle is made from the interconnected polymer chains as mentioned above. Each chain is constructed using a coarse-grained representation of beads and springs and consists of 32 monomers where two neighboring beads interact via the following potential:
| (3) |
The first term on the right-hand side is the so-called FENE (finite extensible nonlinear elastic) potential and controls the amount of the extension. The second term is the Lennard-Jones repulsion term that accounts for the reduced volume effect and prevents the collapse of the beads onto each other. We fix and to be able to choose a larger timescale while keeping the FENE links unbreakable 51. The rigidity of the soft particle is controlled by changing the density of the cross-linking between the chains, and the surface properties are controlled by changing the Lennard-Jones interactions.
For all particles in this study, except swollen microgel particles, the bead size is not important as long as it is small compared to the particle length scale. Here, the particle size is around 14 nm, which means that it is around 40 times larger than the bead size. Also, we showed that we could reproduce the macroscopic behavior, which verifies that our choice of length scale is appropriate. Finally, and most importantly, all results are made dimensionless using macroscopic observables such surface tension, elastic modulus, and R in order to highlight the general validity of our results. For particles with chain solvation, the solvent/particle, and solvent/solvent bead size could be important. The solvent/particle bead size ratio is smaller than one for most experimental conditions. In this study, we chose the limiting case of the solvent/particle bead size ratio = 1. Also, we used the smallest length scale, which corresponds to the water molecules. Therefore, a particle with a larger bead size would be automatically covered. In addition, in all studied cases, we chose a particle which only wets one phase; we did not try to target a specific two-phase system in which both phases solvate the particle, and hence the solvent/solvent bead size ratio is not important in this study.
To calculate the force-distance relationship for the desorption of the particle, we gradually detach the particle from the interface. Particle transfer from the interface to the liquid bulk is done using constrained molecular dynamics simulations. The particle’s center of mass , initially located at the interface, , is the collective variable in this study and is translated very slowly along the reaction coordinate, which is the direction normal to the interface, i.e., the y-direction here. The translation happens quasi-statically, since the reaction coordinate is divided into smaller steps whose length is approximately where is the radius of the particle. After each translational stage, there is an equilibration run of 20 to 30 nanoseconds during which the particle’s center of mass is restrained in space with an umbrella potential, and the average force acting on the particle, , and the average location are collected. The timestep of MD simulations is 0.006 picoseconds in these calculations. Then, the force-distance curve is constructed, and if necessary, more points are added to refine all areas properly. This process is repeated until the particle gets detached from the interface and hence, the force exerted on the particle by the interface becomes zero. The free-energy difference between any two points during this transfer process can be easily calculated as
| (4) |
where is the work done on the particle to move it to a distance away from the interface, is the initial distance of the particle’s center of mass from the interface, and is the ensemble averaged force in the y-direction acting on the particle at a distance from the interface. Note, that due to the symmetry, the x and z components of the force are zero. The displacement of the particle, , is the distance between the particle’s center of mass and the flat part of the interface at , and it is made dimensionless with the particle radius.
4 Rigid particles & benchmarking
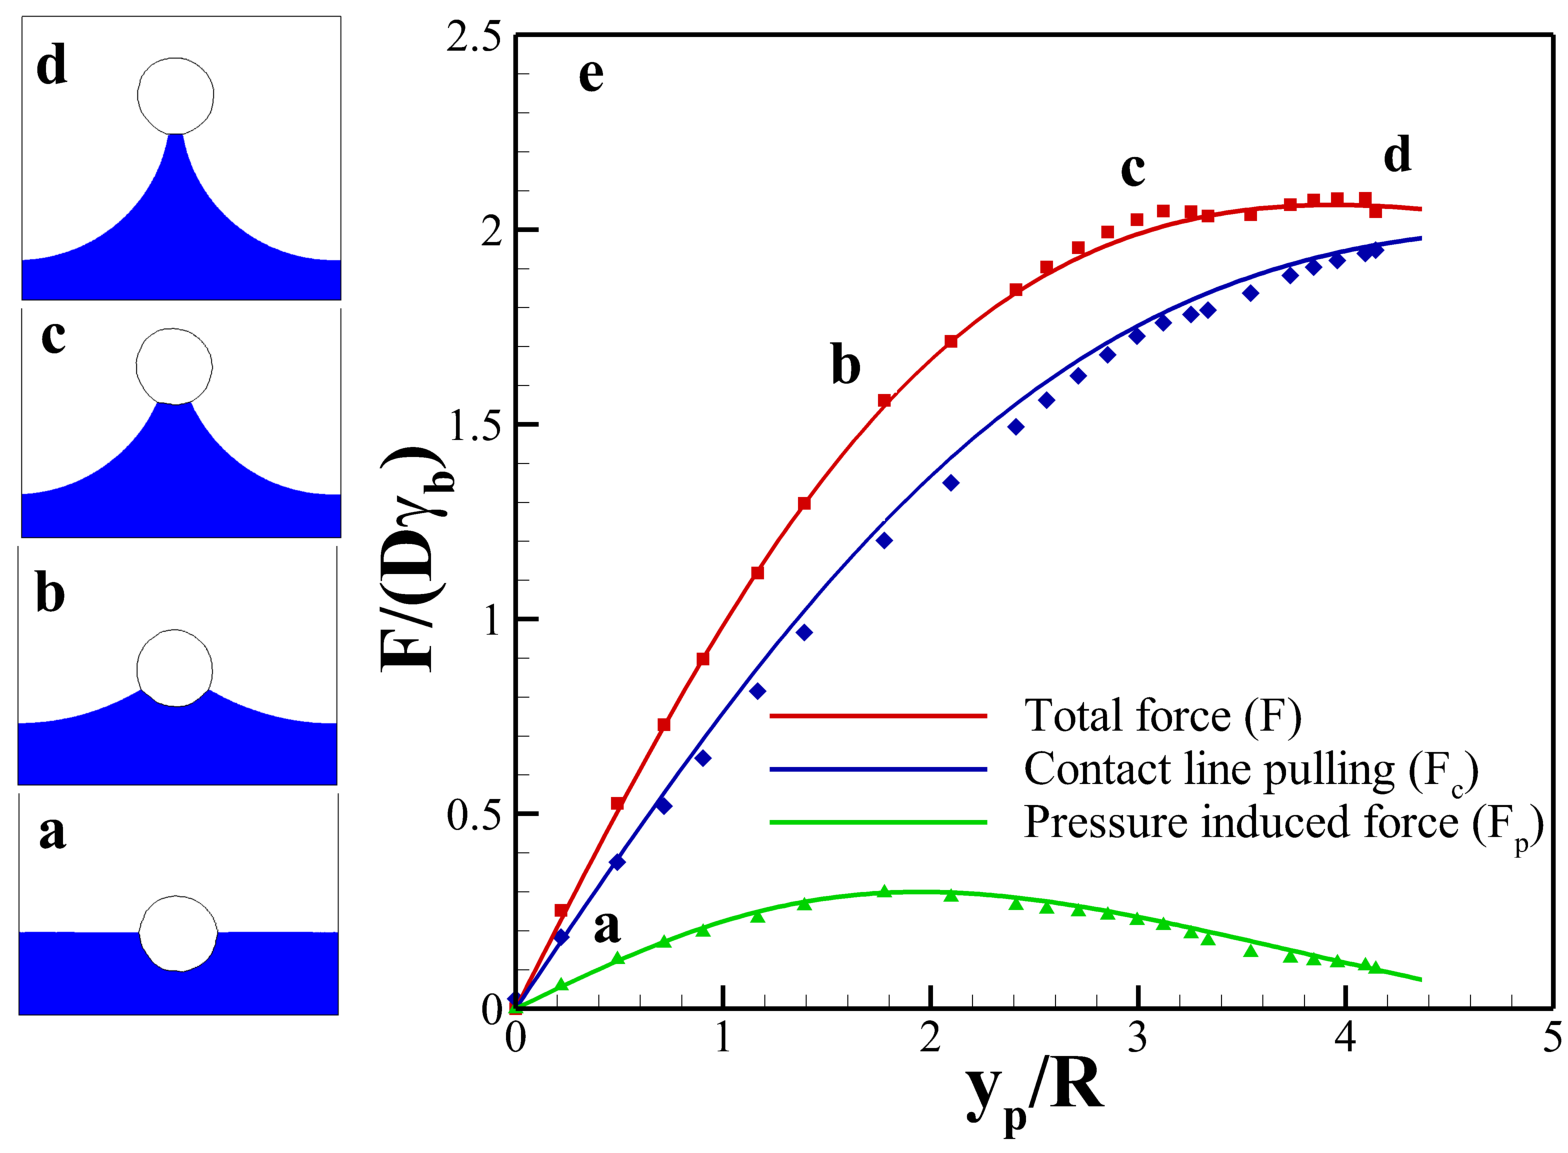
We consider a rigid cylinder with radius and contact angle , initially placed symmetrically at the fluid interface as is illustrated in Fig. 3(a). To generate a rigid particle in the molecular dynamics simulations, the density of cross-linking between the polymer chains is increased to 12 . As is depicted in snapshots (b) to (d) in Fig. 3, the particle is pulled up quasi-statically until it gets detached from the fluid interface. Data points in Fig. 3(e) show the average force and distance calculated using the molecular dynamics simulations.
In the absence of gravity and buoyancy forces, the only restoring force acting on the particle is the force created by the fluid interface, which acts on the particle in two ways. First, as the particle moves up, the bath interface becomes more curved whose radius of curvature, , produces a negative capillary pressure below the particle, pulling it down. This component of the force is negligible for macroscopic particles due to the comparatively small curvature of the fluid interface. However, for nanoparticles, it has a considerable effect on the overall force and should be included in the analysis. We call it the pressure force, , as it is obtained by integrating the pressure around the particle. Second, the liquid interface pulls the particle down along its contact lines with the particle which we call the contact line force and denote it by , hereafter. The total restoring force acting on the particle is equal to
| (5) |
where is the angle between the interface and the y-axis as depicted in Fig. 2. The negative sign is due to the downward direction of the force. We remind the reader that is the depth of the quasi-two-dimensional setting so that is the force per unit length. In the remainder we will therefore use to make the force dimensionless. The radius of curvature for the liquid interface, , is equal to
| (6) |
The final step is to convert equation 5 into a force-distance relationship. For this, one needs to calculate the distance between the center of mass of the particle and the interface, , in terms of :
| (7) |
Using equations 5-7, the force-distance relationship is theoretically calculated for the rigid particle and is compared to the force measured from the molecular dynamics simulation in Fig. 3(e). The excellent agreement between the continuum theory and MD simulations in Fig. 3(e) indicates that the discrete molecular dynamics simulations produce meaningful results to describe the behavior of the particle-interface interaction on the continuum level.
Fig. 3(e) shows that as the particle moves up, the force exerted on it by the interface almost linearly increases until . Then, it starts to saturate until it reaches the final maximum of 2. This value is expected since the angle between the interface and the y-axis, , goes to during the movement of the particle. Inserting and in Eq. 5 results in the final force to be two times in negative y-direction.
By fitting a circular arc to the interface shape, and can be obtained from the MD simulations. The surface tension of the liquid-liquid and particle-liquid interfaces are measured in a separate setup with a flat interface, and similar interaction energies using the Kirkwood-Buff formula for a planar interface. This allows to compute the two components of the total force, i.e., , and . By comparing the two components of the force in Fig. 3, it can be concluded that the pressure force has a much smaller role in the total force due to the relatively large bath. Furthermore, the pressure force shows a non-monotonic behavior with : as the particle moves away from the interface the curvature of the bath interface increases which results in more negative capillary pressure below the particle. At the same time, the contact area between the particle and the lower liquid phase decreases ultimately leading to a which reaches a maximum and then decreases again.
5 Soft particles
We now turn to the desorption of soft particles. First, we study the desorption of a cylindrical elastic particle in the two-dimensional setup. We use a 2D setup, because computationally, it is one order of magnitude faster to simulate a 2D particle as compared to its 3D counterpart. Besides, the length of the contact line is fixed in the two-dimensional setup and this actually facilitates the physical interpretation. Next, we present the desorption profile of a spherical soft particle from a square fluid interface. Due to the high computational cost of these simulations, we limit ourselves to a small set in order to generalize the results from a two to the three-dimensional configuration. Finally, we present results for microgel particles (in 2D), in which the role of the transition from the swollen to the collapsed state on the binding between the particle and the interface is investigated.
5.1 Two dimensional setup
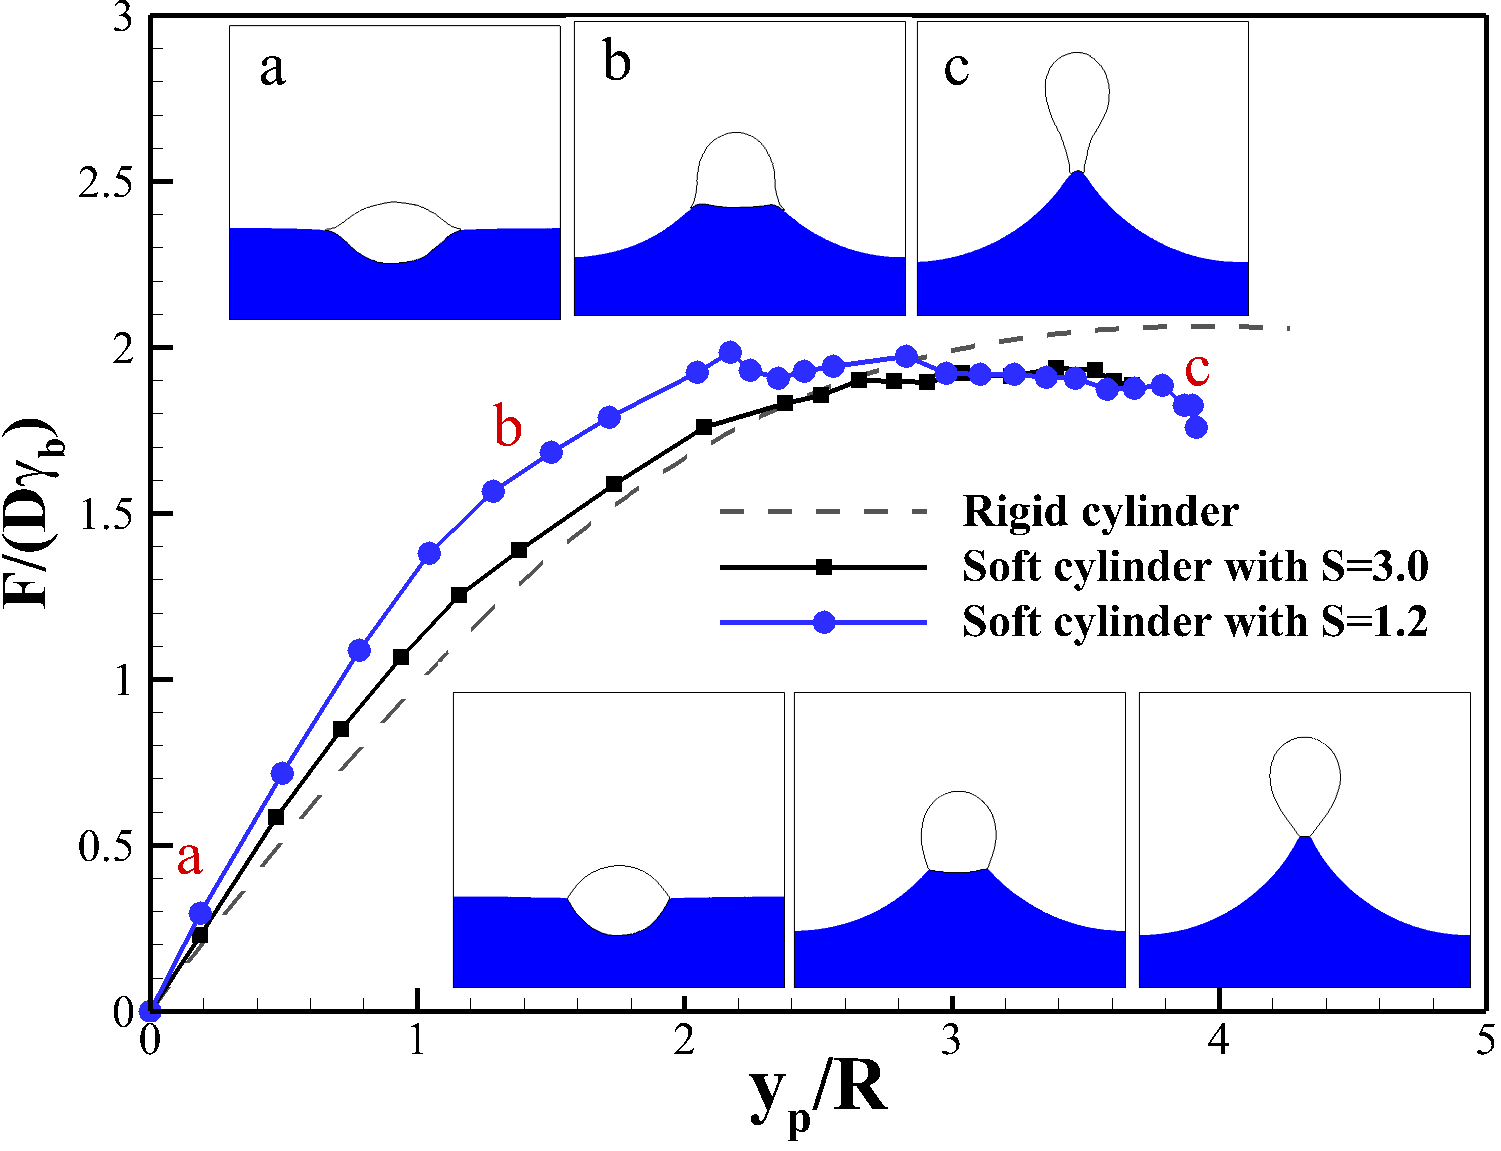
Figure 4 shows the desorption profiles for two cylindrical elastic particles. For both cases there is no wetting contrast between the particle and the two liquid phases () so both particles are initially top-down symmetric. In both cases the bath elastocapillary number is the same, namely , so that the forcing by the bath compared to their elastic modulus is identical. However, the particle elastocapillary numbers are different, respectively and . The latter has a larger solid-liquid surface tension and thereby more strongly opposes deformation. The leftmost snapshots of the insets in Fig. 4 show the equilibrium positions of the particles, prior to applying the force. The upper row of snapshots shows the more deformable particle () for which , while the lower row of snapshots shows the particle with a relatively high solid-liquid surface tension (), and hence, it has a smaller deformation . After reaching the equilibrium shape at the interface, particles are dragged up from the liquid interface quasi-statically, by imposing a series of displacement and equilibration steps, and the force-distance relationship is constructed. The result is shown in the main panel of Fig. 4, where each data point is obtained by averaging the constraint force over 25 nanoseconds of equilibration run.
As a reference case, the dashed line in Fig. 4 shows the force-distance relationship for a rigid cylindrical particle with the same size as the undeformed soft particle. Similar to rigid particles, the desorption profile for the soft cylindrical particles can be roughly divided into two stages. At first, the restoring force increases almost linearly – in this phase the softest particle leads to the steepest slope of the force-displacement curve. Hence, there is initially a larger restoring force for softer particles. At the final stage of desorption, the restoring force remains almost constant. A softer particle experiences a slightly weaker maximum restoring force from the interface as compared to a rigid particle at this stage. However, the soft particles detach at a shorter distance from the interface than the rigid particle. Interestingly, these two effects of softness, larger force and earlier detachment, affect the desorption energy in the opposite directions. Namely, the desorption energy is computed as the work done by the force, and thus follows from the integration of the force-distance curve. When evaluated quantitatively, the desorption energy is slightly smaller (less than 5%) for the soft particles.
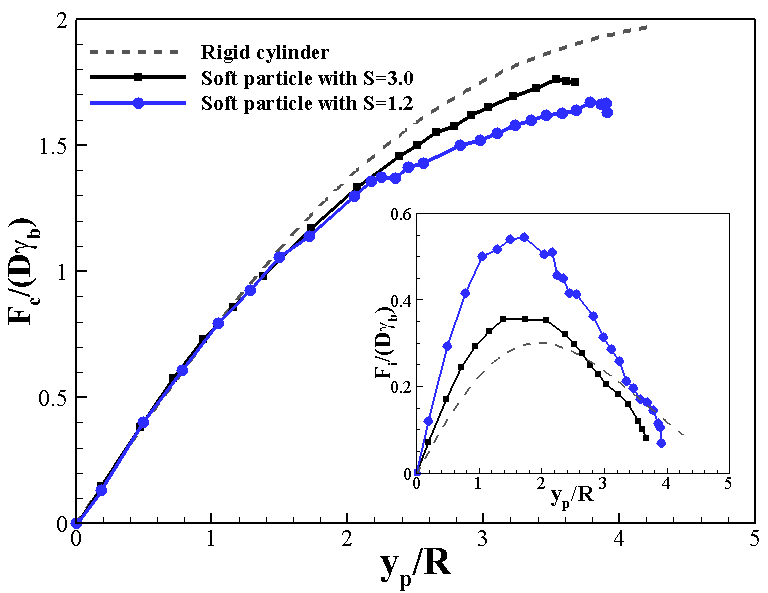
To understand the antagonistic roles of softness on the desorption energy of a cylindrical particle better, it is insightful to plot the two constituent forces acting on the particle, namely the pressure force and the contact line force . This is done in Fig. 5, in which the contact line force is plotted as the main curve and the pressure force is given as the inset. According to this figure, at the early stage of the desorption, the contact line force is the same for both particles. However, it is smaller for the soft particle at the later stage of the desorption. In contrast, the pressure force, , is larger for the softer particles. The combination of these two behaviors results in the minor impact of softness on the total desorption energy, as mentioned above.
These results can be rationalised as follows. In the early stage of the desorption, the force exerted by the interface on the particle is mainly parallel to the interface, i.e., it is horizontal, and thus deforms the particle mainly in the x-direction. Therefore, the pressure force which is proportional to the particle-interface contact area, i.e., , is larger for the soft particle. However, the force acting on the particle in the y-direction is small, disabling it to considerably deform the soft particle normal to the interface. Therefore, the shape of the particle in the y-direction is similar to the one of rigid particles.
As the particle moves up, the interface bends upward, and the angle increases, rendering the vertical component of the interfacial force larger. Unlike the early stage, the normal restoring force is sufficiently large to deform the particle now. Therefore, rather than deforming the interface, it is the soft particle that gets elongated in the y-direction. This hinders the increase of the angle and hence reduces the contact line force as compared to the rigid particle. Recall that is the angle between the line tangent to the interface and the y-axis at the interface-particle contact point.
Changing the softness has no impact on the contact line force at the early stage of the desorption. Instead, the increase in the overall restoring force for soft particles in this regime is due to their larger contact area with the interface. At the final stage of desorption, however, the opposite change in the two components of the force balance each other resulting in an almost constant force during the particle movement.
It would be of interest to generalise the observed force-distance relationship to the case with a very large bath to particle size ratio: . Larger results in a larger radius of curvature for the interface and hence, smaller pressure force. Therefore, as the bath gets larger, the contribution of the pressure force to the total force becomes negligible. Hence, the force-distance relationship of the soft particle will essentially be due to the contact line force. We showed that the deformation of the particle normal to the interface decreases the contact line force. Although the extent of reduction will be different for larger , it is expected that an elastic cylindrical particle always feels a smaller restoring force from the interface as compared to the rigid particle.
A further observation that needs to be discussed is the distance at which the particle detaches from the interface. Unlike the rigid particle, a soft particle gets elongated under the restoring force and thus, the distance between its center of mass and the particle-interface contact line increases. This can be easily seen by comparing the last snapshots for the two soft particles in Fig. 4. However, a soft particle is being reshaped by the interface to keep the interface as flat as possible which requires the particle-interface contact points to move faster toward each other, resulting in early pinch-off of the particle. Therefore, the distance at which a soft particle detaches from the interface depends on the outcome of its horizontal and vertical deformation. In Fig. 4, the more elastic particle, the case with , detaches at larger than the particle with , while its contact point with the interface is closer to the interface.
5.2 Three dimensional setup
We now turn to the case of a soft spherical particle positioned at the center of the square-shaped flat fluid bath (), as illustrated by the upper row of snapshots in Fig. 1. The elastocapillary numbers for this system are , , and the contact angle is (symmetric wetting). In simulations we first place the soft particle at the interface and let it equilibrate for 30 nanoseconds, which results in the final lenticular shape with the deformation of . Then, we move the particle’s center of mass normal to the interface in a step-wise manner. At the same time we gather the restoring force incurred by the interface during 20-nanoseconds equilibration steps. Using the two-dimensional setup in section 5.1, we showed that the pressure force increases as the softness increases, almost proportional to the increase in the particle’s wetted area, while the contact line force decreases as the softness increases. Here, we analyze how these features change from a two-dimensional configuration to the three-dimensional one.
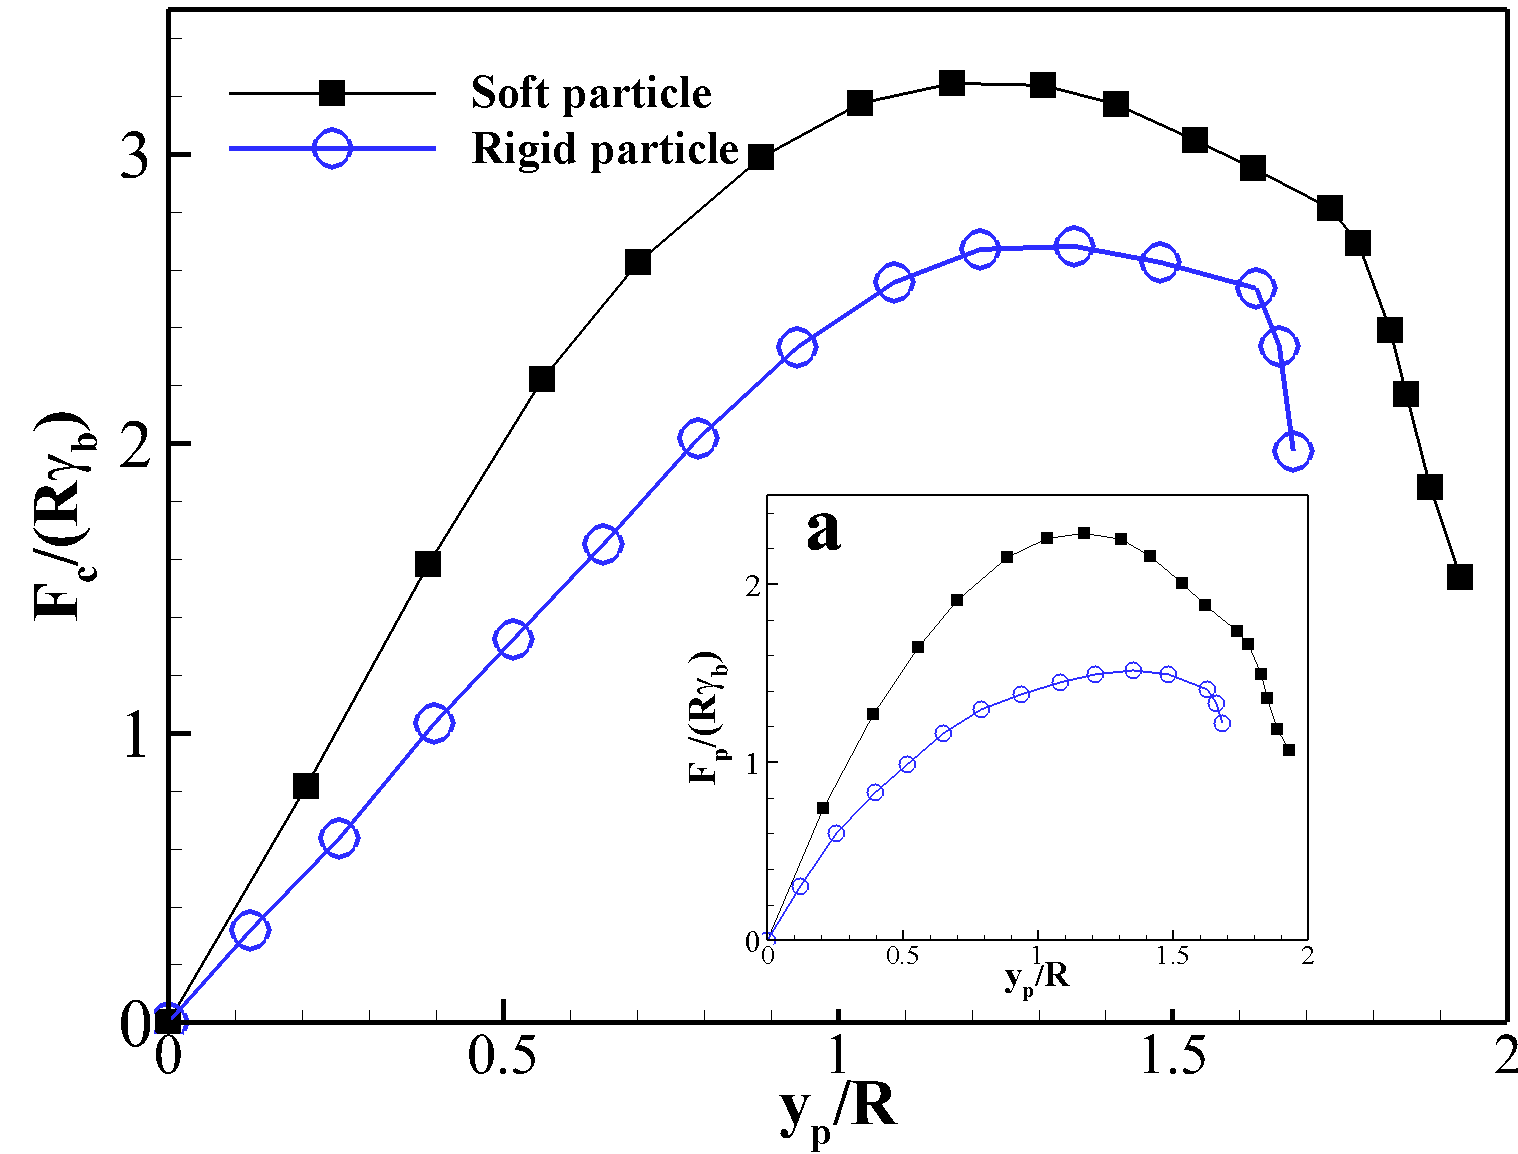
The two components of the force are plotted in Fig. 6. According to this figure, unlike the 2D particle, the contact line force , for a soft spherical particle is larger compared to a rigid one. The reason for this difference is that for the soft 2D particle, the length of the contact line remains fixed during the deformation, while for a soft spherical particle, the length of the contact line, which is proportional to , increases when compared to the rigid particle. Therefore, the softness does affect the contact line force in two opposite directions: the length of the contact line and hence the resultant force increases, while the contact line force per unit length decreases due to the deformability, similar to what happens to the soft cylinder. Hence, Fig. 6 reveals that the increase in the circumference of the contact line is more prominent than the decreases in the force per unit length.
We now argue that the increase of contact line length is always dominant, regardless of the particle to interface size ratio. For this, we assume that the maximum deformation of the particle in the y-direction is of the order of , similar to its deformation at the interface. Such an elongation decreases the vertical contact line force by reducing the the angle , which determines the y-component of the force according to Eqn. 5. Using a simple geometrical analysis, it can be shown that the decrease in the contact line force, is proportional to in which is the liquid bath size. However, the increase in the particle circumference, and hence the increase in the contact line force is proportional to . Since the liquid bath is generally larger than the particle, we thus conclude that a soft spherical particle always experiences a stronger contact line force as compared to the rigid particle. As such, in three dimensions, the softness leads to a stronger attachment to the interface.
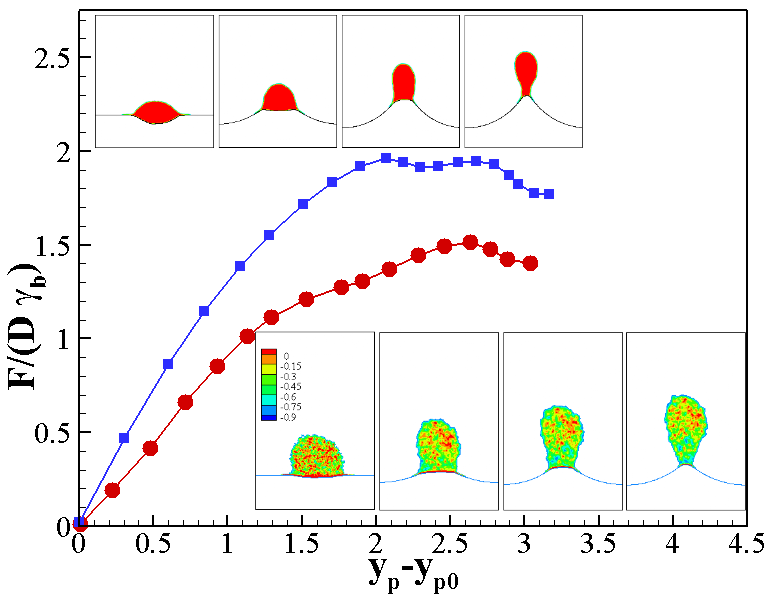
The pressure force is shown in the inset of Fig. 6, for both the soft and rigid spherical particle. The pressure force increases with the increase in particle-interface wetting area. For a soft spherical particle, the particle-interface contact area is approximately proportional to , while it was proportional to for a deformed cylinder. Therefore, it is expected that the soft particle experiences a larger increase due to its deformation at the interface. For the soft spherical particle in Fig.6, the deformation is , which results in an increase of the pressure force by about a factor two as compared to the rigid case. Since both force components and increase for a soft particle, the desorption energy turns out to be larger for soft particles relative to a rigid particle with the same volume. This is shown in Fig. 7, in which the work of detachment from Eq. 4 is plotted versus the particle’s center of mass distance from the interface.
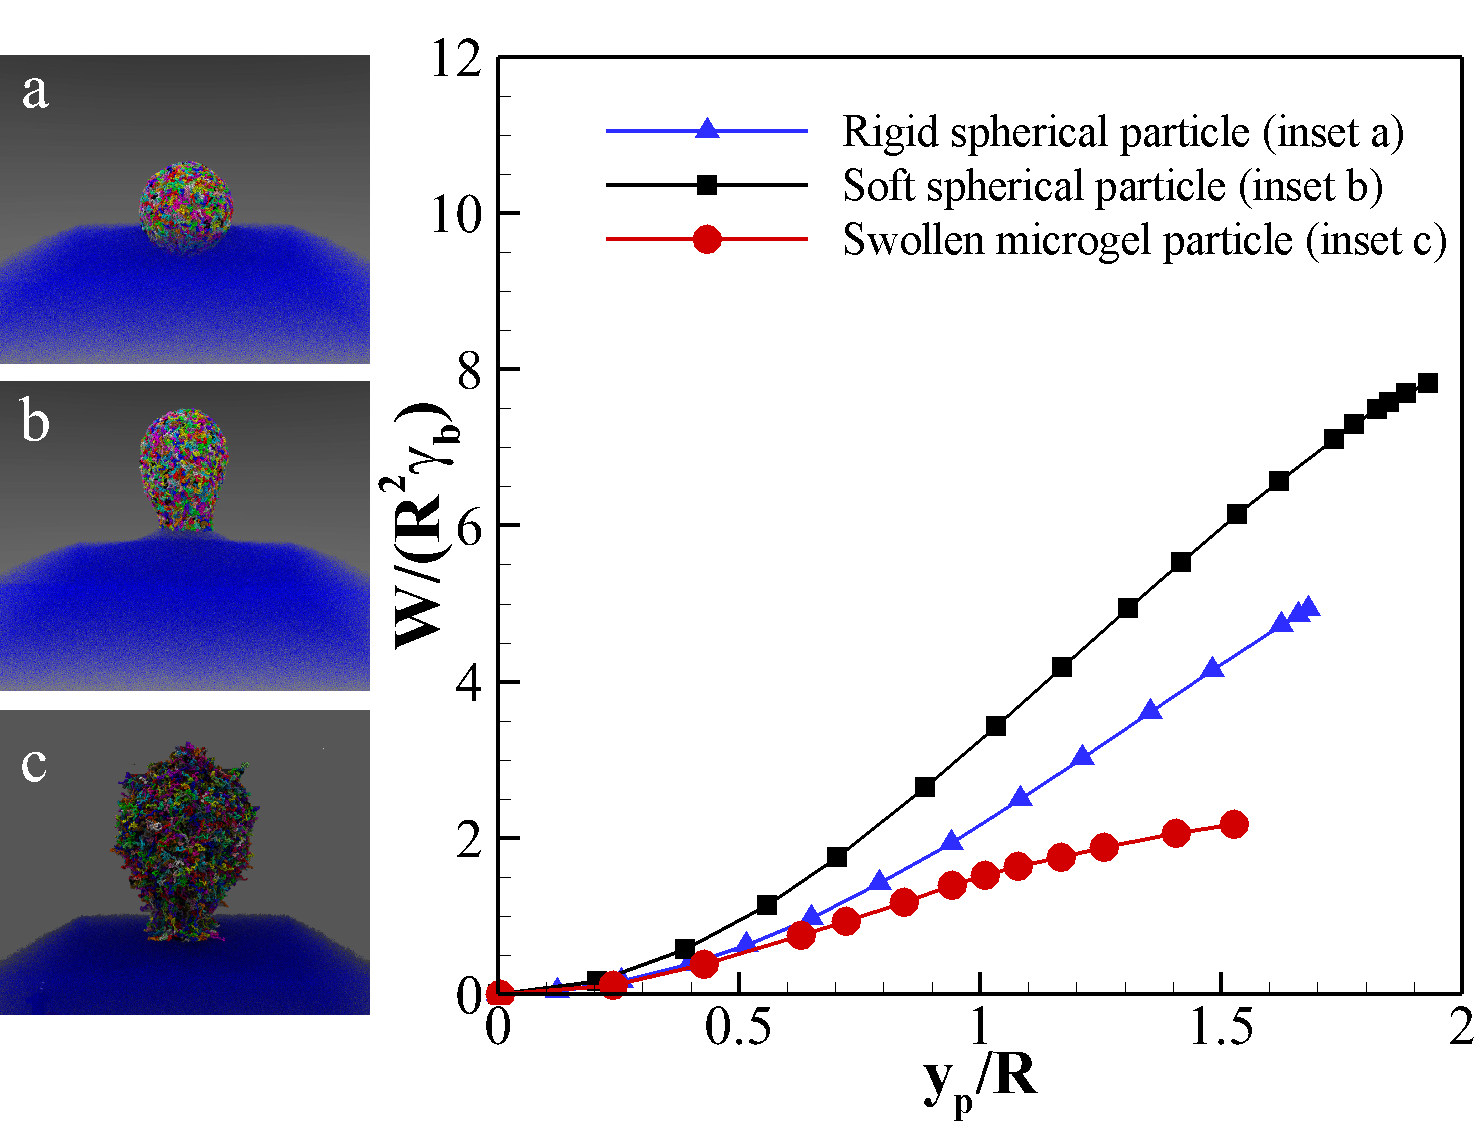
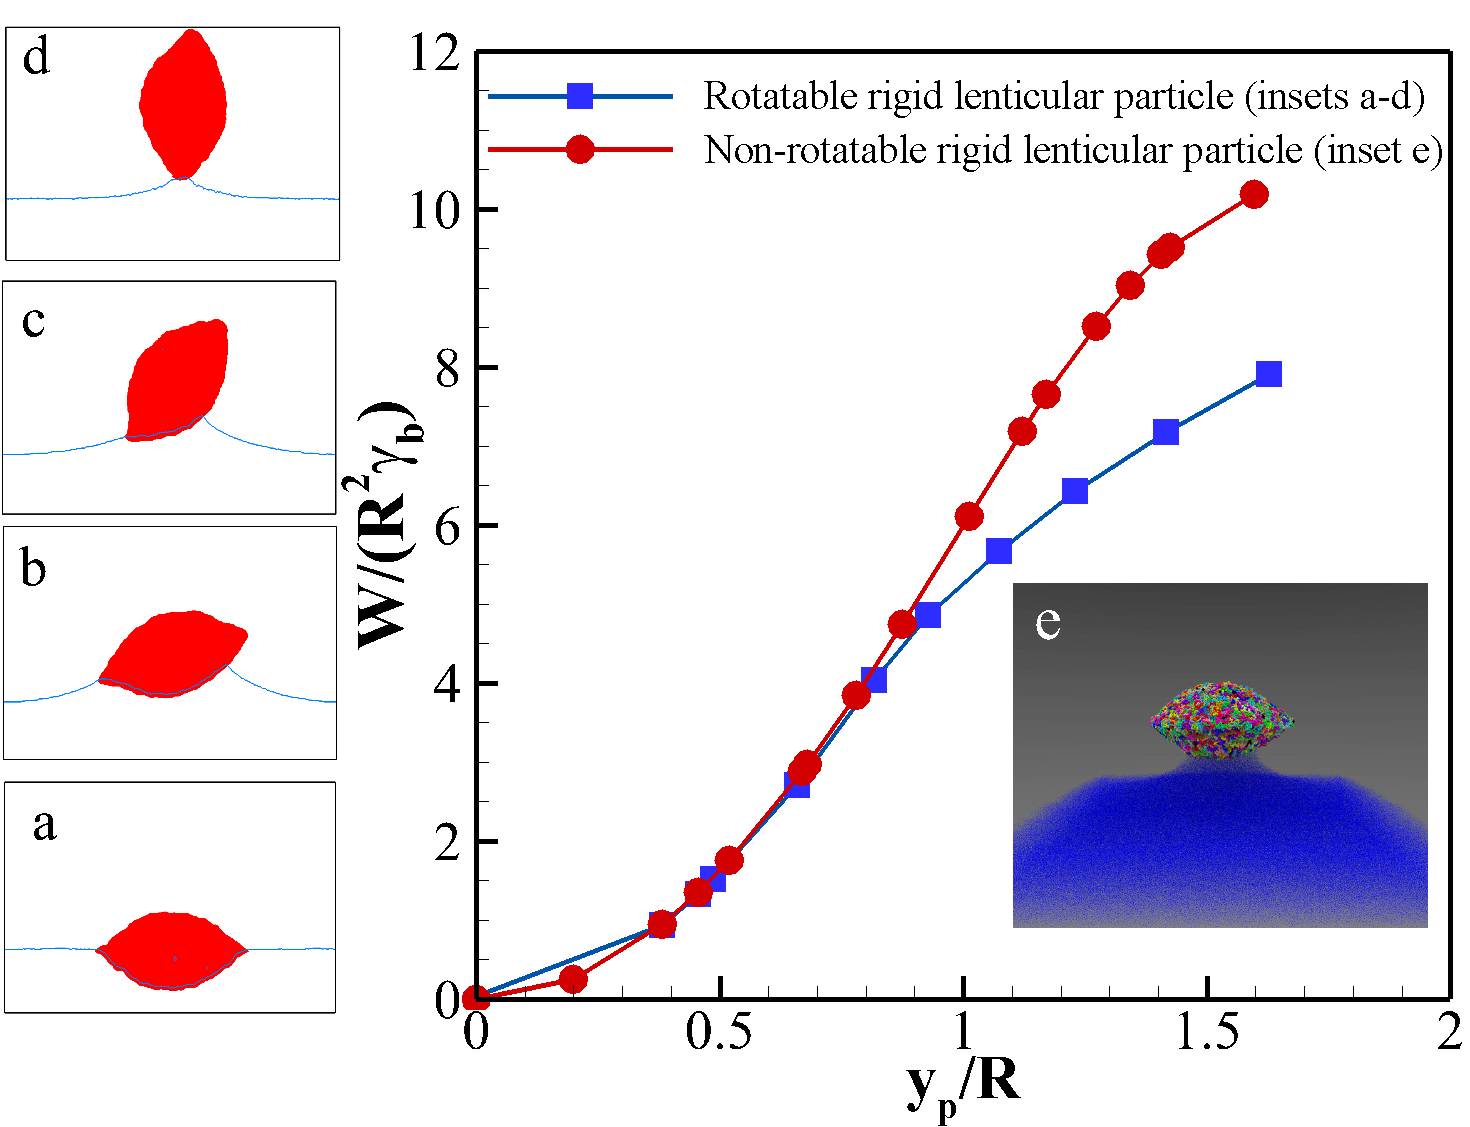
Although soft particles attach to the interface more strongly than their rigid counterparts, the antagonistic effect of softness reduces the expected increase in the desorption energy. Therefore, one could argue that a rigid lenticular particle with a shape similar to the deformed soft particle would result in higher desorption energy. To examine this point, we cross-link the deformed soft particle in Fig. 7, converting it into a rigid lenticular particle with the same shape as the deformed soft particle at the interface. Then, the desorption free energy profile is reconstructed for this particle under two detachment scenarios. In the first scenario, we pull the particle’s center of mass upward, similar to the other cases in this paper. The particle’s behaviour during the desorption is shown in Fig. 8, according to which the particle rotates during the desorption. This behaviour is in agreement with the observations for the desorption of non-spherical rigid particles 52. In the second scenario, we disable the rotational degree of freedom of the particle, i.e., it is pulled away from the interface while its main axis remains parallel to the interface. Desorption free energy profiles for these two cases are compared in Fig. 7. According to this figure, for the non-rotated particle, the detachment work is much higher than for the soft particle, which agrees with our prediction. However, the detachment work for the rotated particle is very close to the soft particle.
Due to the computational limitation, the bath size is relatively small in our simulations. It would be interesting to extend the results to cases with a very large fluid bath. Then, the pressure force would be negligible as compared to the contact line force and the contact line force determines the outcome. As we discussed earlier, the contact line force is always larger for the soft particle and therefore soft spherical particles have larger desorption energies as compared to rigid particles.
If we use the same ratio of the two-dimensional to create a three-dimensional setup, there are almost 25 times more beads in the system corresponding to a more than one order of magnitude higher computational cost. This is a demanding computation even for the largest available supercomputers. Therefore, it is required to adopt the simulation parameters in order to reduce the computational effort required for the simulations. To achieve this we chose a smaller box size of , and the cut-off radius is reduced to for three-dimensional simulations. With approximately 10 million beads in the simulated system, we perform about 600 nanoseconds of simulated time for each three-dimensional particle. On a modern GPU-based supercomputing cluster based on Intel(R) Xeon(R) CPU E5-2450 v2 2.50GHz CPUs and NVIDIA Tesla K40m GPUs, we are able to reach a performance of 1 nanosecond per hour. For this, our jobs run on 16 GPU nodes, where each GPU is supported by 24 physical CPU cores.
5.3 Microgel particles
Finally, we turn to microgel particles, which can exhibit different degrees of swelling based on the chemical properties of the system. For example, a unique feature of pNIPAM is that at a specific temperature, their structure transforms from a swollen to collapsed state and vice versa. This means that at a certain temperature polymer chains of the microgel particles becomes soluble in the solvent, and increase their volume. It is critical to understand the change in the particle properties between these two states. Motivated by the context of emulsion stabilization, we now consider the desorption energy of microgel particles for different degrees of swelling.
On the molecular scale, the swollen to collapsed transition happens due to a change in the intermolecular interactions between the solvent molecules and the polymer chains. On the macroscopic level, this transition results in a few differences. First, the size of the microgel particle increases in the swollen state; a swollen microgel particle has a hydrodynamic diameter which is usually 2 to 3 times larger than its diameter in the collapsed state 7, 53. Second, the swollen particle becomes more deformable because the same amount of crosslinking spreads over a larger volume. Third, the surface tension of the particle changes, and sometimes the change is so drastic that an initially non-wetting liquid phase can become a wetting phase 54.
In our molecular dynamics model, the physics of the problem is mimicked by changing the Lennard-Jones interactions between the polymer chains of the particle and the solvent molecules. For the soft particles studied in the previous sections, we increase the attraction between the polymer chains and the upper liquid phase to the extent that polymer chains become soluble in the upper liquid phase. As is shown in Fig. 9(a), the resulting microgel particle at equilibrium becomes asymmetric due to the asymmetric interactions. In Fig. 9, from left to right, we decrease the attractive Lennard-Jones term between the beads of the polymer chains and the solvent molecules of the upper phase while keeping the surface tension of the particle with the lower phase, the surface tension of the bath, and the polymeric structure of the particle fixed. The corresponding parameters of Eqn. 2 which are used in these simulations are presented in table 1. The surface tension between the particle and the lower phase is 32.5 , the surface tension of the bath is 83.5 , and the density of the cross-linking for the particle immersed in the bulk of the nonwetting liquid is 0.8 . The radius of the microgel particle in the swollen state is 1.9 times larger than its radius in the collapsed state.
Fig. 9(a), shows a swollen microgel particle adsorbed to the fluid interface. Due to the strong attraction between its polymer chains and the solvent molecules of the upper phase, the polymer chains prefer to be covered by the solvent molecules of the upper phase, resulting in a swollen microgel particle. Also, it is energetically favorable to replace the liquid-liquid contact at the bath interface with a particle-liquid contact. Therefore, the swollen microgel particle gets adsorbed to the interface, producing the typical fried-egg like shape (core-corona shape) of microgel particles at a fluid interface55, 56, 8. Fig. 9(b) shows the same particle with a weaker solvent-polymer affinity. The surface tension of the particle with the upper phase is 7 . Here, there is a clear interface between the microgel particle and the solvent. The particle is not swollen, but its size at the interface is similar to the swollen case. Furthermore, the deformability of the particle and the pulling force of the interface creates an elongated particle whose size is comparable to the swollen case. It is interesting to compare the desorption energy of this particle to the one shown in Fig. 9(a) to reveal the role of the chain solvation on the particle-interface binding. Interestingly, the desorption free energy is almost two times larger for the particle in Fig. 9(b). This suggests that the solvation of the polymer chains of the microgel particle does not enhance its binding to the interface. The reason for this behavior can be better understood by comparing the desorption profile for two particles in Fig. 10. As the particle moves up, the swollen microgel deforms easily as compared to the collapsed one, the interface remains horizontal, and hence the contact line force in the y-direction becomes smaller for the swollen microgel particle. This is even more interesting if we consider the fact that the sizes of the particles in Fig. 9(a) and Fig. 9(b) are similar which means that the results can be easily generalized to three-dimensional particles. In fact, the force-distance relationship for the spherical swollen microgel particle shown in the second row of snapshots in Fig. 1 is presented in Fig. 7. According to this figure, the detachment work for the microgel particle is . This is much less than the detachment work of the rigid particle whose size is two times smaller than the swollen microgel. Of course, this comparison is not perfect because it is not possible to produce a rigid particle with the same surface properties as the swollen microgel particle. However, it is interesting to compare the desorption energy of a microgel particle with its polymer chains adsorbed to the interface to a rigid particle with the same mass.
| Between lower and upper liquid phases | 0.0 |
| Between lower phase and the particle | 0.80936 |
| Between upper phase and the particle of inset a | 0.94426 |
| Between upper phase and the particle of inset b | 0.89030 |
| Between upper phase and the particle of inset c | 0.80936 |
| Between upper phase and the particle of inset d | 0.48562 |
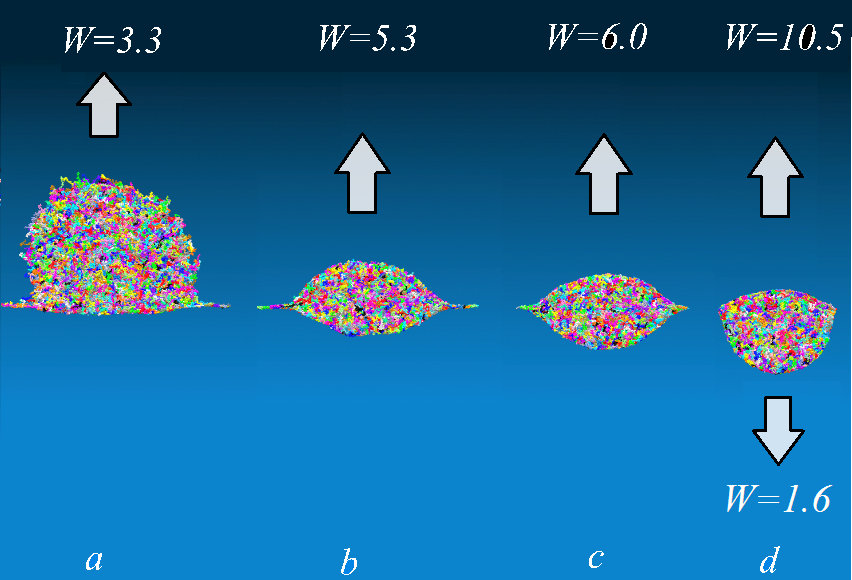
Fig. 9(c), shows a particle with a symmetric wetting. This case is important because a further decrease in the affinity between the polymer chains and the solvent molecules of the upper phase renders the desorption to the lower phase more favorable. The deformation for this particle is . Despite being less elongated than the swollen microgel in Fig. 9(a), its work of detachment is almost two times higher suggesting that the collapsed microgel attaches to the interface more strongly than the swollen microgel particle.
We can further decrease the attraction between the solvent molecules of the upper phase and the polymer chains of the particle to make the upper phase the non-wetting phase. Such a case is shown in Fig. 9(d), the surface tension between the particle and the upper phase is increased to which results in . We know that it is energetically favorable for the particle to move into the phase with which it has lower surface tension. Therefore, for the case in Fig. 9(d), the particle moves into the lower phase, which is the wetting phase for this particle. The measured work of detachment verifies this point; it is 10.5 for the desorption into the upper phase, as compared to 1.6 for the lower phase. In conclusion, the desorption energy for the swollen microgel is smaller than all other cases except for the case in which the direction of asymmetry gets reversed. This observation is consistent with experimental observations 54, 57. Therefore, the difference between the binding free energy of the microgel particle in the swollen and collapsed state depends on the change in the surface properties.
Experimentally, it is observed that microgels are better stabilizers for emulsions 7. One can think of two reasons for it. First, there is a stronger binding between a microgel particle and the fluid interface. Second, the particle-particle interactions at the interface get enhanced due to the entangled polymeric network of microgels 58. If we compare the free energy of desorption for a rigid particle in Fig. 5, to those in Fig. 10, we can conclude that the free energy of desorption for microgel particles is lower than for a rigid particle with the same mass. The same trend is observed for the spherical particles examined in Fig. 7. Therefore, one would expect that the more enhanced stabilizing effect of the microgel particle comes from the particle-particle chain interactions.
An important case which is not included in Fig. 9 is a microgel particle which is soluble in both phases, such as poly(N-vynilcaprolactam) microgel at the water-toluene interface. From computations, we found out that when such a particle moves away from the interface, it takes a long time for the interface to settle to its final shape; as a matter of fact, we were not able to obtain a reliable force measurement during reasonable simulation time. Also, the large size of such microgel particles requires a considerably larger computational box compared to other studied particles. These two reasons make their simulation computationally challenging. Therefore, the desorption of microgel particles that are soluble in both phases is a topic that needs to be investigated in a future study.
6 Conclusions
Motivated by the need to understand how efficient soft particles are as emulsion stabilizers, we measured the binding free energy between a soft particle and an interface and compared it to the binding free energy of a rigid particle with similar surface properties. In this study, the desorption of cylindrical (two-dimensional) and spherical (three-dimensional) soft particles is analyzed, and generic deformable particles, as well as soft polymeric networks (microgel particles), are considered. We used coarse-grained molecular dynamics simulations with the thermodynamic integration method to obtain the force-distance relationship for the particle detachment. We then measured the energy required to transfer a soft particle from a fluid interface to the fluid bulk, the so-called desorption free energy.
Our molecular dynamics simulations reproduce the analytical equation for the force-distance relationship for the desorption of a rigid cylindrical particle with , proving the capability of the discrete nanoscale simulations to capture the macroscopic continuum behaviour.
We argued that to analyze the force-distance relationship, it is helpful to split the total force acting on the particle during the desorption into two major components: the contact line force, , which pulls the particle toward the interface along the particle-interface contact line and the pressure force, , which is produced by the curvature of the bath interface during the desorption.
For a soft cylindrical particle, the pressure force increases proportional to the increase in the particle-interface contact area when compared to a rigid particle. However, the contact line force decreases due to the capability of the soft particle to deform instead of bending the interface. Eventually, the desorption energy for a soft cylindrical particle is slightly smaller than for a rigid particle with the same contact angle.
For a soft spherical particle, the increase in the wetted area due to particle deformability is more significant than the for soft cylindrical particles. Therefore, soft spherical particles experience a larger increase in the pressure force compared to the soft cylindrical particles. Unlike soft cylinders, soft spherical particles have a longer contact line compared to rigid particles due to their three-dimensional circumference. Therefore, despite having a smaller force per unit length as soft cylinders, the overall contact line force increases for soft particles, and hence, a soft spherical particle attaches to the interface stronger than a rigid particle.
For microgel particles, the affinity between the polymer chains of a swollen particle and the solvent molecules of one liquid phase is decreased to transform the swollen particle into a collapsed one. Using a simple area-based argument, a collapsed microgel particle should be easier to detach due to its smaller wetting area at the interface. However, the binding between the particle and the interface can be stronger for a collapsed microgel due to its larger surface tension and higher rigidity; the collapsed particle is less deformable, and hence capable of bending the interface more effectively during the desorption while the swollen microgel easily deforms, keeping the interface nearly flat which creates a smaller pulling force. Also, the surface tension of the particle and the liquid is larger for the collapsed microgel rendering it less favorable to detach into the wetting phase. Finally, we showed that depending on the the extent of change in the surface properties during the swollen to collapsed transition, the particle can desorb to the initially nonwetting phase, which could have a much smaller energy barrier than the newly formed collapsed particle.
In summary, the major conclusion from this work is that soft particles do not show pronounced advantages to stabilize fluid-fluid interfaces when compared to rigid particles. When taking into account the interplay of particle and interface deformation, the binding free energy between an interface and a particle would be less than a rigid particle with a similar shape as the deformed soft particle. In other words, our work suggests that an ellipsoidal particle could result in a stronger binding than a soft particle if the particle rotation could be prevented, because the major axis of a rigid ellipsoid aligns with the fluid interface, resulting in a higher reduction of interfacial area and as such a stronger binding. Also, their shape will not change during desorption which increases their capability to deform liquid interface which is energetically less favourable. In addition, the contact line pinning could happen on such particles due to the slope variation on them.
7 Acknowledgements
We acknowledge access to the supercomputers Cartesius at the SURFsara High-Performance Computing Center and Jureca at the Jülich Supercomputing Centre. We acknowledge financial support from NWO through VIDI Grant No. 11304.
Notes and references
- Binks 2002 B. Binks, Current Opinion in Colloid & Interface Science, 2002, 7, 21.
- Binks and Horozov 2006 B. Binks and T. Horozov, Colloidal Particles at Liquid Interfaces, Cambridge University Press, 2006.
- Ramsden 1903 W. Ramsden, Proceedings of the Royal Society of London, 1903, 72, 156.
- Pickering 1907 S. Pickering, Journal of the Chemical Society, Transactions, 1907, 91, 2001.
- Jansen and Harting 2011 F. Jansen and J. Harting, Physical Review E, 2011, 83, 046707.
- Frijters et al. 2014 S. Frijters, F. Günther and J. Harting, Physical Review E, 2014, 90, 042307.
- Destribats et al. 2011 M. Destribats, V. Lapeyre, M. Wolfs, E. Sellier, F. Leal-Calderon, V. Ravaine and V. Schmitt, Soft Matter, 2011, 7, 7689–7698.
- Monteillet et al. 2014 H. Monteillet, M. Workamp, J. Appel, J. M. Kleijn, F. A. M. Leermakers and J. Sprakel, Advanced Materials Interfaces, 2014, 1, 1300121.
- Brugger et al. 2008 B. Brugger, B. A. Rosen and W. Richtering, Langmuir, 2008, 24, 12202–12208.
- Zhang and Pelton 1999 J. Zhang and R. Pelton, Langmuir, 1999, 15, 8032–8036.
- Brugger et al. 2009 B. Brugger, S. Rütten, K. H. Phan, M. Moller and W. Richtering, Angewandte Chemie - International Edition, 2009, 48, 3978–3981.
- Saunders 1999 B. Saunders, Advances in Colloid and Interface Science, 1999, 80, 1–25.
- Saunders et al. 2009 B. R. Saunders, N. Laajam, E. Daly, S. Teow, X. Hu and R. Stepto, Advances in Colloid and Interface Science, 2009, 147-148, 251–262.
- Oh et al. 1998 K. S. Oh, J. S. Oh, H. S. Choi and Y. C. Bae, Macromolecules, 1998, 31, 7328–7335.
- Rapacchietta et al. 1977 A. V. Rapacchietta, A. W. Neumann and S. N. Omenyi, Journal of Colloid and Interface Science, 1977, 59, 555–567.
- Scheludko et al. 1976 A. Scheludko, B. V. Toshev and D. T. Bojadjiev, J. Chem. Soc., Faraday Trans, 1976, 72, 2815–2828.
- Davies et al. 2014 G. B. Davies, T. Krüger, P. V. Coveney and J. Harting, The Journal of Chemical Physics, 2014, 141, 154902.
- Levine et al. 1989 S. Levine, B. D. Bowen and S. J. Partridge, Colloids and Surfaces, 1989, 38, 325–343.
- Style et al. 2015 R. W. Style, L. Isa and E. R. Dufresne, Soft Matter, 2015, 11, 7412–7419.
- Ettelaie and Lishchuk 2015 R. Ettelaie and S. V. Lishchuk, Soft Matter, 2015, 11, 4251–4265.
- Mehrabian et al. 2011 H. Mehrabian, P. Gao and J. J. Feng, Physics of Fluids, 2011, 23, 1–14.
- Mehrabian and Feng 2013 H. Mehrabian and J. J. Feng, Journal of Fluid Mechanics, 2013, 717, 281–292.
- Mehrabian and Feng 2014 H. Mehrabian and J. J. Feng, Journal of Fluid Mechanics, 2014, 752, 670–692.
- Bellucci et al. 2018 M. A. Bellucci, M. R. Walsh and B. L. Trout, The Journal of Physical Chemistry C, 2018, 122, 2673–2683.
- Gumbart and Chipot 2013 J. C. Gumbart and C. Chipot, 2013, 1–29.
- Woo and Roux 2005 H.-j. Woo and B. Roux, Proceedings of the National Academy of Sciences of the United States of America, 2005, 102, 6825–30.
- Mehrabian et al. 2018 H. Mehrabian, M. A. Bellucci, M. R. Walsh and B. L. Trout, The Journal of Physical Chemistry C, 2018, 122, 12839–12849.
- Mehrabian et al. 2019 H. Mehrabian, M. R. Walsh and B. L. Trout, Journal of Physical Chemistry C, 2019, 123, 17239–17248.
- Chateau and Pitois 2003 X. Chateau and O. Pitois, Journal of Colloid and Interface Science, 2003, 259, 346–353.
- Davies et al. 2014 G. B. Davies, T. Krüger, P. V. Coveney, J. Harting and F. Bresme, Advanced Materials, 2014, 6715–6719.
- Hirose et al. 2007 Y. Hirose, S. Komura and Y. Nonomura, Journal of Chemical Physics, 2007, 127, 241104.
- O’brien 1996 S. B. G. O’brien, Journal of Colloid and Interface Science, 1996, 183, 51–56.
- Sinn et al. 2015 N. Sinn, M. Alishahi and S. Hardt, Journal of Colloid and Interface Science, 2015, 458, 62–68.
- Rumyantsev et al. 2016 A. M. Rumyantsev, R. A. Gumerov and I. I. Potemkin, Soft Matter, 2016, 12, 6799–6811.
- Bochenek et al. 2019 S. Bochenek, A. Scotti, W. Ogieglo, M. Á. Fernández-Rodríguez, M. F. Schulte, R. A. Gumerov, N. V. Bushuev, I. I. Potemkin, M. Wessling, L. Isa and W. Richtering, Langmuir, 2019, 35, 16780–16792.
- Camerin et al. 2019 F. Camerin, M. Á. Fernández-Rodríguez, L. Rovigatti, M. N. Antonopoulou, N. Gnan, A. Ninarello, L. Isa and E. Zaccarelli, ACS Nano, 2019, 13, 4548–4559.
- Arismendi-Arrieta and Moreno 2020 D. J. Arismendi-Arrieta and A. J. Moreno, Journal of Colloid and Interface Science, 2020, 570, 212–222.
- Léonforte and Müller 2011 F. Léonforte and M. Müller, Journal of Chemical Physics, 2011, 135, 214703.
- Carrillo et al. 2010 J. M. Y. Carrillo, E. Raphael and A. V. Dobrynin, Langmuir, 2010, 26, 12973–12979.
- Cao and Dobrynin 2015 Z. Cao and A. V. Dobrynin, Macromolecules, 2015, 48, 1–13.
- Cao et al. 2014 Z. Cao, M. J. Stevens and A. V. Dobrynin, Macromolecules, 2014, 47, 3203–3209.
- Mehrabian et al. 2016 H. Mehrabian, J. Harting and J. H. Snoeijer, Soft Matter, 2016, 12, 1062–1073.
- Kirkwood 1935 J. G. Kirkwood, The Journal of Chemical Physics, 1935, 3, 300.
- Razavi et al. 2013 S. Razavi, J. Koplik and I. Kretzschmar, Soft Matter, 2013, 9, 4585.
- Udayana Ranatunga et al. 2010 R. J. K. Udayana Ranatunga, R. J. B. Kalescky, C. C. Chiu and S. O. Nielsen, Journal of Physical Chemistry C, 2010, 114, 12151–12157.
- Razavi et al. 2014 S. Razavi, I. Kretzschmar, J. Koplik and C. E. Colosqui, Journal of Chemical Physics, 2014, 140, 014904.
- Van Der Spoel et al. 2005 D. Van Der Spoel, E. Lindahl, B. Hess, G. Groenhof, A. E. Mark and H. J. C. Berendsen, Journal of Computational Chemistry, 2005, 26, 1701–1718.
- Abraham et al. 2016 M. J. Abraham, D. van der Spoel, E. Lindahl, B. Hess, G. development Team and G. development Team, 2016, 245.
- Humphrey et al. 1996 W. Humphrey, A. Dalke and K. Schulten, Journal of Molecular Graphics, 1996, 14, 33–38.
- Stecki and Toxvaerd 1995 J. Stecki and S. Toxvaerd, The Journal of Chemical Physics, 1995, 103, 4352–4359.
- Kremer and Grest 1990 K. Kremer and G. S. Grest, The Journal of Chemical Physics, 1990, 92, 5057–5086.
- Lishchuk and Ettelaie 2020 S. Lishchuk and R. Ettelaie, Soft Matter, 2020, 16, 4049.
- Tsuji and Kawaguchi 2008 S. Tsuji and H. Kawaguchi, Langmuir, 2008, 24, 3300–3305.
- Ngai et al. 2005 T. Ngai, S. H. Behrens and H. Auweter, Chemical communications (Cambridge, England), 2005, 331–333.
- Deshmukh et al. 2014 O. S. Deshmukh, A. Maestro, M. H. G. Duits, D. van den Ende, M. C. Stuart and F. Mugele, Soft Matter, 2014, 9, 2731–2738.
- Destribats et al. 2014 M. Destribats, M. Eyharts, V. Lapeyre, E. Sellier, I. Varga, V. Ravaine and V. Schmitt, Langmuir, 2014, 30, 1768–1777.
- Ngai et al. 2006 T. Ngai, H. Auweter and S. H. Behrens, Macromolecules, 2006, 39, 8171–8177.
- Camerin et al. 2020 F. Camerin, N. Gnan, J. Ruiz-Franco, A. Ninarello, L. Rovigatti and E. Zaccarelli, 2020, 1–15.