Intermediate-to-Low Mass Stars in Open Clusters and the Evolution of Li
Abstract
Open clusters (OC) of 1-3 Gyr age contain intermediate-to-low-mass stars in evolutionary phases of multiple relevance to understanding Li evolution. Stars leaving the main sequence (MS) from the hot side of the Lithium dip (LD) at a fixed age can include a range of mass, varying degrees of core degeneracy, and helium ignition under quiescent or flash conditions. An ongoing survey of a significant sample of stars from the giant branch to below the LD in key open clusters has revealed patterns that supply critical clues to the underlying source of Li variation among stars of differing mass and age. While the LD is well established in OC of this age, stars on the hot side of the LD can exhibit Li ranging from the apparent primordial cluster value to upper limits similar to those found at the LD center, despite occupying the same region of the color-magnitude diagram (CMD). Stars on the first-ascent giant branch show a dramatic decline in measurable Li that correlates strongly with increasing age and reduced turnoff mass. We discuss how these trends can be explained in the context of the existence of the LD itself and the temporal evolution of individual stars.
1 Introduction
A perennial justification for studying OC is minimization of the inhomogeneity of internal and external parameters within the OC, ideally reduced to variation in one fundamental property: mass. All things being equal, comparison of trends with mass for OC of differing age supplies insight into the means by which internal evolution of a star can temporally alter its surface appearance, making the unseen visible. OC Li analyses are no exception to this trend and, in fact, may be the best direct example of the use of a surface abundance to probe atmospheric alteration of stars of varying mass, both with time and evolutionary state.
The role of Li among stars of cooler /lower mass has been discussed by others at this conference and will not be repeated.111This paper was presented at the conference, “Lithium in the Universe: to Be or not to Be”, sponsored by INAF-OAR, Rome, Italy, Nov. 18-22, 2019. We will focus on stars in the 1-2.5 M☉ mass range for which the optimal observation window occurs within OC older than the Hyades but significantly younger than halo globulars. An exact age range remains indeterminate because transition points between the phenomena controlling Li evolution on and off the MS are dominated first by and second by mass (Chen et al., 2001; Cummings et al., 2012). Since the main sequence mass of a star of given changes with metallicity, stars of a given mass but lower metallicity will be altered internally in a different manner and at a different age from their metal-rich counterparts.
While not one of our two core topics, it should be noted that OC in the age range of interest have drawn attention from Li aficionados due to an intriguing pattern tied as much to cosmology as stellar structure. Moving up the MS from lower to higher mass/, the time rate of Li depletion declines, producing a steepening gradient of Li with with age in older OC. However, stars in the MS range between 6500K and 6900K, where Li depletion should be nonexistent, populate the LD where Li undergoes a dramatic decline relative to stars outside the boundary (Boesgaard & Tripicco, 1986). This anomaly creates a Li plateau among stars cooler than 6000K but hotter than 5500K, a plateau that declines in A(Li) with increasing age, illustrated schematically in Fig. 1. Crucially, for older OC independent of metallicity, the A(Li) value approached by the plateau is 2.4-2.6, tantalizingly close to the Spite plateau among halo dwarfs (see, e.g. Randich et al. (2009); Cummings et al. (2012)). The initial A(Li) among OC is believed to be positively correlated with [Fe/H]. But, OC ranging in [Fe/H] from +0.4 to -0.4 generate plateau dwarfs with virtually identical asymptotic A(Li) limits, indicating that all dwarfs in this range, including halo dwarfs, gradually deplete Li to a similar A(Li) value for reasons that remain, at best, unclear. The OC failure to reach a value closer to A(Li) 2.2 may simply be due to the invariably younger age of the oldest OC (5-8 Gyr) relative to the halo (11-13 Gyr).
2 Two Key Questions
Returning to the two current topics of interest, we refer again to Fig. 1 (l), with a schematic CMD for an intermediate-age OC (1.5 Gyr; [Fe/H] = 0.0). With the exception of the subgiant and giant branch (green), the corresponding representative trends for A(Li) with mass are identified by color (r).
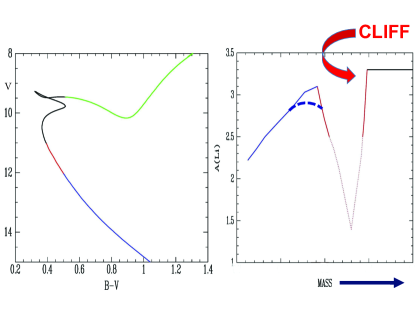
The Li plateau level will decline with age (r-dash). Within the LD (red), depth may grow deeper with time. However, A(Li) is already so low by 0.65 Gyr that detection of further decline with age is technically unfeasible in currently studied OC. What is striking is the sharp decline over a very narrow mass change at the high-mass LD boundary, designated as the cliff in Fig. 1. Stars above the cliff (black) supposedly undergo no Li depletion and should retain the primordial cluster Li. One rationale for the study of these cliff dwellers has been to highlight the decline in A(Li) experienced by stars on the cool Li plateau through comparison with these stars as exemplars of the original cluster A(Li). However, in defining the parameters that could affect the LD, the sharp edge of the cliff offers an ideal marker for tagging the LD boundary, moreso than the continually evolving, sloped cool plateau and/or the ill-defined center of the LD; both have been used to evaluate the evolution of the LD (Anthony-Twarog et al., 2009; Cummings et al., 2012). This marker clearly disappears once an OC approaches an age where stars leaving the MS for the giant branch come from within the LD, as exemplified by NGC 6253 (Anthony-Twarog et al., 2010; Cummings et al., 2012) and M67 (Castro et al., 2016). For our first question, we try to determine if there is evidence that the cliff boundary is affected by any property other than cluster metallicity, i.e. does the cliff edge shift to higher stellar mass as an OC ages?
The second question focuses on the evolution of cliff dwellers across the subgiant branch and up the giant branch. Since all models predict that post-main-sequence evolution should lead to a decline in A(Li) through deepening convection zones and other structurally-induced forms of mixing, the distribution of A(Li) among evolved stars is a byproduct of these processes acting on the initial Li abundance as defined by the stellar value as it leaves the MS. Do cliff dwellers retain the actual cluster primordial value or are there processes that can alter the base value prior to leaving the MS, supplying some insight into the source of anomalies like the LD itself?
To answer the first question, we assemble an OC sample of comparable metallicity ([Fe/H] = -0.03 to -0.08) but differing age. (Note that all OC discussed have been processed for membership using radial velocities and Gaia astrometry, and for age and distance using isochrones modified by well-defined reddening and metallicity.) The OC of interest were, until recently, NGC752 (Twarog et al., 2015) and NGC3680 (Anthony-Twarog et al., 2009) with ages of 1.45 and 1.75 Gyr, respectively. These OC have numerically less-than-rich populations and incomplete Li surveys. Merger of the data allows determination of the approximate LD location, but exact boundaries remain fluid. Among cooler evolved stars, no subgiants survive and the giant sample is so poor that classification as first-ascent giants versus clump stars becomes an exercise in personal bias, often defined by the presence/absence of measurable Li.
To overcome this, a program of high-dispersion spectroscopic analyses of extensive samples of stars in rich OC was initiated, with NGC6819 (age=2.25 Gyr) among the first where the sample from the tip of the giant branch to below the LD numbered over 330 stars (Deliyannis et al., 2019). Fig. 2 shows the A(Li) trend with mass among stars (blue) at the OC turnoff not classified as
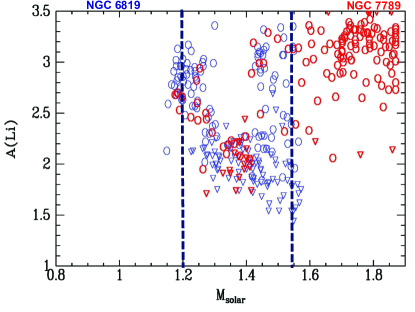
subgiants; triangles illustrate stars with only A(Li) upper limits. Note how sharp the hot boundary is at 1.43 M☉. The vertical dashed lines show an approximate estimate of the LD boundaries derived using the sample from NGC752/NGC3680. Is the boundary difference real or a byproduct of an inadequate sample from the composite OC? Fig. 2 shows the A(Li) – mass trend for the rich OC, NGC7789 (red) (age=1.5 Gyr), including over 300 stars from the giant branch to below the LD. The greater mass range at the turnoff identifies NGC7789 as the younger OC but the cliff boundary is identical within the uncertainties to that for NGC6819, implying that the potentially broader LD for the NGC752/NGC3680 data is due to the statistical inadequacy of the sample.
Before addressing the second primary question, an issue tied to cliff mass variation with age should be noted. Is there significant variation of the cliff with metallicity, as expected if the boundary is defined on the unevolved MS solely by ? A simple comparison between the Hyades/Praesepe boundary at 1.495 M☉ for [Fe/H]=+0.15 and the above 1.425 M☉ for [Fe/H]=-0.05 implies a slope of 0.35 M☉/dex. However, our analysis of the metal-poor OC ([Fe/H]=-0.5, age=3.5 Gyr), NGC2243, shows that the turnoff just reaches the extant cliff with a boundary at 1.225 M☉. A linear fit implies a slope of 0.4 M☉/dex, as found in earlier work (Anthony-Twarog et al., 2009; Cummings et al., 2012).
We now look at the stars populating the cliff since these stars become the foundational source for those occupying the subgiant/giant branch. We start with our youngest/richest OC, NGC7789. Because it is young, stars leaving the turnoff do so without a significant degree of core degeneracy, leading to a poorly populated subgiant branch/Hertzsprung gap due the rapid phase of evolution after core H-exhaustion. Only a handful of first-ascent giants lie below the level of the clump.
To better understand this critical phase, a Li study of NGC2506 ([Fe/H]=-0.3,age=1.8 Gyr) was done. Because of lower [Fe/H], the cliff boundary occurs at a lower mass than in NGC7789, implying that it will more closely resemble the NGC7789 Li turnoff when NGC2506 stars of lower mass occupy this phase, i.e. when NGC2506 is older. Because the cluster turnoff is populated by lower mass stars, the degree of core degeneracy is greater at H-exhaustion and the distribution of first-ascent giants is more heavily weighted toward the subgiant branch and vertical red giant branch below the clump, as confirmed by the its CMD (Anthony-Twarog et al., 2018). Fig. 3 presents

the Li- relation for the two OC from above the LD through the giant branch tip for stars in NGC7789 (red) and NGC2506 (blue). Triangles are upper limits, but asterisks are stars classified as subgiants; they map evolution across the subgiant to the base of the first-ascent giant branch.
A number of points should be noted: a) by the time the stars reach the base of the RGB, A(Li) has been reduced to 1.5 or less, i.e. below the boundary for Li-rich classification. Only one red giant in NGC7789 fits that category (Pilachowski et al., 1984); b) there is evidence for a weak decline in A(Li) for stars ascending the giant branch until 4500K, potentially the site of the RGB bump, after which A(Li) approaches a limiting value of 0.6; c) with only a pair of exceptions, no clump stars exhibit measurable Li, with a limiting value at 0.8 or less. The implication is that He-ignition at the RGB tip leads to significant Li depletion, whether done in quiescent (NGC7789) or flash (NGC2506) form; d) while there are some cliff dwellers with significant Li depletions prior to entering the subgiant branch, the majority of turnoff stars at this stage lie within the A(Li)= 3.3 to 2.7 range, close to their likely initial primordial cluster value.
What happens if we push the OC to a greater age, allowing more time for the evolution of the stars on the cliff? For this purpose, we combine the data for NGC6819 and NGC2243. While NGC2243 is significantly older, it is also significantly more metal-poor, producing an evolutionary distribution of stars, from the Li standpoint, that should be similar to that in NGC6819, i.e. cliff dwellers occupy a very narrow mass band at the top of the turnoff.
The NGC6819/2243 equivalent of Fig. 3 is shown in Fig. 4.

Symbols have the same meaning with one addition. Subgiants with only upper limits to A(Li) are designated by a 3-point Y. The change in distribution is striking: a) stars with measurable Li are now the exception, rather than the rule, independent of whether the star is a first-ascent red giant or a clump star. Even the majority of the subgiants have only upper limits to A(Li); b) with only one exception (W7017 in NGC6819), all stars again fail to meet the standard of Li-rich; c) while there appears to be a decline in the upper limit of A(Li) with decreasing , this is purely due to the expected line strength increase as drops, making the upper limit more restrictive, and has no bearing on internal evolution; d) among cliff dwellers, the fraction of stars with only upper limits to A(Li) has increased dramatically, and the majority of stars leaving the MS will do so with A(Li) 2.7, even before entering the subgiant branch. In fact, the range in A(Li) among the cliff stars now extends as low as the values found among stars within the LD, i.e. cliff dwellers are recreating the Li pattern long since completed by less massive stars found within the LD. It is probable that any additional mechanism that further reduces Li along the giant branch will place the evolved products of these future giants at a Li-level 5 to 10 times lower than red giants within NGC7789/2506.
3 Solutions & Conclusions
Since the red giant Li distribution for the older stars is so dominated by the decline in Li among stars while still at the turnoff, the question becomes why do these stars, which supposedly lack any significant degree of convection in their atmospheres, suddenly exhibit dramatic declines in their atmospheric Li? The key lies among the mechanisms often discussed when attempting to explain the origin of any non-convection-related Li decline, e.g. the origin of the LD itself. Perhaps the most prominent solution is tied to mixing within the atmosphere triggered not by convection but by stellar rotation, specifically the decline in rotation with time. It has been known since the discovery of the LD that there is a well delineated correlation between a star s rotation rate and the degree of Li-depletion, with more rapid rotators showing greater depletion. While this may seem like a contradiction with the previous claim, remember that the measured rotational speeds are a snapshot of the current state of the stars atmosphere rather than an indicator of the original Vrot. If it is the spindown of a star that triggers mixing and a reduction in Li, stars that have spun down from a high initial Vrot to a modest value will exhibit significantly more depletion than a star which was rotating only moderately to begin with and has a minor reduction in Vrot over time.

To test this, we plot in Fig. 5 the Vrot distributions for the OC, ordered by their Li state of evolution, with the least evolved at the top. For each OC, the dark circles identify only stars on the cliff, sorted by distance above the cliff, while the red symbols show the stars within the LD. The blue rectangle shows the Vrot range for NGC2243 stars observed above the LD. The range is virtually identical to that found for its Li-phase companion, NGC6819. If one assumes that the Vrot distribution in NGC6819/2243 at a younger age was comparable to that in NGC7789, already reduced to a smaller spread by an age of 1.5 Gyr, the typical star in the older OC has spun down by a factor of 2-4 within the last Gyr. When combined with the longer timescale for the H-exhaustion phase among these lower mass stars, we conclude that the primary source of the expanded range in A(Li) among the stars leaving the turnoff is mixing triggered by the dramatic reduction in Vrot over the timescale of 0.5 Gyr. This is the same physical process that led to the creation of the LD among the OC when younger, i.e. during the first 0.5 Gyr of evolution upon arrival on the zero-age MS, stars within the LD experienced spindown of Vrot from their original state and this generated enough mixing to deplete Li to levels too low to measure by Hyades age.
We conclude that: a) The high mass boundary of the LD is sharp and well-defined; once formed, it remains unchanged as the OC ages; b) the primary parameter defining the mass of the boundary is the metallicity; the stellar mass at the edge of the Li cliff decreases by 0.4 M☉ for each dex drop in [Fe/H] between [Fe/H]=+0.4 and -0.5; c) due to the absence of any underlying mixing mechanism, stars occupying the cliff initially retain the primordial cluster value, declining to A(Li) 1.5 only upon evolution across the subgiant branch to the base of the first ascent giant branch. There is weak evidence for a slight decline in A(Li) as the stars ascend the giant branch until the apparent level of the bump is attained and A(Li) drops below 1.0. With a dramatic decline in Li at He-ignition, A(Li) for He-burning stars drops so low that only upper limits are attainable for clump stars; d) as the mass range of the cliff stars declines and the LD is approached, an increasing fraction of turnoff stars exhibit severe declines in A(Li) while still at the turnoff, so extreme that the limiting range of A(Li) approaches that found within the LD. Thus, a growing fraction of the stars entering the more populated subgiant branch have A(Li) well below the canonical value (1.5) of their higher mass counterparts. By the time these stars reach the first ascent giant branch, their Li abundance is so low that only upper limits are observable and any additional depletions caused by the bump or He-ignition drive A(Li) well below that present among the higher mass stars; e) the underlying source of this changing pattern with declining mass for stars outside the LD appears to be the spindown of stars at the turnoff coupled with the longer time spent in this evolutionary phase compared to stars of higher mass. Over a timescale of 0.5 Gyr, the turnoff stars on the cliff spindown by a factor of 2 to 5, triggering atmospheric mixing that reduces Li by a factor of 4 or more; f) Li depletion experienced by the cliff dwellers reproduces the LD among stars of higher mass than the cliff boundary. This implies that designation as Li-rich, traditionally applied to any giant with A(Li) 1.5, no longer holds for these stars or for stars evolving from within the LD since the starting point for Li enhancement can be 1 to 3 orders of magnitude lower. If enrichment among the giants is defined by addition of a fixed amount of Li, this makes no difference since the amount of enriched material defines the observed A(Li) in the final state. If, however, the degree of enrichment scales with the initial A(Li), evolved giants with A(Li) well below 1.5 would now become classified as Li-rich, a boundary that will vary with both age and [Fe/H]; g) Li-rich giants aside, the distribution of Li among a random sample of giants should show a significant depletion for stars within a mass range that extends to a mass higher than predicted by the cliff mass boundary, with a specific range that varies with metallicity; more metal-deficient giants should have excessive Li depletion for lower mass giants at a greater age than metal-rich giants.
References
- Anthony-Twarog et al. (2009) Anthony-Twarog, B. J., et al. 2009, AJ, 138, 1171
- Anthony-Twarog et al. (2010) Anthony-Twarog, B. J. et al. 2010, AJ, 139, 2034
- Anthony-Twarog et al. (2018) Anthony-Twarog, B. J. et al. 2018, AJ, 155, 138
- Boesgaard & Tripicco (1986) Boesgaard, A. M., & Tripicco, M. J. 1986, ApJL, 302, 49
- Castro et al. (2016) Castro, M. et al. 2016, A&A, 590, 94
- Chen et al. (2001) Chen, Y. Q. et al. 2001, A&A, 371, 943
- Cummings et al. (2012) Cummings, J. D. et al. 2012, AJ, 144, 137
- Deliyannis et al. (2019) Deliyannis, C. D. et al. 2019, AJ, 158, 163
- Pilachowski et al. (1984) Pilachowski, C. et al. 1984, ApJL, 282, 17
- Randich et al. (2009) Randich, S. et al. 2009, A&A, 496, 441
- Twarog et al. (2015) Twarog, B. A. et al. 2015, AJ, 150, 134