Fuzzy Dark Matter and Dark Matter Halo Cores
Abstract
Whereas cold dark matter (CDM) simulations predict central dark matter cusps with densities that diverge as (r) 1/r observations often indicate constant density cores with finite central densities and a flat density distribution within a core radius r0. This paper investigates whether this core-cusp problem can be solved by fuzzy dark matter (FDM), a hypothetical particle with a mass of order m10-22eV and a corresponding de Broglie wavelength on astrophysical scales. We show that galaxies with CDM halo virial masses MM⊙ follow two core scaling relations. In addition to the well known universal core column density r0 = 75 M⊙pc-2 core radii increase with virial masses as r M with of order unity. Using the simulations by Schive et al. (2014) we demonstrate that FDM can explain the r0-Mvir scaling relation if the virial masses of the observed galaxy sample scale with formation redshift z as M(1+z)-0.4. The observed constant is however in complete disagreement with FDM cores which are characterised by a steep dependence r, independent of z. More high-resolution simulations are now required to confirm the simulations of Schive et al. (2014) and explore especially the transition region between the soliton core and the surrounding halo. If these results hold, FDM can be ruled out as the origin of observed dark matter cores and other physical processes are required to account for their formation.
1 Introduction
One of the strongest constraints for the cold-dark-matter (CDM) model of cosmic structure formation (Blumenthal et al. 1984, White & Frenk 1991) is the empirical result of numerous numerical simulations that CDM halos have universal density distributions that are well fit by an NFW profile (Navarro, Frenk & White 1996; for a review see Kuhlen, Vogelsberger & Angulo 2012)
| (1) |
with rs the dark halo scale radius and the density at r=rs. For rrs the density diverges as r-1 which is called the central cusp. Hydrostatic equilibrium requires that for an isotropic velocity distribution the dark matter particle velocity dispersion within this cusp decreases towards the center as . Dark matter cusps are therefore kinematically cold which can be understood as a relict of the first structures that formed in the early, dense Universe when cold dark matter particles by definition still had small random velocities. In contrast to this fundamental property of CDM halos, observations, especially of lower-mass, dark matter dominated galaxies, often show rotation curves with a shape at small radii that points to flat inner dark matter density distributions. These so called dark matter cores are characterised by a finite central density and a flat density profile within a core radius r0, reminiscent of self-gravitating isothermal spheres (e.g. Moore, 1994; Burkert 1995; Gentile et al. 2004; de Blok 2010; Pontzen & Governato 2014; Fernández-Hernández et al. 2019; Genzel et al. 2020; for reviews with references see Weinberg et al. 2015, Li et al. 2020 and di Paolo & Salucci 2020). Various empirical density distributions have been proposed to fit these cores. A profile that is frequently used is (Burkert 1995)
| (2) |
Within r0 the Burkert profile follows an isothermal sphere. For larger radii it transits into the typical NFW profile with its characteristic r-3 decline.
The origin of the CDM core-cusp problem is highly debated. One class of models invokes violent fluctuations of the gravitational potential in the inner regions of galaxies, caused e.g. by baryonic processes like perturbations due to the clumpy, turbulent interstellar medium or strong galactic winds that remove a large fraction of an early gravitationally dominent gas component (Navarro, Eke & Frenk 1996; Governato et al. 2012; Teyssier et al. 2013; di Cintio et al. 2014; Ogiya & Mori 2014; Pontzen & Governato 2014; Chan et al. 2015; El-Zant et al. 2016; Peirani et al. 2017; Benítez-Llambay et al. 2019; Freundlich et al. 2020). Another even more fascinating possibility is however that the core-cusp problem points towards hidden properties of the dark matter particle itself that are not taken into account in standard cosmological simulations.
One such scenario that has received much attention recently is fuzzy dark matter (FDM; Hu et al. 2000). The FDM model assumes that dark matter particles are axions with a mass of order m10-22eV and a corresponding de Broglie wavelength as large as the typical galactic scale length (Goodman 2000; Schive et al. 2014a,b; Hui et al. 2017, Bernal et al. 2018). The observed dark matter cores would then be soliton cores, resulting from a balance between quantum pressure due to the uncertainty principle and gravity and the observed core properties would directly trace the FDM particle mass m. Given m, the core properties are completely determined by solving the coupled Schrödinger-Poisson equation (Widrow & Kaiser 1993).
Several groups have compared the predicted FDM core structure with observations. Deng et al. (2018), for example, examined a large class of theoretical light scalar DM models, governed by some potential V and assuming a scalar that is complex with a global (1) symmetry. They demonstrated that within the framework of their analytical model there does not exist one single axion mass that can explain the observed large range of core radii r0 and at the same time reproduce the observed core scaling relation (Burkert 2015; Kormendy & Freeman 2016; Rodrigues et al. 2017). This interesting result however does not take into account the build-up of dark halos by cosmic structure formation. The first self-consistent cosmological 3D simulation of FDM halo formation was presented by Schive et al. (2014a,b). They confirmed that all halos develop a distinct, gravitationally self-bound solitonic core with a universal core density distribution. For radii r r0 it can be well fitted by the empirical relation
| (3) |
In addition, the core radius r0 scales with the halo virial mass and cosmological redshift z as
| (4) |
with q(z)=[(z)/(0)]1/6 and (z) = . For a present-day matter density parameter (z=0) = 0.315 (Planck Collaboration 2018) the value of q decreases from 1 for z=0 to 0.9 at very high redshifts z100. This change is much smaller than the observational uncertainties in determining halo core properties. We therefore will adopt q(z)=1 throughout this paper. For r3r0 the density distribution approaches the characteristic r-3 NFW density decline (equation 1).
The results of Schive et al. (2014) have been confirmed lateron by cosmological zoom-in simulations of Veltmaat et al. (2018). Interestingly, these authors also detected strong largely undamped quasi-normal oscillations within the soliton core. Outside the core and within the halo virial radius de Broglie fluctuations generate a granular structure with order of unity density fluctuations, resulting from wave interference.
The Schive et al. (2014a,b) soliton core profile (equation 3) has been used to derive limits on the FDM particle mass m (e.g. Hui et al. 2017; Marsh & Pob 2015; González-Morales et al. 2017, Schutz 2020). Calabrese & Spergel (2016) analysed two of the faintest, strongly dark matter dominated Milky Way dwarf galaxies, Draco II and Triangulum II, and found m = 3.7 - 5.6 eV. This result however relies on the assumption that the stellar component is completely embedded within the soliton core and that these diffuse satellite galaxies with galactocentric distances of 20 kpc (Laevens et al. 2015a) and 26 kpc (Laevens et al. 2015b), respectively, are not strongly tidally perturbed and in virial equilibrium. Safarzadeh & Spergel (2020) presented an analyses of two more distant Milky Way dwarf spheroidals, Sculptor and Fornax, with galactocentric distances of 88 kpc and and 138 kpc, respectively (Kormendy & Freeman 2016). They inferred axion masses of order eV with some dependence on the unknown halo virial mass. Wasserman et al. (2019) looked at the ultra-diffuse, strongly dark matter dominated galaxy Dragonfly 44 and derived soliton masses of order eV. Li et al. (2020) demonstrated that a soliton core, corresponding to a boson mass of 2-710-22eV would help to explain the origin of the Milky Way central molecular zone dynamics, which requires a dense, compact central mass concentration. Finally, Davies & Mocz (2020) showed that supermassive black holes in the centers of galaxies could affect the density profile of soliton cores, constraining the FDM particle mass. In summary, these studies indicate a FDM particle mass in the range of eV m 10-21eV.
Other groups explored the visible effects which the of order unity FDM density fluctuations (Veltmaat et al. 2018) would have on structures within galaxies. Marsh & Niemeyer (2019) showed that these fluctuations could heat and destroy star clusters. They applied their model to an old star cluster, detected in the core of the ultrafaint dwarf galaxy Eridanus II and found a lower limit of m10-21eV, required in order for the cluster to have survived up to now. Amorisco & Loeb (2018) demonstrated that FDM density fluctuations could thicken thin stellar streams, an effect that could be detected with GAIA (see also Church et al. 2019). Bar-Or et al. (2019) and El-Zant et al. (2020) lateron showed that the stochastic FDM density fluctuations can scatter stars and black holes, resulting in a diffusion through phase space that should affect dynamical friction and the inspiraling of supermassive black holes and globular clusters in galaxies.
So far, the FDM core structure as predicted by the Schive et al. (2014a,b) simulations has been compared mainly with the structure of a few Milky Way satellite galaxies. Here we go the next step and investigate whether it can explain consistently the core scaling relations of a large sample of galaxies. We start by demonstrating that there are actually two core scaling relations that need to be explained by FDM or any other scenario of core formation. We then add a new element that has been neglected so far, the cosmic redshift dependence of soliton core properties. This is crucial! As shown by equation 4 the radius of a soliton core depends not only on the axion mass m and the virial mass Mvir but also on the redshift z when the dark halo core formed, i.e. when the halo stopped growing through accretion by decoupling from the cosmic web. This is especially relevant for dwarf spheroidal satellite galaxies that have preferentially been studied so far, but also for cluster galaxies in general. In section 2 we discuss the two core scaling relations and show that FDM cores predict completely different correlations than observed for halos that could grow till z=0. Section 3 then demonstrates that adding z as a second free parameter in addition to m can explain the origin of equation 4. It however cannot solve the problem with first core scaling relation (equation 3). Section 4 summarizes the results.
2 Comparing observed core scaling relations with FDM predictions for z=0
Cores like those given by equation 2 are characterized by two parameters, the core radius r0 and the central density . In principle, both parameters could vary independently from galaxy to galaxy, depending for example on the details of the core formation history. The situation is however more interesting.
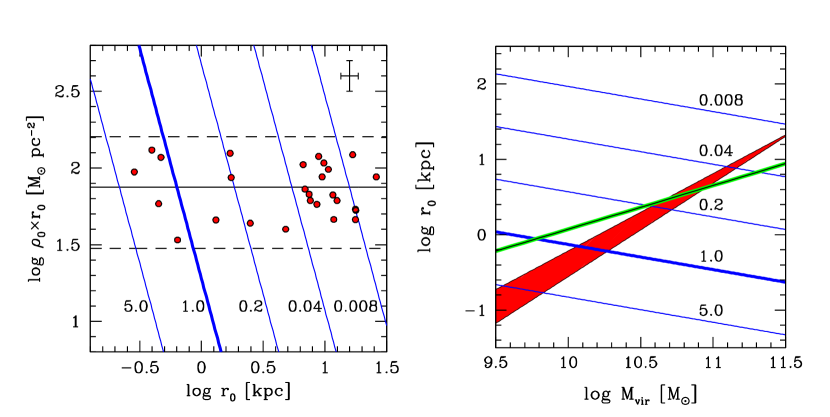
Dark halo core properties have been determined preferentially for lower-mass galaxies with stellar masses M M⊙ which often have small baryon fractions. These observations have revealed a tight correlation between r0 and that provides important constraints for any theoretical model of core formation. As shown by the red points and the solid and dashed lines in the left panel of figure 1, all observations are consistent with a constant so called core column density (Salucci & Burkert 2000; Donato et al. 2009; Burkert 2015; Kormendy & Freeman 2016)
| (5) |
Note that the term column density is misleading as the product differs from the integral .
In addition to equation 5, Kormendy & Freeman (2016) found that core radii increase with stellar mass M∗ as
| (6) |
where LB is the blue luminosity and is the stellar mass to blue luminosity ratio in solar units. For masses MM⊙ the star-to-dark matter conversion factor, predicted by abundance matching (Moster et al. 2013, 2018) is
| (7) |
with , and fitting functions that depend on redshift z. Using table 8 of Moster et al. (2018) we find to second order in (1+z)
| (8) | |||||
Combining equations 6 and 7 leads to
| (9) |
The red shaded area in the right panel of figure 1 shows the dependence of r0 on Mvir for redshifts z=0 (lower boundary) to z=8 (upper boundary), adopting (M∗/LB). Core radii increase with dark halo virial mass following a power law: r M. The correlation is roughly linear with =1.0 for z=8, steepening somewhat to =1.2 for low redshifts.
Let us now compare these observations with the predictions for FDM cores as discussed in the introduction (Chavanis 2011; Schive et al. 2014a,b; Schwabe et al 2016; Maleki et al. 2020). Rewriting equation 3 we get
| (10) |
In addition, equation 4 shows that r0 should decrease with halo virial mass as r M. The blue lines in figure 1 show these two FDM scaling relations for different dark matter masses m and z=0. The thick line in each panel depicts the standard mass of m=eV. The predicted FDM scaling relations are in complete disagreement with the observations. For given m the core column density is predicted to steeply decrease with increasing r0 while the observations show a constant (see also Deng et al. 2018). In addition, FDM core radii r0 should decrease with virial mass while the observations, combined with abundance matching, indicate a core radius that increases with Mvir.
One caveat in determining the correlation between core radius and virial mass is the assumption of a constant stellar mass-to-light ratio. For our purpose the absolute value of (M∗/LB)⊙ is not important as we are only interested in comparing trends with virial masses. However stellar mass-to-light might also change systematically with Mvir. A detailed investigation is beyond the scope of this paper. However in order to evaluate this effect it is instructive to compare the predictions of equation 9 with the analyses of Salucci et al. (2007) who took a completely different approach. They determined dark halo virial masses from the kinematics of a large sample of disk galaxies, adopting their universal rotation curve model and found r4.5(MM⊙)0.58. The green line in the right panel of figure 1 shows this scaling relation. It is remarkable that both relationships are rather similar, given the fact that the way how Mvir is determined is very different. The slope of the green line is somewhat less steep than the red area. It however confirms our conclusion that the observationally inferred scaling relation between core radius and virial mass is opposite to the scaling relation expected for FDM cores.
3 Introducing the redshift dependence of core properties
So far we focussed on halos that continuously accumulate dark matter from the cosmic web till z=0. As discussed earlier, satellites and cluster galaxies disconnect from the cosmic web at some z0. Their dark matter structure and by this also their soliton core properties are then likely to be frozen in, unless processes like tidal interactions with the surrounding or gravitational interaction with the baryonic component within the galaxy change the halo core structure. Here we neglect these secular processes and focus on the question whether introducing z (which marks the formation redshift of the halo) as a second free parameter can bring soliton cores into agreement with the observed scaling relations.
Let us start with the core radius - virial mass relationship. As discussed in the previous section, the core radii of halos with masses M M⊙ should scale with virial masses as r M with in the range of 0.6 to 1.2. Soliton cores, on the other hand, are characterized by equation 4: M r(1+z)-1.5. Combining both relationships leads to
| (11) |
Equation 11 provides interesting information about the formation redshift of galaxies which is again strongly dependent on their environmental properties. For example, adopting of order unity for our sample of galaxies, equation 11 predicts M(1+z)-0.4. The formation redshift dependence of the Salucci et al. (2007) sample with =0.6 is very similar with M(1+z)-0.5. In both cases, virial mass increases with decreasing z which is consistent with cosmological hierarchical structure formation. It would now be interesting to explore the effect of environment and by this formation redshift on in greater details and compare this with the predictions of FDM. In summary, introducing formation redshift, the second core-scaling relation can be brought into agreement with the FDM scenario.
The situation is however much more challenging for FDM when considering the first scaling relation of a constant core column density. Equation 3 shows that the soliton core structure (r) does not depend on z, Mvir or any other halo property. It directly reflects the fundamental balance between the effects of the uncertainty principle and gravity. Through observations of halo cores one can therefore determine the FDM particle mass m, independent of the core formation history or the halo formation redshift. In principle one could also test the validity of the FDM model directly by comparing the observed density distribution of dark matter cores with equation 3. Rewriting equation 10 leads to
| (12) |
Cores with the observed constant column density therefore should all have the same radii, r0. As shown by figure 1 this is in clear contradiction with the observations where the core radii for given change by at least two orders of magnitude. The only possible solution would then be that FDM consists of a population of particles with different masses m. In addition, it would require that these particles are not distributed randomly but that galaxies with larger core radii are populated by FDM particles with smaller average masses such that mr. One cannot rule out this scenario. It however appears highly constructed and therefore unrealistic.
In summary, even if we include the redshift dependence of core formation as an additional free parameter, soliton cores are not able to explain both observed core scaling relations simultaneously.
4 Conclusions and Discussion
Observed dark matter core scaling relations provide powerful constraints for models of dark halo formation and the nature of the dark matter particle. Here we focussed on two relationships that have to be fulfilled simultaneously by any theoretical model of core formation: a constant core column density and a core radius that increases with virial mass. Applied to FDM we have shown that soliton cores with a structure and redshift dependence as found by Schive et al. (2014a,b) can in principle explain the observed r0-Mvir relationship. In fact, within the FDM scenario this relationship reflects the dependence of the halo virial masses on their formation redshift which might change with galaxy type and cosmic environment. FDM however cannot explain the origin of the observed universal core column density. According to equation 12, cores with similar column densities should all have the same radii, r0. This is in contradiction with the observations that the core radii for given change by at least two orders of magnitude (figure 1). FDM therefore appears to be ruled out as an explanation for the origin of the observed dark matter cores.
One should note, that this conclusion relies on the results of the cosmological simulations by Schive et al. (2014a,b). It would now be interesting to refine their predicted core structure and its redshift dependence with a larger sample of high-resolution simulations. One should also explore the gravitational interaction of FDM cores with baryons and here focus especially on violent relaxation effects from strong gravitational perturbations that could pump energy into FDM cores, reducing their degeneracy and compactness and increasing their radii. Finally, outside a soliton core, FDM behaves like ordinary dark matter and one expects a transition to the standard NFW profile. The question then arises whether the observed cores actually trace this transition region, rather than the soliton core itself.
The observational evidence for dark matter cores in halos ranging from dwarf galaxies to galaxy clusters is a very active research field and still a matter of controversal debate (del Popolo & Le Delliou 2017). For example, Zhou et al (2020) find a weak dependence of core surface density on galaxy luminosity L: . Chan (2014) presents a systematic study of galaxy clusters and finds cores with surface densities that scale with core radius as . Gopika & Desai (2020) lateron analyse 12 relaxed Chandra X-ray clusters and find that to good approximation the surface density is constant with . At the low-mass end, Hayashi et al. (2020) analyse eight classical dwarf spheroidal galaxies and find a diversity of core structures with many actually favoring cuspy profiles. In their analyses, Hayashi et al. (2020) assume dynamical equilibrium. Satellite galaxies are however known to be strongly tidally perturbed. It would now be important to investigate the effects of tides on FDM halos in greater details. If the cuspy central structure of some dwarf spheroidals cannot be reproduced it would generate even more problems for FDM, raising the question how cusps could be generated if flat soliton cores are a fundamental property of every FDM halo. In summary however, despite the on-going discussion about the frequency of cores and their scaling relations, all observations agree that whenever cores are detected their radii can vary by orders of magnitude for given core surface density. This is in contrast to the predictions of the FDM scenario. No observation has yet found the steep dependence of r (equation 12) which is a fundamental property of FDM cores.
If FDM turns out not to explain the origin of the observed dark halo cores it would of course not rule out the existence of the FDM particle in general. As shown by figure 1, a constant core column density has been confirmed down to core radii of order 300 pc, corresponding to dark halo virial masses of order 5-1M⊙. The core scaling relations could in principle change below this observational limit and follow for example the FDM prediction r-3. This would require axion masses to be larger than meV. In this case the soliton cores would be too small to be detectable, at least with current observational techniques. The observed constant density cores with radii ranging from 300 pc to more than 10 kpc must then be the result of other processes.
Such a scenario is possible, in principle. The question however arises whether one should focus on FDM as a dark matter candidate if its major motivation, namely to explain the origin of the observed dark matter cores, is not valid anymore.
References
- Amorisco et al. (2018) Amorisco, N.C. & Loeb, A. 2018, arXiv, 1808.00464
- Bar-Or et al. (2019) Bar-Or, B., Fouvry, J.-B. & Tremaine, S. 2019, ApJ, 871, 28
- Benitez-Llambay et al. (2019) Benítez-Llambay, A., Frenk, C.S., Ludlow, A.D. & Navarro, J.F. 2019, MNRAS, 488, 2387
- Bernal et al. (2018) Bernal, T., Fernández-Hernández,, L.M., Matos, T. & Rodríguez-Meza, M.A. 2018, MNRAS, 475, 144
- Blumenthal et al. (1984) Blumenthal, G.R., Faber, S.M., Primack, J.R. & Rees, M.J. 1984, Nature, 311, 517
- Burkert (1995) Burkert, A. 1995, ApJ, 447, L25
- Burkert (2015) Burkert, A. 2015, ApJ, 808, 158
- Calabrese & Spergel (2016) Calabrese, E. & Spergel, D.N. 2016, MNRAS, 460, 4397
- Chan et al. (2015) Chan, T.K., Kereša D., Oñorbe, J., Hopkins, P.F., Muratov, A.L., Faucher-Giguère, C.-A. & Quataert, E. 2015, MNRAS, 454, 2981
- Chavanis (2011) Chavanis, P.H. 2011, Phys. Rev. D, 84, 043531
- Church et al. (2019) Church, B.V., Mocz, P. & Ostriker, J.P. 2019, MNRAS, 485, 2861
- Davies & Mocz (2020) Davies, E. & Mocz, P. 2020, MNRAS, 492, 5721
- de Blok (2010) De Blok, W.J.G. 2010, Adv. Astron., 2010, 789293
- Deng et al. (2018) Deng, H.H., Hertzberg, M.P., Namjoo, M.H. & Masoumi, A. 2018, Phys. Rev. D, 98, 23513
- Di Cintio et al. (2014) Di Cintio, A., Brook, C.B., Macciò, A.V. et al. 2014, MNRAS, 437, 415
- di Paolo & Salucci (2020) Di Paolo, C. & Salucci, P. 2020, arXiv: 2005.03520
- Donato et al. (2009) Donato, F., Gentile, G., Salucci, P., Frigerio, M., Wilkinson, M.I., Gilmore, G., Grebel, E.K., Koch, A., & Wyse, R. 2009, MNRAS, 397, 1169
- El-Zant et al. (2016) El-Zant, A.A., Freundlich, J. & Combes, F. 2016, MNRAS, 461, 1745
- El-Zant et al. (2020) El-Zant, A.A., Freundlich, J., Combes, F. & Halle, A. 2020, MNRAS, 492, 877
- Fernandez-Hernandez et al. (2019) Fernández-Hernández, L.M., Montiel, A. & Rodríguez-Meza, M.A. 2019, MNRAS, 488, 5127
- Freundlich et al. (2020) Freundlich, J., Dekel, A., Jiang, F.J. et al. 2020, MNRAS, 491, 4523
- Gentile (2004) Gentile, G., Salucci, P. & Klein, U. 2004, MNRAS, 351, 903
- Genzel et al. (2020) Genzel, R., Price, S.H., Übler, H. et al. 2020, ApJ, 902, 98
- Gonzalez-Morales et al. (2017) González-Morales, A.X., Marsh, D.J.E., Penarrubia, J., Ureña-López, L.A. 2017, MNRAS, 472, 1346
- Goodman (2000) Goodman, J. 2000, New Astronomy, 5, 103
- Governato et al. (2010) Governato, F. et al. 2010, Nature, 463, 203
- Governato et al. (2012) Governato, F., Zolotov, A., Pontzen, A. et al. 2012, MNRAS, 422, 1231
- Hu et al. (2000) Hu, W., Barkana, R. & Gruzinov, A. 2000, Phys. Rev. Lett., 85, 1158
- Hui et al. (2017) Hui, L., Ostriker, J.P., Tremaine, S. & Witten, E. 2017, Phys. Rev. D, 95, 87
- Kormendy & Freeman (2016) Kormendy, J. & Freeman, K.C. 2016, ApJ, 817, 84
- Kuhlen et al. (2012) Kuhlen, M., Vogelsberger, M. & Angulo, R. 2012, in Physics of the Dark Universe, 1, 50
- Laevens et al. (2015a) Laevens, B.P.M., Martin, N.F., Ibata, R.A. et al. 2015a, ApJ, 802, L18
- Laevens et al. (2015b) Laevens, B.P.M., Martin, N.F., Bernard, E.J. et al. 2015b, ApJ, 813, 44
- Li et al. (2020) Li, P., Lelli, F., McGaugh, S. & Schombert, J. 2020, ApJS, 247, 31
- Li, Shen et al. (2020) Li, Z., Shen, J. & Schive, H.-Y. 2020, ApJ, 889, 88
- Maleki et al. (2020) Maleki, A., Baghram, S. & Rahvar, S. 2020, Phys. Rev. D, 101, 23508
- Marsh et al. (2015) Marsh, D.J.E. & Pop, A.-R. 2015, MNRAS, 451, 2479
- Marsh et al. (2019) Marsh, D.J.E. & Niemeyer, J.C. 2019, Phys. Rev. Lett., 123, 051103
- Moore (1994) Moore, B. 1994, Nature, 370, 629
- Moster et al. (2013) Moster, B.P., Naab, T. & White, S.D.M. 2013, MNRAS, 428, 3121
- Moster et al. (2018) Moster, B.P., Naab, T. & White, S.D.M. 2018, MNRAS, 477, 1822
- Navarro et al. (1996a) Navarro, J.F., Frenk, C.S. & White, S.D.M. 1996, ApJ, 462, 563
- Navarro et al. (1996b) Navarro, J.F., Eke, V.R. & Frenk, C.S. 1996, MNRAS, 283, 72
- Ogiya & Mori (2014) Ogiya, G. & Mori, M. 2014, ApJ, 793, 46
- Peirani et al. (2017) Peirani, S., Dubois, Y., Volonteri, M. et al. 2017, MNRAS, 472, 2153
- Planck (2018) Planck Collaboration, Aghanim, N., Akrami, Y., et al. 2018, arXiv: 1807.06209
- Pontzen & Governato (2014) Pontzen, A. & Governato, F. 2014, Nature, 506, 171
- Rodrigues et al. (2017) Rodrigues, D.C., del Popolo, A., Marra, V. & de Oliveira, P.L.C. 2017, MNRAS, 470, 2410
- Safarzadeh & Spergel (2020) Safarzadeh, M. & Spergel, D.N. 2020, ApJ, 893, 21
- Salucci & Burkert (2000) Salucci, P. & Burkert, A. 2000, ApJ, 537, 9
- Salucci et al. (2007) Salucci, P., Lapi, A., Tonini, C., Gentile, G., Yegorova, I. & Klein, U. 2007, MNRAS, 378, 41
- Schive et al. (2014a) Schive, H.-Y., Chiueh, T. & Broadhurst, T. 2014a, Nature Physics, 10, 496
- Schive et al. (2014b) Schive, H.-Y., Liao, M.-H., Woo, T.-P., Wong, S.-K., Chiueh, T. & Broadhurst, T., Hwang, W.-Y., P. 2014b, Phys. Rev. Lett., 113, 261302
- Schutz (2020) Schutz, K. 2020, Phys. Rev. D, 101, 123026
- Schwabe et al. (2016) Schwabe, B., Niemeyer, J.C. & Engels, J.F. 2016, Phys. Rev. D, 94, 043513
- Teyssier et al. (2013) Teyssier, R., Pontzen, A., Dubois, Y. & Read, J.I. 2013, MNRAS, 429, 3068
- Wasserman et al. (2019) Wasserman, A., van Dokkum, P., Romanowsky, A.J. et al. 2019, ApJ, 885, 155
- Weinberg et al. (2015) Weinberg, D.H., Bullock, J.S., Governato, F., Kuzio de Naray, R. & Peter, A.H.G. 2015, PNAS, 112, 12249
- White & Frenk (1991) White, S.D.M & Frenk, C.S. 1991, ApJ, 379, 52
- Widrow & Kaiser (1993) Widrow, L.M. & Kaiser, N. 1993, ApJ, 416, L71