ALMA unveils wider environment of distant red protocluster core
Abstract
We report observations with the Atacama Large Millimetre Array (ALMA) of six submillimetre galaxies (SMGs) within 3 arcmin of the Distant Red Core (DRC) at , a site of intense cluster-scale star formation, first reported by Oteo et al. (2018). We find new members of DRC in three SMG fields; in two fields, the SMGs are shown to lie along the line of sight towards DRC; one SMG is spurious. Although at first sight this rate of association is consistent with earlier predictions, associations with the bright SMGs are rarer than expected, which suggests caution when interpreting continuum over-densities. We consider the implications of all 14 confirmed DRC components passing simultaneously through an active phase of star formation. In the simplest explanation, we see only the tip of the iceberg in terms of star formation and gas available for future star formation, consistent with our remarkable finding that the majority of newly confirmed DRC galaxies are not the brightest continuum emitters in their immediate vicinity. Thus while ALMA continuum follow-up of SMGs identifies the brightest continuum emitters in each field, it does not necessarily reveal all the gas-rich galaxies. To hunt effectively for protocluster members requires wide and deep spectral-line imaging to uncover any relatively continuum-faint galaxies that are rich in atomic or molecular gas. Searching with short-baseline arrays or single-dish facilities, the true scale of the underlying gas reservoirs may be revealed.
keywords:
galaxies: high-redshift — galaxies: evolution — galaxies: starburst — submillimetre: galaxies — radio lines: ISM — galaxies: clusters: general1 Introduction
The galaxies that populate the cores of high-redshift protoclusters — where the gas is densest and the likelihood of interactions or mergers is highest — are expected to be sites of exceptionally vigorous star formation (e.g. Chiang et al., 2013; Chiang et al., 2017; Muldrew et al., 2015). On their way to becoming the massive, passive, early-type ellipticals and lenticulars that dominate the red sequence population in present-day massive clusters, their stellar populations appear to be built over a comparatively short timescale ( Gyr, e.g. Thomas et al., 2010). At times, this star formation may be relatively unobscured, detectable in the rest-frame ultraviolet (UV), but at its most intense it is expected to be heavily obscured, emitting mainly in the rest-frame far-infrared (far-IR). These developing protocluster cores should then be most easily identifiable as multiple submillimetre (submm)-bright dusty star-forming galaxies (DSFGs, also known as submillimetre galaxies, or SMGs), all at the same redshift, spanning a megaparsec (Mpc) or more, with a combined star-formation rate of thousands of M⊙ yr-1.
Negrello et al. (2017) predict roughly one such protocluster at in every 100 deg2, with a combined star-formation rate (SFR) of M⊙ yr-1, though the true expected surface density is uncertain due to the expected steepness of the IR luminosity function. During this highly-active phase, these galaxies provide key information about the formation and early evolution of galaxy clusters and their most massive central galaxies (e.g. Ragone-Figueroa et al., 2018). At their most extreme, these structures — if sufficiently numerous — may imply dark matter halo masses that challenge our understanding of the early Universe.
Observational evidence for such structures was both sparse and weak for a considerable time, based on modest source over-densities (lacking spectroscopic confirmation) around various AGN/galaxy populations (e.g. radio galaxies and quasars) that were exploited as likely signposts to dense regions of the early Universe (Ivison et al., 2000; Stevens et al., 2003; Stevens et al., 2004; De Breuck et al., 2004; Priddey et al., 2008). The number of robust examples — with unambiguous spectroscopic redshifts for multiple far-IR-luminous galaxies — is now growing, however (e.g. Chapman et al., 2009; Hodge et al., 2013; Ivison et al., 2013, 2019; Dannerbauer et al., 2014; Casey et al., 2015; Umehata et al., 2015; Miller et al., 2018; Gómez-Guijarro et al., 2019), demanding answers to new mysteries. For example, unless the durations of these colossal starburst events are considerably longer than conventional wisdom dictates (Greve et al., 2005; Tacconi et al., 2018), how can so many supposedly ephemeral starbursts be seen simultaneously, in the same place? Significantly longer timescales are possible if the stellar initial mass function (IMF) is top heavy111Recent theoretical and observational evidence for a top-heavy IMF in starbursts (Romano et al., 2017, 2019; Zhang et al., 2018; Schneider et al., 2018; Motte et al., 2018) imply significantly fewer stars are formed, but many in the research community prefer to think of the IMF as invariant., such that SFRs are lower. Longer timescales are also inevitable if the reservoir of gas that fuels star formation is routinely under-estimated, perhaps because some fraction is dark to us (e.g. Balashev et al., 2017), and/or some spends considerable time in the intercluster medium, well outside the starburst environment, caught in a cycle of outflow and accretion (e.g. Cicone et al., 2018; Péroux et al., 2019). In any event, the /[Fe] ratio of massive, low-redshift early-type cluster galaxies seems to limit the length of any star-formation period in the progenitor components of such systems (Thomas et al., 2010).
The discovery of one of the most extreme known protoclusters in the early Universe happened almost by accident. Searching for objects whose far-IR flux densities rise from 250 to 350 m and then onwards to 500 m — the so-called ‘500-m risers’ (e.g. Cox et al., 2011; Riechers et al., 2013; Duivenvoorden et al., 2018) — Ivison et al. (2016) created a sample of ‘ultrared’ galaxies, selected via and colour cuts (specifically, and ), where is the flux density at m as measured by the Spectral and Photometric Imaging Receiver (SPIRE – Griffin et al., 2010) on board the Herschel Space Observatory (Pilbratt et al., 2010). To improve the reliability of the sample and the associated photometric redshift estimates222Their colours suggest , typically., which would otherwise have been compromised more severely by the effects of confusion (Béthermin et al., 2017), Ivison et al. then imaged these ultrared galaxies from the ground at 850–870 m with the Submillimetre Common-User Bolometer Array 2 (SCUBA-2 – Holland et al., 2013) and/or the Large APEX Bolometer Camera (LABOCA – Siringo et al., 2009). Having thus defined and refined a sample of these ‘ultrared’ galaxies, the Atacama Large Millimetre Array (ALMA) was used by Oteo et al. (2018, see also ) to determine unambiguous redshifts via the detection of line emission from 12CO, H2O, [C i], etc., in spectral scans across the 3-mm atmospheric window (see also, e.g., Asboth et al., 2016; Riechers et al., 2017; Zavala et al., 2018).
After significant work — involving several line misidentifications, as described in §2 and §3.1 of Oteo et al. — multiple emission lines333These included 12CO(2–1), 12CO(4–3), 12CO(6–5), H2O(–) and extraordinarily broad (1040 km s-1 FWHM) [C i](1–0). were ultimately detected from the reddest galaxy in the Ivison et al. sample, a galaxy so red in that it lay off the respective colour-colour plots: HATLAS J004223.5334340 or SGP-354388.
This object, denoted ‘DRC’ hereafter, for Distant Red Core, had already shown hints of multiplicity, having been spatially resolved by SCUBA-2 and LABOCA, which have FWHM resolutions of arcsec. Interferometry in band 4 (2 mm) with ALMA — designed to detect 12CO(6–5) and/or H2O(–) and reaching an r.m.s. noise level of Jy beam-1 in continuum — unveiled 11 components, denoted DRC-1 through DRC-11 by Oteo et al., with a combined SFR of 6,500 M⊙ yr-1, mainly concentrated in the brightest three components. All but one of these 2-mm continuum detections444The redshift of DRC-5 remains unknown. It may lie in front of DRC, since it has no line detection yet has relatively bright continuum emission and is also relatively bright in the near-IR. On the other hand, the spectral coverage (,000 km s-1) is insufficient to rule out cluster membership convincingly. were also seen in one or both of the targeted lines and are thus members of the cluster, scattered across arcsec ( kpc 310 kpc) in the plane of the sky — a clear over-density relative to blank-field counts (e.g. Aravena et al., 2016; Oteo et al., 2016). Six of the DRC components detected at 2 mm (including DRC-5) are also seen in continuum at 3 mm; one is radio-loud, DRC-6, with a flat centimetric spectrum detected by the Karl G. Jansky Very Large Array and the Australia Telescope Compact Array at 5.5–28 GHz (Oteo et al., 2018).
Later ALMA observations, with considerably better spatial resolution ( arcsec FWHM), further resolved the brightest component, DRC-1 — which has a total H2 gas mass of M⊙ based555The correction to made by Oteo et al. (2018) to account for the effect of the cosmic microwave background (CMB) on the [C i](1–0) measurements was erroneous. [C i](1–0) falls on the Wien side of the expected spectral line energy distribution such that the line–CMB contrast remains high even at (see Figure 6 of Zhang et al., 2016, and the discussion on pages 12–13). on its brightness in [C i](1–0) — into three fainter galaxies (Oteo et al., 2017a), one of which has amongst the highest reported SFR densities of any known galaxy, M⊙ yr-1 kpc-2 (see also Oteo et al., 2017a; Oteo et al., 2017b; Litke et al., 2019). This multiplicity may explain the extreme width of the [C i](1–0) emission line (see, e.g., Ivison et al., 2013, for another protocluster with a similarly broad line), though massive outflows driven by these intense starbursts (and/or any AGN they may contain) may also contribute (e.g., Veilleux et al., 2013; Veilleux et al., 2017; Cicone et al., 2018).
Imaging at 870 m of a much wider field, centred on the DRC, was presented by Lewis et al. (2018). These LABOCA data exploited the ultrared galaxy as a signpost to a potentially dense region of the early Universe, and were obtained several years before the core was shown to comprise multiple starburst galaxies. The DRC was one of 22 ultrared galaxies targeted in this way by Lewis et al., who found an average over-density of DSFGs of [] at the 95 [50] per cent confidence level. Towards the DRC, Lewis et al. uncovered a total of nine DSFGs across 124 arcmin2 (average depth, 1.8 mJy beam-1 r.m.s.). Two are in the core, i.e. those resolved later into 11 galaxies666We follow Oteo et al. (2018) in adopting the names A–H for the LABOCA sources labelled 1–8 in Figure 13 of Lewis et al. (2018), respectively. by ALMA at 2 mm, and into at least 13 at 870 m; six more are within 3 arcmin of the core, and there is another one further out: in total, a over-density, i.e. marginally less than half this number would be expected at this depth in a typical blank field (e.g. Geach et al., 2017). Combining their 870-m data with information at 250, 350 and 500 m from Herschel’s SPIRE instrument, Lewis et al. claimed one redshift match with the core, that being component C; components B and D were predicted to lie at and , respectively (the sub-components comprising component B were shown by Oteo et al. 2018 to lie at ); E was predicted to lie at , with for F. No photometric redshifts were listed for components G and H; indeed, Lewis et al. quoted negative SPIRE flux densities at the position of H.
Here, we use ALMA to study the dynamics of the regions beyond the core of this extreme protocluster of galaxies by searching for the 12CO(4–3) emission line777The brighter [C ii] line is not observable towards DRC due to poor atmospheric transmission at its observed frequency. towards the six dusty starbursts closest to DRC, components C–H, to test whether they belong to the same structure. We use their line and/or continuum emission to pinpoint the counterparts in Spitzer imaging, thus measuring the total stellar mass, as well as the total SFR and gas mass.
This paper is organised as follows: §2 describes the new ALMA observations and our reduction of the data. §3 presents the results, while §4 presents our discussion of those results. We summarise and draw conclusions in §5. Throughout, we adopt a -CDM cosmology with , and km s-1 Mpc-1, such that 1 arcsec corresponds to 7.0 kpc at , where the Universe is 1.5 Gyr old.
2 ALMA observations and data reduction
The six putative cluster members, LABOCA sources C–H, were observed with ALMA using four dual-polarisation spectral windows in Band 3. One was used to target 12CO(4–3) at with the remaining three (and line-free channels from the first) used to measure the continuum. With 2 GHz of bandwidth and 128 channels in each spectral window, we had channel widths of 15.625 MHz and a velocity resolution (Hanning-smoothed) of km s-1 at the observed frequency of the CO line ( GHz).
With a primary beam measuring 63 arcsec (half power beam width), each DSFG needed to be observed using a separate ALMA pointing centred on the LABOCA position. The requested sensitivity, , of 0.15 mJy beam-1 over a bandwidth of 100 km s-1 was estimated to require about 90 min of observing time per source and this was accumulated over 11 separate executions during 2018 April and July. The 12-m array was moving towards smaller configurations during this period and the maximum baseline dropped from 629 to 313 m (the configurations used were approximately C43-3 and C43-1 in April and July, respectively).
The data were automatically calibrated using the ALMA Science Pipeline (part of the Common Astronomy Software Applications package – CASA) and each channel was subsequently imaged using the task, tclean. Natural weighting was used to maximise sensitivity; close to the expected frequency of the CO line this resulted in a FWHM synthesised beam of arcsec2 at a position angle (PA) of 91° (North through East). Continuum maps were also created, using channels devoid of line emission, with similar beams to the line images, with a typical average frequency of 97 GHz and r.m.s. depths in the range 7.4–8.1 Jy beam-1. The clean components found during imaging were used subsequently to create continuum-free data cubes.
Finally, we searched our data cubes for line emission, starting with the positions of continuum emission. As it became clear that line emission was present from sources with no significant 97-GHz continuum, we expanded our line search to the full cubes. For each source, the final spectrum was extracted from the spatial pixel with the brightest line emission.
3 Results
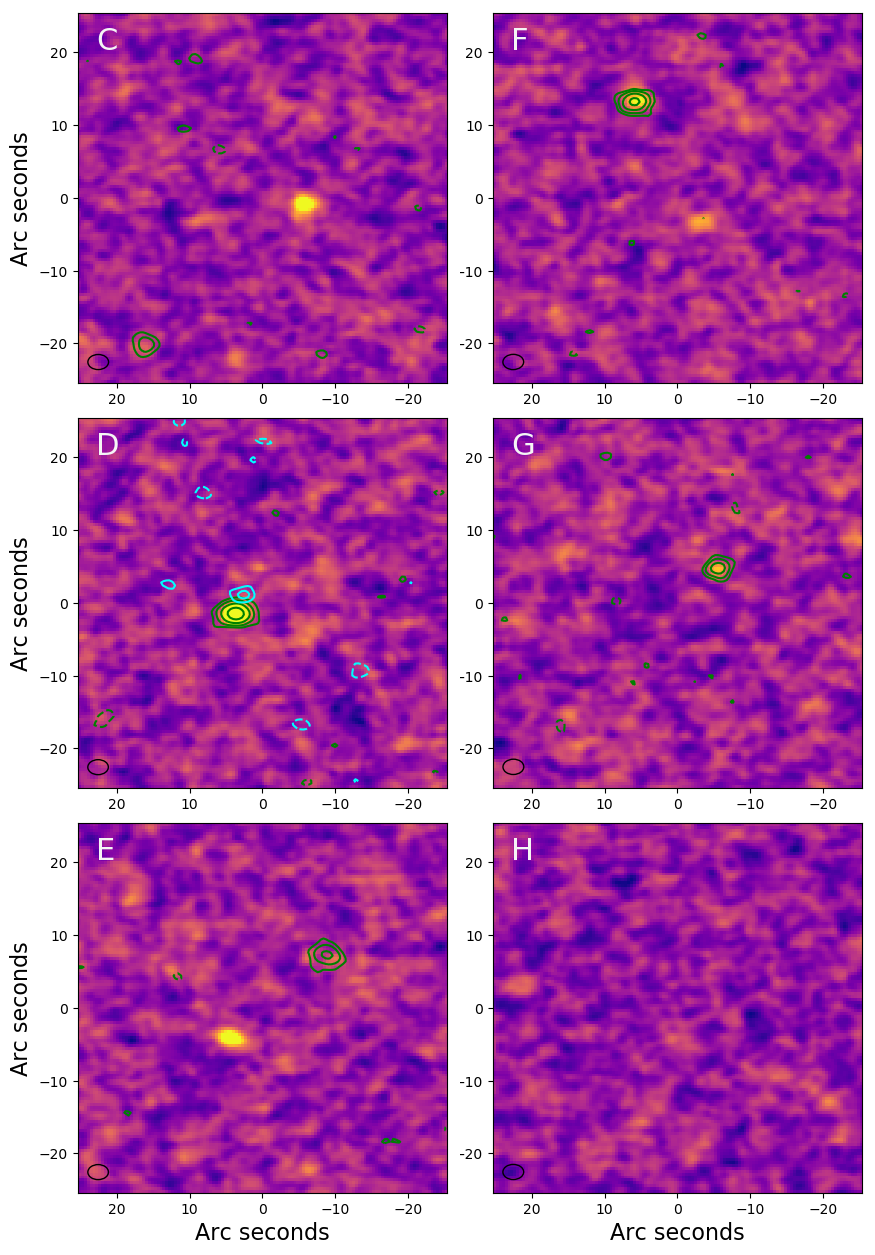
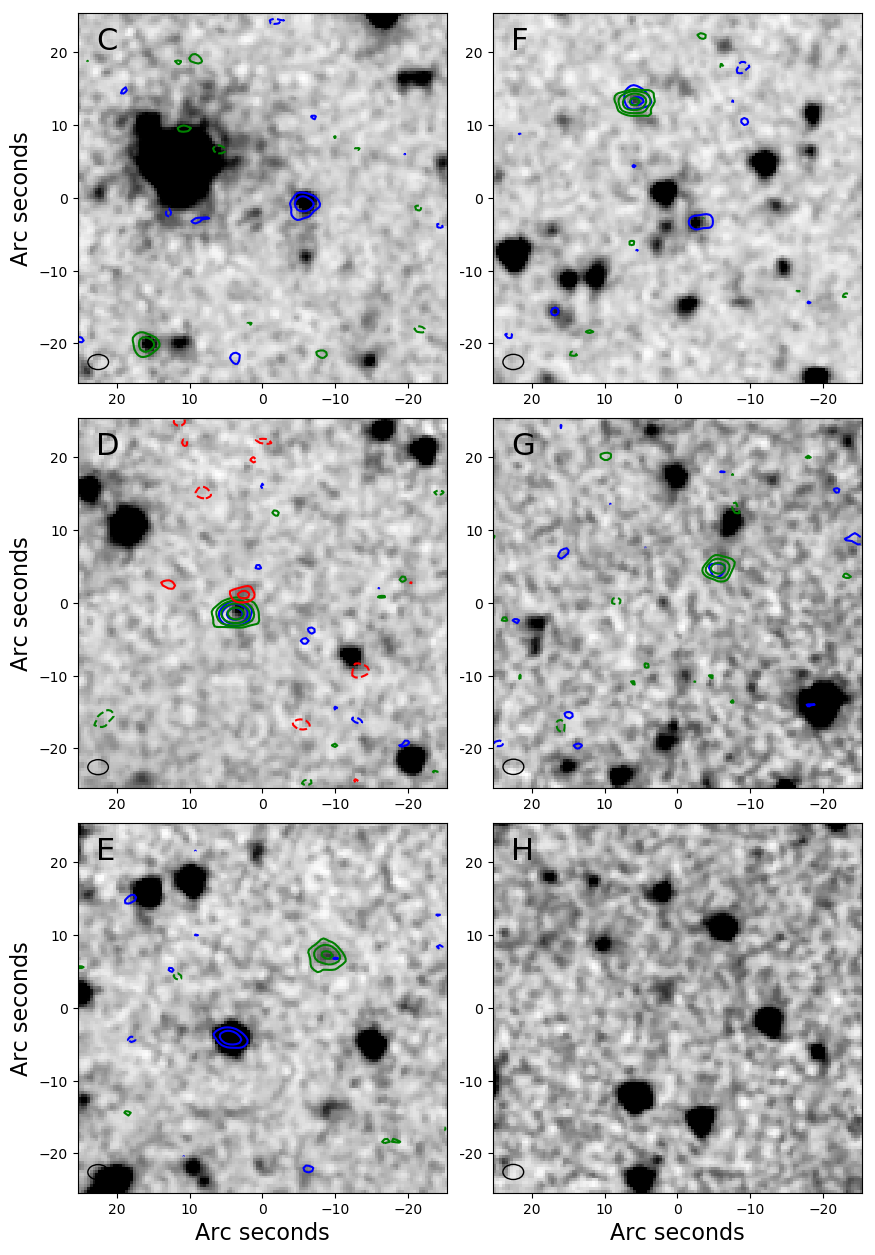
The ALMA band-3 (97-GHz) line-free continuum and zeroth moment spectral-line images of our six targets, the LABOCA sources C–H, are shown in Fig. 1, and overlaid as contours on greyscales of deep Spitzer IRAC 3.6-m imaging in Fig. 2. The IRAC data are from program IDs: 11107, PI: Pérez-Fournon and 13042, PI: Cooray, both of which used 36-position dither patterns with 30-s exposure times per frame, at slightly different position angles. The data were combined with MOPEX using the standard pipeline.
The basic observational properties of the ALMA band-3 continuum sources — positions, peak and total flux densities, where some continuum sources are clearly resolved spatially by our beam — are listed in Table 1.
The field of LABOCA source H was found to be devoid of continuum emission and it is therefore likely that the LABOCA detection was spurious, as already hinted by the empty Herschel SPIRE maps reported by Lewis et al. (2018).
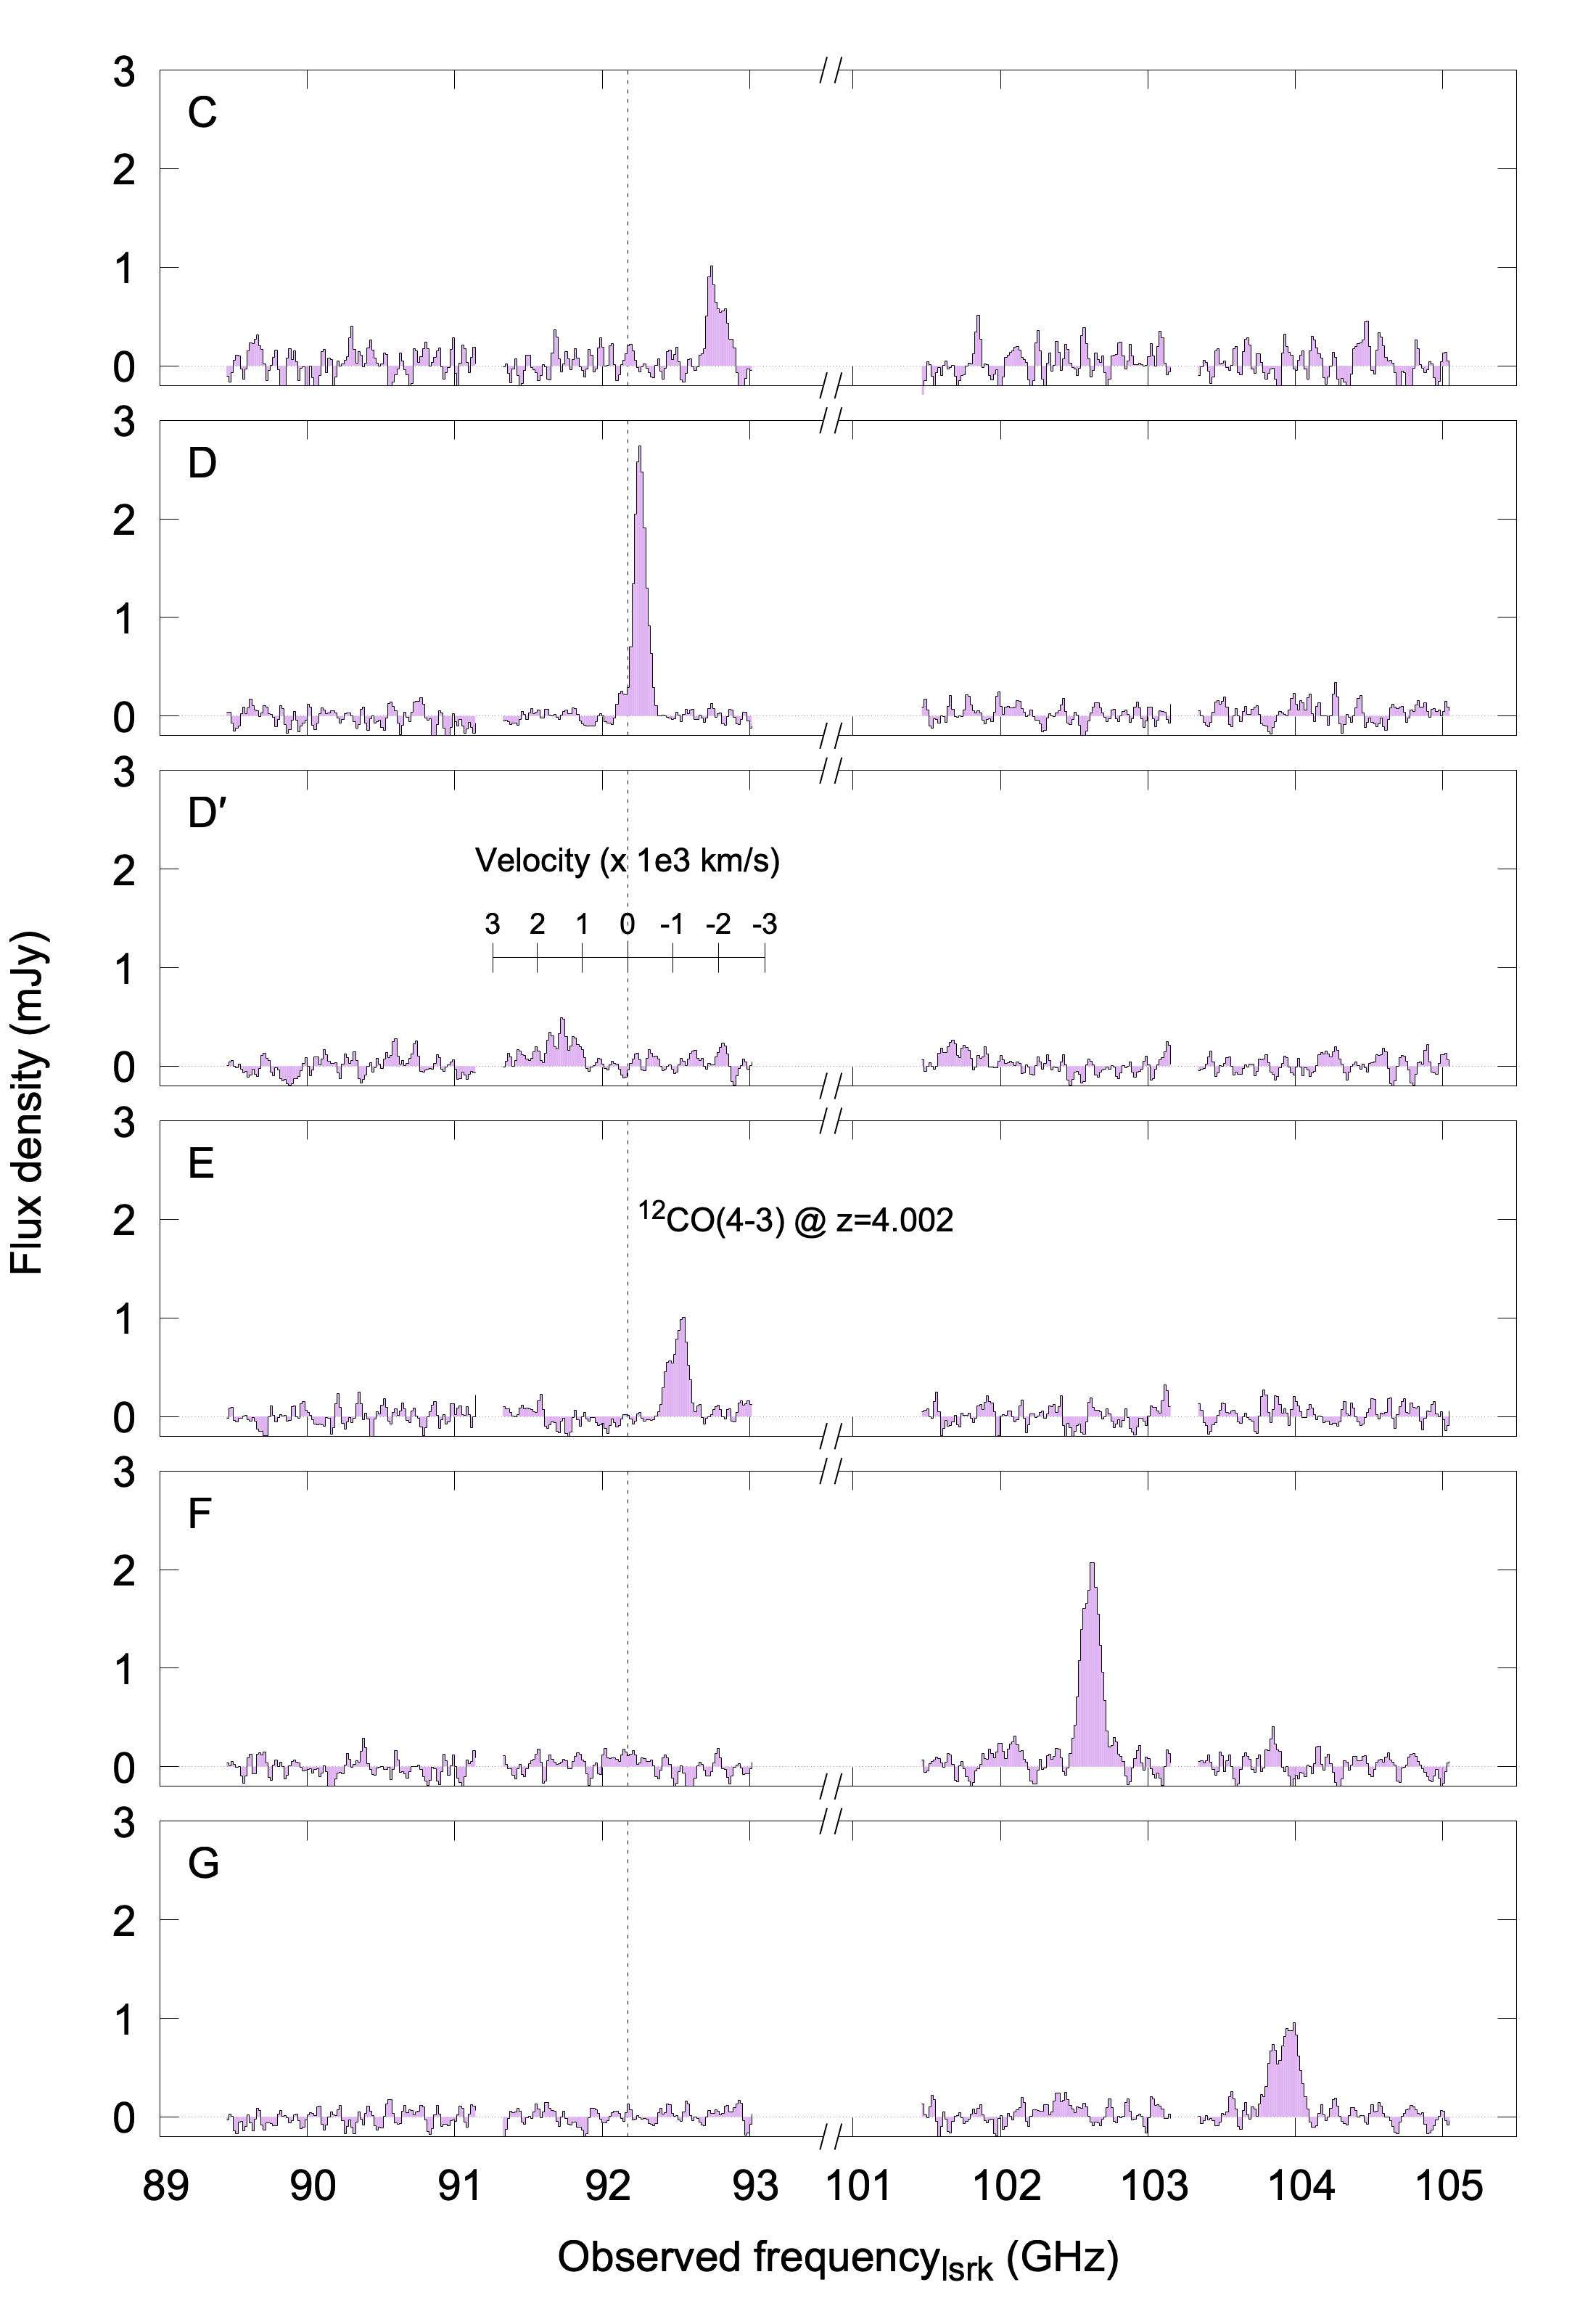
Fig. 3 shows our ALMA spectra of the five line emitters found in the fields of LABOCA sources C–G. Note that the field of LABOCA source C was found to contain two faint continuum sources but the line emitter was found coincident with an even fainter continuum source, detected barely above the 3- confidence level.
For the line emitters in the fields of LABOCA sources C, D and E, the line frequencies are close to that expected for CO(4–3), marked with a vertical dotted line in Fig. 3. We regard these as confirmed members of the DRC protocluster at , along with the ten individual line-emitting components of LABOCA sources A and B identified in Oteo et al. (2018). The basic observational properties of these newly-identified lines — velocity-integrated flux, line width (FWHM) and the velocity offset from the systemic velocity of the cluster — are listed in Table 2.
Lines are also detected in each of LABOCA sources F and G, at 102.6 and 103.9 GHz, respectively, where the frequency offset is such that these sources cannot be associated with the protocluster; the identities of these lines and their associated redshifts are currently unknown.
The resolutions of the ALMA and Spitzer IRAC data are reasonably well matched and enable us to pick out unambiguous near-IR counterparts to the submm/mm continuum emitters trivially.
Except for LABOCA source D, the brightest 97-GHz continuum emitters have obvious IRAC counterparts, as is usually the case for SMGs (e.g. Egami et al., 2004). On the other hand, the emission-line detections — associated with weak 97-GHz continuum emission (sources C, D, E, F, G) — show only faint emission at 3.6 m. This confirms the reality of these line emitters, if it were ever in doubt, and hints that F and G also likely lie at higher redshifts than typical SMGs, .
The faintness of the line emitters in the IRAC 3.6 and 4.5 m filters is commensurate with the other confirmed members of the DRC protocluster, which are similarly faint. Of the galaxies discussed by Oteo et al. (2018), only DRC-5 — the DRC core component without a line detection and therefore most plausibly a foreground galaxy — stands out as being brighter in the near IR.
What is arguably most interesting about these findings is that while ALMA continuum follow-up of LABOCA sources leads to the identification of the brightest mm continuum emitters in each field, they do not necessarily reveal all of the gas-rich galaxies in each field. If they are to be effective, it is clear that future searches for members of protoclusters will need to employ wide-field spectral-line imaging, targeting lines such as 12CO, [C i] and [C ii].
| Name | Part of | ||
|---|---|---|---|
| J2000 | /Jy | DRC? | |
| C | 00:42:33.45 33:44:26.4 | Y | |
| D | 00:42:23.55 33:41:18.4 | Y | |
| E | — | Y | |
| F | 00:42:20.25 33:44:21.9 | N | |
| G | 00:42:12.43 33:45:38.9 | N | |
| H | — | N |
a Several brighter continuum sources, neither associated with line emission (see Figs 1 and 2), can be seen in the field of component C at :42:32.70, 33:44:05.1 J2000 with Jy beam-1 and Jy, and at :42:33.45, 33:44:26.4 J2000 with Jy.
b A bright continuum source, unassociated with line emission (see Figs 1 and 2), can be seen in the field of component E at :42:16.46, 33:41:41.9 J2000 with Jy beam-1 and Jy. The line emitter, which lies at :42:15.40, 33:41:30.6 J2000, has several faint continuum peaks in its vicinity, none brighter than 27 Jy beam-1, and an r.m.s. noise level of around 9 Jy beam-1; we ascribe a limit of around 50 Jy at the confidence level.
c Continuum emission with no coincident line emission (see Figs 1 and 2) can be seen in the field of component F at :42:19.53, 33:44:38.5 J2000 with Jy beam-1 and Jy.
d Unknown line seen at 102.6 GHz.
e Jy beam-1.
f Unknown line seen at 103.9 GHz.
| Name | FWHMCO(4-3) | ||
|---|---|---|---|
| /mJy km s-1 | /km s-1 | /km s-1 | |
| C | |||
| Da | |||
| E |
a The faint emission 3 arcsec from D measures mJy km s-1, km s-1 and km s-1.
3.1 Component D
As well as the five line detections in sources C–E, we tentatively identify an additional line source, henceforth referred to as D′, approximately 3 arcsec (21 kpc) North of D, as can be seen in Figs 1, 2 and 3. The peak flux density of the line is 0.5 mJy beam-1 ( in the zeroth moment map); no associated 97-GHz continuum emission is detected.
Is their small angular separation merely the result of a chance alignment, or could D′ and D be physically associated, e.g. with D′ as a fast outflow from D, or with both undergoing starbursts triggered by a high-velocity fly-by? The close spatial proximity suggests a physical association; on the other hand, the velocity offset between D and D′, of km s-1, where D′ has a velocity close to confirmed cluster members C and E, would appear to rule this out. The emission is relatively compact and does not extend back to D, which argues against the outflow hypothesis. Until further evidence becomes available, we assume that D and D′ are separate cluster members, aligned by chance.
4 Discussion
What have we learnt about the DRC protocluster through the new ALMA observations described here?
4.1 Gas mass estimates
We estimate the molecular gas mass in the components related to the DRC using two methods, via the 3-mm continuum and the CO(4–3) line emission.
The continuum method assumes that the dust is tracing the gas mass — presumed to be predominantly molecular in SMGs — and can either be calibrated empirically against CO(1–0) for an assumed (e.g. Scoville et al., 2016) or used directly to determine a dust mass and hence a gas mass for an assumed gas-to-dust mass ratio, . We convert the observed 3-mm luminosity to rest-frame 850 m assuming a typical dust SED for SMGs with K and (e.g. da Cunha et al., 2015).
For the CO-line method, we calculate the line luminosity and then assume an excitation, , and a CO–H2 conversion factor, . The results and assumptions used are listed in Table 3.
The gas masses inferred from either the 3-mm (97-GHz) dust continuum or CO(4–3) emission are very large (). The continuum observations are less sensitive per unit gas mass than the line observations, which means that in two of the sources (C and E) there is either only a very marginal detection or an upper limit. With our standard assumptions, the masses derived from CO(4–3) are higher on average than those using 3-mm dust continuum (by factors of 2, 1.14 and ). This bias for sources C and E indicates that our standard assumptions are in some way inappropriate and instead may require a higher (0.8), a lower (1.8) or a higher (270), or a combination of these effects.
The cosmic microwave background (CMB) produces a non-negligible radiation field at , where K; this reduces the observed submm/mm flux densities relative to their intrinsic values (e.g. da Cunha et al., 2013; Zhang et al., 2016; Tunnard & Greve, 2017; Jin et al., 2019). Observed 97-GHz flux densities correspond to rest-frame 650 m. We do not have sufficient data to estimate dust temperatures individually for these sources, but if we assume they are bracketed by the global SED for the DRC core galaxies ( K) and the mass-weighted dust temperature assumed in the calculation of gas mass ( K), the correction to the inferred gas and dust masses would be 1.3– due to the dimming effect of the CMB.
The level of CO is 55 K above ground with a critical density, cm-3, in the optically thin case. In lower density regions of the ISM, remote from sites of active star formation, this line will be sub-thermally excited; any emission we see in these SMGs is therefore likely to be dominated by the dense and warm star-forming gas. In the warm and dense gas, the CMB-related dimming correction to CO(4–3) is negligible, in stark contrast to its very significant effect on any sub-thermally excited CO(4–3) emission888A CMB-induced boost to the CO spectral line energy distribution is expected (Zhang et al., 2016), such that might rise at high redshift. Whether due to an observational bias or to the physical effect of the CMB, sources at have higher than this average: for SMGs at –3 (Ivison et al., 2011; Bothwell et al., 2013; Carilli & Walter, 2013), where for G15.141 (Cox et al., 2011), for HFLS3 (Riechers et al., 2013), for GN20 (Carilli et al., 2010) and –0.86 for SPT 234956 (Miller et al., 2018)..
| Name | SFR | ||||
|---|---|---|---|---|---|
| / K | / | / M⊙ | / M⊙ | /M⊙ | |
| km s-1 pc2 | W Hz-1 | yr-1 | |||
| C | 204 | ||||
| Da | 485 | ||||
| E | 230 |
a The faint, broad emission near D has , , and .
Notes: Observed 3-mm luminosities extrapolated to rest-frame using K, . Gas masses from CO assume (Ivison et al., 2011; Bothwell et al., 2013; Carilli & Walter, 2013) and . Gas masses from dust assume , mass-weighted dust temperature, K, and . The luminosities and masses are not corrected for the effects of the CMB (see §4.1 for discussion). We suggest a maximum correction of for the dust properties and while we only expect to see CO(4–3) from warm and dense gas which will not be affected by the CMB dimming.
4.2 SFRs
Determining SFRs from far-IR luminosities is problematic in cases where the 97-GHz flux density is dominated by brighter sources in the field of the line emitters, such as for LABOCA sources C and E, but we can instead estimate the SFRs of the line emitter using their CO(4–3) luminosities, given the strong connection between the luminosity of the dense gas and SFR (Greve et al., 2014; Kennicutt, 1998), , where SFR is sensitive to the assumed IMF, as always.
Comparing these SFR estimates to the gas masses inferred independently from the submm luminosity, we estimate rough, simplistic gas-depletion timescales for the current starburst events in these systems, Myr for component D and Myr for C and E.
Overall, the new components of DRC add modestly to its total SFR, giving a new total, subject to all the usual caveats, of M⊙ yr-1.
4.3 Protocluster mass
Oteo et al. (2018) were able to estimate a mass for the protocluster core from the dynamics of the components identified in that work following the methods of Evrard et al. (2008) and Wang et al. (2016). While there was some uncertainty about whether that region would be virialised at , the limited angular (and therefore physical) extent of the region over which the components with redshifts were identified ( arcsec, so a physical radius of kpc) allowed a plausible estimate of the mass to be determined from the dispersion in the line-of-sight velocities of the components. The mass resulting from consideration of the dynamics was found to be M⊙, roughly higher than the mass estimate derived for the total IR luminosity from all components in A and B, and higher than when assuming a simple uniform spherical distribution of mass encompassing those components and traced by their velocity dispersion.
Extending these dynamical estimates to include the components C, D and E, now confirmed to be at , is far more uncertain. These components are of order 100 arcsec away from the region considered by Oteo et al. — see their Figure 1. This corresponds to a projected physical distance of kpc, or a comoving distance larger. Given the separation and isolation of these components999There is no compelling evidence for coherent motion across the cluster, just a hint of North-South filamentary structure, similar to those seen in the SSA 22 field by Umehata et al. (2019), where we also note that the Ly blob reported by Oteo et al. (2018) also runs North–South., it seems unlikely at this redshift that these components are in a virialised system with those studied by Oteo et al.. Looking at the velocity offsets relative to the assumed systemic velocity, , in Table 2 here and Table 1 of Oteo et al., three of the four line emitters confirmed in the current work have line-of-sight offsets of –2,000 km s-1 while eight of the ten components with measured redshifts in Oteo et al. are within km s-1. This could be interpreted as an order of magnitude increase in mass for a virialised system at 100-arcsec scales relative to that on 20-arcsec scales — so a mass of several M⊙, similar or higher than that of the current-day Virgo cluster, already in place at . This seems unlikely, however.
It is more likely that these components are embedded in dark-matter halos that will eventually merge with the (more massive) core traced by components A and B to form a significantly more massive cluster at lower redshift. Given their proximity to the core, if we assume an infall velocity of order 1,000 km s-1, and that these halos have detached from the Hubble flow by , they should start to interact with the core on a timescale of Gyr given the distance they need to travel. The look-back time to is 11.5 Gyr, so even if the halos have not yet fully detached from the universal expansion (unlikely given the simulations reported in, e.g., Chiang et al., 2013), the halos ought to have merged into a larger system by today, and likely were heading towards virialisation by .
4.4 On the timing puzzle
If these newly confirmed components of DRC have yet to interact with the core, and will not do so for another Gyr, it is interesting to consider the implications of all 14 DRC components simultaneously passing through a highly active but comparatively short-lived phase of star formation.
If there is no causal connection between the activity in each component, then perhaps the simplest explanation is that we are seeing the tip of the iceberg in terms of star formation (and gas available for future star formation) in this system.
If there is significant star-formation activity across this entire region, at any point in time we are only sensitive to the most extreme starbursts — the DSFGs. Given the likely stochastic nature of this activity, driven in large part by the merging of comparatively massive gas-rich galaxies that give rise to luminous DSFGs, the galaxies detectable by observations as sensitive as ours would likely change on timescales of a few Myr. In the densest regions of DRC, which we can assume are pinpointed by LABOCA components A and B, there would always be detectable DSFGs. In less populous sub-halos such as those marked by components C, D and E, we might see just one or two DSFGs, or none. Were we able to carry out an equivalent set of observations in several 10s of Myr, these components might be detectable and C, D and E may have vanished. In that case, it is likely that there are a significant number of other components to this protocluster that at the time of observation do not have sufficiently vigorous star-forming galaxies within them to be detected via their mm/submm continuum emission.
This suggestion is backed up by our remarkable finding that the majority of newly confirmed members of the DRC protocluster are not the brightest 3-mm continuum emitters in their respective field, and are considerably less far-IR luminous than we expected.
We conclude from this that deep, wide-field searches for atomic or molecular gas in such clusters may uncover a considerable number of gas-rich but relatively far-IR-faint galaxies. Indeed, if such searches are sensitive to emission on -arcsec scales, via single-dish facilities or arrays with short baselines, the scale of the underlying gas reservoir may eventually be revealed.
5 Summary and concluding remarks
We report new ALMA observations of the protocluster known as the Distant Red Core, or DRC, selected initially by Ivison et al. (2016) via its extreme far-IR colours, and reported as a site of intense cluster-scale star formation by Oteo et al. (2018), Lewis et al. (2018) and Long et al. (2020).
Of the six LABOCA sources reported by Lewis et al. within 3 arcmin of the ten central, confirmed members of the DRC, our ALMA imaging spectroscopy confirms four new members of the protocluster at (two towards a single LABOCA source), while two are shown via robust line detections to lie at other, unknown redshifts along the line of sight, and one is shown to be a blank submm field. This rate of associations is in line with the over-density predicted by Lewis et al. (2018), whose individual photometric redshift estimates are shown to have been useful.
We consider the implications of all 14 confirmed DRC components passing simultaneously through a highly active but comparatively short-lived phase of star formation. Since it is difficult to envisage a causal connection between the activity in components separated by 100s of kpc, the simplest explanation is that we are seeing the tip of the iceberg in terms of star formation (and gas available for future star formation). It is likely, then, that other components of this protocluster are not forming stars with sufficient vigour at the time of observation to be detected via their mm/submm continuum emission. This suggestion is backed up by our remarkable finding that the majority of newly confirmed members of the DRC protocluster are not the brightest 3-mm continuum emitters in their immediate vicinity. Thus while ALMA continuum follow-up of LABOCA sources leads to the identification of the brightest mm continuum emitters in each field, they do not necessarily reveal all of the gas-rich galaxies. To hunt effectively for members of protoclusters, we need to employ spectral-line imaging, targeting lines such as 12CO, [C i] and [C ii]. Searching wide and deep for atomic or molecular gas in such clusters may uncover a considerable number of gas-rich but relatively far-IR-faint galaxies. If such searches are sensitive on -arcsec scales, via arrays with short baselines or single-dish facilities, the true scale of the underlying gas reservoir may eventually be revealed.
Acknowledgements
We acknowledge contributions from Alex Lewis and thank Padelis Papadopoulos for pointing out the erroneous CMB correction in Oteo et al. (2018).
This paper makes use of the following ALMA data: ADS/JAO.ALMA#2017.1.00202.S. ALMA is a partnership of ESO (representing its member states), NSF (USA) and NINS (Japan), together with NRC (Canada), MOST and ASIAA (Taiwan), and KASI (Republic of Korea), in cooperation with the Republic of Chile. The Joint ALMA Observatory is operated by ESO, AUI/NRAO and NAOJ.
This work is based in part on observations made with the Spitzer Space Telescope, which is operated by the Jet Propulsion Laboratory, California Institute of Technology under a contract with NASA.
Funded by the Deutsche Forschungsgemeinschaft (DFG, German Research Foundation) under Germany’s Excellence Strategy — EXC-2094 — 390783311.
References
- Aravena et al. (2016) Aravena M., et al., 2016, ApJ, 833, 68
- Asboth et al. (2016) Asboth V., et al., 2016, MNRAS, 462, 1989
- Balashev et al. (2017) Balashev S. A., et al., 2017, MNRAS, 470, 2890
- Béthermin et al. (2017) Béthermin M., et al., 2017, A&A, 607, A89
- Bothwell et al. (2013) Bothwell M. S., et al., 2013, MNRAS, 429, 3047
- Carilli & Walter (2013) Carilli C. L., Walter F., 2013, ARA&A, 51, 105
- Carilli et al. (2010) Carilli C. L., et al., 2010, ApJ, 714, 1407
- Casey et al. (2015) Casey C. M., et al., 2015, ApJ, 808, L33
- Chapman et al. (2009) Chapman S. C., Blain A., Ibata R., Ivison R. J., Smail I., Morrison G., 2009, ApJ, 691, 560
- Chiang et al. (2013) Chiang Y.-K., Overzier R., Gebhardt K., 2013, ApJ, 779, 127
- Chiang et al. (2017) Chiang Y.-K., Overzier R. A., Gebhardt K., Henriques B., 2017, ApJ, 844, L23
- Cicone et al. (2018) Cicone C., et al., 2018, ApJ, 863, 143
- Cox et al. (2011) Cox P., et al., 2011, ApJ, 740, 63
- da Cunha et al. (2013) da Cunha E., et al., 2013, ApJ, 766, 13
- da Cunha et al. (2015) da Cunha E., et al., 2015, ApJ, 806, 110
- Dannerbauer et al. (2014) Dannerbauer H., et al., 2014, A&A, 570, A55
- De Breuck et al. (2004) De Breuck C., et al., 2004, A&A, 424, 1
- Duivenvoorden et al. (2018) Duivenvoorden S., et al., 2018, MNRAS, 477, 1099
- Egami et al. (2004) Egami E., et al., 2004, ApJS, 154, 130
- Evrard et al. (2008) Evrard A. E., et al., 2008, ApJ, 672, 122
- Fudamoto et al. (2017) Fudamoto Y., et al., 2017, MNRAS, 472, 2028
- Geach et al. (2017) Geach J. E., et al., 2017, MNRAS, 465, 1789
- Gómez-Guijarro et al. (2019) Gómez-Guijarro C., et al., 2019, ApJ, 872, 117
- Greve et al. (2005) Greve T. R., et al., 2005, MNRAS, 359, 1165
- Greve et al. (2014) Greve T. R., et al., 2014, ApJ, 794, 142
- Griffin et al. (2010) Griffin M. J., et al., 2010, A&A, 518, L3+
- Hodge et al. (2013) Hodge J. A., Carilli C. L., Walter F., Daddi E., Riechers D., 2013, ApJ, 776, 22
- Holland et al. (2013) Holland W. S., et al., 2013, MNRAS, 430, 2513
- Ivison et al. (2000) Ivison R. J., Dunlop J. S., Smail I., Dey A., Liu M. C., Graham J. R., 2000, ApJ, 542, 27
- Ivison et al. (2011) Ivison R. J., Papadopoulos P. P., Smail I., Greve T. R., Thomson A. P., Xilouris E. M., Chapman S. C., 2011, MNRAS, 412, 1913
- Ivison et al. (2013) Ivison R. J., et al., 2013, ApJ, 772, 137
- Ivison et al. (2016) Ivison R. J., et al., 2016, ApJ, 832, 78
- Ivison et al. (2019) Ivison R. J., Page M. J., Cirasuolo M., Harrison C. M., Mainieri V., Arumugam V., Dudzevičičtė U., 2019, MNRAS, 489, 427
- Jin et al. (2019) Jin S., et al., 2019, ApJ, 887, 144
- Kennicutt (1998) Kennicutt Jr. R. C., 1998, ApJ, 498, 541
- Lewis et al. (2018) Lewis A. J. R., et al., 2018, ApJ, 862, 96
- Litke et al. (2019) Litke K. C., et al., 2019, ApJ, 870, 80
- Long et al. (2020) Long A. S., et al., 2020, arXiv e-prints, p. arXiv:2003.13694
- Miller et al. (2018) Miller T. B., et al., 2018, Nature, 556, 469
- Motte et al. (2018) Motte F., et al., 2018, Nature Astronomy, 2, 478
- Muldrew et al. (2015) Muldrew S. I., Hatch N. A., Cooke E. A., 2015, MNRAS, 452, 2528
- Negrello et al. (2017) Negrello M., et al., 2017, MNRAS, 470, 2253
- Oteo et al. (2016) Oteo I., Zwaan M. A., Ivison R. J., Smail I., Biggs A. D., 2016, ApJ, 822, 36
- Oteo et al. (2017a) Oteo I., et al., 2017a, preprint, (arXiv:1709.04191)
- Oteo et al. (2017b) Oteo I., Zwaan M. A., Ivison R. J., Smail I., Biggs A. D., 2017b, ApJ, 837, 182
- Oteo et al. (2018) Oteo I., et al., 2018, ApJ, 856, 72
- Péroux et al. (2019) Péroux C., et al., 2019, MNRAS, 485, 1595
- Pilbratt et al. (2010) Pilbratt G. L., et al., 2010, A&A, 518, L1+
- Priddey et al. (2008) Priddey R. S., Ivison R. J., Isaak K. G., 2008, MNRAS, 383, 289
- Ragone-Figueroa et al. (2018) Ragone-Figueroa C., Granato G. L., Ferraro M. E., Murante G., Biffi V., Borgani S., Planelles S., Rasia E., 2018, MNRAS, 479, 1125
- Riechers et al. (2013) Riechers D. A., et al., 2013, Nature, 496, 329
- Riechers et al. (2017) Riechers D. A., et al., 2017, ApJ, 850, 1
- Romano et al. (2017) Romano D., Matteucci F., Zhang Z.-Y., Papadopoulos P. P., Ivison R. J., 2017, MNRAS, 470, 401
- Romano et al. (2019) Romano D., Matteucci F., Zhang Z.-Y., Ivison R. J., Ventura P., 2019, MNRAS, 490, 2838
- Schneider et al. (2018) Schneider F. R. N., et al., 2018, Science, 359, 69
- Scoville et al. (2016) Scoville N., et al., 2016, ApJ, 820, 83
- Siringo et al. (2009) Siringo G., et al., 2009, A&A, 497, 945
- Stevens et al. (2003) Stevens J. A., et al., 2003, Nature, 425, 264
- Stevens et al. (2004) Stevens J. A., Page M. J., Ivison R. J., Smail I., Carrera F. J., 2004, ApJ, 604, L17
- Tacconi et al. (2018) Tacconi L. J., et al., 2018, ApJ, 853, 179
- Thomas et al. (2010) Thomas D., Maraston C., Schawinski K., Sarzi M., Silk J., 2010, MNRAS, 404, 1775
- Tunnard & Greve (2017) Tunnard R., Greve T. R., 2017, ApJ, 849, 37
- Umehata et al. (2015) Umehata H., et al., 2015, ApJ, 815, L8
- Umehata et al. (2019) Umehata H., et al., 2019, Science, 366, 97
- Veilleux et al. (2013) Veilleux S., et al., 2013, ApJ, 776, 27
- Veilleux et al. (2017) Veilleux S., Bolatto A., Tombesi F., Meléndez M., Sturm E., González-Alfonso E., Fischer J., Rupke D. S. N., 2017, ApJ, 843, 18
- Wang et al. (2016) Wang T., et al., 2016, ApJ, 828, 56
- Zavala et al. (2018) Zavala J. A., et al., 2018, Nature Astronomy, 2, 56
- Zhang et al. (2016) Zhang Z.-Y., Papadopoulos P. P., Ivison R. J., Galametz M., Smith M. W. L., Xilouris E. M., 2016, R. Soc. open sci., 3, 160025
- Zhang et al. (2018) Zhang Z.-Y., Romano D., Ivison R. J., Papadopoulos P. P., Matteucci F., 2018, Nature, 558, 260