Market Graph Clustering Via QUBO and Digital Annealing
Abstract
Our goal is to find representative nodes of a market graph that best replicate the returns of a broader market graph (index), a common task in the financial industry. We model our reference index as a market graph and express the index tracking problem in a quadratic K-medoids form. We take advantage of a purpose built hardware architecture, the Fujitsu Digital Annealer, to circumvent the NP-hard nature of the problem and solve our formulation efficiently. In this article, we combine three separate areas of the literature, market graph models, K-medoid clustering and quadratic binary optimization modeling, to formulate the index-tracking problem as a quadratic K-medoid graph-clustering problem. Our initial results show we accurately replicate the returns of a broad market index, using only a small subset of its constituent assets. Moreover, our quadratic formulation allows us to take advantage of recent hardware advances, to overcome the NP-hard nature of the problem.
1 Introduction
Our work is an empirical implementation of the K-medoid clustering technique expressed as a quadratic unconstrained binary optimization model (QUBO) and applied to market graphs. It is inspired by the seminal work of Boginski et al [6, 8], Cornuéjols et al. [13] and that of Bauckhage et al. [4]. We combine these pieces of complementary but disjoint work, to formulate the index-tracking problem as a QUBO K-medoid clustering of a broader market graph problem.
Graph clustering is an unsupervised learning task, consisting of assigning common labels to vertices deemed similar. It has found applications in many areas. Chemistry, biology, social-networks and finance are a few examples where graph clustering has been applied. However, while there are many competing techniques, the graph clustering problem is NP-hard, which limits its scope of application.
QUBO formulations of many mathematical problems have recently gained in interest. This recent spike in interest is, in no small part, due to recent advances in computer hardware and the availability of purpose-built hardware for their solution that circumvent the NP-hard nature of the problem. Examples of this novel hardware are Fujitsu’s Digital Annealer (DA) and D-Wave’s Quantum Annealer.
Graphs have recently been introduced as models of the stock market. In addition, clustering of stock market data is a longstanding focus of interest for both practitioners and academics. It has been used for various purposes, like risk management and portfolio diversification, for example. Index-tracking is another longstanding interest in finance. It consists of building tracking-portfolios whose returns follow a broader index’s return, but with a subset of stocks. Some authors in the field have used clustering for the purpose of index-tracking. Their methods identify exemplars of subsets of an index and construct tracking-portfolios consisting of only those exemplars.
Our initial results are very encouraging. Our tests show we accurately replicate the returns of a broad market index, using only a small subset of its constituent assets. Moreover, our QUBO formulation allows us to take advantage of recent hardware advances, to overcome the NP-hard nature of the problem.
2 Previous Work
Our work lies at the intersection of graph models of the stock markets, clustering, combinatorial optimization (QUBO) and index tracking. In this section, we briefly review these four areas of research. Our goal is not to provide the reader with a detailed review of the state of the art in these very broad fields, but rather to focus specifically on their relevance to the work in this article, in order to put it in context.
The use of graphs as models of the stock market is initially introduced in the literature by the very extensive work of Boginski et al. [6, 7, 10, 8, 9]. While different methods have been suggested for determining edge-weights, the idea is to model stocks as vertices and assign edge weights proportional to their returns correlations.
Other authors have also followed up on and expanded this work by studying graph dynamics over time [3, 20] and examined methods for building the graph [5, 21, 19]. In fact, to this day, the topic of graphs as a model for equity markets remains a subject of discussion in the literature [1, 23].
Graph clustering is the process of assigning common labels to vertices deemed similar. It has a long history in the literature. A thorough review of the graph clustering literature is beyond the scope of this article. For a very comprehensive view of the field, we refer the reader to the foundational work of Schaeffer [26], Fortunato [14] and the recent contribution by Fortunato and Hric [15].
The link between clustering and portfolio construction is of particular relevance to the work in our article [13, 12, 11, 18, 27, 25]. Although not focused specifically on graph clustering, Cornuéjols et al. present a K-medoid formulation for index-tracking [13]. These authors use the standard K-medoid technique [17] to find ‘’ representative stocks that compose a portfolio that replicates a broader index.
3 Methods
We begin with a market graph consisting of stocks that have been constituents of the Standard and Poors 500 index (SP500) for every year since 2014. We apply a K-medoid index-tracking technique to find ‘’ exemplars that will form our tracking portfolio. Finally, to take advantage of fast purpose-built computer hardware, the Fujitsu DA, we express the K-medoid problem as a QUBO.
3.1 Market Graph
We represent our universe of stocks as a complete weighted graph, where edge weights represent the association between stocks ‘’ and ‘’. These weights are defined using the Pearson correlation coefficient of the log daily returns,
For each year in our study, edge weights are recomputed annually, using the previous year’s daily returns. In modeling the market in this way, our investment universe is modeled as a complete weighted graph, with no self-loops (since ).
To be consistent with the QUBO formulation of Bauckhage et al. [4], we convert our adjacency (distance) matrix into a more robust matrix , with the elements . We note that this formulation requires all-pairs distances () be known, which is why we use a complete graph representation.
3.2 QUBO Model
Putting it all together, we formulate our K-medoid problem of finding a portfolio of exemplars to replicate the returns of the constituents of the SP500 as
| (1) | ||||
Our model (1) consists decision variables, if node is an exemplar node and 0 otherwise. We follow the example of Bauckhage et al. [4] and set the parameters , , . (For more details on this QUBO formulation, we refer the reader to the original work of Bauckhage et al. [4].)
3.3 The Fujitsu DA: Purpose-Built Hardware
To circumvent the NP-hard nature of the clustering problem, we use purpose built architecture, the Fujitsu DA. The DA provides fast computation and is designed specifically for combinatorial optimization problems expressed in QUBO form [2, 24].
All our computations for the minimization of the model described in Section 3.2 were done using this architecture. More specifically, these computations were done using hardware built exclusively for the University of Toronto’s research environment.
4 Numerical Experiments
We use our K-medoid technique to construct four index-tracking portfolios, one for each year in our sample (2016-19). For each year, we use the previous year’s returns to compute stock-to-stock distances, build a new market graph and corresponding matrix . We then optimize the QUBO model, using the DA, to obtain a tracking portfolio.
To assess tracking accuracy, we use tracking-error and “beta to the index”, both measured with respect to the full SP500 in each year, as per industry practice. For each year, we compute the differences between the daily log returns of the SP500 benchmark and of the tracking portfolio. We calculate the standard deviation of the differences to obtain the annual tracking-error. We also regress index returns on market returns to obtain the “beta” of the tracking portfolio, the slope of the regression line.
4.1 Performance Measure: Tracking-Error
Tracking-error is the standard deviation of the differences between each pair of observations at a given time point (daily in this case). We denote it as and compute it as
4.2 Performance Measure: “beta”
The “beta” of the portfolio is the slope coefficient of the regression of its returns on market returns. A portfolio that tracks the index perfectly has a “beta” of one. The regression model we fit to obtain the “beta” is
4.3 Empirical Results
Tracking error, the “beta” and associated t-statistic are reported for each year, in Table 1.
| Year | Tracking Error | Beta | t-stat |
|---|---|---|---|
| 2016 | 0.005 | 1.167 | 29.271 |
| 2017 | 0.005 | 1.068 | 15.482 |
| 2018 | 0.005 | 0.902 | 29.996 |
| 2019 | 0.005 | 0.691 | 18.990 |
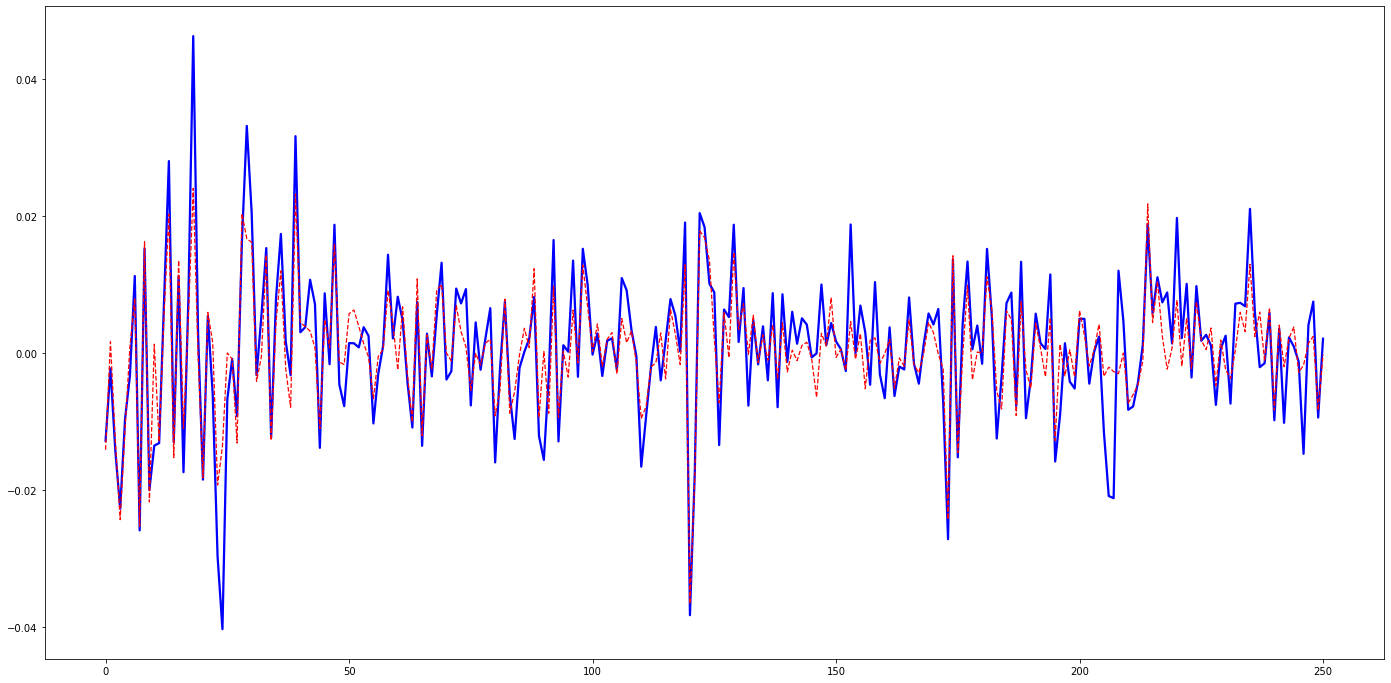
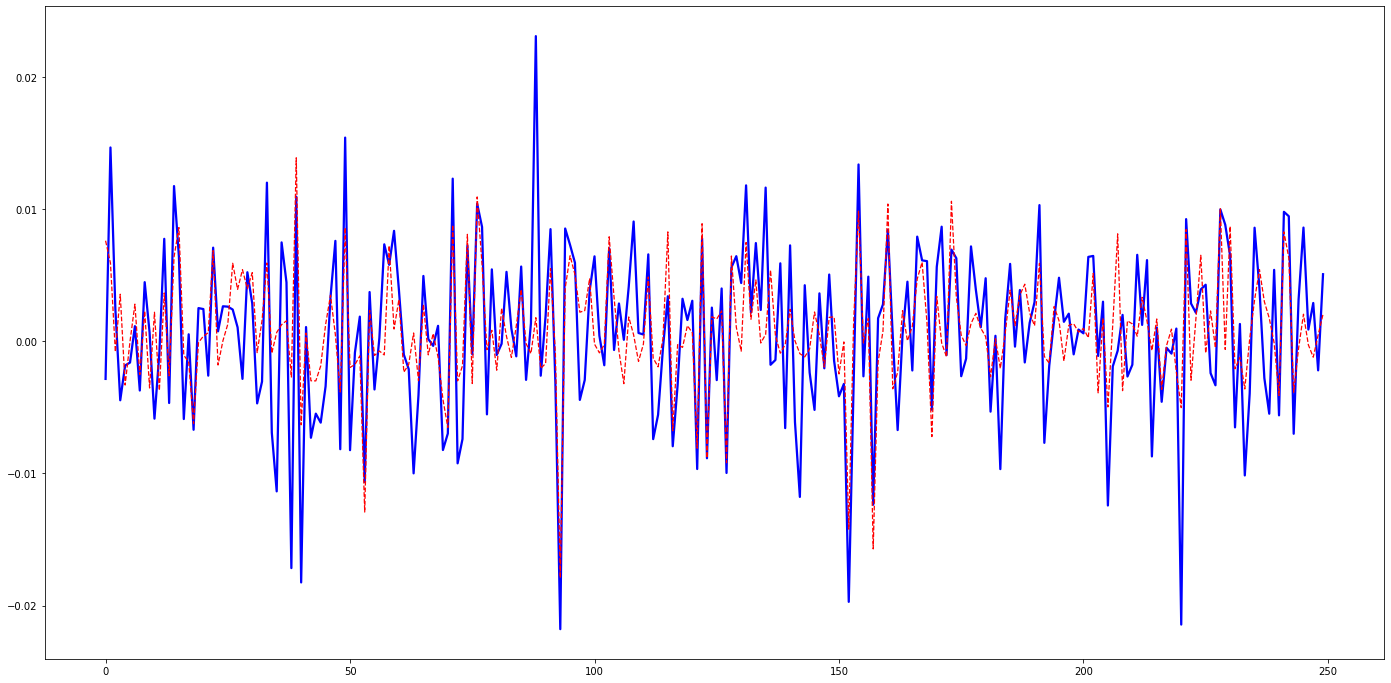
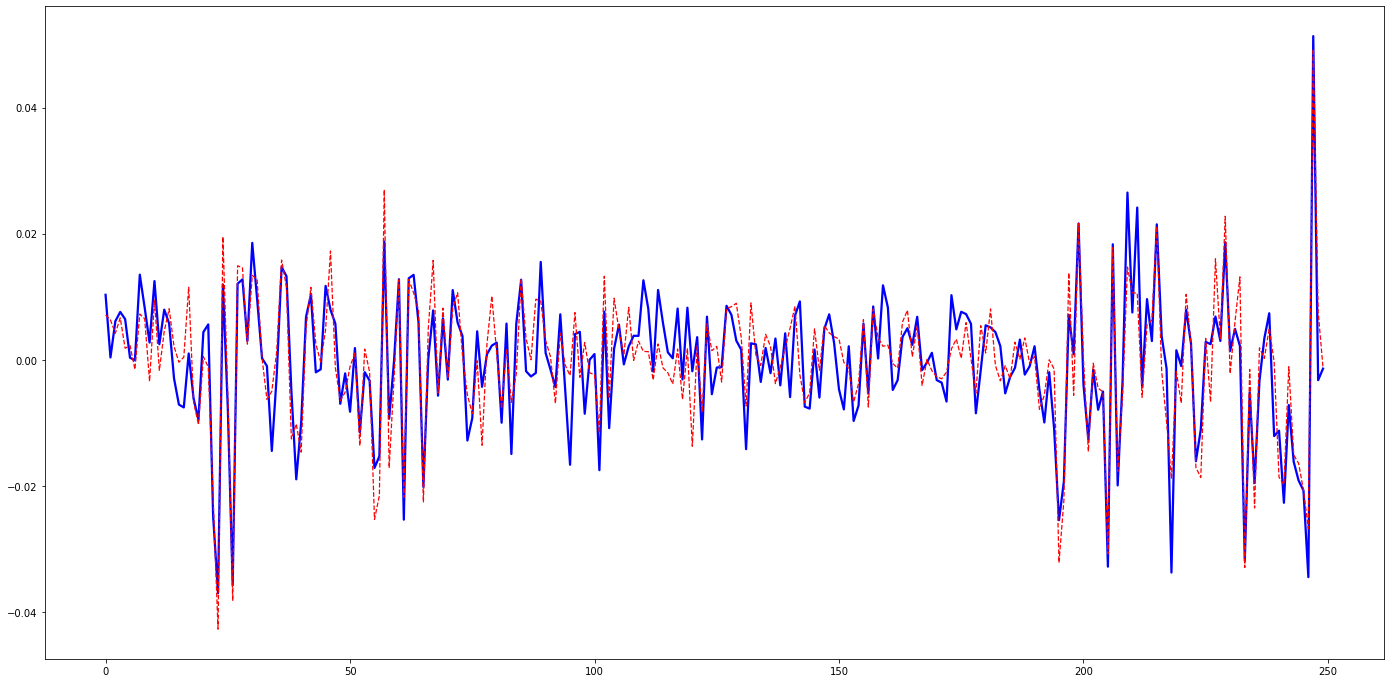
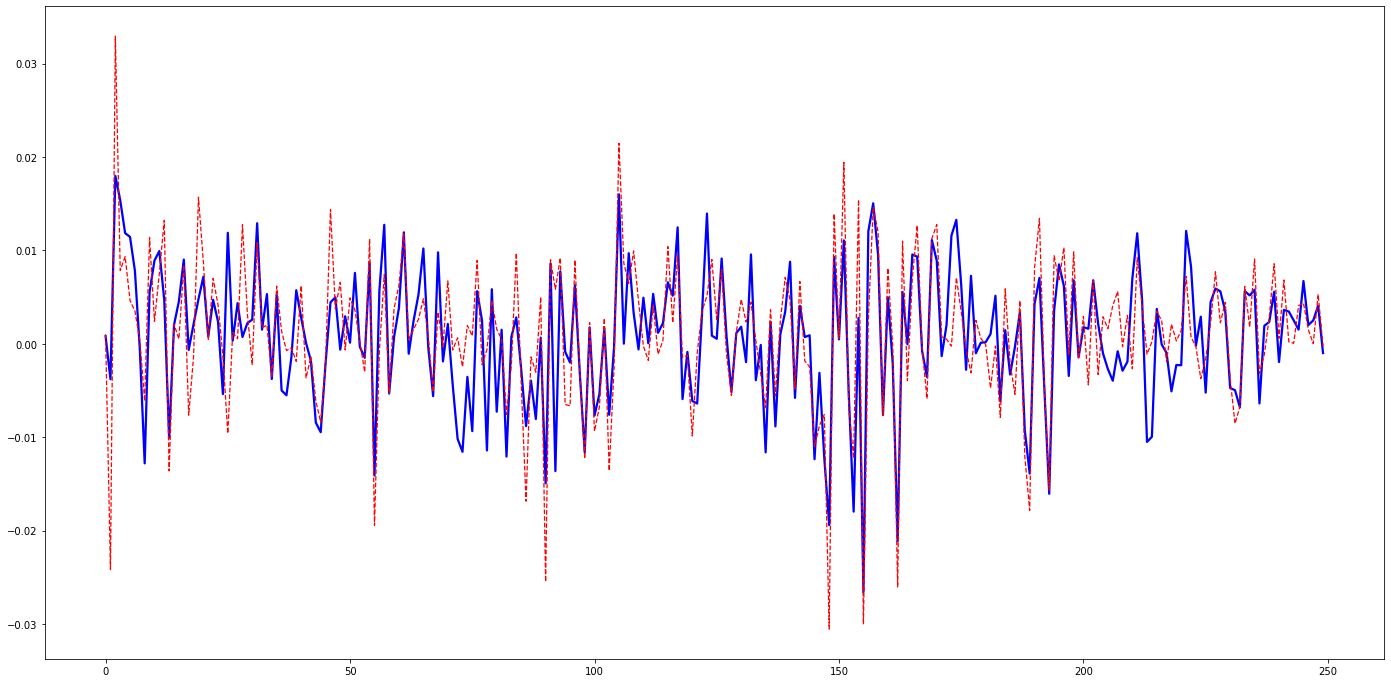
Daily log-returns for the replicating portfolio (solid blue line) and SP500 (dotted red line) are shown in Figure 1.
5 Conclusion and Future Work
Our results show that a QUBO formulation of the K-medoid problem can be successfully used to replicate a broad market index, using just a few assets. Using only a subset of ten assets, we are able to track the SP500 daily returns with a tracking error of less than 1%.
On the empirical side, future work will focus on alternate techniques for building the market graph and determining the optimal cardinality of the tracking subset. From a mathematical and computational point of view, we also intend to investigate alternate problem formulations and larger scale optimization.
Acknowledgements
We would like to thank Fujitsu Laboratories Ltd and Fujitsu Consulting (Canada) Inc for providing financial support and access to the Digital Annealer at the University of Toronto.
References
- [1] Joshua Abrams. Analysis of equity markets: A graph theory approach, 09 2016.
- [2] Maliheh Aramon, Gili Rosenberg, Elisabetta Valiante, Toshiyuki Miyazawa, Hirotaka Tamura, and Helmut G. Katzgraber. Physics-Inspired Optimization for Quadratic Unconstrained Problems Using a Digital Annealer. Frontiers in Physics, 7, Apr 2019.
- [3] Argimiro Arratia and Alejandra Cabaña. A graphical tool for describing the temporal evolution of clusters in financial stock markets. Computational Economics, 41, 11 2011.
- [4] Christian Bauckhage, Nico Piatkowski, Rafet Sifa, Dirk Hecker, and Stefan Wrobel. A QUBO formulation of the k-medoids problem. In Robert Jäschke and Matthias Weidlich, editors, Proceedings of the Conference on ”Lernen, Wissen, Daten, Analysen”, Berlin, Germany, September 30 - October 2, 2019, volume 2454 of CEUR Workshop Proceedings, pages 54–63. CEUR-WS.org, 2019.
- [5] Grigory Bautin, Valery A. Kalyagin, Alexander Koldanov, Petr Koldanov, and Panos Pardalos. Simple measure of similarity for the market graph construction. Computational Management Science, 10, 06 2013.
- [6] Vladimir Boginski, Sergiy Butenko, and Panos M. Pardalos. On structural properties of the market graph, 2003.
- [7] Vladimir Boginski, Sergiy Butenko, and Panos M. Pardalos. Network models of massive datasets. Comput. Sci. Inf. Syst., 1(1):75–89, 2004.
- [8] Vladimir Boginski, Sergiy Butenko, and Panos M. Pardalos. Statistical analysis of financial networks. Comput. Stat. Data Anal., 48(2):431–443, 2005.
- [9] Vladimir Boginski, Sergiy Butenko, and Panos M. Pardalos. Mining market data: A network approach. Comput. Oper. Res., 33(11):3171–3184, 2006.
- [10] Vladimir Boginski, Sergyi Butenko, and Panos M. Pardalos. Network-Based Techniques In The Analysis Of The Stock Market. In Panos M Pardalos, Athanasios Migdalas, and George Baourakis, editors, Supply Chain And Finance, World Scientific Book Chapters, chapter 1, pages 1–14. World Scientific Publishing Co. Pte. Ltd., May 2004.
- [11] Vladimir Boginski, Sergyi Butenko, Oleg Shirokikh, Svyatoslav Trukhanov, and Jaime Gil Lafuente. A network-based data mining approach to portfolio selection via weighted clique relaxations. Annals of Operations Research, 216:23–34, 05 2014.
- [12] Chen Chen and Roy H. Kwon. Robust portfolio selection for index tracking. Computers & Operations Research, 39(4):829–837, April 2012.
- [13] Gérard Cornuéjols and Reha Tutuncu. Optimization Methods in Finance. Mathematics, Finance and Risk. Cambridge University Press, 2006.
- [14] Santo Fortunato. Community detection in graphs. Physics Reports, 486:75–174, February 2010.
- [15] Santo Fortunato and Darko Hric. Community detection in networks: A user guide. ArXiv e-prints, November 2016.
- [16] Fred Glover, Gary Kochenberger, and Yu Du. A Tutorial on Formulating and Using QUBO Models. arXiv e-prints, page arXiv:1811.11538, June 2018.
- [17] Trevor Hastie, Robert Tibshirani, and Jerome Friedman. The Elements of Statistical Learning, Second Edition: Data Mining, Inference, and Prediction. Springer Series in Statistics. Springer, 2nd ed. 2009. edition, 2009.
- [18] Valery A. Kalyagin, Alexander Koldanov, Petr Koldanov, and Victor Zamaraev. Market graph and Markowitz model. Optimization in Science and Engineering: In Honor of the 60th Birthday of Panos M. Pardalos, pages 293–306, 07 2014.
- [19] Valery A. Kalyagin, Petr Koldanov, and Panos Pardalos. Optimal decision for the market graph identification problem in sign similarity network. Annals of Operations Research, 266, 07 2018.
- [20] Anton Kocheturov, Mikhail Batsyn, and Panos M. Pardalos. Dynamics of cluster structures in a financial market network. Physica A: Statistical Mechanics and its Applications, 413:523 – 533, 2014.
- [21] Alexander P. Koldanov, Petr A. Koldanov, Valery A. Kalyagin, and Panos M. Pardalos. Statistical procedures for the market graph construction. Computational Statistics & Data Analysis, 68:17 – 29, 2013.
- [22] Andrew Lucas. Ising formulations of many NP problems. Frontiers in Physics, 2:5, Feb 2014.
- [23] Gautier Marti, Frank Nielsen, Mikołaj Bińkowski, and Philippe Donnat. A review of two decades of correlations, hierarchies, networks and clustering in financial markets. arXiv e-prints, page arXiv:1703.00485, December 2019.
- [24] Satoshi Matsubara, Motomu Takatsu, Toshiyuki Miyazawa, Takayuki Shibasaki, Yasuhiro Watanabe, Kazuya Takemoto, and Hirotaka Tamura. Digital annealer for high-speed solving of combinatorial optimization problems and its applications. In 2020 25th Asia and South Pacific Design Automation Conference (ASP-DAC), pages 667–672, 2020.
- [25] Justo Puerto, Moisés Rodríguez-Madrena, and Andrea Scozzari. Clustering and portfolio selection problems: A unified framework. Computers & Operations Research, 117:104891, 2020.
- [26] Satu Elisa Schaeffer. Survey: Graph clustering. Comput. Sci. Rev., 1(1):27–64, August 2007.
- [27] Dexiang Wu, Roy H. Kwon, and Giorgio Costa. A constrained cluster-based approach for tracking the s&p 500 index. International Journal of Production Economics, 193:222–243, November 2017.