Particle Diffusivity and Free-Energy Profiles in Inhomogeneous Hydrogel Systems from Time-Resolved Penetration Profiles
Abstract
A combined experimental/theoretical method to simultaneously determine diffusivity and free-energy profiles of particles that penetrate into inhomogeneous hydrogel systems is presented. As the only input, arbitrarily normalized concentration profiles from fluorescence intensity data of labeled tracer particles for different penetration times are needed. The method is applied to dextran molecules of varying size which penetrate into hydrogels of polyethylene-glycol (PEG) chains with different lengths that are covalently cross-linked by hyperbranched polyglycerol (hPG) hubs. Extracted dextran bulk diffusivities agree well with fluorescence correlation spectroscopy data obtained separately. Scaling laws for dextran diffusivities and free energies inside the hydrogel are identified as a function of the dextran mass. An elastic free-volume model that includes dextran as well as PEG linker flexibility describes the repulsive dextran-hydrogel interaction free energy, which is of steric origin, quantitatively and furthermore suggests that the hydrogel mesh-size distribution is rather broad and particle penetration is dominated by large hydrogel pores. Particle penetration into hydrogels is for steric particle-hydrogel interactions thus suggested to be governed by an elastic size-filtering mechanism that involves the tail of the hydrogel pore-size distribution.
These two authors contributed equally to this work. \altaffiliationThese two authors contributed equally to this work. {tocentry}
![[Uncaptioned image]](/html/2006.10676/assets/x1.png)
1 Introduction
The penetration of particles into hydrogels is relevant for technological applications 1, 2, drug delivery 3 and for biological systems such as biofilms 4, the extracellular matrix 5 and mucus 6. Mucus, which is the most common biological hydrogel, lines the epithelial tissues of different organs, such as the respiratory, gastrointestinal and urogenital tracts. Mucus is mainly composed of mucins, which are glycoproteins of varying length that absorb large amounts of water and thereby lend mucus its hydrogel nature, and additional components such as enzymes and ions 7. Mucins are relevant in the cell signaling context and presumably also play a role in the development of cancer 8. But primarily, mucus is a penetration barrier against pathogens, e.g. virions or bacteria, while it allows the permeation of many non-pathogens, e.g. nutrients, that are absorbed through the mucosa of the small intestine 9. Studies have suggested that, based on the type of mucus, different mechanisms give rise to the protective barrier function 10, 11, in addition to the advective transport of pathogens through mucus shedding or clearance 12, 13, which is not considered here. One typically distinguishes steric size-filtering mechanisms from interaction-filtering mechanisms 6, 14, the latter presumably play a major role in the defense of organisms against pathogens since they allow for precise regulation of the passage of wanted and unwanted particles and molecules 15, 16. Recent studies demonstrated that attractive electrostatic interactions reduce particle diffusivity inside hydrogels substantially and much more than repulsive electrostatic interactions 17, 18 and that salt concentration and the distribution of charges and pore size are important parameters which influence the permeation properties of charged hydrogels 19, 20.
Particle penetration into mucus and biofilms has been studied by single-particle tracking techniques 21, 22 as well as by methods where a diffusor ensemble is observed 23, 15, 24, 16. On short time scales, transient particle binding to the hydrogel 17, 18, 16 is important and leads to anomalous particle diffusion 25. On spatial length scales larger than the hydrogel mesh size and on time scales larger than typical binding escape times, particle diffusion is in a continuum description determined by the free-energy and diffusivity profiles across an inhomogeneous hydrogel system. In this framework, particle binding effectively reduces the diffusivity. If the free-energy and diffusivity profiles are known, particle penetration can be quantitatively predicted, provided the particle concentration is low and the particles do not modify the hydrogel properties in an irreversible manner. In this context it should be noted that both profiles depend on the interactions between particle and hydrogel and therefore are different for each distinct hydrogel-particle pair. Due to method restrictions, experiments primarily focussed on determining either the particle diffusivity inside the hydrogel 6, 10, 21 or on the partitioning between hydrogel and the bulk solution 26, from which the free energy inside the hydrogel (relative to the bulk solution) can be determined. However, for prediction of the penetration or permeation speed of particles into the hydrogel, both the diffusivity and the free energy in the hydrogel are needed.
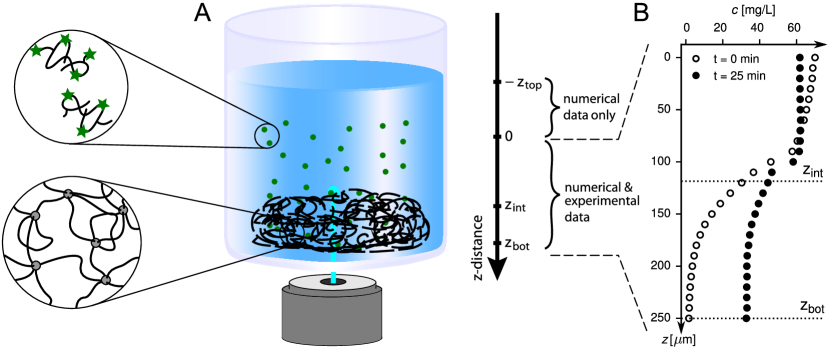
In this work, we study synthetic hydrogels that consist of polyethylene-glycol (PEG) linkers of different molecular masses which are permanently cross-linked by hyperbranched polyglycerol (hPG) hubs 2. Such synthetic hydrogels can be regarded as simple models for mucus, since they display size-dependent particle permeabilities 27, 14, similar to mucus. As diffusing particles we employ fluorescently labelled dextran molecules of varying sizes. When using confocal laser-scanning fluorescence microscopy to investigate particle penetration into hydrogels, the sample can be oriented such that the hydrogel-bulk interface is either parallel 16 or perpendicular 28 to the optical axis, which makes no significant difference from a scanning perspective. However, for laterally extended samples like cell cultures that grow on a substrate, the parallel alignment causes the light path to span substantially larger distances, making this setup more prone to distortions in the imaging process. A perpendicular alignment, as employed in this work and sketched in Figure 1, is therefore preferable for biological samples 28 and is also compatible with future extensions of such penetration assays to mucus-producing cell cultures.
We investigate the filtering function of hydrogels by theoretical analysis of time-resolved concentration profiles of the labelled dextran molecules as they penetrate into the hydrogel. The employed numerical method allows for simultaneous extraction of free-energy and diffusivity profiles from relative concentration profiles at different times and is a significant extension of earlier methods 29, 30, 31, as it does not require absolute concentration profiles but works with relative, i.e. arbitrarily normalized, concentrations.
This is a crucial advantage, as often fluorescence intensity profiles are subject to significant perturbation due to e.g. laser light intensity fluctuations or fluorescence dye bleaching over the course of the experiment, and makes the often difficult conversion of measured intensity data into absolute particle concentrations obsolete.
Our method for the extraction of free-energy and diffusivity profiles from relative concentration profiles can be used for a wide range of different setups and systems. As a check on the robustness of the method, the extracted dextran bulk diffusivities are shown to agree well with fluorescence-correlation spectroscopy (FCS) data that are obtained separately. The obtained particle free energies and diffusivities inside the hydrogel are shown to obey scaling laws as a function of the dextran mass. The dextran free energy inside the hydrogel is described by a free-volume model based on repulsive steric interactions between the dextran molecules and the hydrogel linkers, which includes dextran as well as hydrogel linker flexibility. This model constitutes a modified size-filtering mechanism for repulsive particle-hydrogel interactions, according to which particle penetration into hydrogel pores
is assisted by the elastic widening of pores and the elastic shrinking of dextran molecules, and matches the extracted particle free energies in the hydrogel quantitatively. The model furthermore suggests that the hydrogel mesh size distribution is rather broad and that particle penetration is dominated by the fraction of large pores in the hydrogel.
2 Results and Discussion
Fluorescence intensity profiles of fluorescein isothiocyanate(FITC)-labeled dextran molecules penetrating into PEG-based hydrogels are analyzed using the procedure explained in the Methods Section. The analysis is based on numerical solutions of the one-dimensional generalized diffusion equation 32
| (1) |
where is the concentration at time and depth (see Figure 1), and are the spatially resolved diffusivity and free-energy profiles which the dextran molecules experience and is the inverse thermal energy. While the diffusivity describes the mobility of dextran molecules at position , the free energy profile uniquely determines the equilibrium partitioning of dextran molecules.
The numerical solution of eq. (1) provides a complete model of the penetration process into the hydrogel and at the same time allows for extraction of the diffusivity and free energy profiles by comparison with experimentally measured concentration profiles.
A direct conversion of measured fluorescence intensities into absolute concentrations is often difficult due to drifts of various kinds. The method developed here circumvents this problem and allows for in-depth analysis of arbitrarily normalized concentration profiles, as explained in Methods Section 4.6.
Complete profiles of free energies and diffusivities, both in the bulk and in the PEG hydrogel are obtained and the results for different hydrogels and dextran molecules of varying sizes will be analyzed in the following.
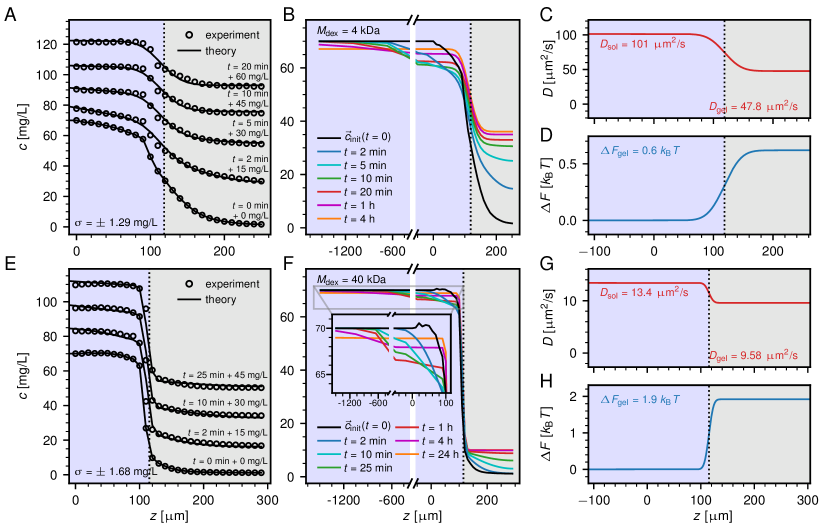
Comparison Between Experimental and Modeled Concentration Profiles. Figure 2A&E shows exemplary concentration profiles for dextran molecules with molecular masses of kDa and kDa penetrating into the hPG-G10 hydrogel (see Methods Section 4.1). Measurements are performed over a total time span of about 30 minutes and concentration profiles are recorded every 10 seconds, leading to a total of about 180 concentration profiles as input for the numerical extraction of the diffusivity and free-energy profiles. The first measured concentration profile at min represents the start of the experiment, approximately 10 seconds after the dextran solution was applied onto the gel (see Methods Section 4.4). The numerically determined concentration profiles (lines) reproduce the experimental data (data points) very accurately, as seen in Figure 2A&E. The deviation is estimated from the normalized sum of residuals, (according to eq. (13)) which is below 2 mg/L for both measurements. A stationary concentration profile is obtained in the theoretical model only after 4 hours of penetration for the smaller 4 kDa dextran, see Figure 2B, for the larger dextran molecule the stationary profile is reached only after an entire day, see Figure 2F. These times significantly exceed the duration of the experiments.
The extracted diffusivity and free-energy profiles in Figure 2C, D, G, H, reveal the selective hydrogel permeability for dextran molecules of varying size. The free energy difference in the hydrogel is positive for both dextran sizes, indicating that dextran is repelled from the hydrogel. The dextran partition coefficient between the hydrogel and the bulk solution is related to the change in the free energy as
| (2) |
According to eq. (2), the obtained free energy differences and , correspond to partition coefficients of about and for the smaller and the larger dextran molecules, respectively, which illustrates a significant exclusion in particular for the larger dextran. Compared to the partition coefficients, the diffusion constants in the hydrogel decrease only slightly as a function of the dextran mass. This suggests that the dextran molecules are only modestly hindered in their motion, a conclusion that will be rationalized by our elastic free-volume model further below.
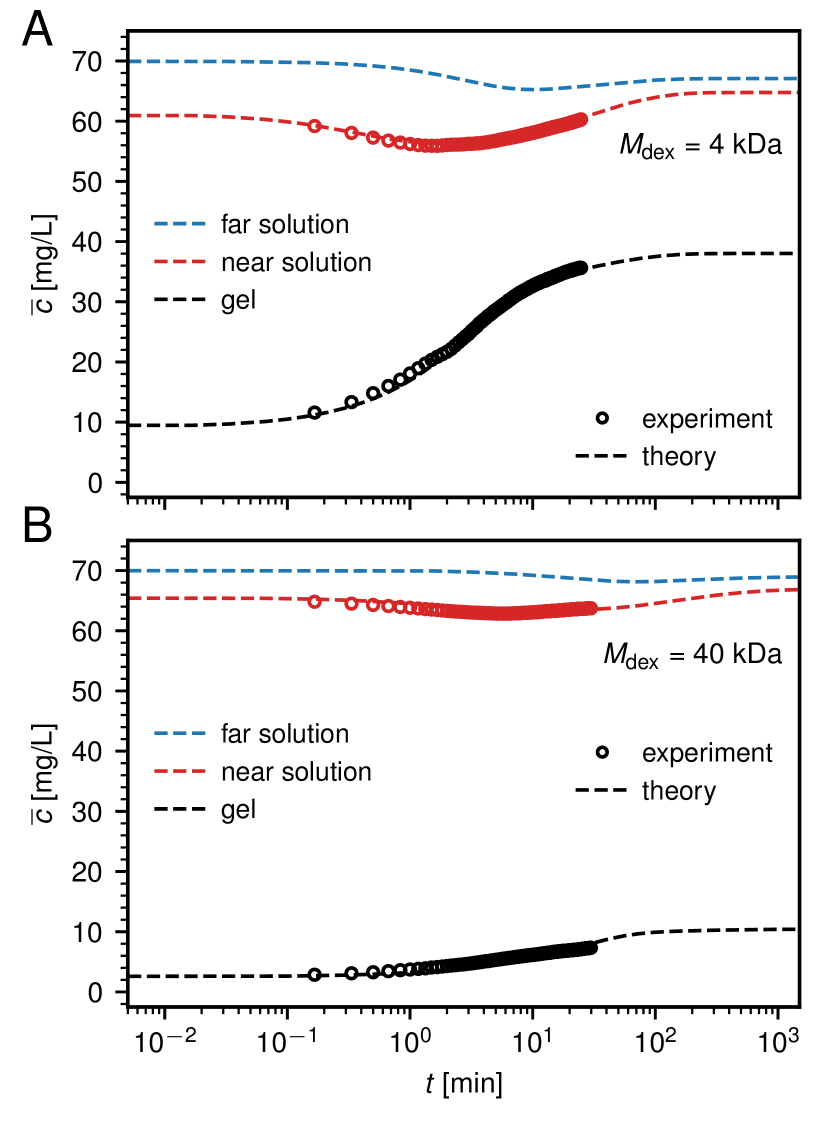
Figure 3 shows the temporal evolution of the average dextran concentration in three different regions, namely inside the gel for , in the near solution for , and in the far solution for for the same data shown in Figure 2.
The lines show the predictions based on the extracted diffusivity and free-energy profiles, the circles the experimental data, which are not available in the far solution range. The average concentration in the gel (black) increases monotonically and saturates after about one hour for both dextran sizes. Note that the stationary final concentration in the hydrogel is considerably less for the larger dextran with kDa. In contrast, the average concentration in the far solution saturates more slowly and shows a slight non-monotonicity for both dextran masses (blue). This non-monotonicity is more pronounced in the near solution (red) and is caused by the fact that dextran molecules diffuse quickly into the hydrogel from the near solution in the beginning of the experiment, while the replenishment from the bulk solution takes a certain time, as also seen in the concentration profiles in Figure 2B&F. Very good agreement between experiments and modeling results is observed.
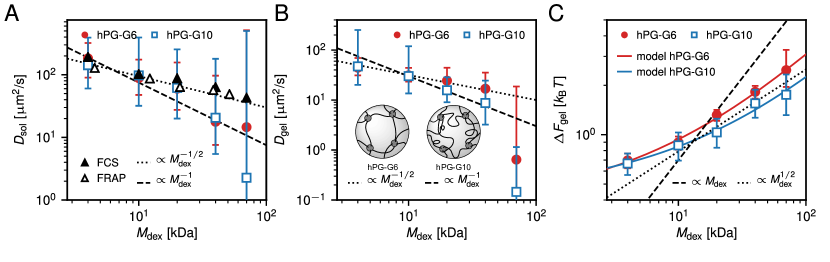
Influence of Dextran Size on Hydrogel Penetration. The same analysis is performed for dextran molecules of molecular masses ranging from kDa to kDa that penetrate into PEG hydrogels with two different linker lengths, namely hPG-G6 with a PEG linker size of kDa and hPG-G10 with kDa. Figure 4 shows the extracted diffusivities and free energies, which result from averages over at least three experiments for each system, except for kDa dextran, where only one experiment was performed.
Figure 4A shows the bulk diffusivities extracted from measured concentration profiles as colored symbols, in principle there should be no difference between results for hPG-G6 and hPG-G10. A power law relation between the dextran mass and the diffusivity according to is shown as straight lines for (broken line) and for (dotted line). An exponent of agrees nicely with our FCS data (solid black triangles; see Methods Section 4.5) as well as with literature FRAP measurements 33 (open black triangles). The value follows from combining the Stokes-Einstein relation with the scaling of the dextran hydrodynamic radius according to 34, 35 by assuming that the bulk solution is a theta solvent for dextran polymers 36, 37 (see Section LABEL:si-sec:dex_mass_scaling in the Supporting Information for details). The exponent is only expected for linear polymers, while dextran is in fact a branched polymer. The good agreement of FCS and FRAP data with the power law for suggests that the degree of branching is low 38 or that branching effectively compensates self-avoidance effects. The dextran hydrodynamic radii estimated from the FCS measurements compare well with the values reported by the supplier, see Table 1. The data for obtained from the time-dependent dextran concentration profiles show rather large uncertainties, which is due to the fact that the concentration profiles are rather insensitive to the bulk diffusivities; they are within error bars consistent with our FCS results but do not allow extraction of the power-law scaling with any reasonable confidence.
| 4 kDa | 1.4 nm | 1.5 nm |
| 10 kDa | 2.3 nm | 2.7 nm |
| 20 kDa | 3.3 nm | 3.2 nm |
| 40 kDa | 4.5 nm | 4.3 nm |
| 70 kDa | 6.0 nm | 6.4 nm |
Values for the diffusion constant in the hydrogel are compared to power laws with exponents and in Figure 4B. The difference of the diffusion constants between the two different hydrogels is within the error bars, which reflects the fact that the estimated mean hydrogel mesh-sizes, using a very simplistic hydrogel network model with a perfect cubic structure, are nm and nm (see Methods Section 4.2) and thus quite similar to each other. It is to be noted that for kDa, the estimated mesh sizes are larger than twice the dextran hydrodynamic radii from Table 1, which would not suggest any dramatic confinement effect on the diffusion constant 39. Interestingly, for the data where kDa, the hydrogel with the larger linker length (hPG-G10), which has a slightly higher mesh size, is seen to reduce the diffusion constant slightly more, which at first sight is counterintuitive. This finding can be rationalized by the fact that the hPG-G10 gel has a higher mass density compared to the hPG-G6 gel (see Methods Section 4.1), and thus the effective pore size is in fact substantially smaller. This is schematically illustrated in the inset in Figure 4B. A diffusivity scaling with an exponent , which describes the data for hPG-G10 slightly better, could be rationalized by screened hydrodynamic interactions or by reptation-like diffusion 40. In fact, a cross-over in the scaling of the diffusivity with increasing hydrogel density from to has been described before for dextran penetrating into hydroxypropylcellulose 35. However, because of the large error bars, extraction of the diffusivity scaling with respect to dextran mass in the two gels is not uniquely possible. This is mostly due to the fact that the diffusivities change rather mildly with varying dextran mass. This is why we do not attempt to model the scaling of the extracted diffusivities, as was done elsewhere before 18, 19, 41, but rather focus on the mechanism behind the extracted free energy differences in the following.
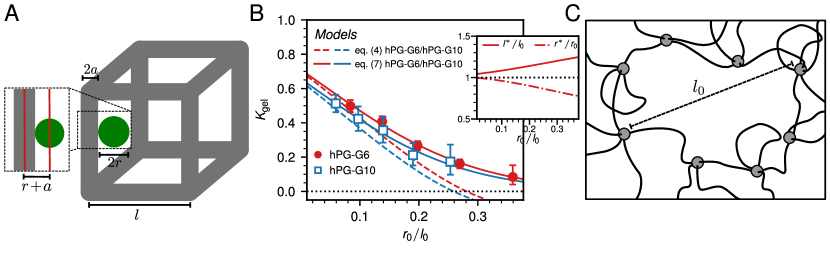
Figure 4C shows the extracted values of for the two hydrogels as a function of the dextran mass.
In all measurements we find , which suggests exclusion of the dextran molecules from the hydrogel. Also the value of increases with the dextran mass. Since dextran as well as the PEG-hPG based hydrogels are uncharged 42, this exclusion must be due to steric repulsion, possibly enhanced by hydration repulsion
43, 44.
Elastic Free-Volume Model for Dextran Penetration in Hydrogels. For the larger dextran molecules, the hydrogel with the smaller PEG linkers, hPG-G6, displays a slightly stronger exclusion. The power law relation between the hydrogel free energy and dextran mass according to with an exponent of describes the data well for larger dextran masses kDa, as shown by the dotted black line in Figure 4C. This power law behavior is in fact compatible with a simplistic elastic free-volume model for the penetration of dextran molecules into hydrogels, which yields the solid lines and will be derived in the following.
The model geometry is sketched in Figure 5A and consists of a single dextran molecule of radius (green sphere) inside a cubic unit cell of the PEG based hydrogel (grey cylinders), similar to previous coarse-grained hydrogel models 18, 19, 20. The presence of the hPG hubs connecting the PEG linkers is neglected in the following. The dextran experiences a reduction of its free volume compared to the bulk solution, due to steric interactions with the PEG linkers. In the simple model geometry, the PEG linkers are located at the edges of the cubic unit cell and are modeled as impenetrable cylinders of radius and length . The excluded volume for dextran in the cubic unit cell consists of a quarter of each of the twelve cylinders at the edges. The accessible or free volume in the hydrogel depends on the sum of sphere radius and cylinder radius and is given by
| (3) |
Here, is the volume of the unit cell and is the volume of two intersecting cylinders 45, which is subtracted from the excluded volume to avoid over counting of the unit-cell corners. The entropic contribution to the total free energy is given by
| (4) | |||
Since dextran and the PEG linkers are elastic polymers, they are both flexible and can deform. For small deformations, the polymers behave like Gaussian chains 36, 37. The elastic deformation free energy for a cubic unit cell consisting of 12 equally deformed PEG linkers can be written as (for a detailed derivation see Section LABEL:si-sec:peg_stretch in the Supporting Information)
| (5) |
Here is the relative stretching of the PEG linkers, where denotes the edge length of the unit cell in the absence of dextran molecules. The elastic deformation energy of dextran is obtained in the same fashion and reads
| (6) |
where denotes the deformed dextran radius and the equilibrium dextran radius is denoted by and is taken from Table 1. The complete free energy follows as
| (7) |
The equilibrium free energy is given by the minimal value of this free energy expression, obtained for the optimal stretched unit cell length and the optimal dextran radius , which are determined numerically. The values of the unit cell length and the PEG linker thickness are adjusted by fits to the experimental data. The model results are shown in Figure 5B in terms of the partition coefficient as solid lines and compared to the experiments (circles and squares) as a function of the length ratio . The inset shows the obtained equilibrium values for and for the hPG-G6 gel. A considerable stretching of PEG-linkers and compression of dextran is observed, which shows that elasticity effects of both PEG linkers and dextran molecules are important.
The fit to the experimental data yields nm, nm, nm and nm. The fit values of certainly represent an effective PEG linker radius and include the layer of tightly bound hydration water. They are indeed, close to the respective equilibrium PEG radii , given as nm and nm, where nm denotes the Flory monomer length 46 and is the respective number of PEG monomers. In fact, the free-volume model yields estimates of the number of hydration waters per PEG monomer that scatter around 8, in rough agreement with literature values (see Figure LABEL:si-fig:peg_hydration and Section LABEL:si-sec:PEG_hyd in the Supporting Information).
The fit values for the unit cell length are significantly larger than the mean mesh size estimated based on eq. (12), which for a perfectly ordered cubic lattice predicts nm and nm, but still considerably shorter than the PEG contour length , which is nm and nm, where nm is the PEG monomer length 46. While the large unit cell lengths obtained from the fit to the elastic free-volume model could reflect a substantial stretching of individual PEG polymers, there is no a priori reason why the linkers should be stretched to such a considerable fraction of their contour length. We therefore rationalize this surprising result in terms of a broad distribution of pore sizes that exhibit different topologies. To illustrate this, a random pore is schematically shown in Figure 5C. Based on the 3:1 number ratio of linkers and cross linkers in the hydrogel formulation (cf. Methods Section 4.1), a perfectly cubic lattice could form, where each hub is connected to 6 different linkers. Such an ideal cubic connectivity is of course entropically highly unfavorable and the connectivity distribution of hubs, i.e. the distribution of the number of linkers that connect to one hub, will be rather broad and the network topology will be disordered, in which case the PEG end-to-end distance will be significantly smaller than the pore size (cf. also Methods Section 4.2). While in a cubic lattice each cubic facet consists of four hubs and four linkers, the pores present in the actual hydrogel will show a broad distribution of the number of participating linkers. For illustration, the pore shown in Figure 5C consists of eight linkers. Clearly, dextran molecules will tend to be located in larger pores in order to maximize their free volume, and therefore the fit parameters of our model will be dominated by the tail of the pore size distribution, which explains the large fit values for . This finding also allows to rationalize the larger extracted free energy barriers in the case of the hPG-G6 gel, even though the hPG-G10 gel mass density is higher (cf. Figure 4C): The tail of the pore size distribution of the hPG-G10 gel presumably contains larger pores which can even stretch further to minimize the unfavorable dextran-PEG interactions. Clearly, the precise topology and compositional distribution of pores cannot be predicted by our analysis, our results should thus be merely interpreted as an indication of the presence of large pores and a disordered network topology.
An approximate non-elastic version of the free-volume model is obtained by neglecting the polymer deformation term and just keeping the excluded volume term, eq. (4), which becomes accurate in the limit of , where and . These approximate results are shown as broken lines in Figure 5B and describe the experimental data only for small values of . When additionally approximating the logarithm in eq. (4), the obtained expression for the free energy is similar to results derived for a random-fiber network 47.
Derivation of Particle Permeabilities through Hydrogel Barriers. Permeation through biological barriers is quantified by the permeability coefficient , which is defined as 48
| (8) |
where and are the particle concentrations at the two sides and of the barrier, and denotes the particle flux through the barrier. Based on the diffusion eq. (1), the permeability can be written as (for a detailed derivation see Section LABEL:si-sec:permeability of the Supporting Information)
| (9) |
For a step-like barrier one obtains
| (10) |
Here and are the particle free energy relative to the solution and the diffusivity inside the hydrogel and denotes the width of the hydrogel barrier.
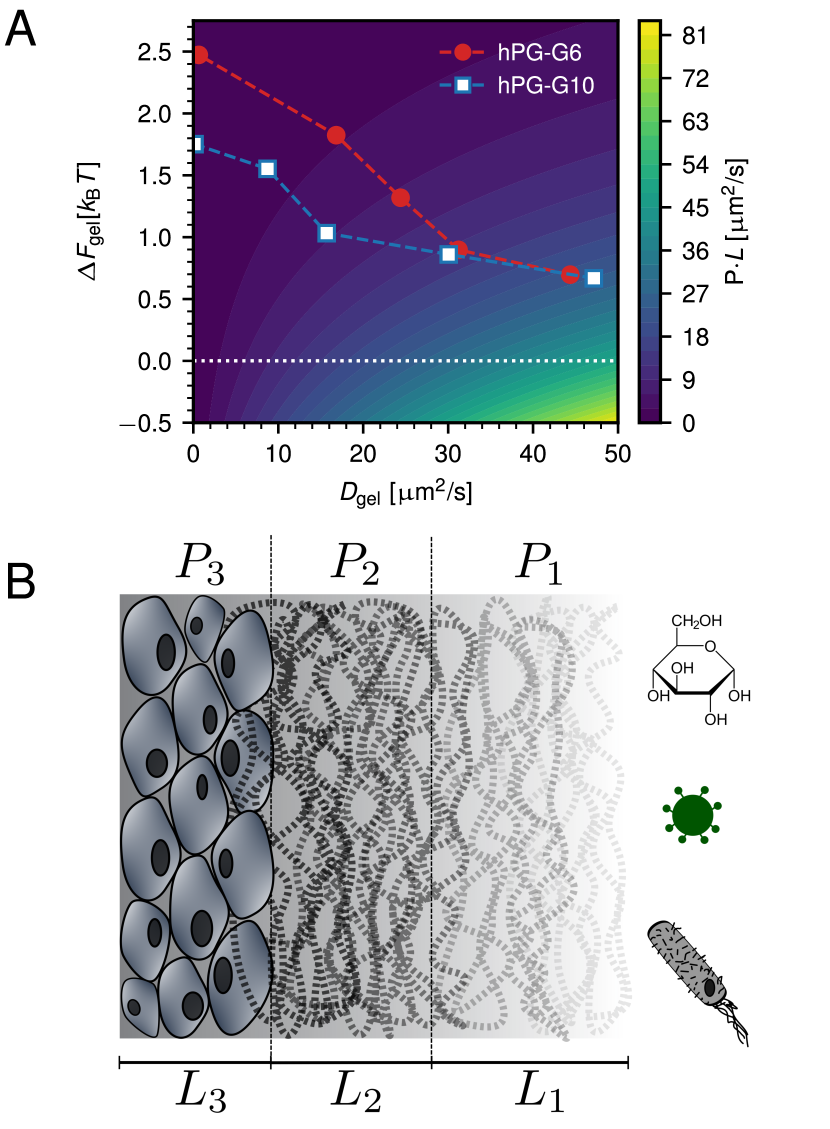
Figure 6A shows normalized permeability coefficients for a single step-like barrier according to eq. (10), which are independent of the thickness of the barrier , as a function of the gel free energy and the gel diffusivity.
The values extracted from the experimental data for different dextran molecules in the two gels from Figure 4 are indicated by data points.
Obviously, the highest permeability is observed for a low free-energy barrier and a high particle diffusivity, as is the case for the smallest dextran molecules (lower right corner in Figure 6A). On the other hand, permeation is hindered by either a high free-energy barrier or a low diffusivity in the hydrogel, both of which are observed for dextran molecules with larger molecular weights. Due to counterbalancing effects of stronger exclusion from the hPG-G6 gel and increased immobilization in the case of hPG-G10, both hydrogels display comparable permeability coefficients for the chosen dextran molecular masses.
3 Conclusion
The method introduced in this paper allows for the simultaneous extraction of diffusivity and free-energy profiles of particles that permeate into spatially inhomogeneous hydrogel systems, we demonstrate the method using concentration profile measurements of fluorescently labeled dextran molecules permeating into PEG-hPG-based hydrogels. The advantage over alternative methods is that both diffusivity and free-energy profiles are obtained from a single experimental setup. This is important, as only the combination of diffusivity and free-energy profiles completely determines the diffusion of particles.
The extracted diffusivities and free-energies are analyzed in terms of scaling laws as a function of dextran mass and a modified elastic free-volume model is developed. This modified free-volume model includes the elasticity of PEG linkers and of the diffusing dextran molecules and quantitatively accounts for the extracted free energy values, demonstrating that elastic deformations of both the diffusor and the hydrogel network are important, in line with previous computational 49, 50, 51 and experimental studies 52. Our elastic free-volume model suggests that the hydrogel is topologically disordered and that dextran molecules preferentially move within exceptionally large hydrogel pores, which are locally even more enlarged due to PEG strand elasticity.
Diffusional barriers in biological systems often show a layered structure, as previously demonstrated for skin 29, 30, 31 and is also the case for mucous membranes, as found for instance in the gastrointestinal tract, schematically indicated in Figure 6B. For a layered system, eq. (9) shows that the individual piecewise constant permeability coefficients add up inversely as
| (11) |
where the sum goes over all layers, represented by their respective diffusion constants , free energy values or partition coefficients and thicknesses . Here, denotes the total permeability, which is dominated by the smallest permeability in the inverse sum.
Figure 6B schematically illustrates permeation through a layered system which represents the mammalian stomach 53. The outermost layer of mucus is only loosely bound and characterized by the permeability , it is followed by a layer of more tightly bound mucus, characterized by , and adheres onto the first layer of epithelial cells, characterized by . The total thickness of this diffusional barrier is about a millimeter, with the two mucus layers spanning a few hundred micrometers only 54. Measurements in rat gastrointestinal mucosa suggest typical values of m, m and 55, which are close to the range of gel thicknesses studied in this work.
The total permeability is determined by the free energies and the mobilities inside all layers. Nutrients for instance can easily penetrate through the epithelia of the gastrointestinal tract, displaying large permeabilities in the different layers. Pathogens on the other hand are in healthy environments kept from reaching the epithelium, due to low permeability in the tightly bound mucus layer () 53. From eq. (11), it is apparent that the lowest permeability in such a layered system dominates the total permeability, leading to an effective barrier function that for different particles can be caused by different parts of the layered barrier structure.
The method introduced in this work can be used to determine free-energy and diffusivity profiles, and thereby to predict effective permeabilities, of different kinds of fluorescently labeled molecules, particles or even organisms that penetrate into various layered systems, including systems that contain hydrogels and mucus. This will help to shed light on the underlying mechanisms of the function of biological barriers including mucous membranes.
4 Methods
| hPG-G6 | 142 nmol | 10L | 47 nmol | 2.8 L | 13.0 L | 25.8 L | 1 L | 38 g | 7.3 nmol |
| hPG-G10 | 84 nmol | 10L | 28 nmol | 1.7 L | 12.7 L | 24.4 L | 1 L | 38 g | 4.6 nmol |
4.1 Hydrogel Preparation.
The hydrogel is formed by cross-linking end-functionalized polyethylene glycol-bicyclo[6.1.0] non-4-yne (PEG-BCN) linkers with hyperbranched polyglycerol azide (hPG-N3) hubs via strain-promoted azide-alkyne cycloaddition (SPAAC). The two macro-monomers PEG-BCN and hPG-N3 are synthesized as previously described 2, 56. The click reaction of binding the PEG-BCN linkers to the hPG-N3 hubs works in water, at room temperature, without the addition of a catalyst or external activation like heat or UV radiation and without the formation of byproducts. Two different sizes of PEG-BCN linkers are employed, having a molecular weight of either or kDa (for details about the mass distributions see Section LABEL:si-sec:mass_distribution of the Supporting Information), the hydrogels are denoted as hPG-G6 and hPG-G10, respectively. The number ratio of the PEG-BCN linkers to the hPG-N3 hubs (M = 3 kDa, 20% azide) is kept constant at 3:1 for both hPG-G6 and hPG-G10. This ratio can ideally lead to a cubic lattice structure if each hPG-hub exactly binds to six PEG linkers. The chemical structure of the hPG-N3 hubs, however, allows on average for eight binding sites, making the hydrogel presumably quite disordered.
The two components of the hydrogel are stored as aqueous stock solutions at concentrations of 8.5 wt% (6 kDa PEG-BCN), 8.4 wt% (10 kDa PEG-BCN) and 5 wt% (hPG-N3). To initiate hydrogel formation, they are mixed according to Table 2. The resulting gel solution is thoroughly vortexed before being placed as 1 L drops on the glass substrate. Both hydrogel solutions are adjusted to have the same mass concentration. However, after drying and re-swelling on the glass substrate, volumes of the formed hydrogels are different and measured as L and L for hPG-G6 and hPG-G10, respectively (see Figure LABEL:si-fig:gel_volumes in Section LABEL:si-sec:gel_volume of the Supporting Information). This results in a final hydrogel concentration of 9 wt% ( 90 mg/mL) for hPG-G6 and 12 wt% ( 120 mg/mL) for hPG-G10.
4.2 Estimate of Mean Hydrogel Mesh Size.
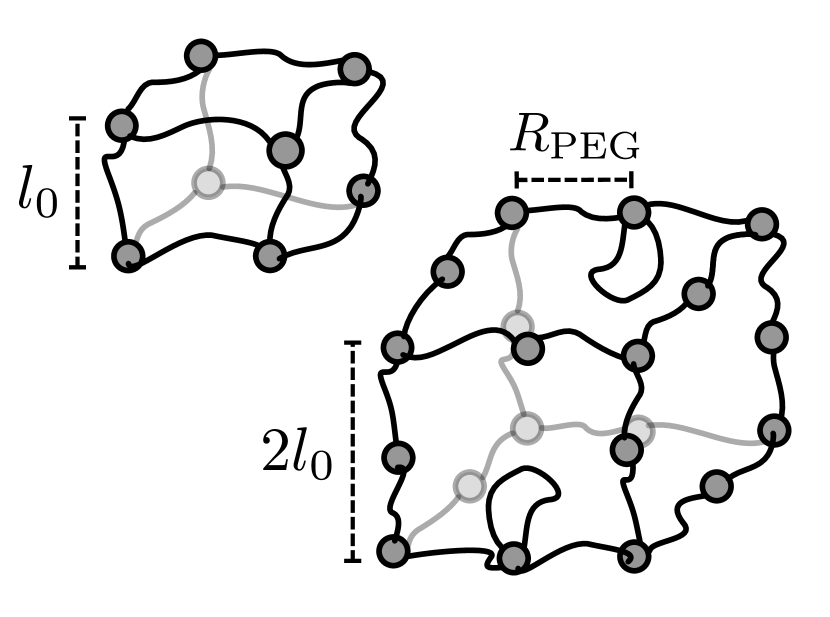
Assuming an idealized cubic hydrogel network structure, the mean mesh size can be easily estimated. The length of a cubic unit cell follows from the total gel volume and the total number of hPG hubs in mol as
| (12) |
where is the Avogadro constant. The total volumes for the re-hydrated gels are L and L as mentioned above. The total number of hPG hubs is given as , with the values from Table 2 for the respective gel and where we account for the fact that only L of the total gel solution is applied onto the gel substrate. This results in a rough estimates for the mesh size of nm and nm, which shows that even though PEG linkers of significantly different masses were used, the mesh sizes of the two gels differ only slightly. In deriving eq. (12) one assumes an ideal hydrogel pore connectivity that corresponds to a perfect cubic lattice. There is no reason why the hydrogel should consist of a perfect cubic lattice, on the contrary, entropy favors a disordered network topology. For cubic pores with lower connectivity, Fig. 7 illustrates how the pore size can increase for a fixed PEG end-to-end distance . Thus, except for the case of an ideal cubic lattice, the estimated pore size will be larger than the estimate of eq. (12), as indeed suggested by our elastic free-volume model.
4.3 Dextran Preparation.
Dextrans conjugated with the dye fluorescein isothiocyanate (FITC) are obtained from Sigma-Aldrich as d4-FITC, d10-FITC, d20-FITC, d40-FITC and d70-FITC, the number stating the molecular weight in kDa of the commercial product. To remove unbound FITC from the dextran solutions, all batches are subjected to a desalting PD-10 column, which eliminates low-molecular weight compounds such as free FITC dye. This step is done according to the manufacturers recommendations and the column is equilibrated using phosphate buffer saline (PBS). Afterwards, the molecular weight distribution of all dextrans is determined by gel permeation chromatography (GPC) (see Section LABEL:si-sec:mass_distribution of the Supporting Information).
4.4 Penetration Assay of FITC-labeled Dextrans.
After preparation of the hydrogel solutions and purification of the dextrans (see above), penetration assays are performed with five different dextran solutions and two different gels. For these assays, coverslips (Menzel #1; VWR, Darmstadt, Germany) with a diameter of 25 mm and a thickness of 0.13-0.16 mm are thoroughly washed with water and absolute ethanol and subsequently dried under a stream of nitrogen. For every experiment, 1 L of the respective hydrogel solution is placed in the center of the coverslip. The substrates with the applied gel spots are kept in a humid environment overnight, allowing hydrogel formation to be completed before the hydrogel spots are left to dry for 30 min at ambient conditions. Permeation experiments are performed within one day after hydrogel formation. To start a permeation experiment, a home-made polydimethylsiloxane (PDMS) stamp (1 x 1 cm) prepared with a cylindrical cavity in the middle (5 mm diameter) is placed on the coverslip, so that the dried hydrogel is located in the middle of the stamp’s cavity. The PDMS surrounding the dried hydrogel allows for the addition of solutions such as buffer or dextran. Prior to the measurement, 30 L of PBS buffer are added to re-swell the hydrogel for 30 min, which typically creates hydrogel volumes of semi-spheroid shape with a base radius of 1050 m and heights of about 150 m for hPG-G10 and about 210 m for hPG-G6 (see Section LABEL:si-sec:gel_volume of the Supporting Information). Afterwards, the coverslip is mounted on a Leica SP8 confocal laser scanning microscope (CLSM; Leica, Wetzlar, Germany) and imaged using a 20x objective (0.75 HC PL APO water immersion objective with correction ring). In a first step, the hydrogel is visually identified by imaging the sample with a 488 nm laser and collecting the transmitted light using the transmission photomultiplier tube (PMT) of the CLSM, allowing to place the optical axis of the CLSM in the centre of the hydrogel and to place the focal plane 30 m below the glass-hydrogel interface. After aligning the sample like this, the PBS buffer is removed from the cavity and replaced by 35 L of the FITC-dextran solution (0.07 mg/mL for all dextrans). This fixes the total length from the bottom of the glass dish at to the air-water interface at , where corresponds to the end of the measurement region (see Figure 1A). The total length of the solution is thus m. The individual contributions to vary, due to different gel thicknesses, changing the extent of the measured region, ranging from to (cf. also Figure 1A).
About 10 seconds after the application of the dextran solution, the spatial distribution of the FITC-based fluorescence intensity is measured using a z-stack that starts 30 m below and ends 410 m above the glass-hydrogel interface (with 10 m increments). The recorded intensities are afterwards truncated to probe the spatial FITC distribution within the hydrogel starting from the glass bottom (located at ) and extending about 100 m into the bulk solution, away from the gel-water interface located at (cf. Figure 1A). In these measurements, the sample is excited at = 488 nm and the emission is recorded between 500 nm and 550 nm using a PMT. For the kDa to the kDa dextrans, one z-stack is recorded every s, yielding time-resolved FITC distributions following the penetration of the dextran molecules into the hydrogel network over time. For the kDa dextrans a period of s is used instead, in order to account for the much smaller diffusion coefficient of the larger dextran molecules. For all dextran types, measurements are performed at least three times with total measurement times of about 30 minutes, with the exception of the kDa dextrans. Here only one measurement is performed for each gel but with a longer recording time of about 1 hour.
4.5 Fluorescence Correlation Spectroscopy of FITC-labeled Dextrans.
Reference diffusion coefficients for the FITC-labeled dextran molecules in the bulk solution are obtained using fluorescence correlation spectroscopy (FCS). The measurements are performed on a Leica TCS SP5 II CLSM with a FCS set-up from PicoQuant. The CLSM is equipped with an HCX PL APO 63x/1.20 W CORR CS water immersion objective. Samples are put on high precision cover glasses (18 x 18 mm, 170 5 m thick) and excited with the 488 nm Argon laser line. The fluorescent light is passed through a 50/50 beam splitter with a lower wavelength cut-off of nm. Both channels are detected separately with a single photon avalanche diode (SPAD). Afterwards a pseudo-cross correlation is performed between both channels to eliminate the influence of detector after-pulsing. Prior to a measurement, the optical setup is calibrated with the water soluble Alexa-Fluor 488 dye. The correlated signal is fitted with two components and accounting for triplet states. The first component is fixed to a freely diffusing FITC-dye molecule where only the fraction is a fit parameter. The second component is set to a log-normal distributed species. The component fractions and means of distribution are fitted and the width of distribution is taken from previously performed gel permeation chromatography (GPC) measurements (for details about the fitting procedure see Section LABEL:si-sec:FCS_fits of the Supporting Information). The fitted diffusion times are used to calculate the diffusion coefficients and hydrodynamic radii using the Stokes-Einstein relation.
4.6 Numerical Model and Discretization.
Extending a previously introduced method 29, 30, 31, spatially resolved diffusivity and free energy profiles are estimated from experimentally measured concentration profiles. Numerical profiles are computed by discretizing the entire experimental setup from the glass bottom of the substrate to the air-water interface ( to in Figure 1A). In the regime where concentration profiles are measured ( to ), the experimental resolution is used as the discretization width = 10 m. For the range without experimental data ( to ) in total six bins are employed. Two of those bins are spaced with = 10 m, for the other four bins, discretization spacings between = 300 - 400 m are used, depending on the z-length measured in the respective experiment . The z-dimension of the total system is the same for all experiments and given as m. The experimentally measured region always extends from the glass bottom through the gel and at least 100m into the bulk solution, away from the hydrogel-bulk interface, which leads to values of m, depending on the exact thickness of the hydrogel in the respective measurement.
The numerical optimization problem is given by the cost function, which is defined as
| (13) |
with the total number of experimental profiles, the total number of experimental data points per concentration profile and being the mean squared deviation between the experimental and numerical profiles. The diffusivity profile , the free energy landscape and the vector containing all scaling factors (see below for details) are all optimized to find the minimal value of . This non-linear regression is performed using the trust region method implemented in python’s scipy package 57.
The numerical profiles
are computed from the diffusivity and free energy profiles as
| (14) |
where the rate matrix is defined as
as explained previously 29. Numerical profiles at time depend on the initial profile at , which is determined as explained below.
The numerically computed profiles are fitted to the re-scaled experimental profiles at time . The scaling factors are obtained simultaneously from the fitting procedure and correct drifts in the experimentally measured fluorescence intensity profiles (see Section LABEL:si-sec:drifts of the Supporting Information). As a check, the numerical model is compared to the analytical solution for a model with piece-wise constant values of the diffusivity and free energy in the respective regions. Results from the numerical model agree perfectly with those from the analytical solution (see Section LABEL:si-sec:ana_sol of the Supporting Information).
4.7 Construction of the Initial Concentration Profile.
The initial profile , used for the computation of all later profiles according to eq. (14), needs to cover the entire computational domain and is generated by extending the first experimentally measured profile into the bulk regime (from to , cf. Figure 1A). We define as the time of the first measurement, which is performed approximately 10 seconds after application of the dextran solution onto the gel-loaded substrate. For the extension, a constant initial concentration is assumed in the bulk, the value of which is taken as the experimentally measured value furthest into the bulk at . This leads to the following expression used for the initial profile
| (15) |
which by construction is continuous at . The initial profiles used for the fit procedure are shown in Figure 2B and F as black lines. In order to obtain concentration profiles in physical units, we set the first measured value furthest into the bulk equal to the applied dextran concentration mg/mL.
4.8 Free Energy and Diffusivity Profiles.
The diffusivity and free energy profiles are assumed to change in a sigmoidal shape from their values in the bulk solution to their values in the hydrogel. This sigmoidal shape is modeled using the following expressions
| (16) |
where is the error function. The fit parameters and determine the transition position and width, respectively, and are the same for the free energy and diffusivity profiles. Since only free energy differences carry physical meaning, the free energy in the bulk solution is set to zero, so that . The values of the diffusivity and free energy in the hydrogel and in the bulk solution are thus determined by fitting the five parameters of eqs. (16), namely , , , and , to the experimentally measured concentration profiles.
Confidence intervals for the obtained parameters of , and are estimated by determining the parameter values that change by not more than 50% (for details see Section LABEL:si-sec:errors of the Supporting Information). The error bars shown in Figure 4 are then obtained by averaging the confidence intervals over all measurements.
LABEL:si-sec:dex_mass_scaling: Scaling of Diffusion Constant with Dextran Size; LABEL:si-sec:peg_stretch: Expression for the Elastic Deformation Free Energy; LABEL:si-sec:PEG_hyd: Estimating PEG-Monomer Hydration Number; LABEL:si-sec:permeability: Permeability Coefficient; LABEL:si-sec:mass_distribution: Molecular Mass Distributions of PEG linkers and Dextran Molecules; LABEL:si-sec:gel_volume: Hydrogel Volume Reconstruction; LABEL:si-sec:FCS_fits: Fitting Procedure for FCS Measurements; LABEL:si-sec:drifts: Drifts in the Measured Fluorescence Intensity Data; LABEL:si-sec:ana_sol: Analytical Solution for Two-Segment System; LABEL:si-sec:errors: Error Estimate for Numerical Analysis.
The authors acknowledge funding by the Deutsche Forschungsgemeinschaft (DFG) via grant SFB 1449.
References
- Wirthl et al. 2017 Wirthl, D.; Pichler, R.; Drack, M.; Kettlguber, G.; Moser, R.; Gerstmayr, R.; Hartmann, F.; Bradt, E.; Kaltseis, R.; Siket, C. M.; Schausberger, S. E.; Hild, S.; Bauer, S.; Kaltenbrunner, M. Instant tough bonding of hydrogels for soft machines and electronics. Science Advances 2017, 3, e1700053, DOI: 10.1126/sciadv.1700053
- Herrmann et al. 2018 Herrmann, A.; Kaufmann, L.; Dey, P.; Haag, R.; Schedler, U. Bioorthogonal in Situ Hydrogels Based on Polyether Polyols for New Biosensor Materials with High Sensitivity. ACS Applied Materials & Interfaces 2018, 10, 11382–11390, DOI: 10.1021/acsami.8b01860
- Li and Mooney 2016 Li, J.; Mooney, D. J. Designing hydrogels for controlled drug delivery. Nature Reviews Materials 2016, 1, 16071, DOI: 10.1038/natrevmats.2016.71
- Billings et al. 2015 Billings, N.; Birjiniuk, A.; Samad, T. S.; Doyle, P. S.; Ribbeck, K. Material properties of biofilms—a review of methods for understanding permeability and mechanics. Reports on Progress in Physics 2015, 78, 036601, DOI: 10.1088/0034-4885/78/3/036601
- Rosales and Anseth 2016 Rosales, A. M.; Anseth, K. S. The design of reversible hydrogels to capture extracellular matrix dynamics. Nature Reviews Materials 2016, 1, 15012, DOI: 10.1038/natrevmats.2015.12
- Lieleg et al. 2010 Lieleg, O.; Vladescu, I.; Ribbeck, K. Characterization of Particle Translocation through Mucin Hydrogels. Biophysical Journal 2010, 98, 1782–1789, DOI: 10.1016/j.bpj.2010.01.012
- Wagner et al. 2018 Wagner, C.; Wheeler, K.; Ribbeck, K. Mucins and Their Role in Shaping the Functions of Mucus Barriers. Annual Review of Cell and Developmental Biology 2018, 34, 189–215, DOI: 10.1146/annurev-cellbio-100617-062818
- Hollingsworth and Swanson 2004 Hollingsworth, M. A.; Swanson, B. J. Mucins in cancer: protection and control of the cell surface. Nature Reviews Cancer 2004, 4, 45–60, DOI: 10.1038/nrc1251
- McGuckin et al. 2011 McGuckin, M. A.; Lindén, S. K.; Sutton, P.; Florin, T. H. Mucin dynamics and enteric pathogens. Nature Reviews Microbiology 2011, 9, 265–278, DOI: 10.1038/nrmicro2538
- Dawson et al. 2003 Dawson, M.; Wirtz, D.; Hanes, J. Enhanced Viscoelasticity of Human Cystic Fibrotic Sputum Correlates with Increasing Microheterogeneity in Particle Transport. Journal of Biological Chemistry 2003, 278, 50393–50401, DOI: 10.1074/jbc.M309026200
- Lai et al. 2007 Lai, S. K.; O’Hanlon, D. E.; Harrold, S.; Man, S. T.; Wang, Y.-Y.; Cone, R.; Hanes, J. Rapid transport of large polymeric nanoparticles in fresh undiluted human mucus. Proceedings of the National Academy of Sciences 2007, 104, 1482–1487, DOI: 10.1073/pnas.0608611104
- Johansson 2012 Johansson, M. E. V. Fast Renewal of the Distal Colonic Mucus Layers by the Surface Goblet Cells as Measured by In Vivo Labeling of Mucin Glycoproteins. PLoS ONE 2012, 7, e41009, DOI: 10.1371/journal.pone.0041009
- Button et al. 2012 Button, B.; Cai, L.-H.; Ehre, C.; Kesimer, M.; Hill, D. B.; Sheehan, J. K.; Boucher, R. C.; Rubinstein, M. A Periciliary Brush Promotes the Lung Health by Separating the Mucus Layer from Airway Epithelia. Science 2012, 337, 937–941, DOI: 10.1126/science.1223012
- Witten and Ribbeck 2017 Witten, J.; Ribbeck, K. The particle in the spider’s web: transport through biological hydrogels. Nanoscale 2017, 9, 8080–8095, DOI: 10.1039/C6NR09736G
- Li et al. 2013 Li, L. D.; Crouzier, T.; Sarkar, A.; Dunphy, L.; Han, J.; Ribbeck, K. Spatial Configuration and Composition of Charge Modulates Transport into a Mucin Hydrogel Barrier. Biophysical Journal 2013, 105, 1357–1365, DOI: 10.1016/j.bpj.2013.07.050
- Marczynski et al. 2018 Marczynski, M.; Käsdorf, B. T.; Altaner, B.; Wenzler, A.; Gerland, U.; Lieleg, O. Transient binding promotes molecule penetration into mucin hydrogels by enhancing molecular partitioning. Biomaterials Science 2018, 6, 3373–3387, DOI: 10.1039/C8BM00664D
- Zhang et al. 2015 Zhang, X.; Hansing, J.; Netz, R. R.; DeRouchey, J. E. Particle Transport through Hydrogels Is Charge Asymmetric. Biophysical Journal 2015, 108, 530–539, DOI: 10.1016/j.bpj.2014.12.009
- Hansing et al. 2016 Hansing, J.; Ciemer, C.; Kim, W. K.; Zhang, X.; DeRouchey, J. E.; Netz, R. R. Nanoparticle filtering in charged hydrogels: Effects of particle size, charge asymmetry and salt concentration. The European Physical Journal E 2016, 39, 53, DOI: 10.1140/epje/i2016-16053-2
- Hansing and Netz 2018 Hansing, J.; Netz, R. R. Particle Trapping Mechanisms Are Different in Spatially Ordered and Disordered Interacting Gels. Biophysical Journal 2018, 114, 2653–2664, DOI: 10.1016/j.bpj.2018.04.041
- Hansing et al. 2018 Hansing, J.; Duke, J. R.; Fryman, E. B.; DeRouchey, J. E.; Netz, R. R. Particle Diffusion in Polymeric Hydrogels with Mixed Attractive and Repulsive Interactions. Nano Letters 2018, 18, 5248–5256, DOI: 10.1021/acs.nanolett.8b02218
- Dawson et al. 2004 Dawson, M.; Krauland, E.; Wirtz, D.; Hanes, J. Transport of Polymeric Nanoparticle Gene Carriers in Gastric Mucus. Biotechnology Progress 2004, 20, 851–857, DOI: 10.1021/bp0342553
- Wagner et al. 2017 Wagner, C. E.; Turner, B. S.; Rubinstein, M.; McKinley, G. H.; Ribbeck, K. A Rheological Study of the Association and Dynamics of MUC5AC Gels. Biomacromolecules 2017, 18, 3654–3664, DOI: 10.1021/acs.biomac.7b00809
- Wilking et al. 2013 Wilking, J. N.; Zaburdaev, V.; De Volder, M.; Losick, R.; Brenner, M. P.; Weitz, D. A. Liquid transport facilitated by channels in Bacillus subtilis biofilms. Proceedings of the National Academy of Sciences 2013, 110, 848–852, DOI: 10.1073/pnas.1216376110
- Lawrence et al. 1994 Lawrence, J. R.; Wolfaardt, G. M.; Korber, D. R. Determination of Diffusion Coefficients in Biofilms by Confocal Laser Microscopy. Applied and Environmental Microbiology 1994, 60, 1166–1173, DOI: 10.1128/AEM.60.4.1166-1173.1994
- Cherstvy et al. 2019 Cherstvy, A. G.; Thapa, S.; Wagner, C. E.; Metzler, R. Non-Gaussian, non-ergodic, and non-Fickian diffusion of tracers in mucin hydrogels. Soft Matter 2019, 15, 2526–2551, DOI: 10.1039/C8SM02096E
- Sassi et al. 1996 Sassi, A. P.; Shaw, A. J.; Sang Min Han,; Blanch, H. W.; Prausnitz, J. M. Partitioning of proteins and small biomolecules in temperature- and pH-sensitive hydrogels. Polymer 1996, 37, 2151–2164, DOI: 10.1016/0032-3861(96)85860-5
- Herrmann et al. 2019 Herrmann, A.; Rödiger, S.; Schmidt, C.; Schierack, P.; Schedler, U. Spatial Separation of Microbeads into Detection Levels by a Bioorthogonal Porous Hydrogel for Size-Selective Analysis and Increased Multiplexity. Analytical Chemistry 2019, 91, 8484–8491, DOI: 10.1021/acs.analchem.9b01586
- Furter et al. 2019 Furter, M.; Sellin, M. E.; Hansson, G. C.; Hardt, W.-D. Mucus Architecture and Near-Surface Swimming Affect Distinct Salmonella Typhimurium Infection Patterns along the Murine Intestinal Tract. Cell Reports 2019, 27, 2665–2678.e3, DOI: 10.1016/j.celrep.2019.04.106
- Schulz et al. 2017 Schulz, R.; Yamamoto, K.; Klossek, A.; Flesch, R.; Hönzke, S.; Rancan, F.; Vogt, A.; Blume-Peytavi, U.; Hedtrich, S.; Schäfer-Korting, M.; Rühl, E.; Netz, R. R. Data-based modeling of drug penetration relates human skin barrier function to the interplay of diffusivity and free-energy profiles. Proceedings of the National Academy of Sciences 2017, 114, 3631–3636, DOI: 10.1073/pnas.1620636114
- Schulz et al. 2019 Schulz, R.; Yamamoto, K.; Klossek, A.; Rancan, F.; Vogt, A.; Schütte, C.; Rühl, E.; Netz, R. R. Modeling of Drug Diffusion Based on Concentration Profiles in Healthy and Damaged Human Skin. Biophysical Journal 2019, 117, 998–1008, DOI: 10.1016/j.bpj.2019.07.027
- Lohan et al. 2020 Lohan, S. B.; Saeidpour, S.; Colombo, M.; Staufenbiel, S.; Unbehauen, M.; Wolde-Kidan, A.; Netz, R. R.; Bodmeier, R.; Haag, R.; Teutloff, C.; Bittl, R.; Meinke, M. C. Nanocrystals for Improved Drug Delivery of Dexamethasone in Skin Investigated by EPR Spectroscopy. Pharmaceutics 2020, 12, 400, DOI: 10.3390/pharmaceutics12050400
- Risken and Frank 2012 Risken, H.; Frank, T. The Fokker-Planck Equation: Methods of Solution and Applications; Springer Series in Synergetics; Springer Berlin Heidelberg, 2012
- Gribbon and Hardingham 1998 Gribbon, P.; Hardingham, T. E. Macromolecular Diffusion of Biological Polymers Measured by Confocal Fluorescence Recovery after Photobleaching. Biophysical Journal 1998, 75, 1032–1039, DOI: 10.1016/S0006-3495(98)77592-7
- Cheng et al. 2002 Cheng, Y.; Prud’homme, R. K.; Thomas, J. L. Diffusion of Mesoscopic Probes in Aqueous Polymer Solutions Measured by Fluorescence Recovery after Photobleaching. Macromolecules 2002, 35, 8111–8121, DOI: 10.1021/ma0107758
- Bu and Russo 1994 Bu, Z.; Russo, P. S. Diffusion of Dextran in Aqueous (Hydroxypropyl)cellulose. Macromolecules 1994, 27, 1187–1194, DOI: 10.1021/ma00083a017
- Rubinstein and Colby 2003 Rubinstein, M.; Colby, R. H. Polymer Physics; OUP Oxford, 2003
- Netz and Andelman 2003 Netz, R. R.; Andelman, D. Neutral and charged polymers at interfaces. Physics Reports 2003, 380, 1–95, DOI: 10.1016/S0370-1573(03)00118-2
- Granath 1958 Granath, K. A. Solution properties of branched dextrans. Journal of Colloid Science 1958, 13, 308–328, DOI: 10.1016/0095-8522(58)90041-2
- Hansing and Netz 2018 Hansing, J.; Netz, R. R. Hydrodynamic Effects on Particle Diffusion in Polymeric Hydrogels with Steric and Electrostatic Particle–Gel Interactions. Macromolecules 2018, 51, 7608–7620, DOI: 10.1021/acs.macromol.8b01494
- de Gennes 1971 de Gennes, P. G. Reptation of a Polymer Chain in the Presence of Fixed Obstacles. The Journal of Chemical Physics 1971, 55, 572–579, DOI: 10.1063/1.1675789
- Axpe et al. 2019 Axpe, E.; Chan, D.; Offeddu, G. S.; Chang, Y.; Merida, D.; Hernandez, H. L.; Appel, E. A. A Multiscale Model for Solute Diffusion in Hydrogels. Macromolecules 2019, 52, 6889–6897, DOI: 10.1021/acs.macromol.9b00753
- Wang et al. 2008 Wang, Y.-Y.; Lai, S. K.; Suk, J. S.; Pace, A.; Cone, R.; Hanes, J. Addressing the PEG Mucoadhesivity Paradox to Engineer Nanoparticles that “Slip” through the Human Mucus Barrier. Angewandte Chemie International Edition 2008, 47, 9726–9729, DOI: 10.1002/anie.200803526
- Kanduč and Netz 2015 Kanduč, M.; Netz, R. R. From hydration repulsion to dry adhesion between asymmetric hydrophilic and hydrophobic surfaces. Proceedings of the National Academy of Sciences 2015, 112, 12338–12343, DOI: 10.1073/pnas.1504919112
- Schneck et al. 2012 Schneck, E.; Sedlmeier, F.; Netz, R. R. Hydration repulsion between biomembranes results from an interplay of dehydration and depolarization. Proceedings of the National Academy of Sciences 2012, 109, 14405–14409, DOI: 10.1073/pnas.1205811109
- Moore 1974 Moore, M. Symmetrical Intersections of Right Circular Cylinders. The Mathematical Gazette 1974, 58, 181, DOI: 10.2307/3615957
- Liese et al. 2017 Liese, S.; Gensler, M.; Krysiak, S.; Schwarzl, R.; Achazi, A.; Paulus, B.; Hugel, T.; Rabe, J. P.; Netz, R. R. Hydration Effects Turn a Highly Stretched Polymer from an Entropic into an Energetic Spring. ACS Nano 2017, 11, 702–712, DOI: 10.1021/acsnano.6b07071
- Giddings et al. 1968 Giddings, J. C.; Kucera, E.; Russell, C. P.; Myers, M. N. Statistical theory for the equilibrium distribution of rigid molecules in inert porous networks. Exclusion chromatography. The Journal of Physical Chemistry 1968, 72, 4397–4408, DOI: 10.1021/j100859a008
- Diamond and Katz 1974 Diamond, J. M.; Katz, Y. Interpretation of nonelectrolyte partition coefficients between dimyristoyl lecithin and water. The Journal of Membrane Biology 1974, 17, 121–154, DOI: 10.1007/BF01870176
- Zhou and Chen 2009 Zhou, H.; Chen, S. B. Brownian dynamics simulation of tracer diffusion in a cross-linked network. Physical Review E 2009, 79, 021801, DOI: 10.1103/PhysRevE.79.021801
- Godec et al. 2014 Godec, A.; Bauer, M.; Metzler, R. Collective dynamics effect transient subdiffusion of inert tracers in flexible gel networks. New Journal of Physics 2014, 16, 092002, DOI: 10.1088/1367-2630/16/9/092002
- Kumar et al. 2019 Kumar, P.; Theeyancheri, L.; Chaki, S.; Chakrabarti, R. Transport of probe particles in a polymer network: effects of probe size, network rigidity and probe–polymer interaction. Soft Matter 2019, 15, 8992–9002, DOI: 10.1039/C9SM01822K
- Mohamed et al. 2009 Mohamed, H. F. M.; Kobayashi, Y.; Kuroda, C. S.; Ohira, A. Effects of Ion Exchange on the Free Volume and Oxygen Permeation in Nafion for Fuel Cells. The Journal of Physical Chemistry B 2009, 113, 2247–2252, DOI: 10.1021/jp808960w
- Johansson et al. 2013 Johansson, M. E. V.; Sjövall, H.; Hansson, G. C. The gastrointestinal mucus system in health and disease. Nature Reviews Gastroenterology & Hepatology 2013, 10, 352–361, DOI: 10.1038/nrgastro.2013.35
- Jordan et al. 1998 Jordan, N.; Newton, J.; Pearson, J.; Allen, A. A novel method for the visualization of the in situ mucus layer in rat and man. Clinical Science 1998, 95, 97–106, DOI: 10.1042/cs0950097
- Atuma et al. 2001 Atuma, C.; Strugala, V.; Allen, A.; Holm, L. The adherent gastrointestinal mucus gel layer: thickness and physical state in vivo. American Journal of Physiology-Gastrointestinal and Liver Physiology 2001, 280, G922–G929, DOI: 10.1152/ajpgi.2001.280.5.G922
- Dey et al. 2016 Dey, P.; Schneider, T.; Chiappisi, L.; Gradzielski, M.; Schulze-Tanzil, G.; Haag, R. Mimicking of Chondrocyte Microenvironment Using In Situ Forming Dendritic Polyglycerol Sulfate-Based Synthetic Polyanionic Hydrogels. Macromolecular Bioscience 2016, 16, 580–590, DOI: 10.1002/mabi.201500377
- Branch et al. 1999 Branch, M. A.; Coleman, T. F.; Li, Y. A Subspace, Interior, and Conjugate Gradient Method for Large-Scale Bound-Constrained Minimization Problems. SIAM Journal on Scientific Computing 1999, 21, 1–23, DOI: 10.1137/S1064827595289108