J1615+5452: a remnant radio galaxy in the ELAIS-N1 field
Abstract
We report the discovery of a remnant radio AGN J1615+5452 in the field of ELAIS-N1. GMRT continuum observations at 150, 325 and 610 MHz combined with archival data from the 1.4 GHz NVSS survey were used to derive the radio spectrum of the source. At a redshift 0.33, J1615+5452 has a linear size of 100 kpc and spectral indices ranging between and . While the source has a diffuse radio emission at low frequencies, we do not find evidence of core, jets or hotspots in the 1.4 GHz VLA data of arcsec angular resolution. Such morphological properties coupled with a curved radio spectrum suggest that the AGN fueling mechanisms undergo a shortage of energy supply which is typical of a dying radio AGN. This is consistent with the observed steep curvature in the spectrum , the estimated synchrotron age of Myr and a ratio of .
keywords:
galaxies: active – galaxies: individual: J1615+5452 – radio continuum: galaxies.1 Introduction
In the active stage which usually lasts Myr (Cordey, 1986), the classical morphology of a radio galaxy is characterized by the presence of a core, a pair of lobes and including jets, and/or hotspots. Such features indicate the continuous injection (CI) of relativistic electrons that fuel the active galactic nuclei (AGN). Following the active phase of the radio AGN, the source enters the so-called remnant or dying phase, as the nuclear engine switches off and the compact radio components, typical signatures of current activity, eventually disappear (Parma et al., 1999; Slee et al., 2001; Kapińska et al., 2010; Morganti, 2017).
Despite the challenges of detecting radio AGNs in their remnant phase, especially prior to the era of low frequency radio facilities such as the Giant Metrewave Radio Telescope (GMRT, Swarup, 1991), the Low-Frequency ARray (LOFAR, van Haarlem et al., 2013) and the Murchison Widefield Array (MWA, Lonsdale et al., 2009; Tingay et al., 2013), Cordey (1987) made a breakthrough when reporting the first discovery of a dying AGN known as B2 0924+30. Since then, this prototype of genuine radio remnants hosted by IC 2476 has been the subject of follow-up studies (Jamrozy et al., 2004; Shulevski et al., 2017; Turner, 2018). Meanwhile, other sources of this type have now been found in wide-field radio surveys (e.g. Parma et al., 2007; Murgia et al., 2011; Saripalli et al., 2012; de Gasperin et al., 2014; Brienza et al., 2016, 2017; Mahatma et al., 2018; Duchesne & Johnston-Hollitt, 2019).
The switching off of the central AGN activity is translated into a steep spectrum (S , e.g. Komissarov & Gubanov 1994; Parma et al. 2007; Shulevski et al. 2017) of the associated radio emission in the GHz frequency regime, according to radiative ageing models (e.g. Kardashev, 1962; Pacholczyk, 1970; Jaffe & Perola, 1973). This is because the injected relativistic electrons lose energy with time due to both synchrotron emission and Inverse Compton scattering with the Cosmic Microwave Background (CMB) photons (Komissarov & Gubanov, 1994). Since higher energy electrons lose energy more quickly and have shorter radiative lifetimes, this results in a high-frequency turn down of the synchrotron spectrum occuring beyond a break frequency that drifts in time to lower frequencies. Below the break frequency, the radio spectrum of the non-active source has a spectral injection index, , typically in the range to (e.g. Blandford & Ostriker, 1978; Murgia et al., 2011; Brienza et al., 2016), while above , the spectral index is steeper than (Kardashev, 1962; Pacholczyk, 1970; Jaffe & Perola, 1973).
Searches for remnant radio AGNs are generally based on detection of ultra-steep spectra at low frequencies (e.g. Parma et al., 2007; Cohen et al., 2007). To recover candidates with a spectrum not steep enough at low frequencies but ultra-steep above 1.4 GHz, Murgia et al. (2011) and Brienza et al. (2016, 2017), following the idea of Sohn et al. (2003), used the radio spectral curvature parameter (SCP). This parameter uses multi-frequency information to examine the difference between high frequency and low frequency spectral indices, i.e. , and its value correlates with the different evolutionary stages of the radio galaxy. In the typical case of a remnant AGN, (Murgia et al., 2011).
Since remnant AGNs represent the final stage in the evolution of a radio galaxy, they are important objects for understanding of the radio galaxy life cycle, i.e. from the triggering of relativistic jets to the nuclear engine switch off, possibly followed by a restarting activity of AGN that may co-exist with a surrounding fossil radio emission (Saikia & Jamrozy, 2009; Murgia et al., 2011; Saripalli et al., 2012; Shulevski et al., 2012; Konar et al., 2013; Morganti, 2017; Mahatma et al., 2018; Jurlin et al., 2020). Characterizing these elusive objects through their morphology and spectra will help determine the duty cycle of the radio core activity and the dynamical evolution of radio galaxies since mechanisms such as adiabatic expansion and radiative losses are expected to regulate the evolution of the remnant radio plasma once the radio jets switch off. Thorough investigations of the AGN duty cycle and its dynamics are thus crucial to put constraints on the radio galaxy evolution models (e.g. Brienza et al., 2017; Mahatma et al., 2018; Shabala et al., 2020). An extensive analysis of these sources will also help to address one of the key questions in the field of galaxy evolution: the co-evolution process between the supermassive black hole (SMBH) and its host galaxy (e.g. Silk & Rees, 1998; Kormendy & Ho, 2013; Sijacki et al., 2015). Although the tight correlation between the SMBH growth and the galaxy build-up has already been widely acknowledged, the impacts of the AGN physical properties and AGN feedback on the cosmic evolution of the host galaxy and its environment are still under debate (Jahnke & Macciò, 2011; Fabian, 2012 and references therein).
Because of the rapid timescale of particle energy decay, and the paucity of high sensitivity data at multiple wavelengths, only a handful of steep spectrum dying radio sources have been observed, especially in the cm wavelength regime. However, in addition to their spectral signature, fossil AGNs may be recognizable in deep low-frequency images as relatively bright and diffuse emission devoid of a core and/or hotspots and with resolutions of a few arcseconds. Such emission arises from low energy particles that are relatively unaffected by the fast spectral evolution (Parma et al., 2007; Murgia et al., 2011; Brienza et al., 2017; Morganti, 2017).
In this work, we report the discovery of a new remnant radio galaxy, J1615+5452, in the field of the European Large-Area ISO Survey-North 1 (ELAIS-N1 or EN1, Oliver et al., 2000) from the GMRT 610 MHz observations. We use the archival low-frequency GMRT observations at 150 MHz and 325 MHz and 1400 MHz data from the Karl G. Jansky Very Large Array (VLA) to obtain the source radio spectrum and to reconstruct its history of AGN activity.
The paper is structured as follows. We describe the observations and data processing in Section 2. Radio morphology and integrated spectra of the source are reported in Section 3 and Section 4 investigates the nature of the remnant AGN. We discuss the results in Section 5 and provide a summary of the work in Section 6. We adopt the following cosmological parameters throughout the paper: , , and (Planck Collaboration et al., 2016).
2 Observations and data processing
EN1 is a field in the northern part of the sky centred near (J2000 coordinates). The low foreground infrared emission in this region has made it a primary target for deep extragalactic surveys, including deep radio continuum surveys over a range of frequencies (Garn et al., 2008; Sirothia et al., 2009; Grant et al., 2010; Banfield et al., 2011; Jelić et al., 2014; Taylor & Jagannathan, 2016; Chakraborty et al., 2019; Ocran et al., 2020). This work uses observations of EN1 with the GMRT taken at 150, 325, and 610 MHz as well as data at 1400 MHz from the VLA. Table 1 summarizes the GMRT observation logs of the field including the central frequency, the bandwidth, the observing date and the on-source integration time.
| Band | Central Fqcy | BW | Project Code & PI | Obs.date | On-source time | Resolution | |
| [MHz] | [hr] | [arcsec] | [Jy/beam] | ||||
| (1) | (2) | (3) | (4) | (5) | (6) | (7) | (8) |
| 150 | 153 | 6 | 12MDB01, Dennefeld | May 2007 | 17 x 0.5 | 3500 | |
| 325 | 323 | 32 | 24_026, Wadadekar | May 2013 | 2 x 8.5 | 70 | |
| 610 | 610 | 32 | 19_064, 20_020, 21_086, 22_057, Taylor | 2011 - 2017 | 3 x 1 | 40 | |
| Notes. Columns 1 & 2: nominal and precise central frequencies; Column 3: bandwidth used for mapping the field; Column 4: GMRT project code and name of the principal investigator; Column 5: date of the observations; Column 6: on-source integration time; Columns 7 & 8: angular resolution and rms noise of the radio image. | |||||||
2.1 GMRT observations
The 610 MHz data is from the ELAIS-N1 wide area survey of this region using the GMRT. This is a large area survey of 12.8 sq. degrees comprised of 51 pointings of 3 hours each and observed between 2011 and 2017 (Ishwara-Chandra et al. 2020, submitted). We used the GMRT Software Backend (GSB) with a 32 MHz bandwidth split into 256 spectral channels to avoid bandwidth smearing. On most days, we observed 3C286 as a primary calibrator while 3C48 for flux and bandpass calibration observed over a few days only. The data analysis was carried out using a fully automated CASA-based pipeline which is described in detail in Ishwara-Chandra et al. (2020, submitted). In a nutshell, the data was flagged, gain calibrated, and after which several rounds of self-calibration on target along with flagging on residuals were being processed. For imaging, we used a robust parameter of 0 in the Briggs weighting scheme. The final rms noise was Jy/beam at a resolution of 6 arcsec circular beam. J1615+5452 was discovered from this deep image as fuzzy source without any hotspots or compact feature. The angular extent of this source is much smaller than the largest source that can be detected at this frequency (17′).
The GMRT 325 MHz observations cover 3.6 square degree area of the ELAIS-N1 field with a phasecenter set at . The survey is part of the GMRT radio continuum imaging of the Herschel/HerMES field (PI: Wadadekar, Prop ID: 24_026). Two single pointing observations of 8.5 hours each were carried on 2013 May 26 & 27 with a total bandwidth of 32 MHz. Each 52 min scan of the target field was followed by a 5min secondary calibrator observation to track the ionospheric conditions, the RFI contamination and any variations in the receiver system throughout the entire observing run. We have processed this archival data through the same CASA-based pipeline used to analyse the wide-area 610 MHz data. 3C286 and 3C48 were used for flux calibration and 1459+716 for phase calibration. Each day’s data was calibrated separately and the split files of target field were combined before imaging with CASA tclean using the default robust weighting of 0. We performed four rounds of phase-only self-calibration followed by five rounds of amplitude and self-calibration, which included residual-based flagging in between each round. The final image reached a sensitivity down to Jy/beam without applying direction-dependent calibration. Primary beam correction was done following standard procedures. J1615+5452 is clearly detected in this image and the source is much smaller than the largest angular size that can be imaged using the GMRT at 325 MHz ( 30′).
We searched for J1615+5452 in the 150 MHz TIFR GMRT Sky Survey (TGSS, Intema et al., 2017) and the source was not clearly detected. The nearest survey pointing center is 1.6 degree away which is close to the half-power beamwidth at 150 MHz. There is a faint source at the expected location with a peak flux density of about 20 mJy and a total flux density of 95 21 mJy. Since the peak flux is less than 5 times the local rms, it did not get listed in the TGSS catalogue. We searched for other 150 MHz archival data with the GMRT and found long observations with 8.5 hours on-source time, taken in May 2007 (PI: Dennefeld). The signal bandwidth was 6 MHz with a correlator bandwidth of 8 MHz split into 128 channels to minimise the effects of bandwidth smearing. 3C147 and 3C48 were observed for primary calibration and 1459+716 for secondary calibration. The data was analysed using the SPAM pipeline (Intema et al., 2009) following standard procedure which included direction dependent calibration for total intensity continuum imaging (robust = 0). The rms noise of the image is 3.5 mJy/beam with a resolution of 37.7 20.9 arcseconds at the position angle of 52 deg. The source is clearly detected in this image which is the one we use for the flux density estimate at 150 MHz (Table 2).
2.2 VLA observations at 1.4 GHz
A snapshot image of J1615+5452 is retrieved from the NRAO VLA Sky Survey (NVSS, Condon et al., 1998). At a resolution of arcsec coupled with a sensitivity of 2.5 mJy/beam above 5, the 1.4 GHz survey records a flux density of 5.6 mJy for this given source. We also retrieved the radio image from the Faint Images of the Radio Sky at Twenty-Centimeters survey (FIRST, Becker et al., 1995), but the NVSS point-like source is only detected in FIRST below 4 with a very weak intensity 0.4 mJy. We did not find radio counterparts as well in the 10 sq. degrees 1.4 GHz VLA image of the EN1 field published by Banfield et al. (2011). The local rms noise is Jy/beam. Unlike NVSS, these two VLA observations are at a higher angular resolution of arcsec. No compact feature at high resolution suggests the absence of core emission.
3 Properties of J1615+5452
3.1 Host galaxy
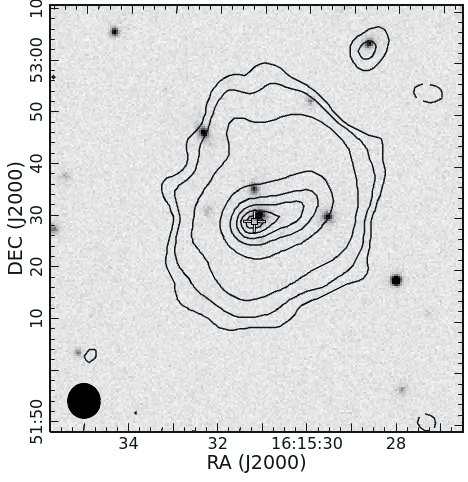
Figure 1 shows the 610 MHz radio continuum contours of J1615+5452 overlaid on a -band image from the Sloan Digital Sky Survey Data Release 12 (SDSS-DR12, Alam et al., 2015). A red spheroidal galaxy is located coincident with the peak of the radio emission and slightly arcsec East of the centroid of the radio source. Based on spectroscopic observations from the SDSS-DR14 (Abolfathi et al., 2018), this galaxy has a redshift of at which 1 arcsec corresponds to 4.89 kpc. With no obvious nebular emission lines from young blue stars, its integrated spectrum retrieved from the SDSS Catalog Archive Server111https://skyserver.sdss.org/dr12/en/tools/chart/navi.aspx is rather characterized by a prominent break around 4000 Å and the presence of Ca H and K lines along with other strong absorption lines like MgI and NaD. Such features are typical of an early-type elliptical galaxy (Kennicutt, 1992).
The newly detected remnant radio emission is likely associated with the SDSS galaxy. In fact, the slight misalignment between the position of the optical galaxy and the peak of the radio emission is consistent with a host galaxy that is moving away from the relic radio plasma after its AGN activity ceases (e.g. Duchesne & Johnston-Hollitt, 2019). Such an offset has also been reported by Gentile et al. (2007) when studying 3C338, a restarted radio galaxy where the remnant plasma of the source is clearly disconnected from the host galaxy.
The potential host galaxy does not belong to any cluster of galaxies detected in EN1 field (V. Parekh, private communication). However, there are three SDSS galaxies with mag within its 0.5′ radius. Such a proximity to other galaxies suggests that the host galaxy could reside in a loose group environment. It is worth investigating the nature of the galaxy environment since Murgia et al. (2011) reported that fossil lobes of cluster-based remnant radio galaxies tend be more confined than the ones associated with a dying radio source found in the field. Unfortunately, no X-ray observations covered this area of the sky to help investigate the effects of the surrounding intercluster medium on the radio source.
| Source name | J16155452 |
|---|---|
| RA (J2000) | 16h15m31.1s |
| DEC (J2000) | 54d52m28s |
| z | 0.32936 |
| 81.1 6.3 mJy | |
| 50.5 2.5 mJy | |
| 24.8 1.2 mJy | |
| 6.7 0.8 mJy | |
| 1.12 0.06 | |
| 1.58 0.15 | |
| 1.12 0.11 | |
| 0.61 0.12 | |
| (SCP) | 0.97 0.19 |
|
|
3.2 Morphology and flux densities
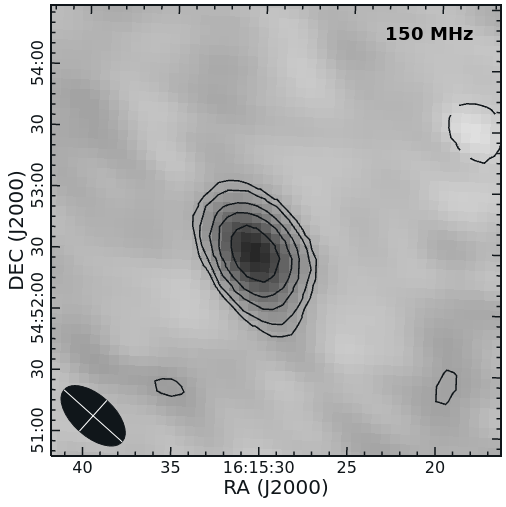
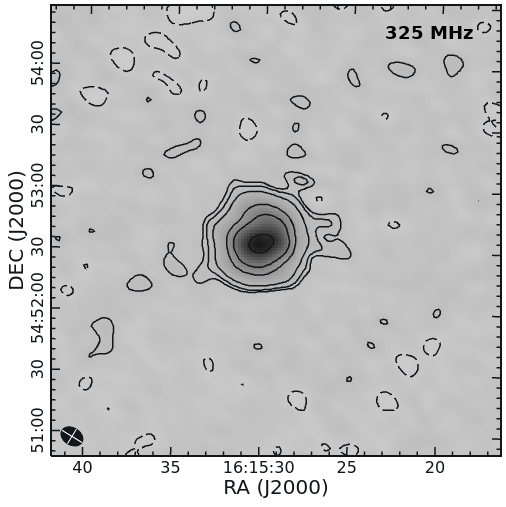
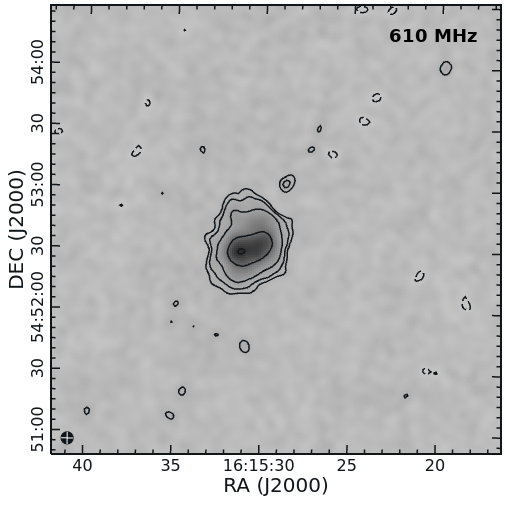
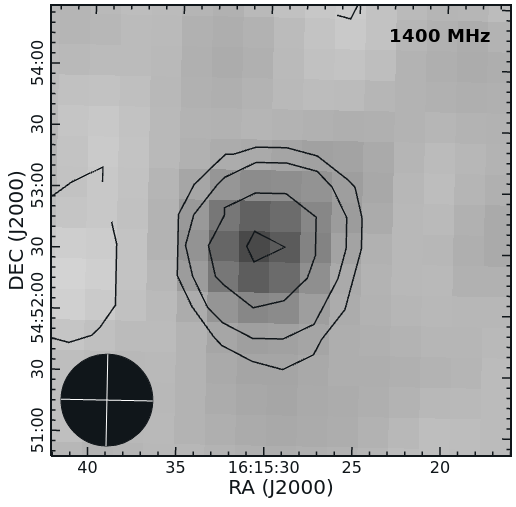
Figure 2 shows the radio images at all four frequencies. As noted in Table 1, the GMRT angular resolution ranges from 6 arcsec at 610 MHz to 20 arcsec at 150 MHz. We used PyBDSF (Mohan & Rafferty, 2015) to measure the flux density of the source from all the available images. The derived values are presented in Table 2 with the associated errors computed following the expression outlined by Hopkins et al. (2003) but with a slight modification to account for our instrumental and pointing errors:
| (1) |
where is the integrated flux density and the local rms noise.
We first noticed the peculiarity of J1615+5452 by cross-matching the GMRT 610 MHz radio image of EN1 with the high resolution 1.4 GHz VLA data. While the source is easily detectable at 610 MHz with a projected linear size of 92 kpc (0.31 arcmin) at and a flux density of 1.2 mJy, no 1.4 GHz contours however, have been recovered. The VLA high resolution images did not reveal any compact core, jets or hotspots. Such a non-standard morphological structure is worth an investigation as it was also observed by e.g. Brienza et al. (2016) when studying a remnant radio galaxy in a particularly low-density environment.
The radio emission is also featured at 150 MHz with a flux density of 6.3 mJy. In the 325 MHz image, the source has extended diffuse emission with 2.5 mJy and a projected linear size of 100 kpc (0.34 arcmin). The source extraction with PyBDSF in the low resolution NVSS data resulted in a flux density of 0.8 mJy which translates to a radio luminosity of .
We also estimated an upper limit of the radio core prominence (CP) which is a parameter used by e.g. Giovannini et al. (1988), Hardcastle et al. (2016), Brienza et al. (2016, 2017), Mahatma et al. (2018) in their search for candidate remnant AGNs. This was done by taking the ratio between the local rms noise in the high resolution VLA image from Banfield et al. (2011) and the total flux density at 150 MHz. We derived a value of CP . However, given that this value changes depending on the observing frequencies and that a low core prominence is expected for a flat-spectrum core component combined with a steep-spectrum of the total radio emission (Hardcastle & Looney, 2008), we also considered an alternative method to investigate the AGN activity in the core. By taking the value of , we used the following empirical relation established by de Ruiter et al. (1990):
| (2) |
to predict a much higher value of CP 0.02. The de Ruiter et al. (1990) relation states that the CP is inversely proportional to the radio power, i.e. low luminosity radio sources (with radio powers smaller than ) are expected to have a relatively higher CP compared to the high luminosity ones.
3.3 Radio spectrum
In the active stage, a broken power-law fit also known as the CI model (Kardashev, 1962; Jaffe & Perola, 1973) best describes the radio source spectrum with a spectral index below the break frequency and above . If the source is young enough and the observing frequency range is limited to GHz frequencies, then a simple power-law with produces a reasonable fit to its radio spectrum still unaffected by the radiative losses.
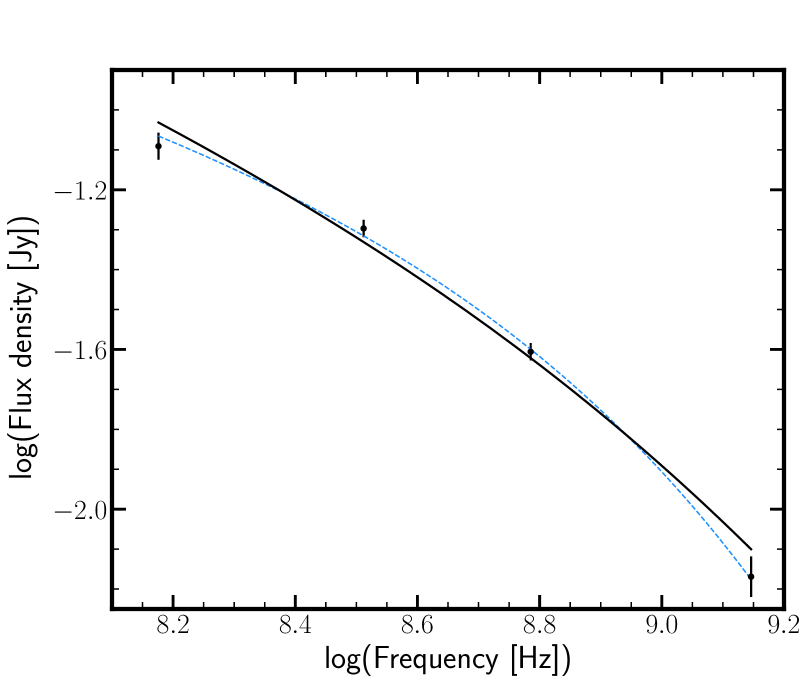
For J1615+5452, the best fit model222The best fit CIoff model by Komissarov & Gubanov (1994) is briefly described in Section 4.2. of the integrated spectrum (see Figure 3) is a broken power-law fit combined with an exponential break frequency . At low frequencies, the spectral shape is typical of active radio galaxies with an index of 0.12. Steep spectra with 0.11 and 0.15 are, however, recorded above a certain spectral break likely occurring between 325 and 610 MHz. The value of such a parameter and the resulting synchrotron age are derived in Section 4.2.
In the frequency range 150 - 1400 MHz, 0.06 and the spectral curvature parameter is equal to . The measured values of the SCP and the spectral indices are reported in Table 2.
The spectral break at low frequencies, the steep high frequency spectra as well as a SCP imply the predominance of nonthermal synchrotron emission and the central engine switch off. Such characteristic features of the spectra classify once again J1615+5452 as a dying radio AGN (e.g. Parma et al., 2007; Murgia et al., 2011; Brienza et al., 2016).
|
4 Investigating the dying radio AGN
4.1 Source energetics
A first order approximation of the synchrotron age requires an estimate of the magnetic field strength. We assume minimum energy conditions between particles and magnetic field to derive the equipartition magnetic field which is given by
| (3) |
Assuming an uniform magnetic field and an isotropic particle distribution, we computed the minimum energy density following the Govoni & Feretti (2004) formula:
| (4) |
where the parameter is dependent on frequencies ( = 10 MHz and = 100 GHz) and the synchrotron spectral index presumed for the observed spectrum; is the relativistic proton-to-electron energy density ratio. is the source surface brightness measured at the frequency and is the source depth.
At with = 325 MHz, we find and G. The other parameters in Eq. 4 are as follows: , = 0.43 mJy/arcsec2, and kpc (the average of the angular extents of the source). Note that the value of is consistent with the observed injection index measured at where the steepening is still not affecting the shape of the radio spectrum. Regarding the frequency interval, the choice of a relatively low value of = 10 MHz is motivated by the importance of the energy density of relativistic electrons radiating their energy at lower frequencies (e.g. Pacholczyk, 1970; Beck & Krause, 2005). The value of is however less critical for the minimum energy estimates. In fact, if = 10 GHz for , only decreases by 9 percent from its current value.
Previous works have reported that the classical formula used to calculate may underestimate the magnetic field strength because of inadequate assumptions of the frequency integration limits (e.g. Brunetti et al., 1997; Beck & Krause, 2005). A revised estimate is:
| (5) |
where is a modified equipartition magnetic field based on a limit of the Lorentz factors assuming . For = 100 and = 106, we find G using the 325 MHz radio emission. Because of the flat radio spectrum at low frequencies, we only expect percent deviation of the revised value from the classical (Beck & Krause, 2005). In this work, such a variation is only around 16 percent. We thus adopt the magnetic field strength G in the remainder of this work.
4.2 Synchrotron age
With estimates of the magnetic field strength and the break frequency , one can calculate to first order the spectral age using the following expression (Murgia et al., 2011):
| (6) |
where is the Inverse Compton equivalent magnetic field. By setting a lower limit to the break frequency such that MHz, an upper limit to the source age is in the order of 120 Myr.
We also run BRATS333The Broadband Radio Astronomy ToolS is a software package that uses spectral ageing models to derive the properties and morphology of a radio source. For more details, visit http://www.askanastronomer.co.uk/brats. (Harwood et al., 2013, 2015) to fit the radio spectrum and to ultimately get a more robust estimate of the synchrotron age. Given the remnant nature of the source, we fit the KGJP model to the data. This remnant radio emission model developed by Komissarov & Gubanov (1994) is also known as the CIoff model and it is a modification of the standard continuous injection model (Kardashev, 1962; Jaffe & Perola, 1973) to account for the AGN switch off.
By considering an injection index (the spectral index at low frequencies), a minimum and maximum Lorentz factor of = 100 and = 106, a magnetic field strength G, with the other input parameters set to their default values, BRATS returns a fitted age of Myr, a break frequency MHz and an off component break MHz. The timescales during active ( Myr) and quiescent ( Myr) phases were also computed. With , we get a ratio of . The off component break frequency, , does not lie within the available frequency coverage because the source is observed soon after the radio core switch off according to the fitting model, i.e. the timescale of the quiescence phase is significantly shorter than that of the active phase (Parma et al., 2007). In that case, (derived in Section 3.3) can only be considered as an upper limit of the spectral curvature parameter.
The source age of 76 Myr is in agreement with the source morphology and the steep spectral properties reported in Section 3. Note, however, that the computed value is dependent on some critical parameters such as . For instance, the derived age falls between 37 - 106 Myr while varying the injection index between 0.5 and 0.8. Such a range is consistent with the upper limit to the source age as well as the typical ages (a few tens of Myr) for dying radio galaxies (e.g. Blandford & Ostriker, 1978; Murgia et al., 2011; Brienza et al., 2016).
Although we can achieve the best fit model with and G as free parameters ( = 1.42, dashed line in Figure 3), we decided to consider BRATS outputs associated with fixed values of and G. The latter parameters are consistent with the radio properties of the source (e.g. the spectral index at lower frequencies) and the resulting model still gives a reasonable fit to the radio spectrum ( = 8.86, solid line in Figure 3). Table 3 summarizes BRATS fitting results in both cases.
5 Discussion
A low core prominence may result from the very weak or no core emission, a potential evidence of the central AGN switch off. In the case of J16155452, the observed core prominence of falls within the range of CP that are associated with the remnant radio sources from the literature (e.g. Giovannini et al., 1988; Hardcastle et al., 2016; Brienza et al., 2017; Mahatma et al., 2018). Such a low value is well below CP 0.02 (the CP value expected for a source of the same radio power assuming the empirical correlation found by de Ruiter et al. 1990) and it is in agreement with a quiescent nuclear engine or an active one but at a very weak level than what is observed in typical radio sources. Furthermore, the value of CP 0.02 also falls within the interval of 0.1 - 0.001, which is a CP range reported by de Ruiter et al. (1990) for B2 sources with radio powers between including a very small fraction of remnant radio AGNs. Nevertheless, classifying a radio source as a remnant based only on its core activity is deemed unreliable, especially for lower resolution and sensitivity observations where a faint core may be missed (e.g. Mahatma et al., 2018). It is thus recommended to combine this parameter with other selection criteria to achieve unbiased detection (e.g. Brienza et al., 2017).
In this work, and . These spectral characteristics are comparable to those of the complete samples of remnant radio galaxies drawn by Parma et al. (2007) and Murgia et al. (2011). The former authors define a dying radio source based on steep spectral shape () and the absence of compact radio structures, whereas the latter consider as well the source spectral curvature () as one of its complementary selection criteria to search for candidate remnant AGNs.
In addition, J1615+5452 has similar spectral properties with those of remnant radio galaxies observed in the LOFAR Lockman Hole field ( and , Brienza et al. 2017). Note however that the source spectral index at low frequencies is consistent with the spectra of active radio galaxies. Murgia et al. (2011) and Brienza et al. (2016) also noticed such spectral shape while investigating the radio properties of B2 1619+29 and blob1 (a remnant radio galaxy in the LOFAR field), respectively. A slow rate of radiative cooling or a young plasma are suggested to explain the observed spectral feature. It is therefore crucial to carry multi-frequency analyses for an optimal detection of genuine dying radio sources with such spectra.
The computed magnetic field G is in agreement with the magnetic field strengths of previously studied remnant radio AGNs (e.g. Murgia et al., 2011; de Gasperin et al., 2014; Brienza et al., 2016; Duchesne & Johnston-Hollitt, 2019) and dying giant radio galaxies (e.g. Tamhane et al., 2015) of the order of a few G. Such a weak magnitude implies the predominance of the Inverse Compton scattering from the CMB over the synchrotron losses throughout the radiative cooling of the diffuse plasma (Komissarov & Gubanov, 1994).
The age range of the source in Section 4.2 is comparable to those of other dying AGNs such as B2 0924+30 (54 Myr by Jamrozy et al. 2004, 88 Myr by Shulevski et al. 2017, 78 Myr by Turner 2018), the median age of the remnant samples from the Westerbork Northern Sky Survey (63 Myr, Parma et al. 2007) and blob1 (75 Myr, Brienza et al. 2016). With Myr, the source is relatively older than the low luminosity radio galaxies from the B2 sample with a median age of 31 Myr (Parma et al., 1999).
| [G] | [MHz] | [MHz] | [Myr] | |||
| (1) | (2) | (3) | (4) | (5) | (6) | (7) |
| 0.40 | 12.5 | 347 | 1024 | 0.6 | 1.42 | |
| 0.61 | 4.1 | 384 | 5029 | 0.3 | 8.86 | |
| Notes. Columns 1 & 2: the injection index and the magnetic field as input parameters; Column 3: the break frequency; Column 4: the off-component break frequency; Columns 5 & 6: the computed synchrotron age of the source and the ratio between the quiescent and the active timescales; Column 7: the reduced chi-square of the fit. | ||||||
By spending 30 percent of its lifetime in the quiescent phase, the ratio of J1615+5452 fits within the range reported in Parma et al. (2007) and Murgia et al. (2011). Once the dormant phase of the nuclear engine kicks off, either permanently or intermittently, the source compact radio structure will (partially) disappear due to the lack of freshly injected particles.
The diffuse radio emission of the source at low frequencies is similar to the peculiar morphology of other dying radio AGNs such as B2 0924+30 and blob1 which were also discovered (partly) because of their amorphous radio emission. Assuming that the host galaxy resides in a loose group environment (see Section 3.1), then J1615+5452 also resembles to these two sources in a way that they are among the few known examples of non cluster-based dying radio galaxies (Jamrozy et al., 2004; de Gasperin et al., 2014; Hurley-Walker et al., 2015; Duchesne & Johnston-Hollitt, 2019).
Finally, based on the different stages of the core activity (assuming the AGN lifecycle is tightly related to the accretion of matter onto the SMBH), the population of radio galaxies can be classified into three broad categories: the active, the dying and the restarted ones (Cordey, 1987; Morganti, 2017). In the case of an intermittently active radio source, the nuclear engine undergoes multiple cycles of AGN activity of the order of yr instead of a continuous activity with a single accretion phase that usually lasts yr (Marconi et al., 2004; Schawinski et al., 2015). During the quiescent AGN phase, the nuclear activity is either significantly reduced or temporarily switched off due to a shortage of material accreting onto the SMBH. The central engine of the nuclear activity will eventually reignite once a new phase of accretion onto the SMBH starts again. Such a rejuvenation of AGN activity is deemed responsible for the presence of a flat-spectrum radio core that co-exists with remnant radio lobes from past nuclear activity (e.g. Saikia & Jamrozy, 2009; Morganti, 2017). With no direct evidence of a restarted core and/or new born jets for the current source, and based on the derived characteristics in Sections 3 and 4, we potentially classify J1615+5452 as a dying radio AGN. This implies that the radio core no longer fuels fresh particle injection. The fossil radio lobes, however, remain visible (up to yr depending on the radio source environment) because of the radiating low energy particles being relatively unaffected by the fast spectral evolution.
6 Summary and conclusions
We have presented in this paper the discovery of a candidate remnant radio galaxy J1615+5452 in the ELAIS-N1 field. Using low frequency GMRT observations combined with archival VLA data, we derived the source flux densities between 150 and 1400 MHz to investigate the source radio spectrum. Our main results are summarized below:
-
1.
The candidate remnant AGN is likely associated with an early-type elliptical galaxy at redshift of . The potential host galaxy appears to reside in a low-density environment.
-
2.
With an angular extent of 100 kpc, J1615+5452 has a diffuse amorphous radio emission with no evidence of compact core, jets and hotspots. We also did not detect radio counterparts in the 1.4 GHz VLA data with a high resolution of 5 arcsec.
-
3.
The spectral indices between 150 and 1400 MHz vary between and which give a high spectral curvature . Such spectral features indicate the predominance of nonthermal synchrotron emission with strong ongoing radiative losses.
-
4.
The radio spectrum is reasonably described by a CIoff model with a break frequency MHz and an off component break at GHz. The computed synchrotron age is Myr with Myr and Myr. The source is estimated to have spent 30 percent of its total lifetime in the fading phase.
The morphological characteristics of J1615+5452 coupled with its spectral properties and synchrotron age helped us to classify the peculiar source as a dying radio galaxy. Combining such analyses is key to identify elusive remnant radio AGNs that play an important role toward a comprehensive understanding of AGN evolution in general. With new or upgraded low frequency radio interferometers such as LOFAR and the upgraded GMRT (uGMRT, Gupta et al., 2017), ongoing analyses of deep radio surveys are expected to significantly increase the detection of these rare sources. Furthermore, prior the completion of the Square Kilometre Array444https://www.skatelescope.org (SKA), instruments like the Australian SKA Pathfinder (ASKAP, Johnston et al., 2008) and the South African MeerKAT telescope (Jonas & MeerKAT Team, 2016; Camilo et al., 2018) are also expected to provide GHz frequency observations with arcsec resolution and unprecedented sensitivities to large scale structures. Such capabilities are ideal for identifying remnant radio galaxies despite the source spectral evolution.
Acknowledgements
The authors thank the referee for detailed comments and constructive suggestions. We are also grateful to the staff of the GMRT that made these observations possible. GMRT is run by the National Centre for Radio Astrophysics of the Tata Institute of Fundamental Research. This work has made use of the Cube Analysis and Rendering Tool for Astronomy (CARTA, Comrie et al., 2018). ZR acknowledges the support and funding from the South African Astronomical Observatory and the South African Radio Astronomy Observatory, which are facilities of the National Research Foundation, an agency of the Department of Science and Innovation. CHIC acknowledges the support of the Department of Atomic Energy, Government of India, under the project 12-R&D-TFR-5.02-0700.
Data availability
The data underlying this article are available in Table 2 of the article. This publication makes use of archival GMRT datasets and VLA image available at https://naps.ncra.tifr.res.in/goa/ and https://www.cv.nrao.edu/nvss/, respectively. GMRT radio images will be shared on reasonable request to the corresponding author.
References
- Abolfathi et al. (2018) Abolfathi B., et al., 2018, ApJS, 235, 42
- Alam et al. (2015) Alam S., et al., 2015, ApJS, 219, 12
- Banfield et al. (2011) Banfield J. K., George S. J., Taylor A. R., Stil J. M., Kothes R., Scott D., 2011, ApJ, 733, 69
- Beck & Krause (2005) Beck R., Krause M., 2005, Astronomische Nachrichten, 326, 414
- Becker et al. (1995) Becker R. H., White R. L., Helfand D. J., 1995, ApJ, 450, 559
- Blandford & Ostriker (1978) Blandford R. D., Ostriker J. P., 1978, ApJ, 221, L29
- Brienza et al. (2016) Brienza M., et al., 2016, A&A, 585, A29
- Brienza et al. (2017) Brienza M., et al., 2017, A&A, 606, A98
- Brunetti et al. (1997) Brunetti G., Setti G., Comastri A., 1997, A&A, 325, 898
- Camilo et al. (2018) Camilo F., et al., 2018, ApJ, 856, 180
- Chakraborty et al. (2019) Chakraborty A., et al., 2019, MNRAS, 490, 243
- Cohen et al. (2007) Cohen A. S., Lane W. M., Cotton W. D., Kassim N. E., Lazio T. J. W., Perley R. A., Condon J. J., Erickson W. C., 2007, AJ, 134, 1245
- Comrie et al. (2018) Comrie A., et al., 2018, CARTA: The Cube Analysis and Rendering Tool for Astronomy, doi:10.5281/zenodo.3377984, https://doi.org/10.5281/zenodo.3377984
- Condon et al. (1998) Condon J. J., Cotton W. D., Greisen E. W., Yin Q. F., Perley R. A., Taylor G. B., Broderick J. J., 1998, AJ, 115, 1693
- Cordey (1986) Cordey R. A., 1986, MNRAS, 219, 575
- Cordey (1987) Cordey R. A., 1987, MNRAS, 227, 695
- Duchesne & Johnston-Hollitt (2019) Duchesne S. W., Johnston-Hollitt M., 2019, Publ. Astron. Soc. Australia, 36, e016
- Fabian (2012) Fabian A. C., 2012, ARA&A, 50, 455
- Garn et al. (2008) Garn T., Green D. A., Riley J. M., Alexand er P., 2008, MNRAS, 383, 75
- Gentile et al. (2007) Gentile G., Rodríguez C., Taylor G. B., Giovannini G., Allen S. W., Lane W. M., Kassim N. E., 2007, ApJ, 659, 225
- Giovannini et al. (1988) Giovannini G., Feretti L., Gregorini L., Parma P., 1988, A&A, 199, 73
- Govoni & Feretti (2004) Govoni F., Feretti L., 2004, International Journal of Modern Physics D, 13, 1549
- Grant et al. (2010) Grant J. K., Taylor A. R., Stil J. M., Land ecker T. L., Kothes R., Ransom R. R., Scott D., 2010, ApJ, 714, 1689
- Gupta et al. (2017) Gupta Y., et al., 2017, Current Science, 113, 707
- Hardcastle & Looney (2008) Hardcastle M. J., Looney L. W., 2008, MNRAS, 388, 176
- Hardcastle et al. (2016) Hardcastle M. J., et al., 2016, MNRAS, 462, 1910
- Harwood et al. (2013) Harwood J. J., Hardcastle M. J., Croston J. H., Goodger J. L., 2013, MNRAS, 435, 3353
- Harwood et al. (2015) Harwood J. J., Hardcastle M. J., Croston J. H., 2015, MNRAS, 454, 3403
- Hopkins et al. (2003) Hopkins A. M., Afonso J., Chan B., Cram L. E., Georgakakis A., Mobasher B., 2003, AJ, 125, 465
- Hurley-Walker et al. (2015) Hurley-Walker N., et al., 2015, MNRAS, 447, 2468
- Intema et al. (2009) Intema H. T., van der Tol S., Cotton W. D., Cohen A. S., van Bemmel I. M., Röttgering H. J. A., 2009, A&A, 501, 1185
- Intema et al. (2017) Intema H. T., Jagannathan P., Mooley K. P., Frail D. A., 2017, A&A, 598, A78
- Jaffe & Perola (1973) Jaffe W. J., Perola G. C., 1973, A&A, 26, 423
- Jahnke & Macciò (2011) Jahnke K., Macciò A. V., 2011, ApJ, 734, 92
- Jamrozy et al. (2004) Jamrozy M., Klein U., Mack K.-H., Gregorini L., Parma P., 2004, A&A, 427, 79
- Jelić et al. (2014) Jelić V., et al., 2014, A&A, 568, A101
- Johnston et al. (2008) Johnston S., et al., 2008, Exp. Astron., 22, 151
- Jonas & MeerKAT Team (2016) Jonas J., MeerKAT Team 2016, in MeerKAT Science: On the Pathway to the SKA. p. 1
- Jurlin et al. (2020) Jurlin N., et al., 2020, arXiv e-prints, p. arXiv:2004.09118
- Kapińska et al. (2010) Kapińska A. D., Uttley P., Kaiser C. R., 2010, Birth and Evolution of Radio Galaxies. p. 337
- Kardashev (1962) Kardashev N. S., 1962, Soviet Ast., 6, 317
- Kennicutt (1992) Kennicutt Jr. R. C., 1992, ApJS, 79, 255
- Komissarov & Gubanov (1994) Komissarov S. S., Gubanov A. G., 1994, A&A, 285, 27
- Konar et al. (2013) Konar C., Hardcastle M. J., Jamrozy M., Croston J. H., 2013, MNRAS, 430, 2137
- Kormendy & Ho (2013) Kormendy J., Ho L. C., 2013, ARA&A, 51, 511
- Lonsdale et al. (2009) Lonsdale C. J., et al., 2009, IEEE Proceedings, 97, 1497
- Mahatma et al. (2018) Mahatma V. H., et al., 2018, MNRAS, 475, 4557
- Marconi et al. (2004) Marconi A., Risaliti G., Gilli R., Hunt L. K., Maiolino R., Salvati M., 2004, MNRAS, 351, 169
- Mohan & Rafferty (2015) Mohan N., Rafferty D., 2015, PyBDSF: Python Blob Detection and Source Finder, Astrophysics Source Code Library (ascl:1502.007)
- Morganti (2017) Morganti R., 2017, Nature Astronomy, 1, 596
- Murgia et al. (2011) Murgia M., et al., 2011, A&A, 526, A148
- Ocran et al. (2020) Ocran E. F., Taylor A. R., Vaccari M., Ishwara-Chandra C. H., Prandoni I., 2020, MNRAS, 491, 1127
- Oliver et al. (2000) Oliver S., et al., 2000, MNRAS, 316, 749
- Pacholczyk (1970) Pacholczyk A. G., 1970, Radio astrophysics. Nonthermal processes in galactic and extragalactic sources. San Francisco, Freeman
- Parma et al. (1999) Parma P., Murgia M., Morganti R., Capetti A., de Ruiter H. R., Fanti R., 1999, A&A, 344, 7
- Parma et al. (2007) Parma P., Murgia M., de Ruiter H. R., Fanti R., Mack K.-H., Govoni F., 2007, A&A, 470, 875
- Planck Collaboration et al. (2016) Planck Collaboration et al., 2016, A&A, 594, A13
- Saikia & Jamrozy (2009) Saikia D. J., Jamrozy M., 2009, Bulletin of the Astronomical Society of India, 37
- Saripalli et al. (2012) Saripalli L., Subrahmanyan R., Thorat K., Ekers R. D., Hunstead R. W., Johnston H. M., Sadler E. M., 2012, ApJS, 199, 27
- Schawinski et al. (2015) Schawinski K., Koss M., Berney S., Sartori L. F., 2015, MNRAS, 451, 2517
- Shabala et al. (2020) Shabala S. S., Jurlin N., Morganti R., Brienza M., Hardcastle M. J., Godfrey L. E. H., Krause M. G. H., Turner R. J., 2020, MNRAS,
- Shulevski et al. (2012) Shulevski A., Morganti R., Oosterloo T., Struve C., 2012, A&A, 545, A91
- Shulevski et al. (2017) Shulevski A., et al., 2017, A&A, 600, A65
- Sijacki et al. (2015) Sijacki D., Vogelsberger M., Genel S., Springel V., Torrey P., Snyder G. F., Nelson D., Hernquist L., 2015, MNRAS, 452, 575
- Silk & Rees (1998) Silk J., Rees M. J., 1998, A&A, 331, L1
- Sirothia et al. (2009) Sirothia S. K., Dennefeld M., Saikia D. J., Dole H., Ricquebourg F., Roland J., 2009, MNRAS, 395, 269
- Slee et al. (2001) Slee O. B., Roy A. L., Murgia M., Andernach H., Ehle M., 2001, AJ, 122, 1172
- Sohn et al. (2003) Sohn B. W., Klein U., Mack K.-H., 2003, A&A, 404, 133
- Swarup (1991) Swarup G., 1991, Proceedings of the IAU Colloquium 131: Radio interferometry. Theory, techniques, and applications, eds. T. J. Cornwell & R. A. Perley, 19, 376
- Tamhane et al. (2015) Tamhane P., Wadadekar Y., Basu A., Singh V., Ishwara-Chandra C. H., Beelen A., Sirothia S., 2015, MNRAS, 453, 2438
- Taylor & Jagannathan (2016) Taylor A. R., Jagannathan P., 2016, MNRAS, 459, L36
- Tingay et al. (2013) Tingay S. J., et al., 2013, Publ. Astron. Soc. Australia, 30, 7
- Turner (2018) Turner R. J., 2018, MNRAS, 476, 2522
- de Gasperin et al. (2014) de Gasperin F., Intema H. T., Williams W., Brüggen M., Murgia M., Beck R., Bonafede A., 2014, MNRAS, 440, 1542
- de Ruiter et al. (1990) de Ruiter H. R., Parma P., Fanti C., Fanti R., 1990, A&A, 227, 351
- van Haarlem et al. (2013) van Haarlem M. P., et al., 2013, A&A, 556, A2