Non-rotational Mechanism of Polarization in Alcohols
Abstract
Chemical polarity governs various mechanical, chemical and thermodynamic properties of dielectrics. Polar liquids have been amply studied, yet the basic mechanisms underpinning their dielectric properties remain not fully understood, as standard models following Debye’s phenomenological approach do not account for quantum effects and cannot aptly reproduce the full dc-up-to-THz spectral range. Here, using the illustrative case of monohydric alcohols, we show that deep tunneling and the consequent intermolecular separation of excess protons and “proton-holes” in the polar liquids govern their static and dynamic dielectric properties on the same footing. We performed systematic ultrabroadband (0-10 THz) spectroscopy experiments with monohydric alcohols of different (0.4-1.6 nm) molecular lengths, and show that the finite lifetime of molecular species, and the proton-hole correlation length are the two principle parameters responsible for the dielectric response of all the studied alcohols across the entire frequency range. Our results demonstrate that a quantum non-rotational intermolecular mechanism drives the polarization in alcohols while the rotational mechanism of molecular polarization plays a secondary role, manifesting itself in the sub-terahertz region only.
Skoltech] Center for Energy Science and Technology, Skolkovo Institute of Science and Technology, 121205 Moscow, Russia Skoltech] Center for Energy Science and Technology, Skolkovo Institute of Science and Technology, 121205 Moscow, Russia BYU] Department of Chemistry and Biochemistry, Brigham Young University, 84602 Provo, Utah, USA RQC] Russian Quantum Center, 143025 Moscow, Russia Skoltech] Center for Energy Science and Technology, Skolkovo Institute of Science and Technology, 121205 Moscow, Russia
1 Introduction
A polar liquid can be seen as a system of permanent electric dipoles interacting with one another. The frequency-dependent response of such a liquid to the perturbation of an oscillating electric field manifests itself via the dielectric relaxation. The interpretation of dielectric spectra yields information on the dipole relaxation time and mechanisms, which in turn provides a detailed understanding of the physical and chemical properties of polar liquids, including their molecular structures, interactions, and dynamics. Water and alcohols are two typical examples of polar liquids, but many more may be found in nature or synthesized. In particular, some chelate compounds like hemoglobin and chlorophyll play a vital role in biological systems, thus illustrating the importance of chemical polarity.
The polar character of alcohols is due to the presence of the characteristic hydroxyl group, OH, bound to a carbon atom that forms simple covalent bonds with other groups of atoms. Just like water, alcohols have a relatively high dielectric constant and are good solvents. Their typical size and relatively low complexity make them interesting systems to study with dielectric spectroscopy. That is why over the past decades, the interaction of electric fields with alcohols has been the object of experimental and theoretical research 1, 2, 3, 4, 5, 6, 7, 8, 9, 10, 11, which showed many other fundamental similarities with water 12, 13. These findings notably triggered the studies of alcohols in the glassy state - an experimentally inaccessible thermodynamic region for water 14, 15, which led to the prediction of some supercooled 16 and confined 17 water properties, as well as deeper insights into dielectric phenomena in protonic liquids 18. However, the understanding on the microscopic level of the response of alcohol molecules to an alternating electric field remains far from complete 19, 8, 20.
Debye’s early phenomenological models of the dielectric polarization assumed molecules as rigid dipoles following the external electric field direction, with a characteristic time reflecting the average effect of molecular correlations 21, 22, 23. In this approach the parametric relationship between the real and imaginary parts of the dielectric function in Cole-Cole diagrams 24, 25 differs from experimental data in the high-frequency domain, implying that important short-time scale physics is missed altogether. For alcohols, the discrepancy between the measured dielectric constants and those determined by calculation with the Debye formula using a gas-phase molecular dipole moment value of D becomes significant at low temperatures 26. In addition, the Debye model does not account for steric, and entropic effects that influence the molecules’ geometry as shown with isomeric octanols 27. Accounting for intermolecular correlations and local-field effects 28, 29, 30 by introducing for instance the Kirkwood g-factor, and using improved models for the relaxation time 31, 32, 33 yields good theory-experiment agreement for the dielectric constants of alcohols 18, 34. However, other dynamical processes, such as self-diffusion, protonic current, and high-frequency (terahertz) modes as well as their temperature dependencies, still lack clarity 12, 35, 36, 37, 38.
As an alternative, one may consider a chain-like structure made of several OH groups as the transient chain model for monohydric alcohols 8. Then, if D, the total of 6 aligned moments in a chain is D, which is large enough to account for the dielectric constant. Nonetheless, several problems remain: i/ there is no proton transfer in this chain model, hence no dc conductivity; ii/ the dielectric relaxation time is too short to allow for the alignment of a sizable number of dipoles, required for the experimentally observed dielectric constant (see Appendix); iii/ the thermal energy eV is an order of magnitude larger than the dipole-dipole interaction energy eV, with being the vacuum permittivity, so no long-lived chain-like structures are possible in alcohols on the time scale of dielectric relaxation; iv/ the shape of the dielectric relaxation function appears not to depend on the molecular length 2, hence there is no broadening of the relaxation band with increase of the molecular size as one would expect from the molecular-reorientation mechanism; and v/the chemical shift of OH-peaks in 1H-NMR in alcohols39 assumes intensive proton exchange between molecules, which is completely missing in the existing models. In fact, knowledge of the dipole moment of a single molecule only is insufficient to explain the polarization-related phenomena in alcohols. In particular, quantum effects that have been extensively identified in water and biological systems for decades, even at room temperature and above40, 41, 42, 43, have never been considered in alcohols.
In the present work, we perform a systematic ultra-broadband dielectric spectroscopy study on a series of monohydric alcohols of increasing carbon chain length. In comparison with previous studies 2, 4, 8, 10, 7, 5, 6, 11, 9, 3, 1, 12, 13, 14, 15, 16, 18, 19, we expand the frequency domain down to the static conductivity, and up to the terahertz range, and we consistently perform the measurements for all the alcohols with the same experimental setup. From this data we unravel the preeminent role of proton intermolecular dynamics in the dielectric response across the whole frequency range, and show that both the static conductivity and the high-frequency dielectric polarization of alcohols can be explained by considering the charge separation over intermolecular distances induced by proton tunneling. We show that the formation of short-living “excess proton-proton hole” pairs ( dipoles), whose diffusion-controlled dynamics yields both the high dielectric constant and the relatively high dc conductivity, leaves to the rotational relaxation mechanism a secondary role in the polarization of alcohols.
2 Methods
We used commercially available high-purity ( 99.9%) primary monohydric alcohols, which we classify according to their molecular length, characterized by the number of carbon atoms, , in their hydrocarbon chain: methanol, ethanol, 1-propanol, 1-butanol, and decanol (). We used Keysight E4980A and N9917A impedance analyzers, operating in the parallel plate and coaxial probe modes, respectively. The real, , and imaginary, , parts of the dielectric function were obtained following the standard procedure 44. The sample temperature was controlled by Peltier elements within 0.3 K accuracy in the 283 - 363 K temperature range. The terahertz spectra were adapted from Refs. 45, 46. In this way, we accumulated spectral data from 1 kHz to 10 THz.
3 Results
Figure 1 shows our measurement data of the alcohols’ dielectric constants , dielectric losses , and dynamic conductivities . With molecular lengths ranging from 0.4 to 1.6 nm, the alcohol molecules stretch from almost spherical to rode-like geometries, retaining their dipole moment . The static dielectric constant, , direct-current conductivity, , high-frequency conductivity, , relaxation time, , and terahertz vibrational frequency, , are also shown in Fig. 1, and their values given in Table 1. The time in Fig. 1c corresponds to the ac-dc transition. The main relaxation band and its excess wing in Fig. 1b consistently shift towards lower frequencies as increases. The larger , the larger , and the smaller and . The frequency of the oscillator shown in Fig. 1c, varies fairly little with .
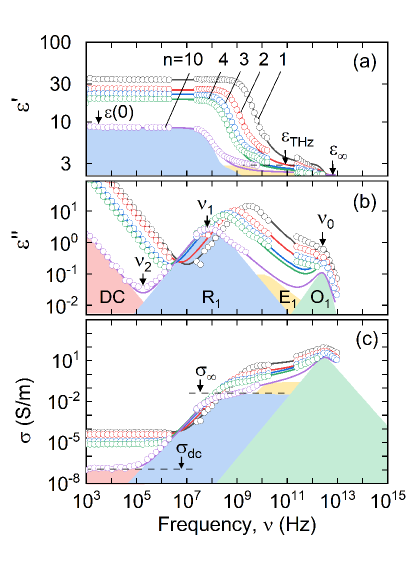
| 1 | 2 | 3 | 4 | 10 | |
| 34 | 26 | 22 | 19 | 8.5 | |
| 4.4 | 3.9 | 3.4 | 3.0 | 2.5 | |
| 2.2 | 2.2 | 2.2 | 2.2 | 2.2 | |
| (Sm-1) | 57 | 37 | 12 | 7.4 | 0.13 |
| (Sm-1) | 4.77 | 1.22 | 0.41 | 0.24 | 0.027 |
| (THz) | 2.89 | 2.57 | 2.39 | 2.20 | 2.05 |
| (GHz) | 2.95 | 0.90 | 0.43 | 0.29 | 0.08 |
| (MHz) | 9.95 | 5.31 | 1.99 | 1.30 | 0.17 |
| (ps) | 54 | 177 | 370 | 549 | 1989 |
| (ns) | 16 | 30 | 80 | 122 | 937 |
| (%) | 87 | 86 | 85 | 84 | 74 |
| (%) | 6.5 | 6.5 | 5.7 | 4.5 | 3.5 |
Figure 2 shows part of the dielectric losses data of Fig. 1b in the 1 kHz to 0.1 THz range. For each considered, the functions are normalized to their corresponding maximum value of the relaxation at corresponding frequency given in Table 1. All the normalized spectra collapse into a unique master curve irrespective of their molecular aspect ratio (effective diameter/molecule length) for all alcohols considered in our work. This strongly suggests that the same microscopic mechanisms govern the dielectric losses for all alcohol studied. Note that the high-frequency wings and the dc conductivity (yellow and pink areas in Fig. 2), are also scaled. This implies that they are governed by a common molecular mechanism, which is the same for the main relaxation band , again irrespective of the molecule geometries. Data accuracy for decanol is the object of a separate discussion (see Appendix).
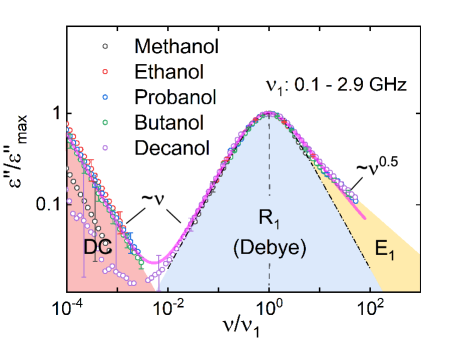
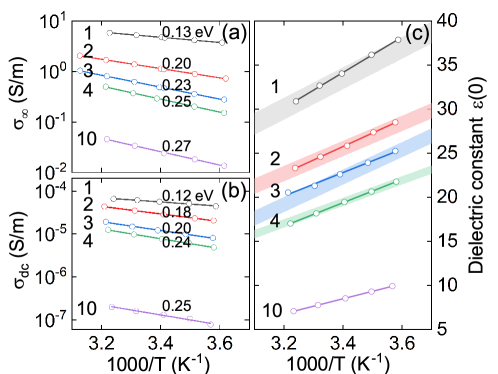
Figure 3, panels (a) and (b), show the temperature dependencies of and , both in accord with the Arrhenius law: . We observe a systematic increase of the diffusion activation energy from 0.13 eV (methanol) to 0.27 eV (decanol) with increasing . All alcohols studied show nearly identical trends of increasing and . We also observe that for a given , the activation energies are nearly the same when calculated from both the dc and high-frequency conductivity values (Table 2). This property implies the same driving mechanism for both high- and low- frequency conductivities, which relates to self-diffusion of molecules. Note that the dc conductivities measured in this study are lower than those obtained in 47, 48. Further, our data clearly show that the activation energies increase with , whereas the previous studies reported a constant value eV for all alcohols 47, 48. This discrepancy may be caused by the different purity of samples: our samples have higher purity, and show consistent behavior of the conductivity, correlated with self-diffusion, which lends credibility to the reliability of our measurement data. Figure 3c shows the temperature dependencies of the static dielectric constant . Each curve follows a Curie-Weiss type of law: , with being an alcohol-specific variable explained further below. Note that has the same nature as the main Debye relaxation , because the latter gives a contribution up to 90% to (see Table 1): the amplitude and position of the main relaxation determine the dielectric constant.
| 1 | 2 | 3 | 4 | 10 | |
| (nm2ns-1) | 2.44 | 1.16 | 0.60 | 0.50 | 0.12 |
| (eV) | 0.13(3) | 0.20(1) | 0.24(1) | 0.25(1) | 0.26(1) |
| (Sm-1) | 6500 | 45100 | 32200 | 96300 | 2510 |
| (eV) | 0.12(2) | 0.18(2) | 0.20(3) | 0.24(2) | 0.25(3) |
| (Sm-1) | 4.77 | 1.22 | 0.41 | 0.24 | 0.027 |
| (eV) | 0.13(2) | 0.20(2) | 0.23(2) | 0.25(2) | 0.27 |
| 1 | 2 | 3 | 4 | 10 | |
| (nm) | 0.50 | 0.57 | 0.62 | 0.66 | 0.84 |
| (nm) | 40.6 | 36.6 | 42.8 | 47.4 | 108.0 |
| (ps) | 51 | 140 | 320 | 436 | 3207 |
| (M) | 24.7 | 17.2 | 13.3 | 10.9 | 5.25 |
| (M) | 0.5 | 0.3 | 0.2 | 0.1 | 0.05 |
| (M) | 6.2 | 8.5 | 5.3 | 3.9 | 0.32 |
| 0.020 | 0.017 | 0.015 | 0.010 | 0.009 | |
| (model) | 15.8 | 15.4 | 15.7 | 15.9 | 16.1 |
| 15.5 | 15.5 | 16.1 | 16.1 | - |
4 Discussion
As we experimentally observe uniform polarization dynamics of alcohols, we can unravel its underpinning physical mechanism. Accounting for quantum effects in liquids may be of importance to explain some of their properties 52, 53, 54. The strongly delocalized nature of the excited vibrational states of the O-H stretch vibration, as shown by ab initio path integral simulations, are responsible for the mechanism of proton transfer at room temperature55. Because water and alcohols share some common properties, we assume that proton intermolecular tunneling, a process well-identified in water 40, 56, also occurs in alcohols.
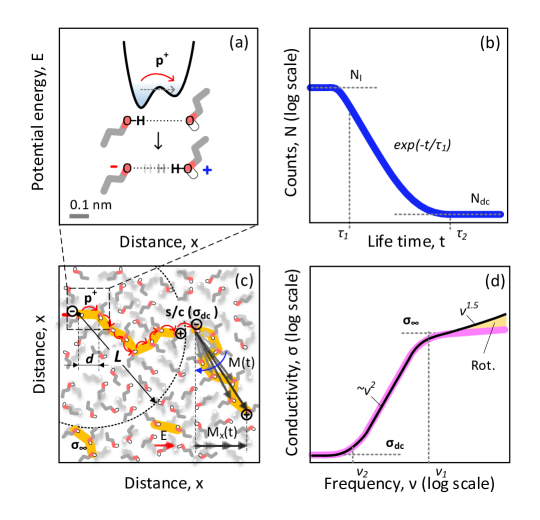
Figure 4 is a depiction of our alcohol model. Fig. 4a represents the double-well potential formed by two bounded molecules. The gray tails represent H(CH2)n alkyl groups (for alcohols) or just one hydrogen atom H (for water). Each proton of the OH group has a non-zero probability to tunnel through the potential barrier. Such hydrogen bridges, where a proton with electric charge , is delocalized between the molecules, continuously form and break on the subpicosecond timescale 57. Note that the relaxation time (Table 1) is larger. Proton tunneling requires two oxygen atoms to align exactly along the proton transfer line, which occurs on the 1-2 ps time scale 58. When the bond breaks, the proton can detach from the parent molecule, and forms a proton-hole pair, or two ionic species, RO⊖ and ROH 59. The energy difference between molecular and ionic states results from collective molecular effects in the adiabatic regime 60. The ions have been shown to be just 2 kcal/mol (0.09 eV) higher in energy than neutral molecules61 (see potential minima in Fig. 4a). The majority of newly-formed ions, however, recombine within 1 ps 62, but some of them can live much longer. This lifetime is expected to be higher in alcohols because the probability of proton transfer is lower due to the increase of the distance between OH groups.
Figure 4b shows the time distribution of ionic species concentration: , where is the instantaneous concentration of all ionic species (both short- and long-lived), is the characteristic time of excess proton state (proton-hole pair lifetime), and is the concentration of those ionic species, which reach the percolation threshold (Fig. 4b) and show dc conductivity. Figure 4d shows the conductivity spectrum given by , and which, for reduces to:
| (1) |
where , . Here excess protons and molecules have the same frequency-independent diffusion coefficient (Table 2), as shown by tracer-diffusion experiments63. We associate this fact with the “proton-sticking” mechanism, when a proton, while transferring between the molecules, still stays attached to one or another molecule and thus has the same diffusion coefficient.
Equation (1) reproduces well the experimental spectra of alcohols up to 0.1 THz (see the magenta curve in Figs. 1c and 4d). For it gives the plateau, and for the plateau. These two plateaus correspond to the same mechanism of proton-hole separation, with equal activation energies , but the respective conductivity levels are different because if all pairs contribute; if only the long-lived pairs contribute. Comparing Eq. (1) with the experimental spectrum in Fig. 1, we find that (main Debye relaxation ) coincides with (proton-hole pairs lifetime). The ac-dc transition time equals . The model (1) assumes that the polarization in alcohols is due to translational diffusion of unbound charges, namely excess protons and proton holes ( dipoles) with lifetimes determined by separation and recombination. The proton-hole dynamical structure is similar to a plasma in the frame of reference of the globally neutral molecular network.
Figure 4c illustrates our proposed mechanism. Yellow lines show excess protons trajectories (“wires”). A spontaneous relative displacement of charges (protons and holes) changes the dipole moment (black arrows) and its projection on the -axis along the external electric field . Note that the position of the proton hole is shown fixed for simplicity. The corresponding polarization determines the dielectric function and the dynamical conductivity . The lifetime distribution (Fig. 4b) imposes the wire length . The unit-length segment corresponds to , and is equal to the distance between OH groups of randomly oriented molecules (Table 3). The time coincides with . The second length represents the minimum length of proton wire required for the short-circuit (see ’s/c’ in Fig. 4c), or dc conduction . The corresponding time , represents the moment when the mean-square-displacement spheres of protons start to overlap. The concentration of ionic species with lifetime equals , and corresponds to the dissociation constant (Table 3). Note that the percolation threshold does not depend on the sample thickness 64.
We can now derive the equation for the static dielectric constant, which according to the Debye formula reads , from which we get:
| (2) |
where is shown in Fig. 1a, and is the dissociation constant (Table 2). Note that the molecular concentration represents here the concentration of OH groups. Equation (2) fits well the experimental data including temperature dependencies (see lines in Fig. 3c). In contrast to the formula of the Debye-Onsager-Fröhlich-Kirkwood approach 28, 29, 30, Eq. (2) includes only one material-specific parameter, the dissociation constant , and does not require the knowledge the single-molecule dipole moment . Therefore, within our model, the proton-hole dipole moments are responsible for polarization in alcohols.
Our model gives a relatively high instantaneous concentration of excess protons (% - see Table 3). This does not contradict the because only a small part of actually contributes to the static conductivity, while contributes fully to the high-frequency dielectric response. The concentration of short-lived ions of about 2% of all alcohol molecules, assumes a potential barrier 0.1 eV (2.3 kcal/mol). This value is close to that obtained for water61.
Proton transport is often associated with a large kinetic isotope effect; however, it may not be clearly revealed in complicated multi-step reactions driving the dielectric relaxation, for which the measuring rates are much slower than the tunnelling timescale41. Thus, the fact that both the relaxation time and the dielectric constant of methanol-h and methanol-d are very similar65 does not preclude proton transfer. The relaxation time in our mode is the lifetime of ROH⊕(D⊕) ionic pairs, which is determined by the probability of proton tunneling and does not depend on the isotopic substitution. On the contrary, the rotational mechanism assumes a red shift of the relaxation band at isotopic substitution, which, was not observed65. This fact allows one to discriminate between rotation of dipoles and translation of free charges. Therefore, the translational mechanism is better suited for the experimental data explanation that the previously suggested rotational mechanism.
One can see in Figs. 1, and 4d that the suggested model and experimental data diverge in the terahertz frequency region. The contribution of this part to the static dielectric constant (see Table 1) is and constitutes from 4 to 7 % of the value. We associate this excess absorption with molecular-rotation dynamism of polarization, in wich the molecular dipole moments follow the moving proton/hole with some delay. This fact explains the synchronism of the main relaxation band, R1, and its excess wing, E1 (as obvious from Fig. 2). However, the contribution of the latter is significantly smaller than commonly assumed for alcohols, and the corresponding part of the dielectric constant can be explained without the use of artificial overpolarization of molecular dipoles.
We associate the band (Fig. 1c) to the excess proton oscillation in the double-well potential. Indeed, the oscillator frequency 2.5 THz, where is the proton mass, 0.2 nm is average OO distance, and 0.2 eV is the energy barrier 66, is close to . The lifetime of the excess proton state (the half-width of the band) is equal to 0.5 ps, which is close to the known lifetime of the transition state of proton between molecules 67, 68. Moreover, this peak is temperature independent, as well as connected with infrared OH-stretch vibration69; thus, it is in line with the idea of proton tunneling. In light of our analysis, the mobile excess proton states of high concentration but short lifetime, cause the local heterogeneity of alcohols, detected experimentally 70, 71, and provoke the concomitant rearrangement of the chain structures observed in 72.
5 Conclusion
We experimentally measured the ultra-broadband dielectric response of five monohydric alcohols, and processed the data with a consistent methodology. We found similarities across the various alcohols, which are not fully explained by existing polarization models. Introducing excess protons and holes with exponential lifetime distributions, as a consequence of proton tunnelling, we propose a non-rotational polarization mechanism, which accounts on the same footing for static (dc conductivity and dielectric constant) and dynamic (dielectric relaxation and high frequency conductivity) effects as microscopically connected phenomena. Our model permits a consistent spectral data fitting across alcohols and provides a physical explanation to support observed data, giving new insights into the molecular dynamics of polar liquids. Our work shows that proton transport is fully consistent with dielectric spectroscopy data, but our model and interpretation still need to be tested using other experimental techniques and different types of protic liquids. We thus hope that this research will stimulate further experimental and theoretical activities on this front.
The Authors acknowledge support of the Skoltech NGP Program (Skoltech-MIT joint project). E.C. also acknowledges the Skoltech Global Campus Program.
6 Appendix
6.1 Samples preparation
For our experiments we used five primary alcohols listed in Table S1. All samples were purchased from the same manufacturer (Sigma-Aldrich), except ethanol (Fisher Chemical), and used as received. We used the samples with the highest available purity, i.e. 99.9%, except for decanol with only 98% purity, which explains the dispersion of the corresponding data on dc conductivity (see Fig. 2 of the main text). During the measurements, we found that if part of the probe is in contact with air, absorbed water vapor might affect the dielectric parameters of alcohols. However, this change only applies to static conductivity. The rest of the spectrum, above a few megahertz, was absolutely unaffected by atmospheric moisture over the time interval of the measurements, typically around one hour. Nevertheless, the influence of impurities on the static conductivity of alcohols should in principle be accounted for when considering previous published data on dc conductivity [46,47] (main text), as the samples used in these works had lower purity (see Table S1).
| Alcohol | This work | Ref. [46] | Ref. [47] |
|---|---|---|---|
| Methanol | Sigma-Aldrich, 99.9% | Fluka, 99.8% | Panreac, 99.8% |
| Ethanol | Fisher Chemical, 99.9% | Fluka, 99.8% | Fluka, 99.8% |
| 1-Propanol | Sigma-Aldrich, 99.9% | Fluka, 99.5% | Fluka, 99.5% |
| 1-Butanol | Sigma-Aldrich, 99.9% | Fluka, 99.5% | Fluka, 99.5% |
| 1-Decanol | Sigma-Aldrich, 98% | - | - |
6.2 Measurement procedure
The low- (megahertz), and high-frequency (gigahertz) measurements were performed using different sample holders and measuring cells. Alcohols were placed into measurement cells using Finnpipette renewed after each usage. The cell was washed with ethanol before each measurement and stored in a liquid to be measured for 5 minutes, heated up to 40∘C. The dc measurements cell was thermally stabilized using acetone as a thermal conductive liquid, Peltier cooler for temperature control, and Pt1000 thermocouples for accurate temperature measurements. For the gigahertz region measurements, we used a copper bath, in which the sample in the glass beaker was tightly inserted. The open-end coaxial probe was applied at the liquid-air interface. At low frequencies, we used a cylindrical Teflon cell with two round-flat gold electrodes of 1 cm2 each and separation about 1 mm. The complex impedance was measured by the four-electrode method [41] (main text), as each alcohol was passing through the space between the electrodes at a constant flow rate controlled by the peristaltic pump.
The measuring rms voltage =100 mV and signal intensity 45 dB were chosen well below the electrolysis stability threshold, 1.23 V, and such that the sample temperature and chemical composition remain stable. The low- and high-frequency measurements show comparable data for the static dielectric constant, and also for the static conductivity, which confirms the validity of our experimental approach. The real, , and imaginary, , parts of the complex dielectric permittivity are calculated from the measured complex impedance with:
where is the capacitance of the empty cell. The dynamical conductivity is then obtained with its definition: .
6.3 Self-diffusion and dielectric relaxation
The self-diffusion coefficient of molecules in liquids can be measured independently by two main methods, which give similar results: isotopic substitution, and spin-echo NMR. The data on self diffusion of oxygen, and hydrogen atoms in alcohols, obtained by these methods are available in Refs. [46,47] (main text). For our study, it is important to know the mean square displacement of atoms on the timescale of the dielectric relaxation time , which can be obtained using the self-diffusion coefficients calculated with the Smoluchowski formula . Values are given in Table S2 for all alcohols considered in our work. As the molecular diffusion in liquids demonstrates hoping-like behavior 73, it would be informative to compare with the distance between centers of molecules. As one can see from Table S2, ; hence, over the relaxation time , each molecule covers at least one intermolecular distance as it moves, or, in other words, changes its local environment. This means that inasmuch as dielectric relaxation in associated liquids (including alcohols) is a collective phenomenon, no cluster-like structures made of several molecules can explain the dielectric relaxation, as they simply cannot last sufficiently long for such a relatively long time as .
| 1 | 2 | 3 | 4 | 10 | |
|---|---|---|---|---|---|
| (ps) | 54 | 177 | 370 | 549 | 1989 |
| (nm2ns-1) | 2.44 | 1.16 | 0.60 | 0.50 | 0.12 |
| (nm) | 0.88 | 1.11 | 1.16 | 1.28 | 1.21 |
| (nm) | 0.50 | 0.57 | 0.62 | 0.66 | 0.84 |
References
- Partington et al. 1952 Partington, J. R.; Hudson, R. F.; Bagnall, K. W. Self-diffusion of aliphatic alcohols. Nature 1952, 169, 583–584
- Mashimo and Umehara 1991 Mashimo, S.; Umehara, T. Structures of water and primary alcohol studied by microwave dielectric analyses. J. Chem. Phys. 1991, 95, 6257–6260
- Joo et al. 1996 Joo, T.; Jia, Y.; Yu, J.-Y.; Lang, M. J.; Fleming, G. R. Third-order nonlinear time domain probes of solvation dynamics. J. Chem. Phys. 1996, 104, 6089–6108
- Wang and Richert 2004 Wang, L. M.; Richert, R. Dynamics of glass-forming liquids. IX. Structural versus dielectric relaxation in monohydroxy alcohols. J. Chem. Phys. 2004, 121, 11170–11176
- Edenberg 2007 Edenberg, H. J. The genetics of alcohol metabolism: Role of alcohol dehydrogenase and aldehyde dehydrogenase variants. Alcohol Research & Health 2007, 30, 5–13
- Tomšič et al. 2007 Tomšič, M.; Jamnik, A.; Fritz-Popovski, G.; Glatter, O.; Vlček, L. Structural properties of pure simple alcohols from ethanol, propanol, butanol, pentanol, to hexanol: Comparing Monte Carlo simulations with experimental SAXS data. J. Phys. Chem. B 2007, 111, 1738–1751
- Merle et al. 2011 Merle, G.; Wessling, M.; Nijmeijer, K. Anion exchange membranes for alkaline fuel cells: A review. J. Membr. Sci. 2011, 377, 1–35
- Gainaru et al. 2010 Gainaru, C.; Meier, R.; Schildmann, S.; Lederle, C.; Hiller, W.; Rössler, E.; Böhmer, R. Nuclear-magnetic-resonance measurements reveal the origin of the Debye process in monohydroxy alcohols. Phys. Rev. Lett. 2010, 105, 258303–4
- Gastegger et al. 2017 Gastegger, M.; Behler, J.; Marquetand, P. Machine learning molecular dynamics for the simulation of infrared spectra. Chem. Sci. 2017, 8, 6924–6935
- Clarke et al. 2018 Clarke, C. J.; Tu, W.-C.; Levers, O.; Bröhl, A.; Hallett, J. P. Green and sustainable solvents in chemical processes. Chem. Rev. 2018, 118, 747–800
- Carignani et al. 2018 Carignani, E.; C. Forte, E. J.-G.; Gałazka, M.; Massalska-Arodź, M.; Geppi, M.; Calucci, L. Dynamics of two glass forming monohydroxy alcohols by field cycling 1H NMR relaxometry. J. Mol. Liq. 2018, 269, 847–852
- Sillrén et al. 2014 Sillrén, P. et al. Liquid 1-propanol studied by neutron scattering, near-infrared, and dielectric spectroscopy. J. Chem. Phys. 2014, 140, 124501–10
- Hansen et al. 2016 Hansen, J. S.; Kisliuk, A.; Sokolov, A. P.; Gainaru, C. Identification of structural relaxation in the dielectric response of water. Phys. Rev. Lett. 2016, 116, 237601–5
- Wang and Richert 2005 Wang, L.; Richert, R. Debye type dielectric relaxation and the glass transition of alcohols. J. Phys. Chem. B 2005, 109, 11091–11094
- Gerstner 2012 Gerstner, E. Liquids in no man’s land. Nature Phys. 2012, 8, 252–1
- Lunkenheimer et al. 2017 Lunkenheimer, P.; Emmert, S.; Gulich, R.; Köhler, M.; Wolf, M.; Schwab, M.; Loidl, A. Electromagnetic-radiation absorption by water. Phys. Rev. E 2017, 96, 062607–10
- Artemov et al. 2020 Artemov, V. G.; Uykur, E.; Kapralov, P.; Kiselev, A.; Stevenson, K.; Ouerdane, H.; Dressel, M. Anomalously high proton conduction of interfacial water. J. Phys. Chem. Lett. 2020, 11, 3623–3628
- Böhmer et al. 2014 Böhmer, R.; Gainarua, C.; Richert, R. Structure and dynamics of monohydroxy alcohols—Milestones towards their microscopic understanding, 100 years after Debye. Phys. Rep. 2014, 545, 125–195
- Dutt et al. 1990 Dutt, G. B.; Doraiswamy, S.; Periasamy, N.; Venkataraman, B. Rotational reorientation dynamics of polar dye molecular probes by picosecond laser spectroscopic technique. J. Chem. Phys. 1990, 93, 8498–8513
- Weingärtner et al. 2004 Weingärtner, H.; Nadolny, H.; Oleinikova, A.; Ludwig, R. Collective contributions to the dielectric relaxation of hydrogen-bonded liquids. J. Chem. Phys. 2004, 120, 11692–11697
- Debye 1912 Debye, P. Theorie der Dipolmomente der Molekeln. Physik. Z. 1912, 13, 97–100
- Debye 1929 Debye, P. Polar Molecules, 1st ed.; Chemical Catalog Co., Inc.: New York, 1929
- Debye 1935 Debye, P. Dielektrische sättigung und behinderung der freien rotation in flüssigkeiten. Phys. Z. 1935, 36, 193–197
- Cole and Cole 1941 Cole, K. S.; Cole, R. H. Dispersion and absorption in dielectrics I. Alternating current characteristics. J. Chem. Phys. 1941, 9, 341–351
- Cole and Cole 1942 Cole, K. S.; Cole, R. H. Dispersion and absorption in dielectrics II. Direct current characteristics. J. Chem. Phys. 1942, 9, 98–105
- Miles 1929 Miles, J. B. The dielectric constant and electric moment of some alcohol vapors. Phys. Rev. 1929, 34, 964–971
- Dannhauser 1968 Dannhauser, W. J. Dielectric study of intermolecular association in isomeric octyl alcohols. Chem. Phys. 1968, 48, 1911–1917
- Onsager 1936 Onsager, L. Electric moments of molecules in liquids. J. Am. Chem. Soc. 1936, 58, 1486–1493
- Kirkwood 1939 Kirkwood, J. G. The Dielectric Polarization of Polar Liquids. J. Chem. Phys. 1939, 7, 911–919
- Fröhlich 1949 Fröhlich, H. Theory of Dielectrics, 1st ed.; Oxford University Press: London, 1949
- Glarum 1960 Glarum, S. H. Dielectric theory of polar liquids. J. Chem. Phys. 1960, 33, 1371–1375
- Fang 1965 Fang, P. H. Cole-Cole diagram and the distribution of relaxation times. J. Chem. Phys. 1965, 42, 3411–3413
- Cole 1965 Cole, R. H. Correlation theory of dielectric relaxation. J. Chem. Phys. 1965, 42, 637–643
- Gaudin and Ma 2019 Gaudin, T.; Ma, H. A molecular contact theory for simulating polarization: application to dielectric constant prediction. Phys. Chem. Chem. Phys 2019, 21, 14846–14857
- Jensen et al. 2018 Jensen, M. H.; Gainaru, C.; Alba-Simionesco, C.; Hecksher, T.; Niss, K. Slow rheological mode in glycerol and glycerol–water mixtures. Phys. Chem. Chem. Phys 2018, 20, 1716–1723
- Yamaguchi et al. 2018 Yamaguchi, T.; Saito, M.; Yoshida, K.; Yamaguchi, T.; Yoda, Y.; Seto, M. Structural relaxation and viscoelasticity of a higher alcohol with mesoscopic structure. J. Phys. Chem. Lett. 2018, 9, 298–301
- Maribo-Mogensen et al. 2013 Maribo-Mogensen, B.; Kontogeorgis, G.; Thomsen, K. Modeling of dielectric properties of complex fluids with an equation of state. J. Phys. Chem. B 2013, 117, 3389–3397
- Angell et al. 2000 Angell, C. A.; Ngai, K. L.; McKenna, G. B.; McMillan, P. F.; Martin, S. W. Relaxation in glass-forming liquids and amorphous solids. J. Appl. Phys. 2000, 88, 3113–3157
- Lomas 2015 Lomas, J. S. 1H NMR spectra of alcohols in hydrogen bonding solvents: DFT/GIAO calculations of chemical shifts. Magnetic Resonance in Chemistry 2015, 54, 28–38
- Meng et al. 2015 Meng, X.; Guo, J.; Peng, J.; Chen, J.; Wang, Z.; Shi, J.; Li, X. Z.; Wang, E.-G.; Jiang, Y. Direct visualization of concerted proton tunnelling in a water nanocluster. Nature Phys. 2015, 11, 235–239
- Salna et al. 2016 Salna, B.; Benabbas, A.; Sage, J. T.; Thor, J.; Champion, P. M. Wide-dynamic-range kinetic investigations of deep proton tunnelling in proteins. Nat. Chem. 2016, 8, 874–880
- Löwdin 1963 Löwdin, P. Proton Tunneling in DNA and its Biological Implications. Rev. Mod. Phys. 1963, 35, 724–732
- Wang et al. 2020 Wang, E.; Shan, X.; Chen, L.; Pfeifer, T.; Chen, X.; Ren, X.; Dorn, A. Ultrafast Proton Transfer Dynamics on the Repulsive Potential of the Ethanol Dication: Roaming-Mediated Isomerization versus Coulomb Explosion. J. Phys. Chem. A 2020, 124, 2785–2791
- Kremer and Schönhals 2003 Kremer, F., Schönhals, A., Eds. Broadband Dielectric Spectroscopy, 1st ed.; Springer: Berlin, 2003
- Yomogida et al. 2010 Yomogida, Y.; Sato, Y.; Nozaki, R.; Mishina, T.; Nakahara, J. Dielectric study of normal alcohols with THz time-domain spectroscopy. J. Mol. Liq. 2010, 154, 31–35
- Sarkar et al. 2017 Sarkar, S.; Saha, D.; Banerjee, S.; Mukherjee, A.; Mandal, P. Broadband terahertz dielectric spectroscopy of alcohols. Chem. Phys. Lett. 2017, 678, 65–71
- Prego et al. 2000 Prego, M.; Cabeza, O.; Carballo, E.; Franjo, C. F.; Jimenez, E. Measurement and interpretation of the electrical conductivity of 1-alcohols from 273 K to 333 K. J. Mol. Liq. 2000, 89, 233–238
- Prego et al. 2003 Prego, M.; Rilo, E.; Carballo, E.; Franjo, C.; Jiménez, E.; Cabeza, O. Electrical conductivity data of alkanols from 273 to 333 K. J. Mol. Liq. 2003, 102, 83–91
- Pratt and Wakeham 1977 Pratt, K. C.; Wakeham, W. Self-Diffusion in Water and Monohydric Alcohols. J. Chem. Soc., Faraday Trans. 1977, 73, 997–1002
- Robb 1982 Robb, I. D., Ed. Microemulsions, 1st ed.; Plenum: New York, 1982
- Ugur et al. 2014 Ugur, I.; Marion, A.; Parant, S.; Jensen, J. H.; Monard, G. Rationalization of the pKa values of alcohols and thiols using atomic charge descriptors and its application to the prediction of amino acid pKa’s. J. Chem. Inform. and Modeling 2014, 54, 2200–13
- Miller and Manolopoulos 2005 Miller, T. F.; Manolopoulos, D. E. Quantum diffusion in liquid water from ring polymer molecular dynamics. J. Chem. Phys. 2005, 123, 154504–10
- Habershon et al. 2009 Habershon, S.; Markland, T. E.; Manolopoulos, D. E. Competing quantum effects in the dynamics of a flexible water model. J. Chem. Phys. 2009, 131, 024501–11
- Novikov and Sokolov 2013 Novikov, V. N.; Sokolov, A. P. Role of quantum effects in the glass transition. Phys. Rev. Lett. 2013, 110, 065701–5
- Bakker and Nienhuys 2002 Bakker, H. J.; Nienhuys, H.-K. Delocalization of Protons in Liquid Water. Science 2002, 297, 587–590
- Artemov et al. 2020 Artemov, V. G.; Uykur, E.; Roh, S.; Pronin, A.; Ouerdane, H.; Dressel, M. Revealing excess protons in the infrared spectrum of liquid water. Scientific Reports 2020, 10, 11320–7
- Mazur et al. 2015 Mazur, K.; Bonn, M.; Hunger, J. Hydrogen bond dynamics in primary alcohols: A femtosecond infrared study. J. Phys. Chem. B 2015, 119, 1558–1566
- Markovitch et al. 2008 Markovitch, O.; Chen, H.; Izvekov, S.; Paesani, F.; Voth, G. A.; Agmon, N. Special pair dance and partner selection: Elementary steps in proton transport in liquid water. J. Phys. Chem. B 2008, 112, 9456–9466
- Pietropaolo et al. 2008 Pietropaolo, A.; Senesi, R.; Andreani, C.; Botti, A.; Ricci, M. A.; Bruni, F. Excess of proton mean kinetic energy in supercooled water. Phys. Rev. Lett. 2008, 100, 127802–4
- Lin et al. 2010 Lin, L.; Morrone, J.; Car, R.; Parrinello, M. Displaced path integral formulation for the momentum distribution of quantum particles. Phys. Rev. Lett. 2010, 105, 110602–4
- Geissler et al. 2001 Geissler, P. L.; Dellago, C.; Chandler, D.; Hutter, J.; Parrinello, M. Autoionization in Liquid Water. Science 2001, 291, 2121–2124
- Hassanali et al. 2013 Hassanali, A.; Giberti, F.; Cuny, J.; Kühne, T.; Parrinello, M. Proton transfer through the water gossamer. PNAS 2013, 110, 13723–13728
- Hawlicka 1995 Hawlicka, E. Self-diffusion in multicomponent liquid systems. Chem. Soc. Rev. 1995, 24, 367–377
- Balberg et al. 1984 Balberg, I.; Binenbaum, N.; Wagner, N. Percolation thresholds in the three-dimensional sticks system. Phys. Rev. Lett. 1984, 52, 1465–1468
- Davidson 1957 Davidson, D. W. The dielectric properties of methanol and methanol-d. Can. J. Chem. 1957, 35, 458–473
- Sedov and Solomonov 2012 Sedov, I.; Solomonov, B. Gibbs free energy of hydrogen bonding of aliphatic alcohols with liquid water at 298 K. Fluid Phase Equilibria 2012, 315, 16–20
- Thämer et al. 2015 Thämer, M.; Marco, L. D.; Ramasesha, K.; Mandal, A.; Tokmakoff, A. Ultrafast 2D IR spectroscopy of the excess proton in liquid water. Science 2015, 350, 78–82
- Gainaru et al. 2011 Gainaru, C.; Kastner, S.; Mayr, F.; Lunkenheimer, P.; Schildmann, S.; Weber, H.; Hiller, W.; Loidl, A.; Böhmer, R. Hydrogen-bond equilibria and lifetimes in a monohydroxy alcohol. Phys. Rev. Lett. 2011, 107, 118304–5
- Grechko et al. 2018 Grechko, M.; Hasegawa, T.; D’Angelo, F.; Ito, H.; Turchinovich, D.; Nagata, Y.; Bonn, M. Coupling between intra- and intermolecular motions in liquid water revealed by two-dimensional terahertz-infrared-visible spectroscopy. Nat. Comm. 2018, 9, 885–8
- Guo et al. 2003 Guo, J.-H.; Luo, Y.; Augustsson, A.; Kashtanov, S.; Rubensson, J.-E.; Shuh, D. K.; Ågren, H.; Nordgren, J. Molecular structure of alcohol-water mixtures. Phys. Rev. Lett. 2003, 91, 157401–4
- Gabriel et al. 2018 Gabriel, J.; Pabst, F.; Helbling, A.; Böhmer, T.; Blochowicz, T. Nature of the Debye process in monohydroxy alcohols: 5-methyl-2-hexanol investigated by depolarized light scattering and dielectric spectroscopy. Phys. Rev. Lett. 2018, 121, 035501–5
- Singh and Richert 2012 Singh, L.; Richert, R. Watching hydrogen-bonded structures in an alcohol convert from rings to chains. Phys. Rev. Lett. 2012, 109, 167802–5
- Frenkel 1946 Frenkel, J. Kinetic theory of liquids, 1st ed.; Clarendon Press: Oxford, 1946