AstroSat Observation of Non-Resonant Type-C QPOs in MAXI J1535-571
Abstract
Galactic transient black hole candidate (BHC) MAXI J1535-571 was discovered on 2017 September 02 simultaneously by MAXI/GSC and Swift/BAT instruments. It has also been observed by India’s first multi-wavelength astronomy-mission satellite AstroSat, during the rising phase of its 2017-18 outburst. We make both the spectral and the temporal analysis of the source during 2017 September 12-17 using data of AstroSat’s Large Area X-ray Proportional Counter (LAXPC) in the energy range of keV to infer the accretion flow properties of the source. Spectral analysis is done with the physical two-component advective flow (TCAF) solution-based fits file. From the nature of the variation of the TCAF model fitted physical flow parameters, we conclude and confirm that the source was in the intermediate spectral state during our analysis period. We observe sharp type-C quasi-periodic oscillations (QPOs) in the frequency range of Hz. For a better understanding of the nature and evolution of these type-C QPOs, a dynamic study of the power density spectra is done. We also investigate the origin of these QPOs from the shock oscillation model. We find that non-satisfaction of Rankine-Hugoniot conditions for non-dissipative shocks and not their resonance oscillations is the cause of the observed type-C QPOs.
Keywords X-Rays:binaries – stars individual: (MAXI J1535-571) – stars:black holes – accretion, accretion disks – shock waves – radiation:dynamics
1 Introduction
Black holes (BHs) in binary systems emit electromagnetic radiation when the gravitational potential energy of the accreted matter converts into thermal energy. There exist a few BHs, which are transient in nature. These black hole candidates (BHCs) are very interesting to study in X-rays as they undergo rapid evolution in their spectral and timing properties. Different spectral states such as hard (HS), hard-intermediate (HIMS), soft-intermediate (SIMS), soft (SS), are generally observed during an outburst, which is strongly correlated with temporal properties (see, McClintock & Remillard, 2006; Debnath et al., 2013 and references therein). During the outburst of a transient BHC, observed spectral states could be related to different branches of the so-called ‘q’-diagram i.e., hardness intensity diagram (HID; Belloni et al., 2005 and Debnath et al., 2008) or, a more physical diagram with two-component accretion rate ratio plotted against X-ray intensity (ARRID; Jana et al. 2016). According to Debnath et al. (2017), type-I or classical type of outbursting sources show the evolution of the spectral states during an outburst in the sequence: HS HIMS SIMS SS SIMS HIMS HS, while in type-II or harder type of outbursting sources SS (sometimes even SIMS) are missing.
Low-frequency quasi-periodic oscillations (LFQPOs) are a very common observable feature in the power density spectrum (PDS) of stellar-mass BHs. A few BHs exhibit high-frequency QPOs in their PDSs. The frequency of the QPOs in these transient X-ray sources range from mHz to a few hundred Hz (Morgan, Remillard & Greiner 1997; Paul et al. 1998; Remillard & McClintock 2006). Belloni & Hasinger (1990) first reported aperiodic variability in Cyg X-1. Low ( Hz) as well as high ( Hz) frequency QPOs in black hole X-ray binaries (BHXRBs) are also reported by many groups of scientists (for a review see, Remillard & McClintock 2006; Nandi et al. 2012; Debnath et al. 2013 and references therein). In general LFQPOs are classified into three types (A, B, C) based on the centroid frequency, Q-value, noise, and rms amplitude (Casella et al. 2005). It is observed that these LFQPOs correlated with the spectral states. Generally, type-C QPOs evolve monotonically and are associated with HS and HIMS, whereas type A, B QPOs are seen sporadically on and off in SIMS. This implies a direct connection of QPOs with the accretion flow configuration (see, Debnath et al. 2015a, 2017 and references therein).
There are several models in the literature to explain the origin and characteristics of QPOs. LFQPOs are observed to be correlated with the relative dominance of the thermal and the non-thermal fluxes and state transition (Muno et al. 1999; Chakrabarti & Manickam 2000; Sobczak et al. 2000; Revnivstev et al. 2000; Vignarca et al. 2003; Chakrabarti et al. 2004). Characteristics of trapped oscillation in a gaseous disk around a supermassive black hole () were examined (Kato & Fukue 1980). The obtained oscillation period was 100 days, a typically observed time variation of QSOs and Seyfert galaxies. Nowak & Wagoner (1991) investigated the normal modes of acoustic oscillations within the thin accretion disks, terminated at the innermost stable orbit. Chakrabarti (1989b, 1990) showed that due to the strong centrifugal barrier in the vicinity of the black hole, standing axisymmetric shock could form. Matter puffs up in the post-shock region and forms a hot torus shape Compton cloud called the CENtrifugal pressure dominated BOundary Layer or CENBOL. The post-shock region could oscillate if the resonance condition is satisfied, i.e. the infall time scale and the cooling time scale roughly matches (Molteni, Sponholz & Chakrabarti 1996; Chakrabarti et al. 2015). A quasi-periodic variation of the post-shock region (CENBOL) results in oscillation of the Comptonized hard X-ray intensity, which is reflected as QPO in the power-density spectra (PDS) of low time binned (e.g., 0.01 sec) light curves (Chakrabarti & Manickam 2000). Molteni, Sponholz & Chakrabarti (1996) applied the resonance oscillation between the bremsstrahlung cooling and infall time of the post-shock region for supermassive black holes. The resonance between Compton cooling and compressional heating was used to understand LFQPOs in stellar mass black holes (Chakrabarti & Manickam 2000; Chakrabarti et al. 2015).
The oscillation of the transition layer of the Compton cloud due to the viscous magneto-acoustic resonance is also mentioned to be a possible reason for the LFQPOs (Titarchuk, Lapidus & Muslimov 1998). The Lense-Thirring frequency due to the precession of a radially extended thick torus has been modeled (Ingram et al. 2009) to explain the frequency of the detected type-C QPOs observed in BHXRBs. According to this model, the frequency of the type-C QPO increase as the source transits from hard to softer spectral state along with the decrease of the outer radius of the torus. Trudolyubov et al. (1999) explained the evolution of LFQPOs considering the variation of the boundary between the Comptonization region and the optically thick accretion disk. They proposed that the QPO frequency changes due to the variation of the boundary on the viscous time scale. Titarchuk & Osherovich (2000) explained the LFQPOs in terms of global disk oscillations due to the gravitational interaction between the compact object and the disk. This normal mode oscillation of the disk happens when the gravitational restoring force tries to oppose the displacement of the disk from the equatorial plane. Warped disk models subjected to magnetic torques are also considered to explain the LFQPOs (Shirakawa & Lai 2002). The accretion-ejection instability (Tagger & Pellat 1999) in the magnetized accretion disks are mentioned to be the reason for LFQPOs (Tagger et al. 2004). The oscillation of the transition layer (Nobili et al. 2000; Stiele et al. 2013) and the corona (Cabanac et al. 2010) are also mentioned to be the reason behind the LFQPOs. In this paper, we will try to find the origin of the observed LFQPOs from AstroSat LAXPC data with the shock oscillation model of Chakrabarti and his collaborators (Molteni et al. 1996; Ryu et al. 1997; Chakrabarti et al. 2015).
In both the rising and declining phases of a transient BHC outburst, monotonic evolutions of type-C QPOs are generally observed in HS and HIMS. Whereas type-A or B QPOs are observed sporadically on and off in the SIMS (see Nandi et al. 2012). The origin of QPOs is still under debate. According to the two-component advective flow (TCAF) solution, the origin of three different types of QPOs is easily explained with the resonance oscillation (type-C), weak oscillation (type-B) of the Compton cloud boundary (i.e. shock) or mostly incoherent oscillation of different regions of the shock-free centrifugal barrier (type-A). For type-C QPOs, the shock oscillation may occur due to fulfillment of the resonance condition between the cooling time and infall time of the post-shock region (Molteni, Sponholz & Chakrabarti 1996; Chakrabarti et al. 2015) or due to the non-fulfillment of the Rankine-Hugoniot conditions (Ryu et al. 1997). In this shock oscillation model (SOM), the frequency of the QPOs is inversely proportional to the infall time from the location of the shock. The same shock also explains the spectral properties in the TCAF solution (Chakrabarti & Titarchuk 1995; Chakrabarti 1997), and could be obtained directly from spectral fits with the model (Debnath et al. 2014, 2015a). TCAF model uses the property of segregation of the transonic flow into two components - a high angular momentum Keplerian disk component on the equatorial plane and a low angular momentum sub-Keplerian component or halo.
TCAF solution has been implemented as a local additive table model in XSPEC (Arnaud 1996) by Debnath et al. (2014) to fit spectra of BH candidates. The model has successfully explained the accretion dynamics of several BHCs (see, Debnath et al. 2015a,b; Mondal et al. 2014; Chatterjee et al. 2016, 2019, 2020).
Galactic transient MAXI J1535-571 was discovered simultaneously by MAXI/GSC (Negoro et al. 2017) and Swift/BAT (Kennea et al. 2017) on 2017 September 02 at sky location of RA=, Dec= , which is near the Galactic plane. It is one of the brightest compact X-ray binaries. The source has been extensively monitored in multi-wavebands, starting from the radio (Tetarenko et al. 2017; Russel et al. 2017) to hard X-rays (Negoro et al. 2017; Kennea et al. 2017; Xu et al. 2017; Shidatsu et al. 2017a,b), via optical (Scaringi et al. 2017), and near-infrared (Dincer 2017). The companion of the source was reported in optical (Scaringi et al. 2017) as well as in near-infrared (Dincer 2017). Low-frequency QPOs (LFQPOs) were reported by Mereminskiy & Grebenev (2017). Xu et al. (2017) estimated the spin of the source as indicating the black hole to be a high spinning one. Miller et al. (2018) estimated the spin to be . Russel et al. (2017) and Tetarenko et al. (2017) reported observation of jet activity during the hard state of the outburst. The spectral properties of the source were analyzed by Tao et al. (2018). Stiele and Kong (2018) used data from Swift/XRT, XMM-Newton and NICER observatories to conduct a comprehensive timing and spectral analysis of this source. Baglio et al. (2018) discussed the possibility of using rapid variation in mid-IR to test the relation between the disc-jets. In the average power spectrum corresponding to the NICER observations, Stevens et al. (2018) observed an LFQPO of Hz when the source was in SIMS. Huang et al. (2018) reported timing and spectral analysis using the HXMT data and proposed that the inclination of MAXI J1535-571 could be high.
Shang et al. (2019) (hereafter Paper-I) studied the spectral and temporal properties of the source using the TCAF model during its initial rising phase of the outburst. Swift (XRT and BAT) and MAXI (GSC) archival data were analyzed using the TCAF solution to understand the accretion dynamics of the source. They observed QPOs of frequencies ranging from Hz sporadically in observations out of their studied observations of Swift/XRT. Based on the properties (frequency, Q-value, rms, etc.), they marked the observed QPOs as type-A, type-C. They also observed one unknown type (type-X) QPO of Hz, having a lesser Q-value (=) and higher rms (=). The spectral analysis was done for the initial rising phase ( 50 days from 2017 September 4 to October 24) of the outburst with the TCAF model-based fits file to understand accretion flow properties of the source in details. Spectral states and their transitions were understood based on the nature of the evolution of the TCAF model fitted flow parameters. They also explained the spectral nature of the source during the entire period of the 2017-18 outburst based on the variation of the hardness ratios (HRs; the ratio between fluxes observed by keV Swift BAT with keV MAXI GSC). The entire outburst was found to be in four spectral states - HS, HIMS, SIMS, SS. They estimated the mass of the black hole () to be based on the TCAF model fitted spectra. This was possible since in TCAF, is an important model input parameter.
Sreehari et al. (2019) studied spectro-temporal properties of MAXI J1535-571 using AstroSat SXT and LAXPC10 instrument data in the same period of the outburst. They reported type-C QPOs with harmonics varying from Hz. They also showed that the PDS generated from the lightcurve of 3-50 keV energy range contains the fundamental QPO feature, where the harmonic is absent above 35 keV. They presented the spectral results with the broadband (0.7-80 keV) data using both phenomenological and physical models. They proposed the mass of the BH between 5.14 to 7.83 . Sridhar et al. (2019) reported the broadband spectroscopic results of MAXI J1535-571 using AstroSat observation of one orbit. They used both SXT ( keV) and LAXPC10 ( keV) data for spectral analysis with the reflection component (RELXILL family of relativistic reflection models) and a general relativistic thin disk component (Kerrbb). They estimated the mass and distance of the BH to be and respectively. Bhargava et al. (2019) presented the spectral and temporal results using AstroSat data of MAXI J1535-571. They found a tight correlation between the QPO frequencies and the photon indices. They concluded that the observed type-C QPOs formed due to the oscillation of the Compton corona. The spectral analysis was done using SXT ( keV), LAXPC10 and LAXPC20 ( keV) data.
In this paper, we study the 2017-18 outburst of MAXI J1535-571 using the AstroSat/LAXPC data. The main goal of this paper is to find the origin of the type-C QPOs as observed by AstroSat LAXPC from the spectral and temporal analysis under the TCAF paradigm. We analyze the data of 62 orbits. This corresponds to six observation days (2017 September 12 to September 17) to study the spectral and temporal properties of the source. In Section 2, we describe the observation, data reduction, and analysis procedure. In Section 3, we briefly present the timing and spectral results. In Section 4, we discuss our results. Finally, in Section 5, we summarize our findings.
2 Observation and data analysis
We studied AstroSat data of Large Area X-ray Proportional Counter Unit 1 (LAXPC10) in the period of 2017 September 12-17. Each LAXPC payload has an effective area of at 20 keV, which is times higher than that of RXTE/PCA instruments (Antia et al. 2017). For data extraction i.e., making light curves in sec and sec time bins and spectral files, we used publicly available code (http://www.tifr.res.in/antia/laxpc.html). We used all anode layers for analysis. For further analysis of the extracted light curve and spectral (.pha) files, we used HeaSoft software package HEADAS 6.21 and XSPEC version 12.9.1. For the overall study of spectral and timing properties of the source, we follow the analysis as described in Debnath et al. (2014, 2015a).
AstroSat observed MAXI J1535-571 during the initial rising phase of the 2017-18 outburst for continuous 62 orbits. For the timing analysis, in order to generate power-density spectra (PDS), the command powspec of the XRONOS package is used on sec light curves in the energy range of keV. The PDSs are generated considering 8192 bins per interval in the frequency range between 0.01 to 50 Hz. Lorentzian profiles are used to fit PDS to find the centroid frequency of the QPOs and the fit err command is used to get 90% confidence error limits of the model fitted parameters. The continuum PDSs are fitted with the combination of four Lorentzian models.
We fitted all the spectra with the current version of the TCAF model fits file as an additive table model in XSPEC. We used Tbabs as the absorption model where vern scattering cross-section (Verner et al. 1996) was considered taking wilm abundance (Wilms et al. 2000). The TCAF model input parameters are: Keplerian disk rate ( in ), sub-Keplerian halo rate ( in Eddington rate ), location of the shock ( in Schwarzschild radius =), compression ratio (, where and are the densities in the post- and the pre-shock flows) of the shock. In case the mass of the BH ( in solar mass ) and normalization () are not known, they have to be treated as free parameters. We used systematic errors of 2 for the overall fitting (see, Pahari et al. 2018; Sreehari et al. 2019; Bhargava et al. 2019). While fitting spectra with the TCAF model, we kept the mass of BH in the range of as obtained in Paper-I.
3 Results
The spectral and temporal analysis of AstroSat LAXPC10 data during 2017 September 12 to 17 were performed. Due to the large effective area and data acquisition capability in low time frames (10 ), LAXPC provides a better opportunity for the temporal study. Spectral data were fitted with the physical TCAF model. The analysis results are discussed in the following sub-Sections.
3.1 Timing properties
We searched for the QPOs in the PDSs of the fast Fourier transformed sec time binned light curves. The detailed nature of the observed LFQPOs were studied as to find their origin.
3.1.1 Evolution of QPOs
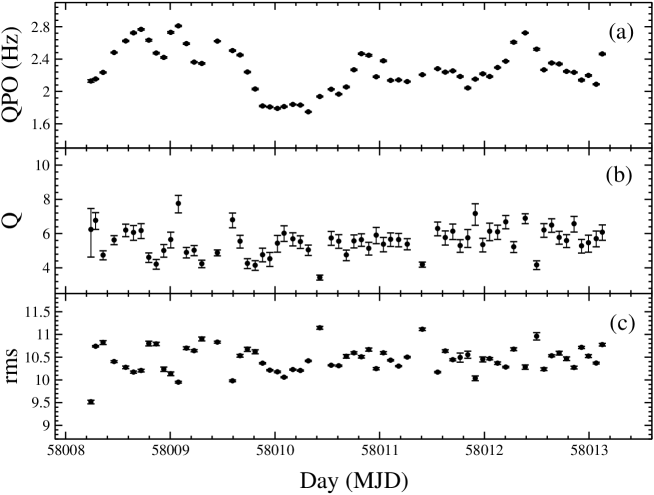
We found low-frequency QPOs in PDS of each of the 62 orbits data (see, Fig. 1a). The QPO frequencies were observed to vary between Hz. The PDSs also showed harmonics. The centroid frequency of the QPO, ‘Q’ value and fractional rms are shown in Fig. 1(a-c). We checked Pearson linear correlation between the QPO frequencies and the fractional rms of the 62 observations. We found a very weak negative correlation between them with a correlation coefficient, r=-0.007. Six PDSs are presented in Fig. 2, where the corresponding QPO frequencies are written at the upper right corner of each panel. In Table 1, we have shown the QPO properties. There was little variation in the QPO frequencies, but no monotonic increase or decrease in centroid frequency was observed. From the properties of the QPOs (centroid frequency, ‘Q’ value, and fractional rms) observed during our studied period, we marked them as type-C QPOs. This non-evolving nature of the QPO frequency is consistent with the nature of QPOs observable in intermediate states (for more details see, Nandi et al. 2012; Debnath et al. 2013 and reference therein).
3.1.2 Dynamic study of PDS
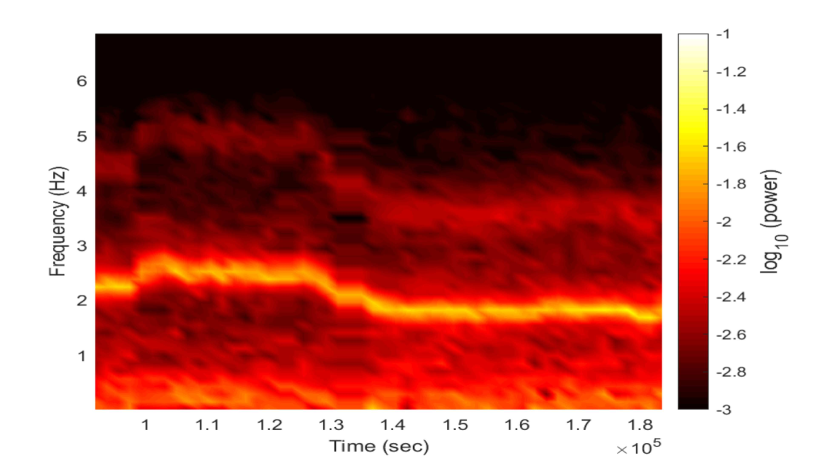
To understand the detailed nature of the variation of the observed QPOs (both primary and harmonics) during AstroSat observed short period of the outburst of MAXI J1535-571, dynamic PDS is studied. Since overall fluctuation of the QPOs is not prominent in a small time window of each orbit data, we combined successive orbits (no. 1060010615) data corresponding to MJD = 58009.259 to 58010.359. Total exposure time of these 13 orbits (after removing overlap time data) is 91944 sec i.e., 1.1 day. During this observation period, the primary dominating type-C QPO frequency was observed to vary in a very small range of Hz (see, Fig. 1a and Table 1). A faint harmonic was also seen in the PDSs (see, Fig. 2) when we analyzed each whole orbit’s data. The dynamic PDS of the combined orbits data is shown in Fig. 3. To make this dynamic PDS, sec time-binned lightcurves of these orbits were divided into chunks of sec with an increment of sec. In Fig. 3, the X-axis shows the midpoint of the time windows (in sec) selected for generating the dynamic PDS. The Y-axis shows the Frequency (in Hz) and the color represents log10Power. The variation of centroid frequency of QPOs along with the harmonics are clearly observable in Fig. 3.
Initial hrs, QPOs were roughly constant at Hz, then it moved to the higher frequency branch Hz. A small variation of frequency in this higher branch was observed for hrs. Then it moved back to the lower frequency branch of Hz, after spending small duration in Hz. It continued in this low-frequency range for the remaining time of hrs.


3.2 Spectral properties
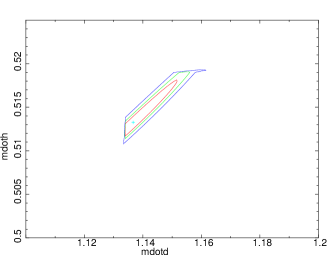
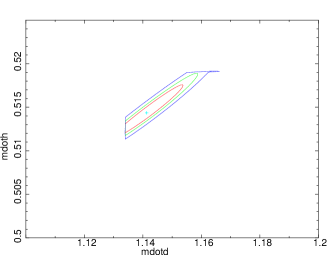
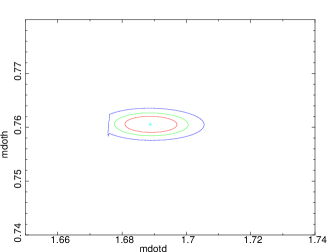
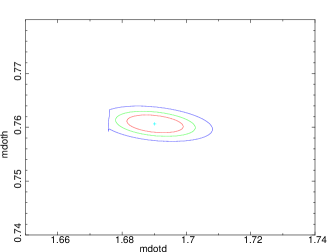
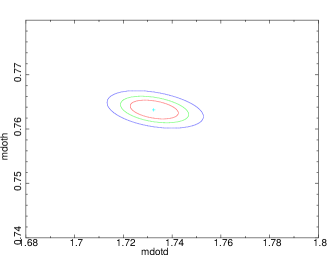
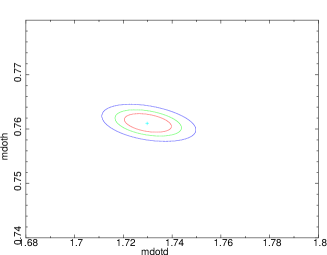
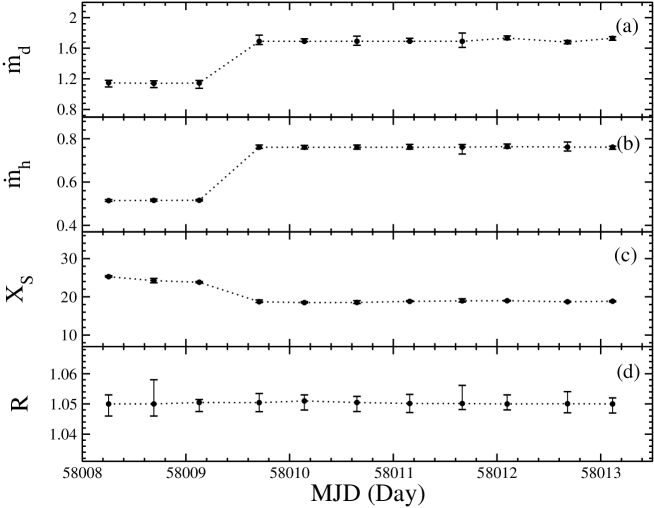
We fitted the keV spectra of LAXPC10 instrument using the TCAF model-based fits file in XSPEC. We presented the detailed results of only eleven orbits spanning our whole observation period. The accretion parameters did not change significantly from orbit to orbit. Since we used 2% systematic error to fit the spectra, to consider the small fluctuations in the spectral fitted parameters would lead a wrong conclusion. We only presented overall variation of the accretion parameters during our observations. A sample LAXPC10 spectrum of orbit 10597 (observation date: 2017 September 13) in keV, fitted with TCAF model is shown in Fig 4. In Fig 5, we plotted confidence contours for two types of accretion rates, namely disk rate () and halo rate () for six orbits (10584, 10597, 10612, 10627, 10641, 10656) correspond to 2017 September 12, 13, 14, 15, 16, and 17. A clear non-correlated variation of the flow parameters is observable. In Fig. 6, we show the variation of disk rate (), halo rate (), shock location () and compression ratio () with day (in MJD). For the first observation (2017 September 12) the fitted parameters did not vary significantly. The parameters showed variation around MJD=58009.706 (orbit 10606). The location of shock boundary on our first observation (orbit 10584, MJD=58008.254) was 25.3 with a low compression ratio (). On the fourth observation on MJD=58008.706 (2017 September 13), the disk rate showed a sudden increase from 1.14 to 1.69 . The halo rate also increased from 0.52 to 0.76 on this observation (orbit 10606). Shock location () decreased from 23.8 to 18.7 on this day, but the compression ratio () remained low (1.05). After that, the accretion parameters remained almost constant throughout the next three observation days (till 2017 September 17). Throughout our observation period from LAXPC data, we observed that the disk rate was high compared to the halo rate. The location of the shock boundary resided at a low value. These characteristics point to a softer state (intermediate or SS). The presence of type-C QPOs in each observation eliminates the possibility of this phase of the outburst in the SS. The only possible way to explain this uncommon accretion characteristic is to consider this period to be in the intermediate state.

3.3 The physical origin of the observed QPOs
According to the shock oscillation model, the low-frequency QPOs are due to resonance oscillation of the shock (Molteni et al. 1996; Chakrabarti & Manickam, 2000; Chakrabarti et al. 2015) or non-satisfaction of the Rankine-Hugoniot conditions (Ryu et al. 1997), which leads to unstable oscillatory shock. The resonance oscillation occurs when the infall time of the post-shock matter matches with the post-shock matter cooling time. To confirm whether resonance occurred or not, we computed the cooling time scales and infall time scales in each observation (Chakrabarti et al. 2015).
3.3.1 Cooling and infall time scales: Resonance Shock Oscillation
Following the method described in Chakrabarti et al. (2015), we calculated the cooling and infall time scales to check whether the observed type-C QPOs during our observation period are due to the resonance oscillation or not. According to Chakrabarti et al. (2015), to satisfy resonance oscillation for type-C QPOs, the ratio of the matter cooling and infall times should fall within roughly 50% of unity (i.e., in between ). For our calculation, we considered the TCAF configuration where high angular momentum Keplerian matter () is submerged inside the low angular momentum halo matter (). Depending upon the centrifugal barrier, the radially moving sub-Keplerian matter forms a shock at a location (Chakrabarti, 1989). The CENBOL is assumed to be cylindrical in shape and the total thermal energy of the CENBOL is . The matter at radius , moves with a velocity of . The post-shock region cools down because of the inverse Comptonization of high energy electrons with the soft photons from the Keplerian disk. For supermassive black holes, cooling is significant due to synchrotron and bremsstrahlung processes. For the low mass X-ray binary, we only considered Comptonization cooling at a rate of . After estimating the total thermal energy of the CENBOL () and cooling rate () due to Comptonization, we obtain the cooling time to be,
| (1) |
The infall time () of the post-shock matter moving with a velocity , is given by,
| (2) |
We noted the computed , and their ratio () in Table 2. We see that the cooling time scales () are very low compared to the infall time scales (). This implies that the cooling of the post-shock region is very efficient. Based on these results, we conclude that the origin of the QPOs is not due to resonance oscillation.
3.3.2 Rankine-Hugoniot Conditions: Non-dissipative Shock Oscillation
In the previous sub-Section, we have seen that the observed type-C QPOs are not due to the resonance oscillation since the cooling and infall time scales in the post-shock region are not found to be comparable. The other possible origin of these QPOs could be due to the non-satisfaction of the Rankine-Hugoniot conditions. For a steady shock, the Rankine-Hugoniot conditions need to be satisfied.
In Chakrabarti (1989c), the Rankine-Hugoniot shocks have been discussed in non-dissipative adiabatic flows for the hybrid model flow where the flow is always in vertical equilibrium. The dimensionless equations of the energy, the angular momentum, and the mass must be conserved to achieve a complete shock solution. The energy (), the pressure balance, and the baryon number () are given by (as in Chakrabarti 1989c),
| (3a) | ||||
| (3b) | ||||
| (3c) | ||||
and denote the pressure and density integrated in vertical direction. is the non-dimensional radial velocity measured in the equatorial plane. The subscripts ‘’ and ‘’ implies pre- and post- shock quantities. To form a steady Rankine-Hugoniot shock, the satisfaction of conservation equations 3(a-c) is mandatory. During an outburst, as accretion rates vary, a steady shock solution is not always possible even though there are two saddle type sonic points with the inner sonic point having higher entropy (Chakrabarti, 1989c). In this case, one would observe a periodic movement of the centrifugally driven shock (Ryu et al. 1997). This oscillation would be nearly independent of the accretion rates and may also have some winds. This type of oscillation may be present in the intermediate state of normal outbursting sources. As shown in Ryu et al. (1997), the amplitude of oscillation is high, and thus QPOs could be of type-C. They reported the time period ( in second) of the QPOs to be in the range of
| (4) |
For the BHC MAXI J1535-571 of mass (Shang et al. 2019), this yields a frequency in the range of Hz. This is in near-exact agreement with the observation where we observed type-C QPOs in the range of Hz.
4 Discussions
We studied transient BHC MAXI J1535-571 during its 2017-18 outburst using AstroSat LAXPC data. We used data of 62 orbits (except operational shutdown period) from 2017 September 12 (MJD=58008.254) to 2017 September 17 (MJD=58013.155). We used all anode layer data of the LAXPC10 for the analysis. We studied the timing and spectral properties of the source. For the spectral study, we used physical accretion flow model TCAF in XSPEC.
We observed a sharp primary QPO with a harmonic (see Table 1) for each of the 62 orbit data. The QPO frequencies were varied from Hz (MJD=58010.359, 2017 September 14) to Hz (MJD=58009.128, 2017 September 13) in a quasi-random manner. A sample of six continua fitted PDSs is shown in Fig. 1, where the fundamental and the harmonics are also mentioned in the individual plots. The obtained -values and fractional (see Table 1) imply these to be type-C QPOs. We calculated the Pearson linear correlation between the QPO frequency and the fractional rms of the 62 observations and found a very weak negative correlation with a coefficient of r=-0.007. Signature of the low-frequency QPOs in MAXI J1535-571 is also been reported by many groups (Huang et al. 2018; Stiele & Kong 2018; Shang et al. 2019) using observation of other satellites as well as AstroSat (Sreehari et al. 2019; Bhargava et al. 2019). Huang et al. (2018) reported QPOs using the Insight-HXMT observation taken from 2017 September 6 to 23. They found different types (A, B and C) of QPOs in the intermediate states. They have also found a negative (soft) lag at the type-C centroid frequency and as the QPO frequency decreases the lag tends to zero. From these soft lags at high QPO frequencies of the type-C QPOs, they have concluded the system to be highly inclined. Sreehari et al. (2019) and Bhargava et al. (2019) also presented timing analysis using AstroSat LAXPC data and reported observation of type-C QPOs after identifying the phase of the outburst as HIMS. Observation of our QPO frequencies ( Hz) roughly matches with the observed QPO frequencies of Sreehari et al. (2019; Hz) and Bhargava et al. (2019; Hz). It has been observed in many transient BHCs that type-C QPOs evolves monotonically in the HS and HIMS of rising and declining phases and type-B or A QPOs are found sporadically on and off during SIMS (see, Nandi et al. 2012; Debnath et al. 2013 and references there in). In Paper-I, Shang et al. (2019) also reported non-evolving type-C QPOs during our AstroSat observation period (12-17 Sep. 2017) in the range of Hz.
To understand more detailed variation of the nature of the observed QPOs in small time scales, dynamic variation of PDSs are studied. Since the overall variations were not significant in a small time window of each orbit data, we made dynamic PDS by combining successive 13 orbits LAXPC10 data between MJD 58009.259 and MJD 58010.359, when QPO frequency varied in the range of Hz to Hz. A more clear variation of the primary QPO and its harmonic are observable in the dynamic PDS (Fig. 3). This region of the outburst was an important phase. During this time, the primary dominating QPO frequency increased from Hz to Hz, and then decreased to Hz. Spectral analysis with the TCAF model, also showed a significant change in the accretion flow parameters (see, Fig. 6).
We also studied the spectral properties of the source using the LAXPC10 data in the keV energy range. We used TCAF model-based fits file to gain insight about the accretion dynamics of the source during this period of AstroSat observation. From the spectral fits, we obtained accretion rates ( and ) and shock parameters ( and ). The variation of TCAF model fitted parameters for eleven observations (orbits) are shown in Fig. 6 (also see Table 2). Fig 4 show the spectrum of orbit 10597 fitted with TCAF model. A high residual is present in the spectrum around 10 keV. This feature is also observed by Bhargava et al. (2019) and Sridhar et al. (2019). This feature was not observed in Shang et al. (2019) in the analysis of the same region of the outburst of the combined Swift/XRT, MAXI/GSC and Swift/BAT data using the same model (TCAF). So, we suggest that this is probably due to the instrumental errors rather than the intrinsic properties of the source. Although overall values of the obtained best-fitted flow parameters did not show significant variation, a small change in the parameters was observed between the third and the fourth observations. The contour plots of the two types of accretion rates ( and ) in six orbits data shown in Fig 5, clearly indicates the independent nature of these two accretion components. The disk rate () always remained high compared to the halo rate (). The compression ratio remained very low throughout our observation period and the shock was located close to the black hole (25 to 19 ). These values indicate the signature of a softer spectral state. The presence of LFQPOs in our observational period ruled it out as soft state. Dominating contribution of the disk rate over halo rate, the presence of weaker shock at low radius and the signature of the non-evolving QPOs in the PDSs confirm spectral nature of the source as intermediate state. Due to the data quality and small variation of the accretion parameters, the precise prediction (whether HIMS or SIMS) of the spectral state remained inconclusive. Analyzing the broad band data of Swift/XRT, BAT and MAXI/GSC, Shang et al. (2019) concluded the state of the outburst as SIMS. However, the studied period of our observation was marked as HIMS by Sreehari et al. (2019) and Bhargava et al. (2019).
Overall during our observation time (MJD = 58008.254 - 58013.155) of the AstroSat, type-C QPOs are found to vary randomly in a narrow range of Hz (see, Fig. 1a and Table 1). This non-evolution of type-C QPOs are quite uncommon in a transient BHC. The origin of the type-C QPOs is still a matter of debate. Many theoretical explanations have been given and various models has been proposed to explain the basis of these types of QPOs. We have discussed them in Section 1. In this paper, we tried to explain the origin of the type-C QPOs observed for this source from the TCAF paradigm. In the TCAF paradigm, the reason behind such QPOs is believed to be the oscillation of shock boundary or CENBOL (Chakrabarti & Manickam 2000; Chakrabarti et al. 2005, 2008). The shock oscillation occurs due to non-satisfaction of the Rankine-Hugoniot conditions (Ryu et al. 1997) or satisfaction of the resonance condition in the post-shock (CENBOL) region (Molteni, Sponholz & Chakrabarti 1996, Chakrabarti et al. 2015). In the harder states, the size of the CENBOL is larger with a large shock location and a high compression ratio. In these states, stronger shocks create sharp shock boundaries and their oscillations produce type-C QPOs. As the size of the CENBOL is big, large number of soft photons from the Keplerian disk are inverse Comptonized to become hard photons. Due to the oscillation of the shock boundary, the CENBOL size also changes. It becomes larger when the shock moves away and smaller when the shock moves inward. According to the shock oscillation model, the QPO frequencies () are inversely proportional to the infall time scales. In general, during the rising phase of an outburst of a transient BHC, the oscillating shock is observed to move inward with reducing and in the declining phase, outward movement of the oscillatory shock is observed. So, during the rising phase of the outburst, type-C QPO frequencies are observed to rise monotonically and in the declining phase monotonically decreasing nature of the QPO frequencies is observed.
To check if the origin of these type-C QPOs is due to resonance oscillation or due to non-satisfaction of the Rankine-Hugoniot conditions, we calculated the infall time () and cooling time () of the post-shock region. We noticed that the cooling time scale is of order less than the infall time scale. The obtained low values of shock locations () from the TCAF model fitted spectral analysis also supports the fact that the cooling is more efficient during this period of the outburst. The two time scales, namely, and were not found to be comparable. Thus we conclude that the observed type-C QPOs did not originate due to the resonance oscillation. The other possible origin for this type of QPOs is the shock oscillation due to the non-satisfaction of the Rankine-Hugoniot conditions. This happens when the flow has parameters such that there are two saddle type sonic points with the inner one having more entropy than the outer one, and yet, the shock condition is not satisfied (Chakrabarti, 1989c). This was verified by numerical simulations of Ryu et al. (1997). Here the amplitude of the oscillations was found to be high as to produce type-C QPOs. This oscillation would also be nearly independent of the accretion rates and may also have some winds produced during the rapid inward motion of the shock front. The wild infra-red flickering and large absorption observed for this source points to presence of outflows (Baglio et al. 2018). The time period of oscillation found in the simulation clearly matches with our observed frequencies. We also found that QPO frequencies are nearly independent of the accretion rates and vary randomly in the range of Hz.
Finally, we may conclude that the sharp type-C QPOs are due to the oscillations of the non-dissipating shocks when the Rankine-Hugoniot relation is not satisfied. Our observed frequency range ( Hz) seems to agree with the theoretical predictions made ( Hz) from this consideration for MAXI J1535-571, which has a mass of .
5 Summary
We analyzed the AstroSat LAXPC10 data of MAXI J1535-571 from 2017 September 12 to 17. For timing analysis, we considered 3-80 keV data of 62 orbits. We used 3-40 keV energy range data of eleven orbits for spectral study. The key findings from our obtained results are as follows.
-
1.
The source was found to be in the intermediate spectral state during our studied period with AstroSat data. High dominance of the Keplerian disk rate over the sub-Keplerian halo rate and the presence of weaker shock at low radius were observed during this phase of the outburst.
-
2.
Dynamic PDS of continuous 13 orbit data of day (MJD=58009.259-58010.359) showed a small time scale variation of QPOs in the range of Hz to Hz. Variation of the harmonics was also observed in the dynamic PDS.
-
3.
For all 62 orbits data of AstroSat LAXPC, type-C LFQPOs were observed. QPOs were observed quasi-randomly in the range of Hz. These non-evolving QPOs also signify this as intermediate spectral state. We tried to find the origin of the QPOs under shock oscillation model of the TCAF paradigm. We checked whether QPOs are originated due to the shock oscillation because of the satisfaction of the resonance condition or non-satisfaction of the Rankine-Hugoniot conditions. Resonance oscillation was ruled out as cooling and infall time scales of the post-shock matter was not matched. We found that non-satisfaction of the Rankine-Hugoniot conditions is the cause of the observed type-C QPOs. A good agreement with the theory ( Hz) in the observed frequency range ( Hz) was also found.
Acknowledgement
We acknowledge the strong support from Indian Space Research Organization (ISRO) for successful realization and operation of AstroSat mission. This work makes use of archived data from Indian Space Science Data Centre (ISSDC). We acknowledge Prof. H. M. Antia and T. B. Katoch for their help and constructive suggestions regarding the data analysis and improvement of the manuscript. D.C. and D.D. acknowledge support from DST/SERB sponsored Extra Mural Research project (EMR/2016/003918) fund. Research of D.D. and S.K.C. is supported in part by the Higher Education Dept. of the Govt. of West Bengal, India. K.C. acknowledges support from DST/INSPIRE (IF170233) fellowship. R.B. acknowledges support from CSIR-UGC NET qualified UGC fellowship (June-2018, 527223). S.K.N., D.D. and S.K.C. acknowledge partial support from ISRO sponsored RESPOND project (ISRO/RES/2/418/17-18) fund. H.-K. C. is supported by MOST of Taiwan under grants MOST/106-2923-M-007-002-MY3 and MOST/108-2112-M-007-003.
References
- Antia et al. (2017) Antia, H. M., Yadav, J. S., Agrawal, P. C. et al., 2017, Astrophys. J. Suppl. Ser., 231, 10
- Arnaud (1996) Arnaud, K.A., 1996, ASP Conf. Ser., Astronomical Data Analysis Software and Systems V, ed. G.H. Jacoby & J. Barnes, 101, 17
- Bagilo et al. (2018) Baglio, M. C., Russel, D. M., Casella, P., et al., 2018, Astrophys. J., 867, 114
- Belloni & Hasinger (1990) Belloni, T. & Hasinger, G., 1990, Astron. Astrophys.230, 103
- Belloni et al. (2005) Belloni, T., Homan, J., Casella, P., et al. 2005, Astron. Astrophys.440, 207
- Bhargava et al. (2019) Bhargava, Y., Belloni, T., Bhattacharya, D., & Misra, R., 2019, Mon. Not. R. Astron. Soc., 488, 720
- Bhattacharjee et al. (2017) Bhattacharjee, A., Banerjee, I., & Banerjee, A., et al. 2017, Mon. Not. R. Astron. Soc., 466, 1372
- Cabanac et al. (2010) Cabanac, C., Henri, G., Petrucci, P.-O., et al. 2010, Mon. Not. R. Astron. Soc., 404, 738
- Casella et al. (2005) Casella, P., Belloni, T., & Stella, L., 2005, Astrophys. J., 629, 403
- Chakabarti (1989a) Chakrabarti, S. K. 1989a, Astrophys. J., 337L, 89
- Chakabarti (1989b) Chakrabarti, S. K. 1989b, Mon. Not. R. Astron. Soc., 240, 7
- Chakabarti (1989c) Chakrabarti, S. K. 1989c, Astrophys. J., 347, 365
- Chakrabarti (1990) Chakrabarti, S. K. 1990, Theory of Transonic Astrophysical Flows (Singapore: World Scientific)
- Chakrabarti & Titarchuk (1995) Chakrabarti, S. K., & Titarchuk, L.G., 1995, Astrophys. J., 455, 623
- Chakrabarti (1997) Chakrabarti, S.K., 1997, Astrophys. J., 484, 313
- CM (00) Chakrabarti, S. K., & Manickam, S. G., 2000, Astrophys. J., 531, L41
- Chakrabarti et al. (2004) Chakrabarti, S. K., Acharyya, K., & Molteni, D., 2004, Astron. Astrophys., 421, 1
- Chakrabarti et al. (2005) Chakrabarti, S.K., Nandi, A., Debnath, D., et al. 2005, Ind. J. Phys, 79, 841 (arXiv:astro-ph/0508024)
- Chakrabarti et al. (2008) Chakrabarti, S. K., Debnath, D., Nandi, A., & Pal, P. S., 2008, Astron. Astrophys., 489, L41
- Chakrabarti et al. (2015) Chakrabarti, S.K., Mondal, S., & Debnath, D., 2015, Mon. Not. R. Astron. Soc., 452, 3451 (CMD15)
- Chatterjee (2016) Chatterjee, D., Debnath, D., Chakrabarti, S. K., et al. 2016, Astrophys. J., 827, 88
- Chatterjee (2019) Chatterjee, D., Debnath, D., Jana, A., & Chakrabarti, S. K., 2019, Astrophys. Space Sci., 364, 14
- Chatterjee (2020) Chatterjee, K., Debnath, D., Chatterjee, D,. et al. 2020, Mon. Not. R. Astron. Soc., 493, 2452
- Debnath et al. (2008) Debnath D., Chakrabarti S. K., Nandi A., Mandal S., 2008, Bull. Astron. Soc. India, 36, 151
- Debnath et al. (2010) Debnath, D., Chakrabarti, S.K., & Nandi, A., 2010, Astron. Astrophys., 520, A98
- Debnath et al. (2013) Debnath, D., Chakrabarti, S. K., & Nandi, A., 2013, AdSpR, 52, 2143
- Debnath, Chakrabarti & Mondal (2014) Debnath, D., Mondal, S., & Chakrabarti, S. K., 2014, Mon. Not. R. Astron. Soc., 440, L121
- Debnath, Mondal & Chakrabarti (2015a) Debnath, D., Mondal, S., & Chakrabarti, S. K., 2015a, Mon. Not. R. Astron. Soc., 447, 1984
- Debnath (2015b) Debnath, D., Molla, A.A., Chakrabarti, S.K., & Mondal, S., 2015b, Astrophys. J., 803, 59
- Debnath et al (2017) Debnath, D., Jana, A., Chakrabarti, S. K., & Chatterjee, D., 2017, Astrophys. J., 850, 92
- Debnath et al (2020) Debnath, D., Chatterjee, D., Jana, A., Chakrabarti, S. K., & Chatterjee, K., 2020, RAA, 20, 175
- Dincer (2017) Dincer, T., 2017, ATel, 10716
- Huang et al. (2018) Huang, Y., et al., 2018, Astrophys. J., 866, 122
- Ingram et al. (2009) Ingram, A., Done, C., Fragile, P. C., 2009, Mon. Not. R. Astron. Soc., 397, L101
- Jana,Debnath & Chakrabarti (2016) Jana, A., Debnath, D., Chakrabarti, S. K., et al. 2016, Astrophys. J., 819, 107
- Jana et al. (2017) Jana, A., Chakrabarti, S. K., & Debnath, D., 2017, Astrophys. J., 850, 91
- Jana et al. (2020) Jana, A., Debnath, D., Chatterjee, D., et al. 2020, RAA, 20, 28
- Kato & Fukue (1980) Kato, S., Fukue, J., 1980, Publ. Astron. Soc. Jpn., 32, 377
- Kennea et al. (2017) Kennea, J. A., Evans, P. A., Beardmore, A. P., et al., 2017, ATel, 10700, 1
- McClintock & Remilard (2009) McClintock, J. E., & Remillard, R. A. 2009, in Compact Stellar X-ray Sources (Cambridge University Press), 157–214
- Mereminskiy & Grebenev (2017) Mereminskiy, I. A., & Grebenev, S. A., 2017, ATel, 10734, 1
- Miller et al. (2018) Miller, J. M., Gendreau, K., Ludlam, R. M., et al., 2018, Astrophys. J., 860, L28
- Molla et al. (2016) Molla, A. A., Debnath, D., & Chakrabarti, S. K. et al. 2016, Mon. Not. R. Astron. Soc., 460, 3163
- Molla et al. (2017) Molla, A. A., Debnath, D., & Chakrabarti, S. K. et al. 2017, Astrophys. J., 834, 88
- Mondal, Debnath & Chakrabarti (2014) Mondal, S., Debnath, D., & Chakrabarti, S.K., 2014, Astrophys. J., 786, 4
- Mondal, Chakrabarti & Debnath (2016) Mondal, S., Chakrabarti, S.K., & Debnath, D., 2016, Astrophys. Space Sci., 361, 309
- Molteni et al. (1996) Molteni, D., Sponholz, H., & Chakrabarti, S. K., 1996, Astrophys. J., 457, 805
- Muno et al. (1999) Muno, M. P., Morgan, E. H., & Remillard, R. A., Astrophys. J., 1999, 527, 321
- Nandi et al. (2012) Nandi, A., Debnath, D., Mandal, S., & Chakrabarti, S. K., 2012, Astron. Astrophys., 542, 56
- Negoro et al. (2017) Negoro, H., Ishikawa, M., Ueno, et al., 2017, ATel, 10699, 1
- Nobili et al. (2000) Nobili, L., Turolla, R., Zampieri, L., & Belloni, T., 2000, Astrophys. J., 538, L137
- Nowak & Wagoner (1991) Nowak, M., Wagoner, R. V., 1991, Astrophys. J., 378, 656
- Pahari et al. (2017) Pahari, M., Antia, H. M., Yadav, J. S., et al. 2017, Astrophys. J., 849, 16
- Remilard & McClintock (06) Remillard R. A., McClintock J. E., 2006, ARA&A, 44, 49
- Revnivstev et al. (2000) Revnivtsev, M. G., Trudolyubov, S. P., Borozdin, K. N., 2000, Mon. Not. R. Astron. Soc., 312, 151
- Russell et al. (2017) Russell, T. D., Miller-Jones, J. C. A., Sivakoff, G. R., et al., 2017, ATel, 10711, 1
- Ryu et al. (1997) Ryu, D., Chakrabarti, S. K., & Molteni, D. 1997, Astrophys. J., 474, 378
- Scaringi & ASTR211 Students (2017) Scaringi, S., & ASTR211 Students, 2017, ATel, 10702, 1
- Shang (19) Shang, J.-R., Debnath, D., & Chatterjee, D., et al. 2019, Astrophys. J., 875, 4 (Paper-I)
- Shidatsu et al. (2017a) Shidatsu, M., Nakahira, S., Negoro, H., et al., 2017a, ATel, 10761, 1
- Shidatsu et al. (2017b) Shidatsu, M., Nakahira, S., Negoro, H., et al., 2017b, ATel, 11020, 1
- Shirakawa & Lai (2002) Shirakawa, A., & Lai, D., 2002, Astrophys. J., 564, 361
- Sobczak et al. (2000) Sobczak, G. J., McClintock, J. E., & Remillard, R. A., et al. 2000, Astrophys. J., 531, 537
- Sreehari et al. (2019) Sreehari, H., Ravishankar, B. T., Iyer, N., et al., 2019, Mon. Not. R. Astron. Soc., 487, 928
- Sridhar et al. (2019) Sridhar, N., Bhattacharyya, S., Chandra, S., 2019, Mon. Not. R. Astron. Soc., 487, 4221
- Stevens et al. (2018) Stevens, A. L., Uttley, P., Altamirano, D., et al., 2018, Astrophys. J., 865, L15
- Stiele et al. (2013) Stiele, H., Belloni, T., Kalemci, E., et al., 2013, Mon. Not. R. Astron. Soc., 429, 2655
- Stiele & Kong (2018) Stiele, H., & Kong, A. K. H., 2018, Astrophys. J., 868, 71
- Tagger & Pellat (1999) Tagger, M., & Pellat, R. 1999, Astron. Astrophys., 349, 1003
- Tagger et al. (2004) Tagger, M., Varniére, P., Rodriguez, J., & Pellat, R., 2004, Astrophys. J., 607, 410
- Tao et al. (2018) Tao, L., Chen, Y., Güngör, C., Huang, Y., et al., 2018, Mon. Not. R. Astron. Soc., 480, 4443
- Tetarenko et al. (2017) Tetarenko, A. J., Russell, T. D., Miller-Jones, J. C. A., et al., 2017, ATel, 10745, 1
- Titarchuk et al. (1998) Titarchuk, L., Lapidus, I., Muslimov, A., 1998, Astrophys. J., 499, 315
- Titarchuk & Osherovich (2000) Titarchuk, L., & Osherovich, V., 2000, Astrophys. J., 542, L111
- Trudolyubov et al. (1999) Trudolyubov, S., Churazov, E., & Gilfanov, M., 1999, Astron. Astrophys., 351, L15
- Verner et al. (1996) Verner, D. A., Ferland, G. J., Korista, K. T., Yakovlev, D. G, 1996, Astrophys. J., 465, 487
- Vignarca et al. (2003) Vignarca, F., Migliari, S., Belloni, T., et al. 2003, Astron. Astrophys., 397, 729
- Wilms et al. (2000) Wilms, J., Allen, A., & McCray, R., 2000, Astrophys. J., 542, 914
- Xu et al. (2017) Xu, Y., Harrison, F. A., Garcia, J. A., et al., 2017, Astrophys. J., 852, L34
| Orbit | UT | Day | QPO Freq. | FWHM | Q | fractional | Orbit | UT | Day | QPO Freq. | FWHM | Q | fractional |
|---|---|---|---|---|---|---|---|---|---|---|---|---|---|
| Date | (MJD) | ( in Hz) | ( in Hz) | rms | Date | (MJD) | ( in Hz) | ( in Hz) | rms | ||||
| (1) | (2) | (3) | (4) | (5) | (6) | (7) | (1) | (2) | (3) | (4) | (5) | (6) | (7) |
| 10584 | 09-12 | 58008.254 | 10622 | 09-14 | 58010.793 | ||||||||
| 10585 | 09-12 | 58008.327 | 10623 | 09-14 | 58010.866 | ||||||||
| 10586 | 09-12 | 58008.401 | 10624 | 09-14 | 58010.937 | ||||||||
| 10588 | 09-12 | 58008.536 | 10625 | 09-14 | 58011.010 | ||||||||
| 10589 | 09-12 | 58008.618 | 10626 | 09-14 | 58011.083 | ||||||||
| 10590 | 09-12 | 58008.690 | 10627 | 09-15 | 58011.158 | ||||||||
| 10592 | 09-12 | 58008.762 | 10628 | 09-15 | 58011.230 | ||||||||
| 10593 | 09-12 | 58008.834 | 10629 | 09-15 | 58011.302 | ||||||||
| 10594 | 09-12 | 58008.906 | 10632 | 09-15 | 58011.521 | ||||||||
| 10595 | 09-12 | 58008.979 | 10633 | 09-15 | 58011.593 | ||||||||
| 10596 | 09-12 | 58009.051 | 10635 | 09-15 | 58011.665 | ||||||||
| 10597 | 09-13 | 58009.128 | 10636 | 09-15 | 58011.736 | ||||||||
| 10598 | 09-13 | 58009.198 | 10637 | 09-15 | 58011.809 | ||||||||
| 10599 | 09-13 | 58009.269 | 10638 | 09-15 | 58011.880 | ||||||||
| 10600 | 09-13 | 58009.343 | 10639 | 09-15 | 58011.953 | ||||||||
| 10603 | 09-13 | 58009.563 | 10640 | 09-15 | 58012.027 | ||||||||
| 10604 | 09-13 | 58009.634 | 10641 | 09-16 | 58012.098 | ||||||||
| 10606 | 09-13 | 58009.706 | 10642 | 09-16 | 58012.174 | ||||||||
| 10607 | 09-13 | 58009.778 | 10643 | 09-16 | 58012.245 | ||||||||
| 10608 | 09-13 | 58009.850 | 10644 | 09-16 | 58012.319 | ||||||||
| 10609 | 09-13 | 58009.921 | 10646 | 09-16 | 58012.465 | ||||||||
| 10610 | 09-13 | 58009.994 | 10647 | 09-16 | 58012.537 | ||||||||
| 10611 | 09-13 | 58010.067 | 10648 | 09-16 | 58012.609 | ||||||||
| 10612 | 09-14 | 58010.142 | 10650 | 09-16 | 58012.680 | ||||||||
| 10613 | 09-14 | 58010.214 | 10651 | 09-16 | 58012.753 | ||||||||
| 10614 | 09-14 | 58010.286 | 10652 | 09-16 | 58012.825 | ||||||||
| 10615 | 09-14 | 58010.359 | 10653 | 09-16 | 58012.896 | ||||||||
| 10617 | 09-14 | 58010.505 | 10654 | 09-16 | 58012.968 | ||||||||
| 10618 | 09-14 | 58010.577 | 10655 | 09-16 | 58013.042 | ||||||||
| 10619 | 09-14 | 58010.649 | 10656 | 09-17 | 58013.115 | ||||||||
| 10621 | 09-14 | 58010.721 | 10657 | 09-17 | 58013.155 |
Col. 1 represents orbits of the observation. Columns 2 & 3 show the UT date and MJD respectively. UT dates are in MM-DD format
of the year 2017. Cols. 4 & 5 represent Lorentzian model fitted centroid frequency and full-width at half maximum (FWHM) of
the observed QPOs in Hz. Cols. 6 & 7 represent ‘Q (=)’ and fractional of the QPOs.
| Orbit | Date | MJD | R | dof | |||||
|---|---|---|---|---|---|---|---|---|---|
| () | () | ||||||||
| (1) | (2) | (3) | (4) | (5) | (6) | (7) | (8) | (9) | (10) |
| 10584 | 2017-09-12 | 58008.254 | 211.74 | 139 | 1.523 | ||||
| 10590 | 2017-09-12 | 58008.690 | 172.91 | 139 | 1.240 | ||||
| 10597 | 2017-09-13 | 58009.128 | 158.47 | 139 | 1.140 | ||||
| 10606 | 2017-09-13 | 58009.706 | 164.07 | 139 | 1.180 | ||||
| 10612 | 2017-09-14 | 58010.142 | 205.88 | 139 | 1.481 | ||||
| 10619 | 2017-09-14 | 58010.649 | 172.17 | 139 | 1.238 | ||||
| 10627 | 2017-09-15 | 58011.158 | 177.50 | 139 | 1.277 | ||||
| 10635 | 2017-09-15 | 58011.665 | 152.86 | 139 | 1.099 | ||||
| 10641 | 2017-09-16 | 58012.098 | 176.15 | 139 | 1.267 | ||||
| 10650 | 2017-09-16 | 58012.680 | 163.48 | 139 | 1.176 | ||||
| 10656 | 2017-09-17 | 58013.115 | 186.22 | 139 | 1.339 |
, , , , are the TCAF fitted parameters. The accretion rates ( and ) are in Eddington rate.
represents shock location values in Schwarschild radius unit. is the compression ratio between post- and pre- shock densities.
TCAF model fitted values are mentioned in Cols , where ‘dof’ represents the degrees of freedom.
The superscripts and subscripts are error values of 90% confidence extracted using err task in XSPEC.
Note, the mass accretion rates are sometimes higher than one Eddington rate, even though the luminosities are sub-Eddington.
This is because TCAF self-consistently computes the efficiency factor for each data and the observed luminosity .
The efficiency varies inversely to the shock location () in TCAF. So, for the above values of the accretion rates, the efficiency
varies between 0.04 to 0.05.
| Orbit | Date | MJD | |||
| (sec) | (sec) | ||||
| (1) | (2) | (3) | (4) | (5) | (6) |
| 10584 | 2017-09-12 | 58008.254 | 0.00012 | 0.02098 | 0.00572 |
| 10597 | 2017-09-13 | 58009.128 | 0.00013 | 0.02087 | 0.00623 |
| 10612 | 2017-09-14 | 58010.142 | 0.00010 | 0.01257 | 0.00796 |
| 10627 | 2017-09-15 | 58011.158 | 0.00010 | 0.01296 | 0.00772 |
| 10641 | 2017-09-16 | 58012.098 | 0.00010 | 0.01308 | 0.00764 |
| 10656 | 2017-09-17 | 58013.115 | 0.00010 | 0.01297 | 0.00771 |