Atmospheric Temperature Inversions and He I 5876 Core Profile Structure in White Dwarfs
Abstract
We report distinctive core profiles in the strongest optical helium line, He I 5876Å, from high-resolution high-sensitivity observations of spectral type DB white dwarfs. By analyzing a sample of 40 stars from Keck/HIRES and VLT/UVES, we find the core appearance to be related to the degree of hydrogen and heavy element content in the atmosphere. New Ca K-line measurements or upper limits are reported for about half the sample stars. He I 5876Å emission cores with a self-reversed central component are present for those stars with relatively low hydrogen abundance, as well as relatively low atmospheric heavy element pollution. This self-reversed structure disappears for stars with higher degrees of pollution and/or hydrogen abundance, giving way to a single absorption core. From our model atmospheres, we show that the self-reversed emission cores can be explained by temperature inversions in the upper atmosphere. We propose that the transition to a single absorption core is due to the additional opacity from hydrogen and heavy elements that inhibits the temperature inversions. Our current models do not exactly match the effective temperature range of the phenomenon nor the amplitude of the self-reversed structure, which is possibly a result of missing physics such as 3D treatment, convective overshoot, and/or non-LTE effects. The He I 5876Å line structure may prove to be a useful new diagnostic for calibrating temperature profiles in DB atmosphere models.
1 Introduction
The presence of elements heavier than helium in the atmospheres of many single white dwarfs (WDs) has garnered increasing interest over the past decade mainly due to the recognition that such stars have accreted material from their extant planetary systems (e.g. reviews by Jura & Young 2014; Veras 2016; Farihi 2016; Zuckerman & Young 2018). We now know that white dwarfs “polluted” by heavy (high-Z111We use the terms ‘heavy elements’ and ‘high-Z’ to refer to elements heavier than hydrogen or helium.) elements are powerful observational tools that provide insights into aspects of exoplanetary systems that are elusive or inaccessible via other techniques. For example, pollution in a single WD suggests the existence of an asteroidal or cometary debris belt and at least one major planet with wide semi-major axis (Veras et al. 2013; Frewen & Hansen 2014; Mustill et al. 2014, 2018), both of which have significant observational limitations in main sequence systems. Moreover, high-resolution high-sensitivity spectroscopy of these stars has revealed a rich and informative laboratory previously hidden in low resolution observations, as the elemental constituents of accreted bodies can be measured at an extraordinary level of detail and precision. In particular, it has opened an invaluable window to detailed exoplanet composition measurements beginning with works that include Zuckerman et al. (2007), Klein et al. (2010, 2011), Dufour et al. (2010), Vennes et al. (2010, 2011), Melis et al. (2011), Farihi et al. (2011), Jura et al. (2012), and Gänsicke et al. (2012).
Meanwhile, the presence and origin of hydrogen in the atmospheres of helium-dominated white dwarfs is a related subject of ongoing investigation. Throughout the evolution of a WD, different mechanisms can raise or lower the hydrogen abundance at its photosphere, a phenomenon known as spectral evolution. The exact roles of transport mechanisms within the WD envelope (MacDonald & Vennes 1991; Rolland et al. 2018, 2020) and of accretion from the interstellar medium or from water-bearing planetesimals (MacDonald & Vennes 1991; Bergeron et al. 2011; Veras et al. 2014; Koester & Kepler 2015; Raddi et al. 2015; Gentile Fusillo et al. 2017) are still being debated.
The conditions of a WD atmosphere affect the visibility of pollution in resulting spectra. The dominant background element either hydrogen or helium sets the stage with opacity. Compared to hydrogen, the lower opacity of a helium-dominated atmosphere produces relatively larger, thus more easily detectable, absorption features for a given high-Z abundance. Additionally, the effective temperature () has a significant effect, as many important optical lines of major and minor elements disappear at either (or both) of the high and low extremes of as the element ionization state changes. Due to the combination of these influences, intermediate temperature helium-dominated WDs are often the richest systems for observing pollution and conducting exoplanet composition analyses.
The DB class is defined as those WDs for which the strongest lines in optical spectra are from He I (Luyten 1952; Sion et al. 1983). These are hydrogen-deficient WDs in the range of 10,00040,000 K. Below 12,000 K neutral helium lines become very weak and essentially disappear at cooler temperatures, while above 40,000 K lines of He II begin to dominate, changing the spectral classification type to DO. If hydrogen lines are also visible, but weaker than the helium lines, then an “A” is added to the spectral type (e.g. DBA), and if high-Z elements are detected a “Z” is added (DBZ or DBAZ). In DBs the strongest optical He I line is at 5875.615 Å in air (hereafter, He5876).
Helium absorption line strengths and profiles in white dwarf optical spectra have been widely used to measure the fundamental stellar parameters of effective temperature, , and gravity (log ), by fitting the helium lines with synthetic spectra (Koester et al. 1981; Beauchamp et al. 1996; Eisenstein et al. 2006; Voss et al. 2007; Bergeron et al. 2011; Koester & Kepler 2015; Rolland et al. 2018). Alternatively, and log can be derived from fitting the spectral energy distribution utilizing broadband photometry and parallaxes (e.g. Bergeron et al. 1997; Bédard et al. 2017). Thanks to the Gaia satellite mission (Gaia Collaboration et al. 2016), with its photometry and parallax measurements over the whole sky, we now have large catalogs of WDs that include such photometric fits (Dufour et al. 2017; Gentile Fusillo et al. 2019). Comparisons between these photometric versus spectroscopic fits of and log have been comprehensively investigated, and while there is good overall agreement in derived parameters from the two methods, some systematic discrepancies remain (Tremblay et al. 2019; Genest-Beaulieu & Bergeron 2019; Bergeron et al. 2019).
Another outstanding problem in modeling polluted WDs are some disagreements in high-Z abundances derived from UV and optical data of the same element (Jura et al. 2012; Gänsicke et al. 2012; Koester et al. 2014a; Melis & Dufour 2017; Xu et al. 2019). While more work is needed to solve these UV-optical discrepancies, it may likely have to do with uncertain atomic data (such as oscillator strengths and Stark widths/shifts) and/or chemical stratification (Vennes et al. 2011; Gänsicke et al. 2012). Meanwhile, an advance in resolving the differences between hydrogen abundances in DBs derived from H and Ly was made by incorporating broadening by neutral helium into the models (Gänsicke et al. 2018; Allard et al. 2020). Some other potentially important effects under consideration are departures from local thermodynamic equilibrium (non-LTE effects, e.g. Napiwotzki 1997; Hubeny et al. 1999), 3-D models (Tremblay et al. 2013; Cukanovaite et al. 2018), convective overshoot (Tremblay et al. 2017; Kupka et al. 2018; Cunningham et al. 2019), and thermohaline mixing (Deal et al. 2013; Koester 2015; Bauer & Bildsten 2018).
As model atmosphere theories and calculations continue to improve and incorporate additional physics related to atmospheric structure, it is desirable to acquire new observational diagnostic tools to guide the way. This paper is a step in that direction. Here we present the serendipitous discovery of distinctive core profiles of the most prominent optical helium line, He5876 in DB WDs, and we demonstrate a connection between atmospheric hydrogen and/or pollution and the appearance of the line core shape.
The paper is organized as follows: in Section 2 we describe the observations, data processing, and how we arrived at our sample of DB stars. Section 3 discusses details of our measurements of heavy element pollution and derived abundances. A categorization and analysis of the sample stars according to their hydrogen abundance and pollution from high-Z elements is given in Section 4. In Section 5 we offer our modeling insights about the presence (or lack) of the He5876 core-inversion feature. Conclusions are given in Section 6.
| WD # | Name | Instru- | He5876 | log | [H/He] | atm. | CaK | [Ca/He] | ,abund | ||
|---|---|---|---|---|---|---|---|---|---|---|---|
| ment | (mag) | core | (K) | ref. | (mÅ) | ref. | |||||
| 0002+729 | GD 408 | HIRES | 14.29 | inv | 14410 | 8.27 | 5.95 | R | 175 10 | 9.59 | (1*) |
| 0017+136 | Feige 4 | HIRES | 15.36 | abs | 18130 | 8.08 | 4.63 | R | 10 | 9.1 | (1) |
| 0100068 | G270-124 | HIRES | 13.91 | abs | 19820 | 8.06 | 5.14 | R | 27 4 | 8.08 | (1*) |
| 0110565 | HE 0110-5630 | UVES | 15.79 | abs | 18483 | 8.12 | 4.18 | V | 130 | 7.9 | (3) |
| 0300013 | GD 40 | both | 15.51 | abs | 14620 | 7.99 | 6.14 | R | 2500 200 | 6.88 | (4) |
| 0308565 | BPM 17088 | UVES | 14.12 | abs | 22840 | 8.07 | 4.82 | R | 15 | 7.8 | (1) |
| 0435+410 | GD 61 | HIRES | 14.84 | abs | 16790 | 8.18 | 4.21 | R | 173 12 | 7.9 | (1), (5) |
| 0437+138 | LP475-242 | HIRES | 14.93 | inv | 15120 | 8.25 | 4.68 | R | 40 8 | 9.2 | (6) |
| 0503+147 | KUV 05034+1445 | HIRES | 14.12 | inv | 15640 | 8.09 | 5.46 | R | 8 | 10.7 | (1) |
| 0615591 | L182-61 | UVES | 13.97 | inv | 15770 | 8.04 | 6.32 | R | 20 | 10.3 | (1) |
| 0716+404 | GD 85 | HIRES | 14.89 | inv | 17150 | 8.08 | 5.99 | R | 53 5 | 8.80 | (1*) |
| 0842+231 | Ton 345 | HIRES | 15.90 | abs | 19780 | 8.18 | 5.10 | W | 350 20 | 5.95 | (1), (7) |
| 1011+570 | GD 303 | HIRES | 14.62 | abs | 17610 | 8.16 | 5.34 | R | 126 8 | 7.8 | (1*) |
| 1046017 | GD 124 | both | 15.77 | inv | 14620 | 8.15 | 6.46 | R | 9 | 10.9 | (2) |
| 1056+345 | G119-47 | HIRES | 15.53 | abs | 12440 | 8.23 | 5.33 | R | 8 | 11.9 | (2) |
| 1144084 | PG 1144-085 | UVES | 16.09 | inv | 15730 | 8.06 | 6.32 | R | 33 | 10.1 | (1) |
| 1252289 | EC 12522-2855 | UVES | 15.89 | abs | 21880 | 8.03 | 4.82 | R | 23 | 7.8 | (1) |
| 1326037 | PG 1326-037 | UVES | 15.76 | abs | 19950 | 8.03 | 4.81 | R | 27 | 8.0 | (1) |
| 1333+487 | GD 325 | HIRES | 14.09 | inv | 15420 | 8.01 | 6.37 | R | 10 | 10.6 | (1) |
| 1403010 | G64-43 | both | 15.71 | inv | 15420 | 8.10 | 6.08 | R | 10 | 10.6 | (2) |
| 1411+218 | PG 1411+219 | HIRES | 14.43 | inv | 14970 | 8.02 | 6.26 | R | 5 | 10.8 | (2) |
| 1425+540 | G200-39 | HIRES | 15.04 | abs | 14410 | 7.89 | 4.26 | R | 235 15 | 9.3 | (1), (8) |
| 1459+821 | G256-18 | HIRES | 14.83 | inv | 16020 | 8.08 | 6.28 | R | 7 | 10.7 | (2) |
| 1542+182 | GD 190 | UVES | 14.67 | abs | 22620 | 8.04 | 4.84 | R | 22 | 7.6 | (1) |
| 1644+198 | PG 1644+199 | HIRES | 15.07 | inv | 15210 | 8.14 | 5.68 | R | 17 1 | 10.3 | (2) |
| 1645+325 | GD 358 | HIRES | 13.59 | abs | 24940 | 7.92 | 4.58 | R | 8 | 7.7 | (1) |
| 1709+230 | GD 205 | both | 14.84 | abs | 19590 | 8.08 | 4.07 | R | 45 4 | 7.9 | (2) |
| 1822+410 | GD 378 | HIRES | 14.28 | abs | 16230 | 8.00 | 4.45 | R | 160 10 | 8.3 | (1*) |
| 1916362 | WD 1916-362 | HIRES | 13.58 | abs | 23610 | 8.10 | 4.22 | R | 10 | 7.6 | (1) |
| 1917074 | LAWD 74 | both | 12.27 | abs | 10195 | 8.0 | 5.16 | V | 6 | 12.5 | (1) |
| 1940+374 | EGGR 133 | HIRES | 14.49 | inv | 16850 | 8.07 | 5.97 | R | 5 | 10.1 | (2) |
| 2129+000 | G26-10 | HIRES | 14.66 | inv | 14350 | 8.25 | 6.49 | R | 7 | 11.1 | (2) |
| 2144079 | G26-31 | both | 14.79 | inv | 16340 | 8.18 | 6.22 | R | 132 7 | 8.6 | (2) |
| 2154437 | LAWD 90 | UVES | 14.64 | abs | 16734 | 8.02 | 4.78 | V | 20 | 9.6 | (1) |
| 2222+683 | G241-6 | HIRES | 15.67 | abs | 14920 | 8.00 | 6.43 | R | 960 96 | 7.25 | (2) |
| 2253062 | GD 243 | UVES | 15.05 | abs | 17190 | 8.07 | 4.35 | R | 21 | 9.1 | (1) |
| 2316173 | L791-40 | UVES | 14.08 | abs | 10868 | 8.0 | 5.27 | V | 20 | 12.0 | (1) |
| 2328+510 | GD 406 | HIRES | 15.08 | inv | 14500 | 8.03 | 6.47 | R | 12 | 10.8 | (1) |
| 2334414 | HE 2334-4127 | UVES | 15.16 | abs | 18250 | 8.03 | 5.34 | V | 16 | 8.9 | (1) |
| 2354+159 | PG 2354+159 | UVES | 15.75 | abs | 24830 | 8.15 | 4.59 | R | 80 | 8.1 | (3) |
References: (1) This Paper, (2) Zuckerman et al. (2010), (3) Koester et al. (2005), (4) Klein et al. (2010), (5) Farihi et al. (2013), (6) Zuckerman et al. (2013), (7) Wilson et al. (2015), (8) Xu et al. (2017).
Note. — The appearance of the He5876 core is indicated either as an inversion (inv) shown in Figure 1, or in absorption (abs) with a representative set shown in Figure 2. Magnitudes are Gaia . Atmospheric parameters, , log , and the logarithmic abundance of hydrogen relative to helium by number ([H/He]), come from spectroscopic fits by R=Rolland et al. (2018), V=Voss et al. (2007), or W=Wilson et al. (2015), as listed in the column labeled “atm. ref.”. Equivalent widths () and upper limits are for the photospheric Ca K-line ( = 3933.663 Å), either newly presented here or taken from the literature as indicated by the “,abund ref.” column (see reference list below). For the logarithmic abundance of calcium relative to helium by number ([Ca/He]), if the only entry in the ,abund ref. column is (1), then these are new values we calculated by comparing WDs with similar and [Ca/He] from Zuckerman et al. (2010) and scaling the abundance by the ratio of the Ca K-line measurements. If the entry is (1*), we have performed a model abundance fit in this paper. If there is a second reference next to (1), then just the measurement is from this paper and [Ca/He] is from the second reference. (2)(5) have both the and [Ca/He] coming from the indicated paper.
2 Sample Selection
During the course of UCLA-based Keck WD programs conducted over the years from 20062012, spectra covering the He5876 line were obtained with the High Resolution Echelle Spectrograph (HIRES, Vogt et al. 1994) on the Keck 1 Telescope. Most observations were made with the HIRES blue collimator and a subset of eight of the WDs were also observed with the HIRES red collimator; both of these setups covered the He5876 wavelength region. HIRES data were acquired with the C5 decker, providing a slit width of 1148 and resolving power = 40,000. The wavelength coverage is approximately 31205950Å in the blue, and 45009000Å in the red, with small gaps in coverage in-between the 3 CCDs, as well as in-between echelle orders of the red data. Standard IRAF (Tody 1986) routines for echelle data reduction followed the procedures described in Klein et al. (2010) and/or used the HIRES software package MAKEE222https://www.astro.caltech.edu/~tb/makee/.
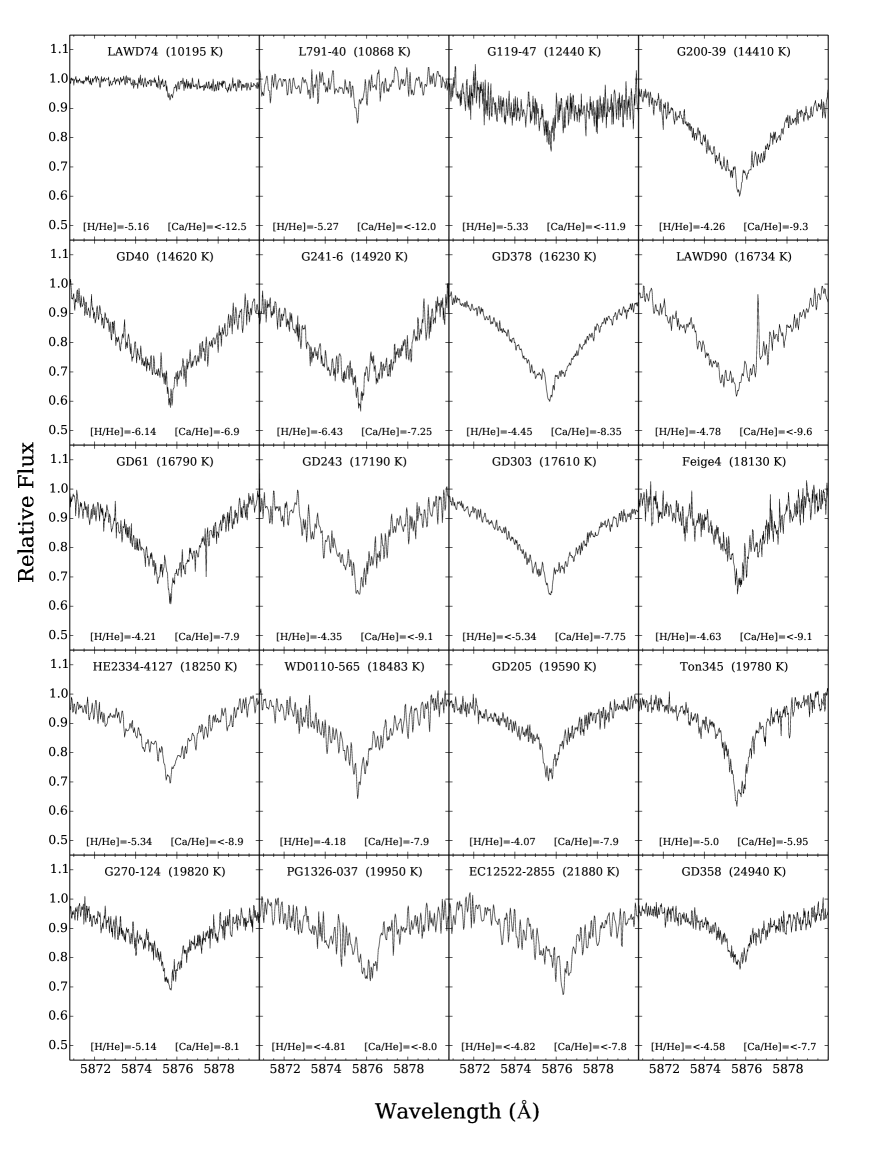
None of the target stars were selected with any fore-knowledge of structure in the He5876 line cores. Typically our HIRES programs were aimed at searching for, or following up on, atmospheric pollution in WDs, but careful inspection of the helium lines revealed the existence of previously unknown structure in the He5876 line cores for some DBs. A portion of the stars display core emission with a self-reversed central component as shown in Figure 1, while others have cores in absorption with a variety of shapes and strengths as shown in Figure 2. Upon further investigation we noticed a trend that the presence of the self-reversed core inversion appears for those stars with little or no atmospheric hydrogen or high-Z elements, while those WDs with evidence for substantial quantities of these elements have He5876 cores predominantly in absorption.

To dismiss any questions of instrumental artifacts and better assess the origin of the line core appearance, we checked the European Southern Observatory (ESO) archival database of high-resolution observations of DBs studied by Voss et al. (2007), i.e. data originating from the Supernovae Type Ia Progenitor (SPY) Survey (Napiwotzki et al. 2001). Those data were acquired at the Very Large Telescope of ESO with the UV-Visual Echelle Spectrograph (UVES) providing a resolving power 18,500 and nearly complete wavelength coverage from 3200 Å to 6650 Å. We found that the He5876 profile in the stars that have observations from both UVES and HIRES instruments (six stars in this study) agree within the noise levels; an example is shown in Figure 3. Some of the HIRES data and all the UVES data included coverage of H, so we looked for any sign of emission in the H cores of those stars and found none.
The He5876 core features are relatively weak, and only clearly appear in the most sensitive spectra. Therefore, we drew our sample from the database of DB WDs observed with either HIRES or UVES by selecting sources with Vmag 16.0 and a signal-to-noise ratio (SNR) 25 measured near = 5869 Å, on the blue wing of the broad He5876 line. This resulted in the set of 40 stars listed in Table 1. For ease of display and visual comparison in Figures 1 3, all the spectra were scaled to unity at = 5869 Å and velocity shifted to the rest frame of He5876, based on the line center positions as measured from the most central core of the line: either the center of an absorption core feature, or the center of a self-reversed emission core.

As mentioned in the Introduction, for a given WD, different studies can result in different values for the fundamental parameters , log and [H/He] ( log n(H)/n(He) ). Variations come from differences in the spectroscopic versus photometric techniques, ongoing evolution of the models and methods, as well as improvements in observational data. For example, when dealing with DB WDs, a significant effect on derived atmospheric parameters can occur depending on whether the abundances of hydrogen and heavy elements are included in computing the atmospheric structure (e.g., Dufour et al. 2007, 2010; Blouin et al. 2018a, b; Coutu et al. 2019).
These variations in fundamental parameters will result in variations of the derived [Ca/He] ( log n(Ca)/n(He)) abundances. Nonetheless, in the context of this work they are relatively small perturbations, and do not alter the overall picture of what is happening with the helium lines. Thus, to create as uniform of a parameter context as possible, we take , log , and [H/He] predominantly from Rolland et al. (2018), since their list of DBs contains nearly all our sample stars, and includes hydrogen abundance measurements or upper limits. A handful of stars with UVES data do not appear in Rolland et al. (2018), so we use the parameters fit by Voss et al. (2007) for those, while the parameters for Ton 345 come from Wilson et al. (2015). From Table 1 we find that the core inversion phenomenon is only observed over a relatively small range of effective temperatures: 14,000 K 17,500 K. Nonetheless, we perform our analysis on the entire sample since it is not clear precisely what the upper and lower boundaries are.
3 Pollution measurements
Often the strongest optical line as defined by the strength of the measured equivalent width (EW) in a polluted WD is the Ca II resonance line at = 3933.663Å (Ca K-line). However, for hydrogen-dominated polluted WDs (DAZ) stars somewhere around 16,00017,000 K there is a changeover in the predominant absorption feature from the Ca K-line to Mg II 4481, which of course has a dependence on the Ca/Mg abundance ratio. We looked for this effect in the DBZ stars, but in our small sample we do not see a cross-over in Ca and Mg line-strengths even up to 24,000 K. For the hottest stars displaying optical calcium lines, GD 205, Ton 345, G270124, and PG2354+159, the strength of Mg II 4481 is either comparable to, or weaker than (undetected in G270124 and PG2354+159), that of the Ca K-line. Thus, we use measurements and upper limits of the Ca K-line for the entire range of our sample.
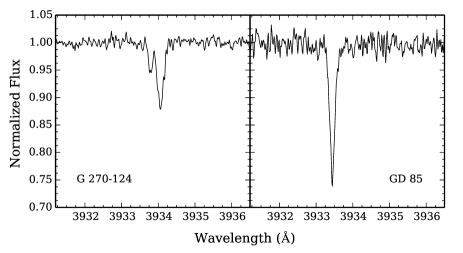
For stars that already have Ca K-line EW and/or abundance measurements derived from high resolution spectra in the literature, we adopt those values as indicated by references (2) to (8) in Table 1. Otherwise, we present new Ca K-line equivalent width measurements (or upper limits) and abundance fits (or upper limit estimates) for nearly half of the sample stars, denoted by references (1*) and (1). While the presence of Ca K-lines in GD 408, GD 61, GD 303, G20039, and GD 378 has been long known (Kenyon et al. 1988; Sion et al. 1988), our updated high-resolution EW measurements provide a significant increase in precision over those discovery papers. In addition, we perform new fits based on our HIRES data for the [Ca/He] abundances for GD 408, GD 303, and GD 378. GD 378 has a rich HIRES spectrum, and a comprehensive abundance analysis will be presented separately (Klein et al., in prep.). Ton 345’s high-Z absorption lines, discovered along with its calcium infrared triplet gas emission lines (Gänsicke et al. 2008), have been analyzed using high-resolution data (Jura et al. 2015; Wilson et al. 2015), but its Ca K-line EW measurement is first recorded here. Finally, we report new Ca K-line detections and abundance measurements for G270124 and GD 85 (Figure 4).
The fit abundances are extracted using an atmosphere code similar to that described in Dufour et al. (2007). For a given star, the effective temperature, surface gravity and H abundance are fixed to the values given in Rolland et al. (2018), and the Ca abundance is varied in steps of 0.5 dex. This grid of model atmospheres and synthetic spectra are used to interpolate a fit to the final abundance by employing a minimization algorithm to find the abundance that yields the best fit to the line.
3.1 G270-124
The Ca K-line feature in G270-124 has two components, an EW = 8 mÅ line with radial velocity of 10 km s-1 and a somewhat stronger Ca K-line of 27 mÅ at a radial velocity of 31 km s-1 (left panel of Figure 4). The larger, more red-shifted component is close to the (photospheric) He5876 line velocity of 36 km s-1, suggesting its origin is likely photospheric, while the weaker component is clearly not photospheric and may be either interstellar or circumstellar (further consideration of these possibilities is beyond the scope of this text and deferred to future work). G270124 is already known to have other heavy elements in its atmosphere from an analysis of FUSE data carried out by Desharnais et al. (2008), where they reported pollution by carbon, silicon and iron, as well as non-photospheric absorption lines of N, C and O. Quoting a relative velocity accuracy for FUSE of 6 km s-1, Desharnais et al. (2008) measured the relative velocity between photospheric and ISM lines to be 36 km s-1. This is larger than the 21.2 km s-1 velocity difference between the two Ca K-lines of our HIRES spectrum, so these relative velocity measurements may or may not be reconcilable, and we conclude that it is uncertain whether the blue-shifted Ca K-line has a similar origin as the N, C, and O blue-shifted ground state lines in the FUSE data. Nonetheless, our derived abundance for calcium from the stronger (atmospheric) Ca K-line is [Ca/He] = -8.08. Comparing that to the Si and Fe abundances from Desharnais et al. (2008) of -7.5 and -7.2, respectively, corresponds to abundance ratios of Ca/Si = 0.26 and Ca/Fe = 0.13 by number, which are well within the range of values observed for a variety of WDs polluted by rocky material (Jura & Young 2014). All these factors taken together, it is highly likely that the stronger K-line detection comes from the WD photosphere along with the other heavy elements.
3.2 GD 85
Sion et al. (1988) previously noted a hint of a Ca K-line feature in GD 85 and placed an upper limit of EW 100 mÅ. Our HIRES data clearly detect the Ca K-line in GD 85 with EW = 504 mÅ, for which we derive an abundance of [Ca/He] = -8.80. The radial velocities of the Ca K-line and He5876 agree to within 2 km -1. Given the radial velocity agreement, together with the moderately strong equivalent width, there is little doubt that GD 85’s Ca K-line originates from the WD’s atmosphere.
3.3 Stars with UV Carbon Detections
At least a quarter of our sample stars have published photospheric carbon absorption in their ultraviolet spectra (identified in Table 2). Six of those also have Ca pollution in addition to other high-Z lines (GD 408, G270-124, GD 40, Ton 345, G200-39, and GD 378, references from Table 1 and Desharnais et al. (2008)). The carbon in these stars likely originates from planetary accretion along with the other heavy elements. In these cases the He5876 core profiles appear to be governed by the overall pollution and H abundances, as discussed in the remainder of the paper.
Five stars have C detected in the UV, but no other high-Z elements, they are: LAWD 74 (= LDS 678B = EGGR 131, Wegner 1981), L791-40 (= LTT 9491, Koester et al. 1982a; Wegner 1983), BPM 17088 (= HE 0308-5635, Petitclerc et al. 2005), GD 190 (Provencal et al. 2000), and GD 358 (Sion et al. 1989). The first two are at the cool end of our sample with 10,500 K, and the last three are at the hot end with = 22,000 25,000 K. The presence of atmospheric carbon in the cool stars is understood as the result of convective dredge-up (Koester et al. 1982b; Pelletier et al. 1986; Dufour et al. 2005), while the origin of carbon in the hot DBs is as yet unclear (e.g. Brassard et al. 2007; Koester et al. 2014b; Dunlap & Clemens 2015; Koester & Kepler 2019). In this special subset of sample stars with only C pollution, the C abundance ranges from 6.5 [C/He] -5.5. Thus, even though these stars do not display Ca or any other heavy elements, their atmospheres do contain a potentially significant abundance of high-Z material. However, we also note that the effective temperatures of this set are all far outside the range (14,000 K 17,500 K) where we see the inversion cores. We consider both of these conditions in Section 5.
We note that some of the stars in Table 1 have been observed with the Cosmic Origins Spectrograph (COS) on the Hubble Space Telescope (HST) under various program IDs. A full analysis of complementary HIRES and COS spectra of stars from HST program ID 13453 (PI: M. Jura) will be treated in a separate paper (Klein et al., in prep). It is possible that future analyses will yield somewhat different elemental abundances than those used here in Table 1, but we note that all anticipated changes will not qualitatively impact the conclusions of the current paper.
| Name | [H/He] | [Ca/He] | He5876 | Inv. EW |
|---|---|---|---|---|
| detected | core | (mÅ) | ||
| G26-10 | 6.49 | 11.1 | inv | 175 17 |
| GD 406 | 6.47 | 10.8 | inv | 194 30 |
| GD 124 | 6.46 | 10.9 | inv | 218 49 |
| G241-6 | 6.43 | 7.25 | abs | |
| GD 325 | 6.37 | 10.6 | inv | 112 23 |
| L 182-61 | 6.32 | 10.3 | inv | 88 9 |
| PG 1144-085 | 6.32 | 10.1 | inv | 115 31 |
| G256-18 | 6.28 | 10.7 | inv | 128 13 |
| PG 1411+219 | 6.26 | 10.8 | inv | 123 27 |
| G26-31 | 6.22 | 8.6 | inv | 49 6 |
| GD 40${\dagger}$${\dagger}$Atmospheric carbon detected in the UV, see Sections 3.3 and 5 | 6.14 | 6.88 | abs | |
| G64-43 | 6.08 | 10.6 | inv | 151 15 |
| GD 85 | 5.99 | 8.80 | inv | 25 9 |
| EGGR 133 | 5.97 | 10.1 | inv | 35 15 |
| GD 408${\dagger}$${\dagger}$Atmospheric carbon detected in the UV, see Sections 3.3 and 5 | 5.95 | 9.59 | inv | 86 9 |
| PG 1644+199 | 5.68 | 10.3 | inv | 77 10 |
| KUV 05034+1445 | 5.46 | 10.7 | inv | 31 9 |
| HE 2334-4127 | 5.34 | 8.9 | abs | |
| GD 303 | 5.34 | 7.8 | abs | |
| G119-47 | 5.33 | 11.9 | abs | |
| L791-40${\dagger}$${\dagger}$Atmospheric carbon detected in the UV, see Sections 3.3 and 5 | 5.27 | 12.0 | abs | |
| LAWD 74${\dagger}$${\dagger}$Atmospheric carbon detected in the UV, see Sections 3.3 and 5 | 5.16 | 12.5 | abs | |
| G270-124${\dagger}$${\dagger}$Atmospheric carbon detected in the UV, see Sections 3.3 and 5 | 5.14 | 8.08 | abs | |
| Ton 345${\dagger}$${\dagger}$Atmospheric carbon detected in the UV, see Sections 3.3 and 5 | 5.10 | 5.95 | abs | |
| GD 190${\dagger}$${\dagger}$Atmospheric carbon detected in the UV, see Sections 3.3 and 5 | 4.84 | 7.6 | abs | |
| EC 12522-2855 | 4.82 | 7.8 | abs | |
| BPM 17088${\dagger}$${\dagger}$Atmospheric carbon detected in the UV, see Sections 3.3 and 5 | 4.82 | 7.8 | abs | |
| PG 1326-037 | 4.81 | 8.0 | abs | |
| LAWD 90 | 4.78 | 9.6 | abs | |
| LP475-242 | 4.68 | 9.2 | inv | 53 16 |
| Feige 4 | 4.63 | 9.1 | abs | |
| PG 2354+159 | 4.59 | 8.1 | abs | |
| GD 358${\dagger}$${\dagger}$Atmospheric carbon detected in the UV, see Sections 3.3 and 5 | 4.58 | 7.7 | abs | |
| GD 378${\dagger}$${\dagger}$Atmospheric carbon detected in the UV, see Sections 3.3 and 5 | 4.45 | 8.35 | abs | |
| GD 243 | 4.35 | 9.1 | abs | |
| G200-39${\dagger}$${\dagger}$Atmospheric carbon detected in the UV, see Sections 3.3 and 5 | 4.26 | 9.3 | abs | |
| WD 1916-362 | 4.22 | 7.6 | abs | |
| GD 61 | 4.21 | 7.9 | abs | |
| HE 0110-5630 | 4.18 | 7.9 | abs | |
| GD 205 | 4.07 | 7.9 | abs |

4 He 5876 line core profiles
He5876 core inversion is present for more than of our DB sample, while a single absorption core is observed for stars with a relatively high abundance of heavy elements and/or hydrogen. Core inversions are not seen in other strong He lines (e.g. He I 4472), which is consistent with our models as shown in Section 5. Intermediate temperature single WDs generally do not exhibit line core emission in their spectra, but an exception is PG 1225079 which displays core emission in its Ca H- & K-lines (Klein et al. 2011). However, those features are most likely a unique detection of chromospheric activity in this WD (Dufour et al. 2012, Section 3.1).
Both when a core inversion is seen and when a single absorption core is seen, the central absorption core is often narrow (Figures 1 and 2). Narrow He5876 absorption cores have been previously noticed in three cool (11,000 K) helium-dominated and heavily-polluted WDs: GD 362, GD 16, and PG 1225079 (Zuckerman et al. 2007; Klein et al. 2011). In hydrogen-dominated atmosphere (DA) white dwarfs, narrow non-LTE cores in H and H have also been observed at high-resolution (Reid 1996; Falcon et al. 2010; Zuckerman et al. 2013). We note, however, that our proposed explanation for the presence of narrow absorption cores in our DB sample does not require non-LTE effects. Rather, it is likely due to the lower density/temperature (and thus reduced broadening) in the upper region of the atmosphere (Rosseland mean optical depth () , see Figures 7 and 8) where the line core is formed.
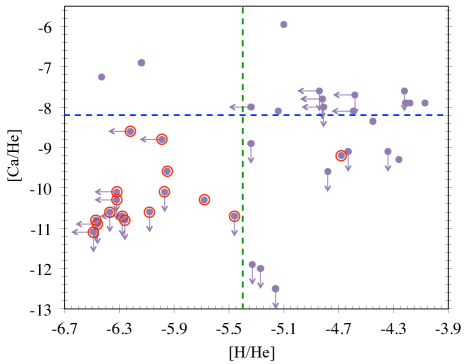
Having assembled the available parameters for the dataset , log , [H/He], [Ca/He] we can examine trends and correlations. Is it the presence of hydrogen, or of high-Z elements, that is responsible for these distinctive core features? We believe it is a combination of the two. We see that in Table 2, which is ordered by increasing [H/He] abundance, there is a transition in the core profile appearance at around [H/He] = 5.4. Stars with [H/He] less than that (above the line in Table 2) nearly all display an inversion core. The exceptions are the two heavily polluted WDs, G241-6 and GD 40, which have [Ca/He] 7.5. Referring to Figure 5, observationally, it appears the criterion for having an inverted He5876 core is an H abundance less than 5.4, as well as a Ca abundance less than 8. We believe this is most likely due to the additional opacity introduced by the hydrogen and pollutants, and these limits are well matched by our model analysis in Section 5.
Examination of the set of spectra with inverted He5876 cores reveals a range in the degree of prominence of the emission feature. We parameterize the strength of the inversion by measuring the EW of the emission feature as follows: We chose the “continuum” to be set by the feature endpoints as the lowest points on the blue and red wings of the line core profile (ignoring the self-reversed central dip which in a few cases is somewhat lower than the minimum of the line wings). Relative to that baseline, we use IRAF’s splot “e” mode to measure the EW, which is calculated from the summed flux of the pixels between the feature endpoints above the baseline. For each star, we performed the measurement three times for a varied choice of continuum endpoints according to variations in the noise, and then estimated an uncertainty from the standard deviation of those separate measurements. We also tried extracting EWs by Voigt fitting the two emission peaks (using IRAF splot “d” mode), which returned reasonable fits. But it is more challenging to get a total EW from that since the fit functions overlap. Values for the EWs from the splot “e” flux summing method are listed in Table 2. As shown in Figure 6, the strength of the core emission decreases as the total number abundance of hydrogen increases, in excellent agreement with the model predictions shown in Figure 7.
A note about the outlier from Table 2 and Figure 5, LP 475242 (which happens to be a Hyades member), that displays a self-reversed emission core despite its relatively high hydrogen abundance (). We considered that one possible explanation could be that the source is a double degenerate, such that most or all the hydrogen line absorption does not come from the dominant DB atmosphere. Following Bédard et al. (2017), we performed a variety of spectroscopic fits using either DB(A)+DA or DBA+DB(A) composite models, but we found that either the fits to the H or He lines are poor, and/or the overall flux is inconsistent with photometry. The result is that a double degenerate solution appears unlikely, as the source is always better fit with a single DBA model. This agrees with the lack of radial velocity variations over three epochs of Keck/HIRES observations, which are all broadly consistent with a radial velocity of km s-1 (Reid 1996; Zuckerman et al. 2013, plus one unpublished epoch PI Jura).
5 MODEL ATMOSPHERE ANALYSIS
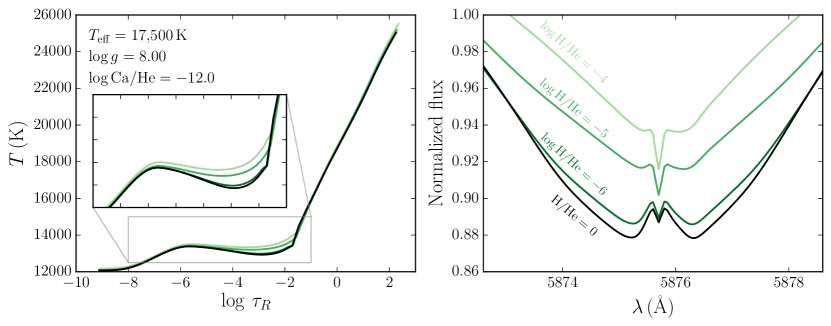
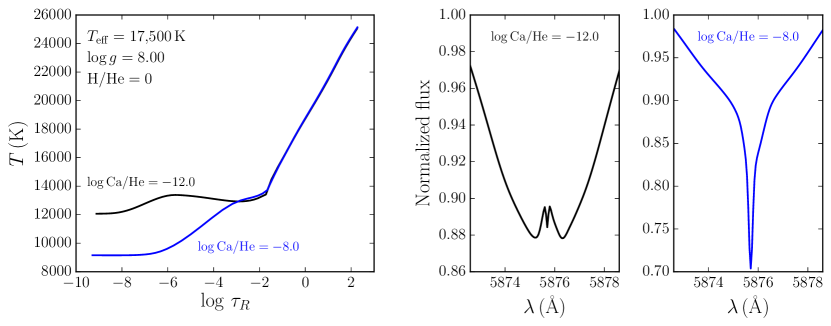
We now attempt to explain the distinctive He5876 core profiles described in the previous section with detailed model atmospheres. Using the atmosphere code described in Dufour et al. (2007) and Bergeron et al. (2011), we computed a grid of DB(AZ) models to investigate whether the core inversion profile can be seen in synthetic spectra. Our grid extends from K to K and includes abundance ratios of 0, , and , and abundance ratios of 0, , and . The model atmospheres extend from all the way to , which is important to properly capture the emission/absorption in the core region of He5876. We found that for K and pure helium atmospheres, synthetic spectra do display a self-reversed emission structure similar to that described above, resulting from a double inversion in the temperature profile (i.e. ) that coincides with the He5876 line-forming region. The temperature inversion and the resulting emission structure remain visible if the atmosphere contains a small quantity of H. However, the emission structure slowly disappears as the H/He abundance ratio is increased (Figure 7). This is in excellent agreement with the observed relationship between the strength of the inversion feature and the level of H (Figure 6). Similarly, the emission structure is still visible if a small quantity of high-Z material is added to the atmosphere model, but disappears if the atmosphere is heavily polluted (Figure 8). We found that these transitions are due to the feedback of the additional hydrogen and/or high-Z lines’ opacity on the temperature profile. Overall, the models predict many features that are consistent with the observations:
-
•
The shape of the emission feature is similar to that observed, with a 2 Å width in wavelength scale. This indicates that the temperature inversions occur at the correct optical depths, as the width of the emission structure is determined by the broadening of He5876 in those regions.
- •
- •
-
•
The emission structure gives way to a single absorption core if the atmosphere is heavily polluted with high-Z material (Figure 8), also consistent with the trend identified in Table 2 and Figure 5. This transition is due to the disappearance of the emission core following the inhibition of the temperature inversions.
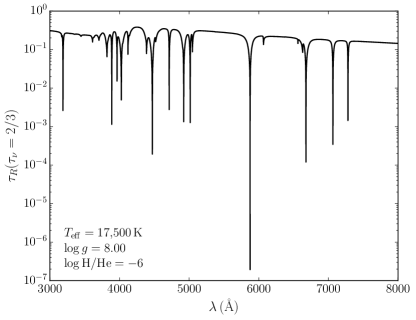
Moreover, our models can explain why only He5876 shows a self-reversed emission core (and not other He lines such as He I 4472). Figure 9 shows the Rosseland mean optical depth at as a function of . This type of figure is useful to visualize which atmospheric layers are probed at different wavelengths. In this case, it shows that only He5876 has a core formed high enough in the atmosphere to probe the double inversion in the temperature structure around . The cores of all other He lines are formed deeper in the atmosphere and are thus not affected by the double inversion, which explains the nondetection of self-reversed emission cores for those lines.
Since all five objects for which only C was detected in the UV have an absorption core for He5876 (see Section 3.3 and Table 2), we also checked how C pollution alone affects the emission feature. We found that the temperature inversion and the emission feature do disappear for models polluted by C, but the level of pollution required for the complete disappearance of the emission feature exceeds that measured in the five C-polluted stars of our sample. However, the effective temperatures of those objects are well below or above the temperature range where the self-reversed emission feature is observed (Table 1). This suggests that it is their temperature and not the C pollution that explains their He5876 core shape.
However, two major issues remain: (1) we do not see the core emission profile for models cooler than 17,000 K, while observations show that it exists down to 14,500 K and (2) the models underestimate the amplitude of the emission features. The temperature structures of cooler models do contain a temperature inversion similar to that shown in Figures 7 and 8, but its location does not coincide with the He5876 line-forming region. A key piece of missing physics in our models that could be at the origin of these problems is the 3D treatment of convection (e.g., Tremblay et al. 2013). Our code uses the simplistic mixing length theory (ML2/=1.25, Bergeron et al. 2011). Compared to this prescription of convection, an accurate 3D treatment can lead to important changes in the temperature structure (for DB models, see Figure 4 of Cukanovaite et al. 2018). This could affect the location and/or strength of the temperature inversions and potentially resolve the temperature and emission strength discrepancies identified above. In that sense, the self-reversed emission core could prove to be a powerful diagnostic tool to calibrate the temperature structure of DB atmosphere models.
Another missing piece of physics is non-LTE effects, which can be particularly important in the upper atmosphere. The inclusion of non-LTE effects in hot WDs (25,000 K) has been shown to have significant impact on the line profiles and temperature scales (e.g. Napiwotzki 1997; Hubeny et al. 1999). Thus it is possible that departures from LTE could be responsible for a shifted temperature scale and/or core emission strength, however it is unclear how big this effect can be in the cooler range 10,000 K 25,000 K of our sample.
5.1 Stratified models
As most stars that show a self-reversed emission core have mixed H/He atmospheres, we now investigate whether chemical stratification previously not included in our atmosphere models mentioned just above could help solve the temperature discrepancy. Mixed H/He white dwarf atmospheres are expected to be chemically stratified, with a thin H layer floating in diffusive equilibrium above the He envelope (Jordan & Koester 1986; Vennes & Fontaine 1992; Manseau et al. 2016). Diffusive equilibrium can safely be assumed as the diffusion timescale is much smaller than the white dwarf cooling time. To investigate whether this stratification could play a role in the emission structure observed for He I 5876, we modified our atmosphere code to include the stratification of H/He. To do so, we assume a constant H/He ratio in the convective layers of the atmosphere models and we impose diffusive equilibrium for the radiative layers. The diffusion equilibrium profile is obtained from Equation 5 of Pelletier et al. (1986), which gives the relative diffusion velocity of two species with different atomic masses and average charges (see also Vennes et al. 1988, Equation 1). This diffusion equation includes the contributions of the concentration gradient, gravity and the electric field.444Note that both thermal diffusion (Paquette et al. 1986) and radiative forces (Fontaine & Michaud 1979; Chayer et al. 1995) can be safely neglected for the objects considered in this work. Assuming diffusive equilibrium, we obtain,
| (1) |
where , , is the proton mass, is the surface gravity, is the Boltzmann constant and is the ionic pressure (). Equation 1 is solved for at every iteration of the temperature correction procedure (for details on how to solve Equation 1, see Genest-Beaulieu 2019, Appendix A), so that a self-consistent structure is obtained once the model has converged.
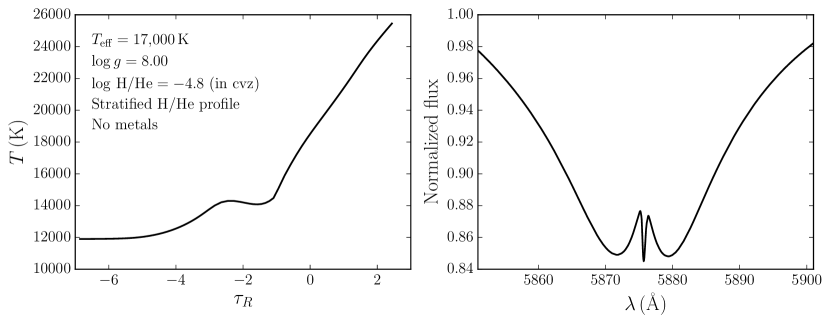
We computed a grid of models with effective temperatures ranging from K to K and H/He abundances in the convection zone (cvz) from to . We find that for a narrow domain of atmospheric parameters ([H/He] and ) a double inversion appears in the temperature structure and leads to the formation of a self-reversed emission core for He I 5876 (an example of such a model is shown in Figure 10). We conclude that including chemical stratification in our models does not lead to a better agreement with the observations:
-
•
We are still unable to obtain an emission profile for stars between 14,500 and 16,500 K.
-
•
The hydrogen abundance needed to see an emission profile is not compatible with the observations. We find that we need [H/He] in the convection zone, which means even more H at the photosphere and in the line-forming region of the atmosphere. This leads to H profiles that are much stronger than those observed in our sample and opposes the [H/He] trend of Table 2.
-
•
The shape of the emission profile obtained from our stratified models is much wider () than what is actually observed ().
-
•
Over the range of and [H/He]) where a self-reversed emission core is predicted for He5876, the stratified models also predict emission in the He I 4472 line core, but that is not observed in any of our sample data.
Overall, it seems that chemical stratification is not the solution we are looking for. However, we refrain from completely ruling out stratification as an explanation for these observations, since our H/He stratification profiles could be off due to the fact that we do not include 3D effects. In particular, we neglect convective overshoot, which means that we underestimate the height that the convective eddies can reach. This necessarily implies that our chemical stratification profile is different from reality (overshoot would extend the region of the atmosphere where chemical homogeneity is assumed), although it is not clear by how much.
6 CONCLUSIONS
The analysis of a brightness-selected sample of DB WDs observed at high-resolution demonstrates a correspondence between the hydrogen abundance and the degree of atmospheric pollution by heavy elements with the formation of the He I 5876 line core. Our model atmospheres go a long way in explaining this phenomenon as due to the presence, or suppression, of temperature inversions in the upper atmosphere, however the effective temperature range for the phenomenon and strength of the emission are not well matched. This may be due to potentially important physical mechanisms that are not included in our current models, i.e. the effects of 3D atmosphere calculations, convective overshoot, and/or non-LTE effects, which may change the temperature structure and/or the H/He stratification. In view of these considerations, a direct comparison of models with observations remains an aim of future work. In any event, the He5876 core profile structure appears to be a new and powerful diagnostic tool for the calibration of temperature profiles in DB atmospheres, providing a useful check for how closely a given WD atmosphere model resembles reality. Since WD models are fundamental for deriving abundances of accreted exoplanets in polluted WDs, this calibration tool may also have implications for exoplanetary studies.
7 ACKNOWLEDGEMENTS
We thank the anonymous referee for useful suggestions that improved the manuscript. We are also thankful for helpful conversations with Boris Gänsicke and Detlev Koester that have led to clarifications and improvements. This work has been supported by grants from NASA and the NSF to UCLA. B.K. acknowledges support from the APS M. Hildred Blewett Fellowship, S.B. acknowledges support from the Laboratory Directed Research and Development program of Los Alamos National Laboratory under project number 20190624PRD2. D.R. acknowledges support from the UCLA-SRI summer program for undergraduate research. S.X. is supported by the international Gemini Observatory, a program of NSF’s NOIRLab, which is managed by the Association of Universities for Research in Astronomy (AURA) under a cooperative agreement with the National Science Foundation, on behalf of the Gemini partnership of Argentina, Brazil, Canada, Chile, the Republic of Korea, and the United States of America. The majority of the data presented herein were obtained at the W.M. Keck Observatory, which is operated as a scientific partnership among the California Institute of Technology, the University of California and the National Aeronautics and Space Administration. The Observatory was made possible by the generous financial support of the W.M. Keck Foundation. We recognize and acknowledge the very significant cultural role and reverence that the summit of Mauna Kea has always had within the indigenous Hawaiian community. We are most fortunate to have the opportunity to conduct observations from this mountain. Additionally, some of the data are based on observations collected at the European Southern Observatory under ESO programme 165.H-0588. This research has made use of the services of the ESO Science Archive Facility, SIMBAD, SAO/NASA ADS, the Montreal White Dwarf Database, IRAF, Python, Matplotlib.
References
- Allard et al. (2020) Allard, N. F., Kielkopf, J. F., Xu, S., Guillon, G., Mehnen, B., Linguerri, R., Al Mogren, M. M., Hochlaf, M., & Hubeny, I. 2020, MNRAS, 494, 868
- Bauer & Bildsten (2018) Bauer, E. B. & Bildsten, L. 2018, ApJ, 859, L19
- Beauchamp et al. (1996) Beauchamp, A., Wesemael, F., Bergeron, P., Liebert, J., & Saffer, R. A. 1996, in Astronomical Society of the Pacific Conference Series, Vol. 96, Hydrogen Deficient Stars, ed. C. S. Jeffery & U. Heber (San Francisco: Astronomical Society of the Pacific (ASP)), 295
- Bédard et al. (2017) Bédard, A., Bergeron, P., & Fontaine, G. 2017, ApJ, 848, 11
- Bergeron et al. (2019) Bergeron, P., Dufour, P., Fontaine, G., Coutu, S., Blouin, S., Genest-Beaulieu, C., Bédard, A., & Rolland, B. 2019, The Astrophysical Journal, 876, 67
- Bergeron et al. (1997) Bergeron, P., Ruiz, M. T., & Leggett, S. K. 1997, ApJS, 108, 339
- Bergeron et al. (2011) Bergeron, P., Wesemael, F., Dufour, P., Beauchamp, A., Hunter, C., Saffer, R. A., Gianninas, A., Ruiz, M. T., Limoges, M.-M., Dufour, P., Fontaine, G., & Liebert, J. 2011, ApJ, 737, 28
- Blouin et al. (2018a) Blouin, S., Dufour, P., & Allard, N. F. 2018a, The Astrophysical Journal, 863, 184
- Blouin et al. (2018b) Blouin, S., Dufour, P., Allard, N. F., & Kilic, M. 2018b, The Astrophysical Journal, 867, 161
- Brassard et al. (2007) Brassard, P., Fontaine, G., Dufour, P., & Bergeron, P. 2007, in Astronomical Society of the Pacific Conference Series, Vol. 372, 15th European Workshop on White Dwarfs, ed. R. Napiwotzki & M. R. Burleigh, 19
- Chayer et al. (1995) Chayer, P., Fontaine, G., & Wesemael, F. 1995, ApJS, 99, 189
- Coutu et al. (2019) Coutu, S., Dufour, P., Bergeron, P., Blouin, S., Loranger, E., Allard, N. F., & Dunlap, B. H. 2019, arXiv e-prints, arXiv:1907.05932
- Cukanovaite et al. (2018) Cukanovaite, E., Tremblay, P. E., Freytag, B., Ludwig, H. G., & Bergeron, P. 2018, Monthly Notices of the Royal Astronomical Society, 481, 1522
- Cunningham et al. (2019) Cunningham, T., Tremblay, P.-E., Freytag, B., Ludwig, H.-G., & Koester, D. 2019, MNRAS, 488, 2503
- Deal et al. (2013) Deal, M., Deheuvels, S., Vauclair, G., Vauclair, S., & Wachlin, F. C. 2013, A&A, 557, L12
- Desharnais et al. (2008) Desharnais, S., Wesemael, F., Chayer, P., Kruk, J. W., & Saffer, R. A. 2008, ApJ, 672, 540
- Dufour et al. (2005) Dufour, P., Bergeron, P., & Fontaine, G. 2005, ApJ, 627, 404
- Dufour et al. (2007) Dufour, P., Bergeron, P., Liebert, J., Harris, H. C., Knapp, G. R., Anderson, S. F., Hall, P. B., Strauss, M. A., Collinge, M. J., & Edwards, M. C. 2007, ApJ, 663, 1291
- Dufour et al. (2017) Dufour, P., Blouin, S., Coutu, S., Fortin-Archambault, M., Thibeault, C., Bergeron, P., & Fontaine, G. 2017, in Astronomical Society of the Pacific Conference Series, Vol. 509, 20th European White Dwarf Workshop, ed. P.-E. Tremblay, B. Gaensicke, & T. Marsh, 3
- Dufour et al. (2010) Dufour, P., Kilic, M., Fontaine, G., Bergeron, P., Lachapelle, F., Kleinman, S. J., & Leggett, S. K. 2010, ApJ, 719, 803
- Dufour et al. (2012) Dufour, P., Kilic, M., Fontaine, G., Bergeron, P., Melis, C., & Bochanski, J. 2012, ApJ, 749, 6
- Dunlap & Clemens (2015) Dunlap, B. H. & Clemens, J. C. 2015, in Astronomical Society of the Pacific Conference Series, Vol. 493, 19th European Workshop on White Dwarfs, ed. P. Dufour, P. Bergeron, & G. Fontaine, 547
- Eisenstein et al. (2006) Eisenstein, D. J., Liebert, J., Harris, H. C., Kleinman, S. J., Nitta, A., Silvestri, N., Anderson, S. A., Barentine, J. C., Brewington, H. J., Brinkmann, J., Harvanek, M., Krzesiński, J., Neilsen, Jr., E. H., Long, D., Schneider, D. P., & Snedden, S. A. 2006, ApJS, 167, 40
- Falcon et al. (2010) Falcon, R. E., Winget, D. E., Montgomery, M. H., & Williams, K. A. 2010, ApJ, 712, 585
- Farihi (2016) Farihi, J. 2016, New A Rev., 71, 9
- Farihi et al. (2011) Farihi, J., Brinkworth, C. S., Gänsicke, B. T., Marsh, T. R., Girven, J., Hoard, D. W., Klein, B., & Koester, D. 2011, ApJ, 728, L8+
- Farihi et al. (2013) Farihi, J., Gänsicke, B. T., & Koester, D. 2013, Science, 342, 218
- Fontaine & Michaud (1979) Fontaine, G. & Michaud, G. 1979, The Astrophysical Journal, 231, 826
- Frewen & Hansen (2014) Frewen, S. F. N. & Hansen, B. M. S. 2014, MNRAS, 439, 2442
- Gaia Collaboration et al. (2016) Gaia Collaboration, Prusti, T., de Bruijne, J. H. J., & et al. 2016, A&A, 595, A1
- Gänsicke et al. (2012) Gänsicke, B. T., Koester, D., Farihi, J., & et al. 2012, MNRAS, 424, 333
- Gänsicke et al. (2018) Gänsicke, B. T., Koester, D., Farihi, J., & Toloza, O. 2018, MNRAS, 481, 4323
- Gänsicke et al. (2008) Gänsicke, B. T., Koester, D., Marsh, T. R., Rebassa-Mansergas, A., & Southworth, J. 2008, MNRAS, 391, L103
- Genest-Beaulieu (2019) Genest-Beaulieu, C. 2019, PhD thesis, Université de Montréal, Montréal, QC
- Genest-Beaulieu & Bergeron (2019) Genest-Beaulieu, C. & Bergeron, P. 2019, ApJ, 882, 106
- Gentile Fusillo et al. (2017) Gentile Fusillo, N. P., Gänsicke, B. T., Farihi, J., Koester, D., Schreiber, M. R., & Pala, A. F. 2017, MNRAS, 468, 971
- Gentile Fusillo et al. (2019) Gentile Fusillo, N. P., Tremblay, P.-E., Gänsicke, B. T., Manser, C. J., Cunningham, T., Cukanovaite, E., Hollands, M., Marsh, T., Raddi, R., Jordan, S., Toonen, S., Geier, S., Barstow, M., & Cummings, J. D. 2019, MNRAS, 482, 4570
- Hubeny et al. (1999) Hubeny, I., Barstow, M. A., Lanz, T., & Holberg, J. B. 1999, in Astronomical Society of the Pacific Conference Series, Vol. 169, 11th European Workshop on White Dwarfs, ed. S. E. Solheim & E. G. Meistas, 445
- Jordan & Koester (1986) Jordan, S. & Koester, D. 1986, A&AS, 65, 367
- Jura et al. (2015) Jura, M., Dufour, P., Xu, S., Zuckerman, B., Klein, B., Young, E. D., & Melis, C. 2015, ApJ, 799, 109
- Jura et al. (2012) Jura, M., Xu, S., Klein, B., Koester, D., & Zuckerman, B. 2012, ApJ, 750, 69
- Jura & Young (2014) Jura, M. & Young, E. D. 2014, Ann. Rev. Earth Planet. Sci., vol. 42, in press
- Kenyon et al. (1988) Kenyon, S. J., Shipman, H. L., Sion, E. M., & Aannestad, P. A. 1988, ApJ, 328, L65
- Klein et al. (2011) Klein, B., Jura, M., Koester, D., & Zuckerman, B. 2011, ApJ, 741, 64
- Klein et al. (2010) Klein, B., Jura, M., Koester, D., Zuckerman, B., & Melis, C. 2010, ApJ, 709, 950
- Koester (2015) Koester, D. 2015, in Astronomical Society of the Pacific Conference Series, Vol. 493, 19th European Workshop on White Dwarfs, ed. P. Dufour, P. Bergeron, & G. Fontaine, 129
- Koester et al. (2014a) Koester, D., Gänsicke, B. T., & Farihi, J. 2014a, A&A, 566, A34
- Koester & Kepler (2015) Koester, D. & Kepler, S. O. 2015, A&A, 583, A86
- Koester & Kepler (2019) —. 2019, A&A, 628, A102
- Koester et al. (2014b) Koester, D., Provencal, J., & Gänsicke, B. T. 2014b, A&A, 568, A118
- Koester et al. (2005) Koester, D., Rollenhagen, K., Napiwotzki, R., & et al. 2005, A&A, 432, 1025
- Koester et al. (1981) Koester, D., Schulz, H., & Wegner, G. 1981, A&A, 102, 331
- Koester et al. (1982a) Koester, D., Vauclair, G., Weidemann, V., Zeidler, K. T., & Zeidler, E. M. 1982a, A&A, 113, L13
- Koester et al. (1982b) Koester, D., Weidemann, V., & Zeidler, E.-M. 1982b, A&A, 116, 147
- Kupka et al. (2018) Kupka, F., Zaussinger, F., & Montgomery, M. H. 2018, MNRAS, 474, 4660
- Lodders (2003) Lodders, K. 2003, ApJ, 591, 1220
- Luyten (1952) Luyten, W. J. 1952, ApJ, 116, 283
- MacDonald & Vennes (1991) MacDonald, J. & Vennes, S. 1991, ApJ, 371, 719
- Manseau et al. (2016) Manseau, P. M., Bergeron, P., & Green, E. M. 2016, ApJ, 833, 127
- Melis & Dufour (2017) Melis, C. & Dufour, P. 2017, ApJ, 834, 1
- Melis et al. (2011) Melis, C., Farihi, J., Dufour, P., Zuckerman, B., Burgasser, A. J., Bergeron, P., Bochanski, J., & Simcoe, R. 2011, ApJ, 732, 90
- Mustill et al. (2014) Mustill, A. J., Veras, D., & Villaver, E. 2014, MNRAS, 437, 1404
- Mustill et al. (2018) Mustill, A. J., Villaver, E., Veras, D., Gänsicke, B. T., & Bonsor, A. 2018, MNRAS, 476, 3939
- Napiwotzki (1997) Napiwotzki, R. 1997, A&A, 322, 256
- Napiwotzki et al. (2001) Napiwotzki, R., Christlieb, N., Drechsel, H., Hagen, H. J., Heber, U., Homeier, D., Karl, C., Koester, D., Leibundgut, B., Marsh, T. R., Moehler, S., Nelemans, G., Pauli, E. M., Reimers, D., Renzini, A., & Yungelson, L. 2001, Astronomische Nachrichten, 322, 411
- Paquette et al. (1986) Paquette, C., Pelletier, C., Fontaine, G., & Michaud, G. 1986, ApJS, 61, 197
- Pelletier et al. (1986) Pelletier, C., Fontaine, G., Wesemael, F., Michaud, G., & Wegner, G. 1986, ApJ, 307, 242
- Petitclerc et al. (2005) Petitclerc, N., Wesemael, F., Kruk, J. W., Chayer, P., & Billères, M. 2005, ApJ, 624, 317
- Provencal et al. (2000) Provencal, J. L., Shipman, H. L., Thejll, P., & Vennes, S. 2000, ApJ, 542, 1041
- Raddi et al. (2015) Raddi, R., Gänsicke, B. T., Koester, D., Farihi, J., Hermes, J. J., Scaringi, S., Breedt, E., & Girven, J. 2015, MNRAS, 450, 2083
- Reid (1996) Reid, I. N. 1996, AJ, 111, 2000
- Rolland et al. (2018) Rolland, B., Bergeron, P., & Fontaine, G. 2018, ApJ, 857, 56
- Rolland et al. (2020) —. 2020, ApJ, 889, 87
- Sion et al. (1988) Sion, E. M., Aannestad, P. A., & Kenyon, S. J. 1988, ApJ, 330, L55
- Sion et al. (1983) Sion, E. M., Greenstein, J. L., Landstreet, J. D., Liebert, J., Shipman, H. L., & Wegner, G. A. 1983, ApJ, 269, 253
- Sion et al. (1989) Sion, E. M., Liebert, J., Vauclair, G., & Wegner, G. 1989, in IAU Colloq. 114: White Dwarfs, ed. G. Wegner, Vol. 328, 354
- Tody (1986) Tody, D. 1986, in Society of Photo-Optical Instrumentation Engineers (SPIE) Conference Series, Vol. 627, Proc. SPIE, ed. D. L. Crawford, 733
- Tremblay et al. (2019) Tremblay, P. E., Cukanovaite, E., Gentile Fusillo, N. P., Cunningham, T., & Hollands, M. A. 2019, MNRAS, 482, 5222
- Tremblay et al. (2017) Tremblay, P. E., Ludwig, H. G., Freytag, B., Koester, D., & Fontaine, G. 2017, Mem. Soc. Astron. Italiana, 88, 104
- Tremblay et al. (2013) Tremblay, P. E., Ludwig, H. G., Steffen, M., & Freytag, B. 2013, Astronomy and Astrophysics, 559, A104
- Vennes & Fontaine (1992) Vennes, S. & Fontaine, G. 1992, ApJ, 401, 288
- Vennes et al. (2010) Vennes, S., Kawka, A., & Németh, P. 2010, MNRAS, 404, L40
- Vennes et al. (2011) —. 2011, MNRAS, 300
- Vennes et al. (1988) Vennes, S., Pelletier, C., Fontaine, G., & Wesemael, F. 1988, The Astrophysical Journal, 331, 876
- Veras (2016) Veras, D. 2016, Royal Society Open Science, 3, 150571
- Veras et al. (2013) Veras, D., Mustill, A. J., Bonsor, A., & Wyatt, M. C. 2013, MNRAS, 431, 1686
- Veras et al. (2014) Veras, D., Shannon, A., & Gänsicke, B. T. 2014, MNRAS, 445, 4175
- Vogt et al. (1994) Vogt, S. S., Allen, S. L., Bigelow, B. C., & et al. 1994, in Proc. SPIE, Vol. 2198, Instrumentation in Astronomy VIII, ed. D. L. Crawford & E. R. Craine, 362
- Voss et al. (2007) Voss, B., Koester, D., Napiwotzki, R., Christlieb, N., & Reimers, D. 2007, A&A, 470, 1079
- Wegner (1981) Wegner, G. 1981, ApJ, 245, L27
- Wegner (1983) —. 1983, ApJ, 268, 282
- Wilson et al. (2015) Wilson, D. J., Gänsicke, B. T., Koester, D., Toloza, O., Pala, A. F., Breedt, E., & Parsons, S. G. 2015, MNRAS, 451, 3237
- Xu et al. (2019) Xu, S., Dufour, P., Klein, B., Melis, C., Monson, N. N., Zuckerman, B., Young, E. D., & Jura, M. A. 2019, AJ, 158, 242
- Xu et al. (2017) Xu, S., Zuckerman, B., Dufour, P., Young, E. D., Klein, B., & Jura, M. 2017, ApJ, 836, L7
- Zuckerman et al. (2007) Zuckerman, B., Koester, D., Melis, C., Hansen, B. M., & Jura, M. 2007, ApJ, 671, 872
- Zuckerman et al. (2010) Zuckerman, B., Melis, C., Klein, B., Koester, D., & Jura, M. 2010, ApJ, 722, 725
- Zuckerman et al. (2013) Zuckerman, B., Xu, S., Klein, B., & Jura, M. 2013, ApJ, 770, 140
- Zuckerman & Young (2018) Zuckerman, B. & Young, E. D. 2018, Characterizing the Chemistry of Planetary Materials Around White Dwarf Stars (Springer International Publishing AG, part of Springer Nature), 14