The ENUBET positron tagger prototype: construction and testbeam performance
Abstract
A prototype for the instrumented decay tunnel of ENUBET was tested in 2018 at the CERN East Area facility with charged particles up to 5 GeV. This detector is a longitudinal sampling calorimeter with lateral scintillation light readout. The calorimeter was equipped by an additional “-layer” for timing and photon discrimination. The performance of this detector in terms of electron energy resolution, linearity, response to muons and hadron showers are presented in this paper and compared with simulation. The -layer was studied both in standalone mode using pion charge exchange and in combined mode with the calorimeter to assess the light yield and the 1 mip/2 mip separation capability. We demonstrate that this system fulfills the requirements for neutrino physics applications and discuss performance and additional improvements.
1 Introduction
Monitored neutrino beams [1] are highly controlled sources of neutrinos at the GeV scale. They represent the ideal facilities for a new generation of experiments to measure neutrino cross sections of relevance for oscillation studies at per cent level. In particular, the ERC ENUBET project [2, 3, 4] is aimed at designing the first monitored beam tagging large angle positrons from the three body decay of charged kaons () and thus providing a pure source of where the flux is measured with a precision of %. One of the key challenges of ENUBET is to devise a compact, radiation-hard, efficient and cost-effective instrumentation for the decay tunnel, whose requirements are detailed in Sec. 2. The ENUBET “positron tagger” must be capable to identify electrons and muons in the neutrino decay tunnel located after a narrow band secondary transfer line. In 2017-2018 we demonstrated that the ENUBET requirements can be achieved using an iron-scintillator calorimeter whose basic unit is an Ultra Compact Module (UCM) sampling e.m. and hadronic showers every 4.3 radiation lengths () or, equivalently, 0.45 interaction lengths () [15]. Scintillation light produced by five 0.5 cm thick tiles is transported by wavelength-shifter (WLS) fibers crossing the 1.5 cm thick iron tiles (”shashlik” light readout [16, 17, 18]) toward 1 mm2 Silicon Photomultipliers (SiPMs) located in the back of the module and, hence, embedded in the bulk of the calorimeter. Irradiation tests [19] performed in 2018 demonstrate that the most critical component of the UCM are the SiPMs, which are exposed to fast neutrons produced by hadronic showers. The ENUBET UCMs are able to stand up to n/cm2, which is sufficient for cross section measurements with a statistical uncertainty of 1% employing neutrino detectors of the same size of ICARUS at Fermilab [20] or the ProtoDUNEs at CERN [21, 22]. The UCM, however, has two drawbacks: SiPMs are inaccessible for maintenance during data taking and fluxes exceeding n/cm2 may compromise the sensitivity of the UCM to muons if data taking is significantly extended or the average beam power is increased well above the ENUBET baseline design.
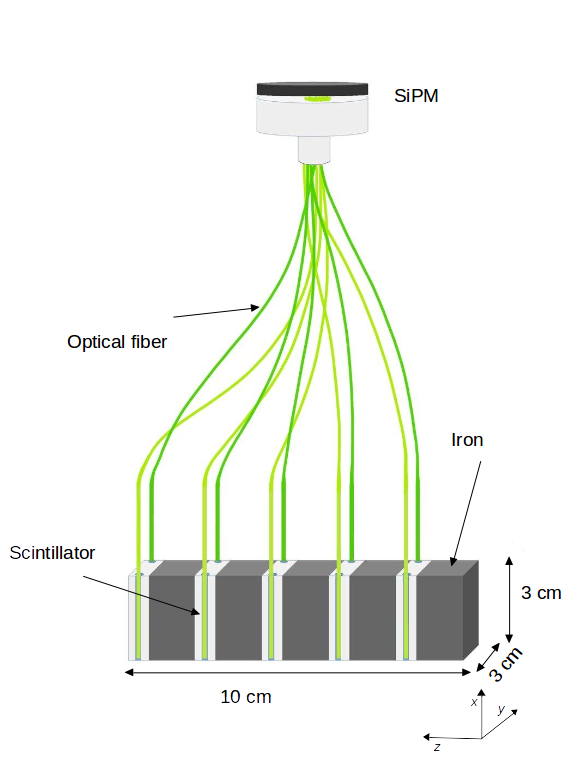
The tolerable beam power can be increased by a factor of about 18 (see Sec. 4) positioning the SiPMs above the calorimeter and on top of a 30 cm Borated polyehtylene shield and transporting the light from the module to the top of the detector by WLS fibers running along one of the lateral side of the tiles. This setup replaces the shashlik-based UCM with a lateral readout compact module (LCM) where the light of all fibers belonging to a module is recorded by a single mm2 SiPM. The number of SiPMs is thus equal to the number of modules and they can be accessed during data taking from the outer part of the decay tunnel. The drawback of this setup is an increased complexity in mechanical installation and a slight reduction of the light yield due to the longer fiber length.
These challenges were addressed by ENUBET in 2018-2019 by constructing a prototype calorimeter whose size is similar to the UCM-based detector [15] but it is assembled from LCMs. In addition, this prototype was equipped with a -layer built with a technology very similar to the LCM: tile doublets of plastic scintillator laterally readout by WLS fibers that are connected to the SiPMs. In this paper, we describe the design and construction of the lateral readout calorimeter (Sec. 3.1) and the -layer (Sec. 3.2). The positron tagger, i.e. the calorimeter equipped with the -layer, was tested at the CERN East Experimental Area in fall 2018 (see Sec. 5): we show the performance of the detector in a mixed beam of electrons, muons and hadrons in the energy range of interest for monitored neutrino beams in Sec. 6, 7 and 8. The performances of the -layer are detailed in Sec. 9.
2 Requirements
ENUBET will provide the most sophisticated diagnostics ever conceived for neutrino beams to control the and neutrino flux at source. This is motivated by the uncertainties on the neutrino cross sections at the GeV scale that limit the physics reach of future neutrino oscillation experiments (in particular, DUNE and Hyper-Kamiokande). In previous neutrino cross-section experiments, the measurement systematics are completely dominated by the uncertainties on the flux, which will be overcome by ENUBET.
For a transfer line selecting kaons at 8.5 GeV/c, like the one envisaged for ENUBET, the positrons from reaching the instrumented walls of the tunnel at 1 m from the beam axis span an energy range between 1 and 3 GeV. The mean energy of the positron is 1.6 GeV and the mean angle is 125 mrad. Since the positrons produced per spill exceed , statistical error is always negligible and we aim at recording a (prescaled) subsample of minimum bias events for monitoring purposes. The main background consists of charged pions from the other decay modes of the kaons and from the off-momentum beam halo transported at the entrance of the tunnel. In addition, the instrumentation must be able to suppress muons from decays along the beamline (halo muons) and photons from tertiary e.m. showers and . An overall positron efficiency of 20% or more with a signal-to-noise ratio is sufficient to predict the flux at per-cent level. The instrumentation must be cost-effective and reliable and should be placed around the wall of the decay tunnel covering a significant fraction of this 40 m long tunnel. Sampling calorimeter with longitudinal segmentation read out by WLS fibers and compact solid-state photosensors fulfill these requirements and represent the technology of choice for ENUBET. A full simulation of the ENUBET beamline performed in 2016-2020 [5, 6] indicates that an appropriate separation can be achieved by longitudinally segmented sampling calorimeters with an e.m. energy resolution in the range of interest for ENUBET (1-3 GeV). Charged pions are separated by positrons (or background electrons) employing the energy deposition pattern in the longitudinal modules of the calorimeter. Positron identification has been simulated starting from particles transported by the ENUBET beamline at the entrance of the decay tunnel. The ENUBET GEANT4 simulation includes particle tracking and detector response and the full particle identification (PID) chain from the event builder to the positron identification. The PID is based on a Multivariate Data Analysis (TMVA) [7, 8] that employs 13 variables constructed from the energy deposit in each module. The latest results provide a signal-to-noise ratio of 1.6 for a positron efficiency222including the geometrical acceptance that amounts to 53% of 24% using the calorimeter described in this paper.
The particles impinge in the calorimeter from the innermost part of the tunnel in an angular range between 10 and 200 mrad and the simulation accounts for energy losses due to albedo, i.e. parts of the shower that bounce back into the tunnel. The average particle rate in the calorimeter along the tunnel length is 600 kHz and is dominated by kaon decay products and muons from the beam halo. Pile-up suppression requires a recovery time of about 20 ns which is achieved both by fast recovery devices and by the analysis of the SiPM waveform recorded during the spill. The ENUBET analysis includes pile-up effects simulated through GEANT4 [10, 11, 12] by the time distribution of the particles entering the decay tunnel. The response of the SiPM is simulated at hardware level using GosSiP [9] and dedicated algorithms to further disentangling pile-up are being developed.
Longitudinal segmentation does not provide separation between positrons and photons. Photons originate from showers produced in the transfer line and from decays that produce neutral pions (in particular decays). The positron tagger (see Fig. 1) must hence include a photon veto, which also provides the timing of the event (“-layer”). The -layer must provide absolute timing of the events with a precision ns, an efficiency for a single minimum ionizing particle (mip) % and 1 mip/2 mip discrimination capability to reject the small fraction of photons that converts inside a tile of the photon veto.
Finally, the ENUBET instrumentation must be radiation tolerant both for ionizing and non ionizing doses. Doses depends on the quality of the beam and the duration of the run. A full dose assessment was performed using the FLUKA 2011 code [13, 14] and demonstrated that the only critical component are the SiPMs if they are embedded in the core of the calorimeters. These studies (see Sec. 1 and 4) motivated the design of the lateral readout scheme. In particular, the neutron fluence on the inner surface of the calorimeter for a run that collects CC events at the neutrino detector is n/cm2 (1 MeV equivalent) but lower irradiation levels are highly advisable especially to prevent the dark count rate to disrupt the identification of minimum ionizing particles [19]. Mip identification is useful for self-monitoring possible drifts of the LCM response in the course of the run. Muon identification allows to exploit additional decay channels () and constrain the distribution of halo muons from the transfer line.
The results presented in this paper validate a significant fraction of this simulation for the LCM-based instrumentation: the energy response of the electron at various angles, the data/MC agreement for the response to the mip, the longitudinal profile of charged pions and, finally, the performance of the -layer. Further details and opportunities offered by NP06/ENUBET (muon monitoring after the hadron dump for the , a priori measurement of the at source, tagged neutrino beams etc.) are summarized in Ref. [6].
3 Layout and construction of the positron tagger
The prototype of the ENUBET positron tagger is composed by the longitudinal segmented calorimeter based on the LCM and the -layer.
3.1 Description of the calorimeter
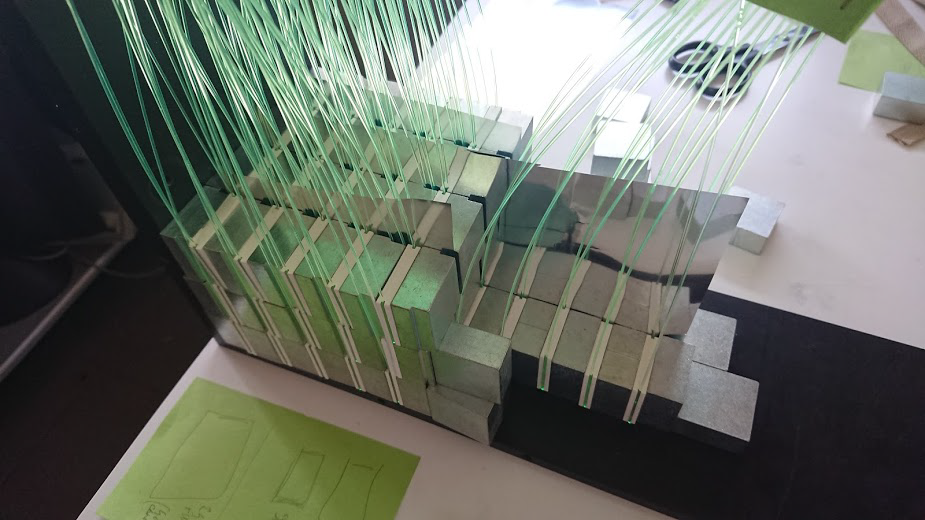
The construction of the prototype calorimeter was performed in two steps. In April 2018, we built a setup (“Module 1”) composed of 18 LCMs to validate the production and mounting procedure and estimate the light yield. In summer 2018, we added two additional modules: “Module 2”, identical to Module 1 i.e. composed by 18 LCMs, and “Module 3” made of 48 LCMs.
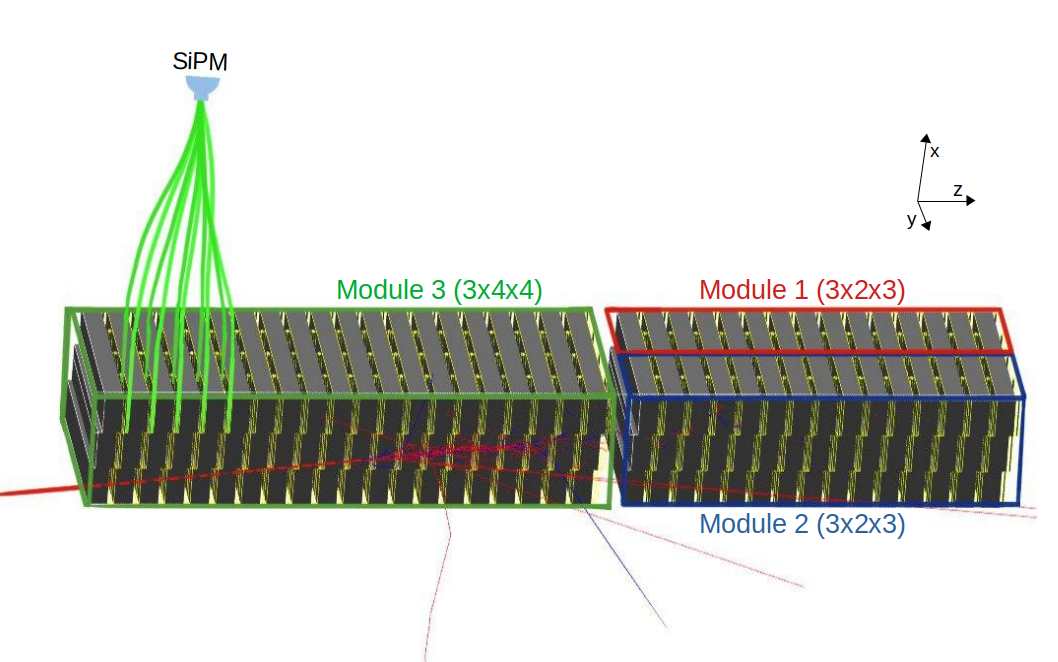
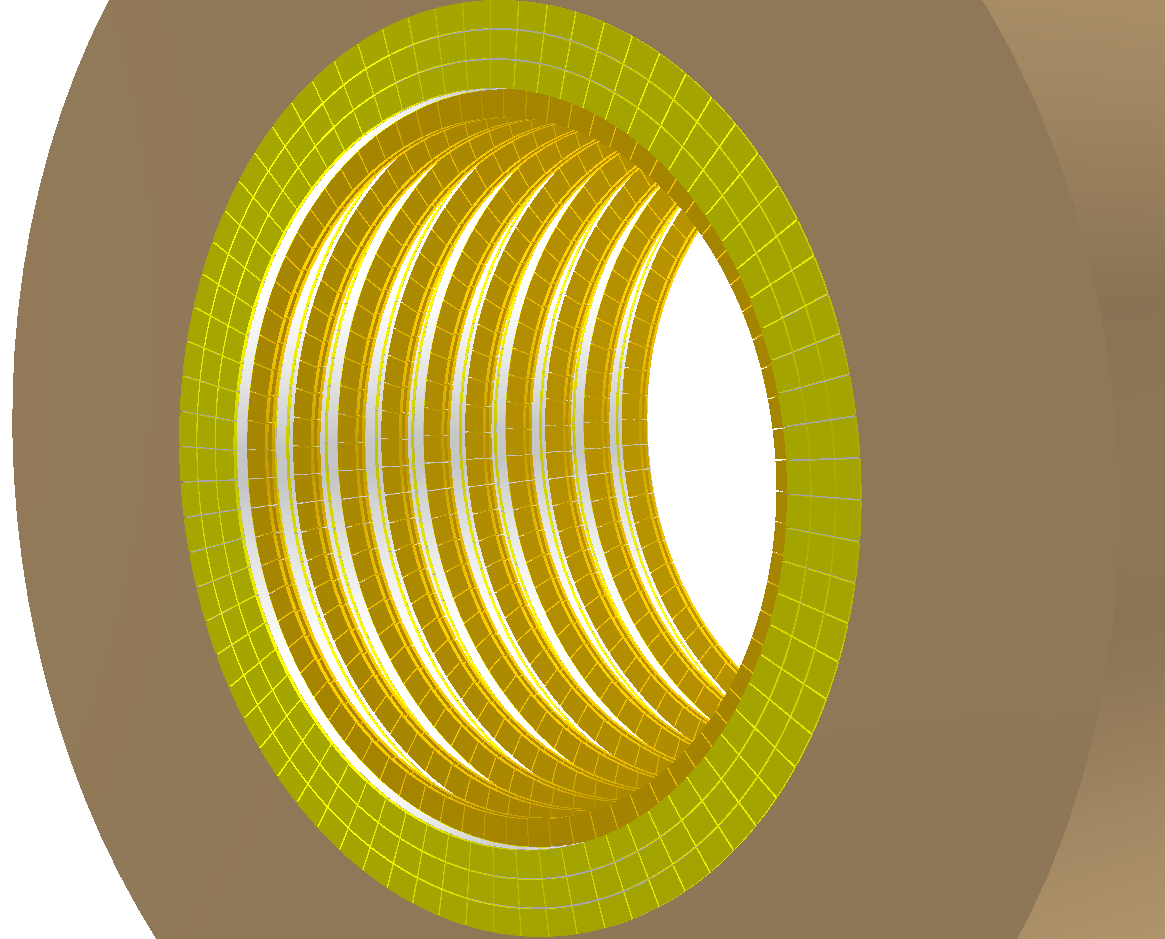
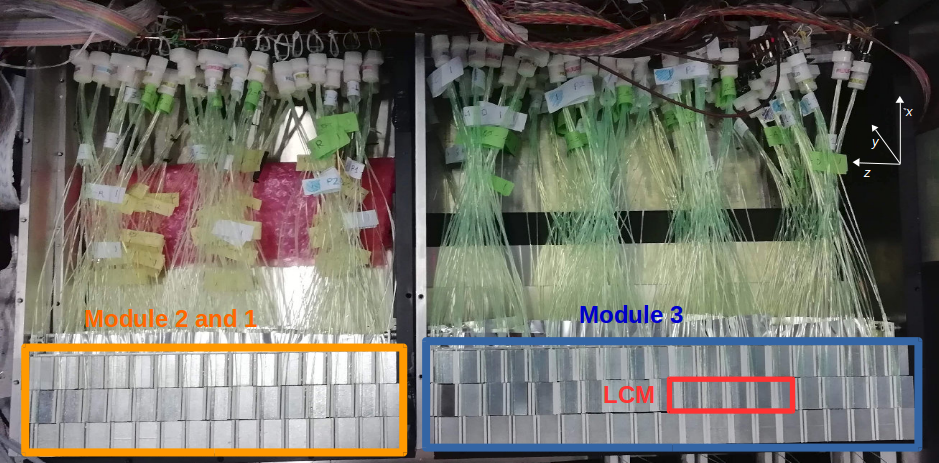
The prototype tested in fall 2018 is thus composed of three parts (see Fig. 2 and Tab. 1). Module 1 and 2 have 2 columns of LCMs in the axis that corresponds to the azimuthal direction in Fig. 1 (-axis in Tab. 1). They have 3 layers in the transverse beam plane, i.e. in the radial direction of Fig. 1 (-axis in Tab. 1) and 3 planes in the longitudinal direction along the beam axis (-axis in Tab. 1). Each LCM is composed by 1.5 cm thick iron slabs interleaved with 0.5 cm plastic scintillators (Eljen EJ-204 [23]), while each scintillator tile and iron slab has a cross section of 3×3 cm2, as sketched in Fig.3. The scintillator tiles are painted with a diffusive TiO2-based coating and read by two WLS Saint Gobain BCF92 fibers [24] with a diameter of 1 mm each glued to the sides. In addition, a Mylar® (BoPET) foil is placed between the two columns.
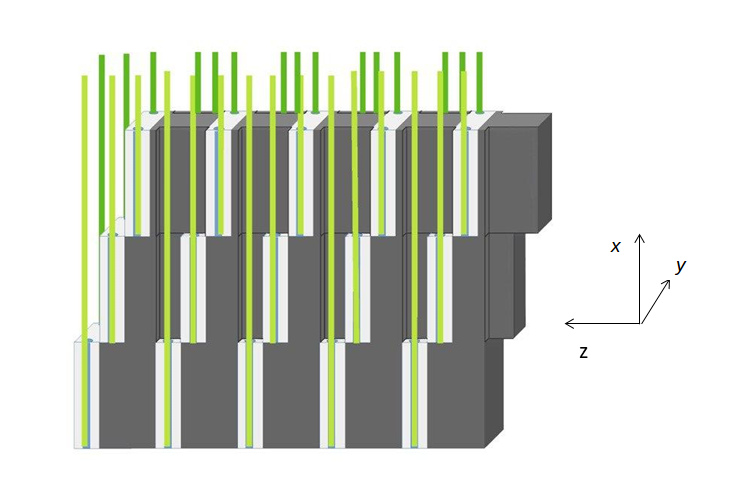
The longitudinal planes are shifted by 3.5 mm with respect to each other, to allow for the extraction of the fibers from the bulk of the calorimeter. This arrangement (see Fig. 4), in which each fiber is coupled only to one scintillator tile and does not collect light from the above planes, ensures optical insulation among LCMs. For the same reason, iron tiles are grooved on both sides to make room for the passage of the fibers (see Fig. 5). The grooves are 3 mm and 7 mm wide and 1.5 mm deep. The only difference between the two small Modules is the dimension of the scintillator: the tiles employed in one of them are 0.2 mm thicker than the other ones since they were procured by different Eljen production batches. Hence the LCM length is 10.1 cm instead of 10.0 cm.
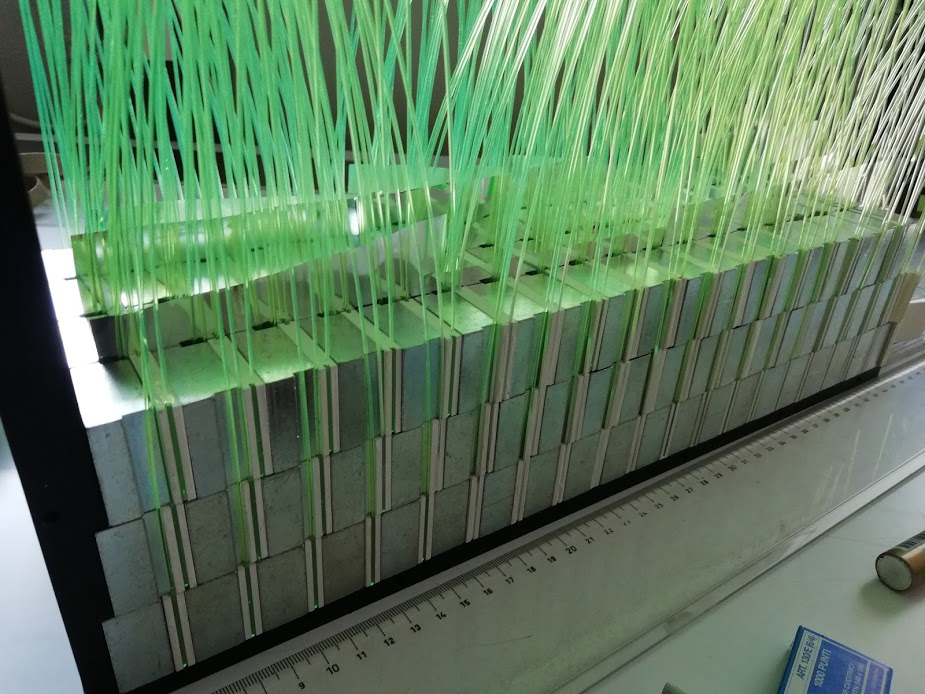
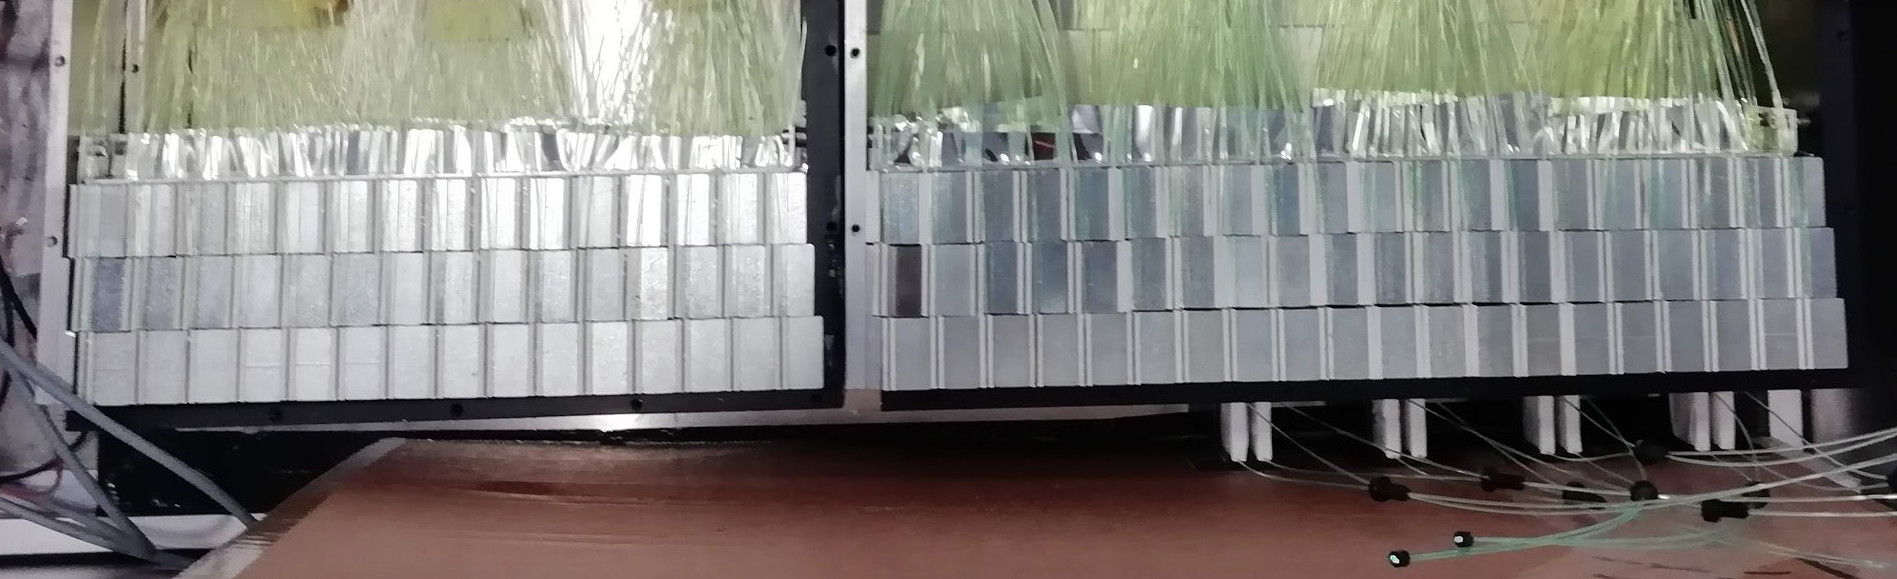
Module 3 is made of 344 modules for a total of 48 LCMs: 3 radial layers, 4 horizontal columns and 4 longitudinal (i.e. along the direction of the beam axis) planes. The first three planes in the longitudinal direction are read by Kuraray Y11 fibers [25], while the fourth is equipped with Saint Gobain BCF92 fibers. The LCMs are housed in custom PVC/Aluminium boxes and Mylar foils are positioned among the four columns. The overall calorimeter – see Fig. 6 – thus consists of 84 LCMs in a 347 structure. The length of the WLS fibers is 30 cm, i.e. three times longer that the previous ENUBET shashlik UCM. The 10 WLS fibers of a single LCM (corresponding to 5 scintillator tiles) were read by 44 mm2 SiPMs with 40 m cell size produced by Advansid srl [26]. Each SiPM has 9340 cells with a fill factor of 60% and peak PDE at 550 nm. The breakdown voltage is 27 V and the bias is the same for all SiPMs and it is distributed by a coaxial cable. During the beam-test all the SiPMs were biased at 32 V and the equalization among LCMs was performed using the response to minimum ionizing particles (see Sec. 6).
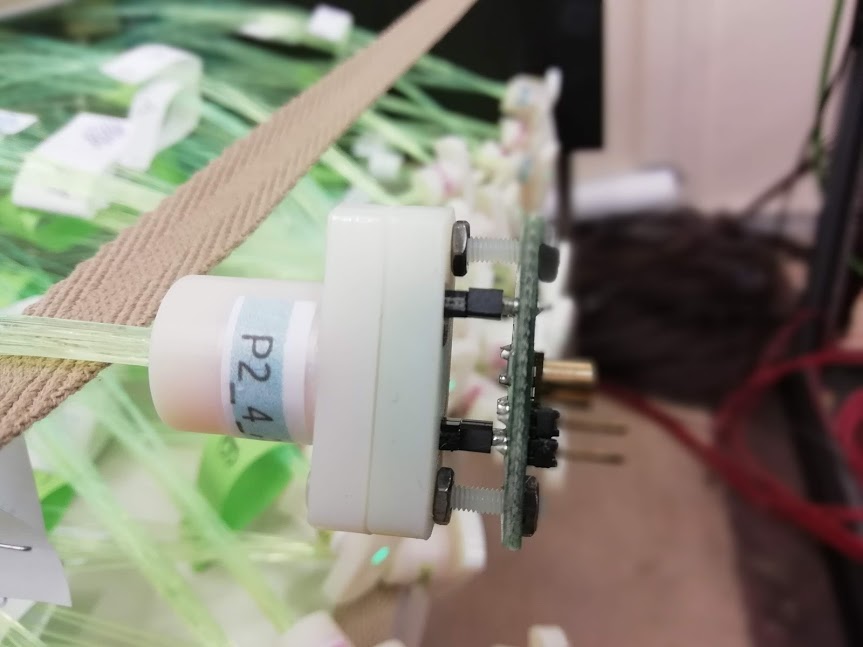
The signals from the LCMs are recorded by a set of 8 channel v1720 CAEN [27] digitizers (12 bit, 250 MS/s). All waveforms are recorded by the DAQ. A reduced dataset is produced for the analysis employing a peak finding algorithm on the waveform data [16]. The assembly of Module 2 and 3 was optimized taking advantage of the experience gained during the mounting of Module 1. In particular, we developed special plastic connectors to bundle the fibers prior to the final levering and polishing (see Fig. 7, left). The SiPM is hosted in another plastic connector coupled to the bundle with two M3 Teflon screws that hold also the board bringing the bias to the photosensor and leading the anode signal toward the digitizer by a MCX connector (see Fig. 7, right). All plastic connectors were produced by 3D printing at INFN Padova.
| Unit | Mechanics | Dimension | Notes | ||||||||||
|---|---|---|---|---|---|---|---|---|---|---|---|---|---|
| LCM |
|
|
|
||||||||||
| M1 | LCMs with BCF92 fibers |
|
|
||||||||||
| M2 | LCMs with BCF92 fibers |
|
|
||||||||||
| M3 | LCMs with Y11 fibers |
|
see caption (a) | ||||||||||
| All |
|
||||||||||||
| -layer |
|
|
|
3.2 The photon veto
The photon veto (-layer) provides both photon identification capabilities and precise timing of the particles in the instrumented decay tunnel. The requirements to achieve the goals of ENUBET are a photon identification efficiency at 99% and a time resolution of 1 ns.
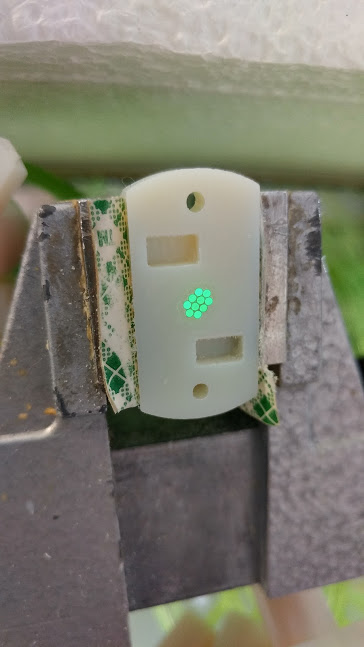
The -layer is composed of doublets of EJ-204 plastic scintillator tiles with a surface of 33 cm2 and a thickness of 0.5 cm. The tiles are mounted below the LCMs and positioned every 7 cm (see Fig. 8) so that positrons from kaon decays in the ENUBET working condition ( mrad) cross five doublets on average. The surface of the tiles is painted with a TiO2 layer. Two 40 cm long BCF92 multi-clad (MC) WLS fibers are glued to the lateral edges of the tiles with the same optical cement (EJ-500) used for the calorimeter and bundled by a custom connector, which optically couples them to one SenSL-J 30020 SiPM [28]. The SenSL SiPMs are equipped with a fast output signal employed for timing applications. The other end of the fibers is covered by a reflective painting.
Signals from the photon veto are amplified by a custom two stages amplifier (130 amplification factor) with a bandwidth up to 500 MHz. Both the anode and the fast output of the SiPMs are acquired by a 10 bit CAEN V1751 digitizer with 2 GS/s resolution through a VME-based DAQ.
4 Neutron reduction studies
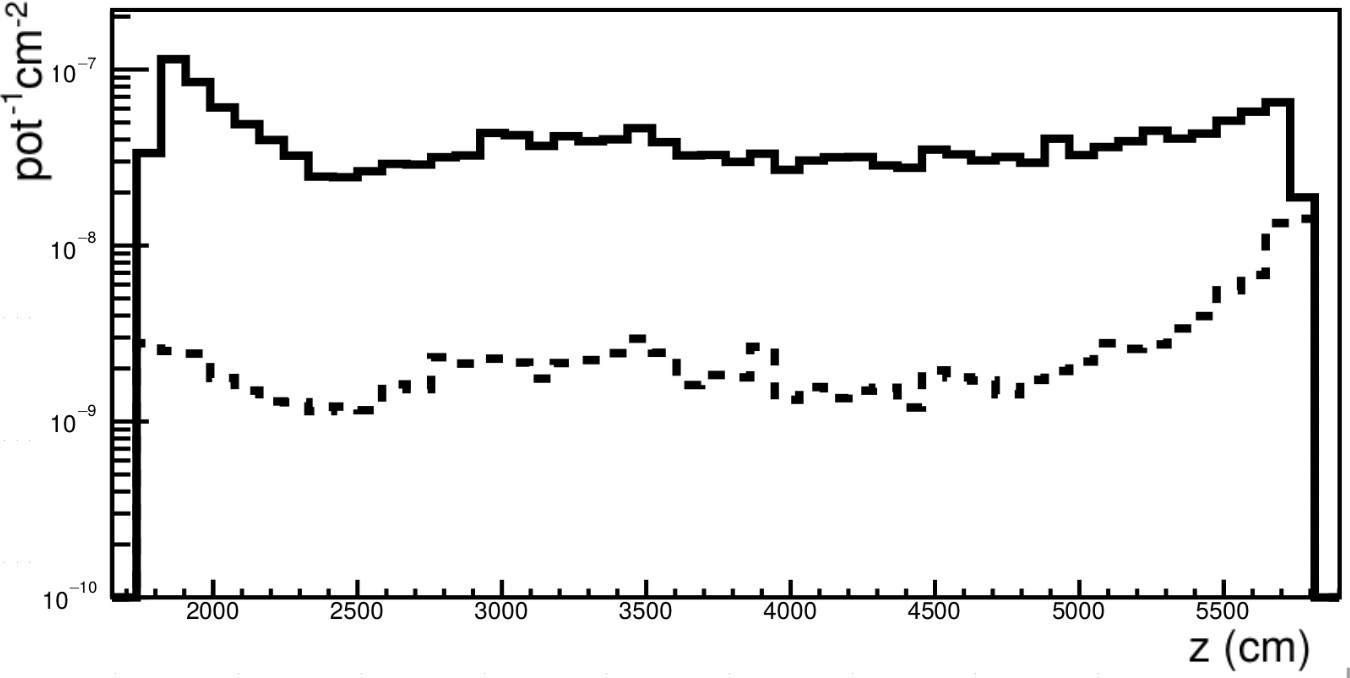
We have set up a detailed simulation of a tentative beamline for the ENUBET facility in the FLUKA framework. The goal is to estimate the ionizing doses and neutron fluences for all the elements of the beamline and, especially, for the decay pipe where the positron instrumentation is located.
Such layout of the beamline has been defined by a dedicated study performed with the TRANSPORT [29] and G4BeamLine [30] codes. The transfer line from the target to the decay tunnel produces an intense and collimated hadron beam with low levels of stray particles. The optimization performed with G4Beamline minimizes the length of the transfer line to reduce losses from kaon decays occurring before the entrance of the decay tunnel.
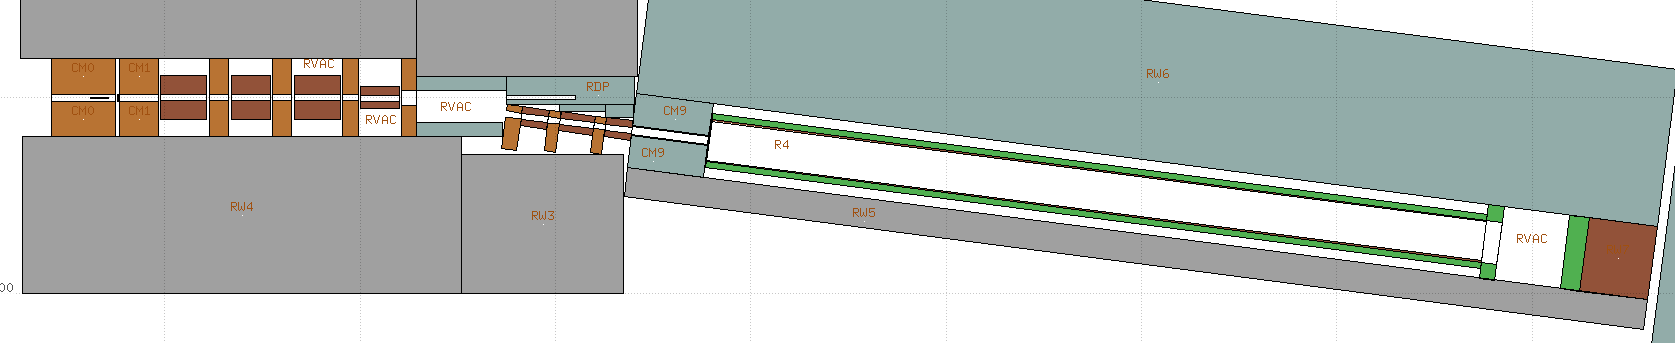
The resulting system is shown in Fig. 9. In this scheme the beamline consists of an “on-axis” quadrupole triplet followed by a single dipole and an “off-axis” quadrupole triplet. The overall bending angle of the resulting neutrino beam with respect to the proton axis is 7.4∘. Quadrupoles and dipoles were dimensioned to achieve a collimated beam of pions and kaons at an average momentum of 8.5 GeV/c and a momentum bite of 5-10% with the shortest possible length to avoid losing too many neutrinos from early decays of kaons ( 63 m at 8.5 GeV/c). The optimization of the position and size of the proton dump is in progress.
While implementing the beam optics in FLUKA several optimizations were performed mainly in terms of collimators and shielding. In particular a Tungsten plug of 4 m in length was added in front of the decay pipe to protect the calorimeter from background particles thanks to the large stopping power of this dense material.
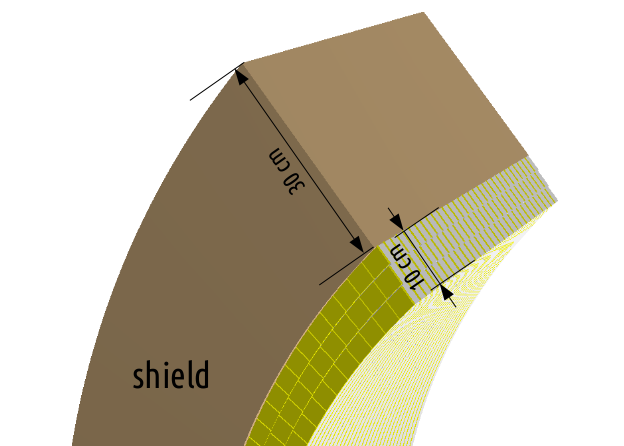
The calorimeter has been surrounded by a shielding of Borated polyehtylene with a thickness of 30 cm as shown in Fig. 10, left. The neutron reduction induced by adding this layer of material amounts to a factor of 18, averaging over the expected energy spectrum (see Fig. 10, right).
5 Test setup at the T9 beamline
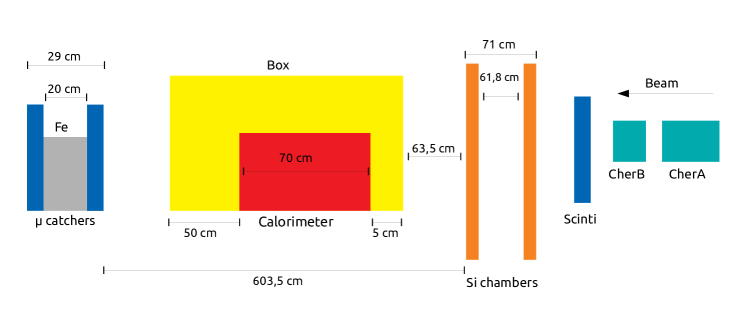
The calorimeter was exposed to electrons, muons and pions at the CERN PS East Area facility. We carried out a pilot run with Module 1 in May 2018 and a complete characterization of the prototype in September 2018. The momentum of the particles was varied between 1 and 5 GeV, i.e. in the range of interest for ENUBET (1-3 GeV) and above. The detector was positioned inside an Aluminum box to ensure light tightness and mounted on a platform in the T9 experimental area in front of two silicon strip detectors. The layout of the instrumentation in the experimental area is shown in Fig. 11. During the data taking the calorimeter was tilted at different angles (0, 50, 100, 200 mrad) with respect to the beam direction.
The silicon detectors [31, 17] provide track reconstruction with a spatial resolution of about 30 m. A pair of threshold Cherenkov counters filled with CO2 is located upstream of the silicon detectors. The maximum operation pressure of the counters is 2.5 bar. As a consequence, they were used to separate electrons from heavier particles ( or ) for momenta below 3 GeV while, during runs with momenta between 3 GeV and 5 GeV, the two counters were operated at different pressures to identify electrons, muons and pions.
The data acquisition system is triggered by a cm2 plastic scintillator located between the silicon and Cherenkov detectors. Two pads of plastic scintillator (“muon catcher”) are positioned after the calorimeter. We installed a 20 cm thick iron shield between the scintillators to select high purity samples of muons or non-interacting pions.
Particles in the beamline are produced from the interaction of 24 GeV/c primary protons of the CERN-PS accelerator with a fixed target. As in [15], we employed the T9 “electron enriched” target: an Aluminum Tungsten target (35100 cm2) followed by a Tungsten cylinder (diameter: 10 cm, length: 3 cm). The setting of the collimators was tuned to achieve a momentum bite of 1%. At 3 GeV the beam composition as measured by the Cherenkov counters is 12% electrons, 14% muons and 74% hadrons. We only selected negative particles in the beamline and the contamination of protons and undecayed kaons is thus negligible.
The DAQ system employed in T9 is based on a standard VME system controlled by a SBS Bit3 model 620 bridge, optically linked to a Linux PC-system. The DAQ, the digitizers, the power supply for the SiPMs and the front-end electronics for the silicon chambers are located in the proximity of the calorimeter, inside the experimental area. The front-end electronics also perform zero suppression in the silicon chambers [31]. The HV settings for the Cherenkov counters and the scintillators, and the configuration setting for DAQ (start-stop of the run, quality control) are performed by a PC in the Control Room connected to the main PC of the DAQ through a Gigabit Ethernet link. Users in T9 are served by a dedicated slow extraction of the protons from the PS to the target. The acquisition is hence triggered by the coincidence of the proton beam spill (duration: 400 ms) and the signal in the plastic scintillator. The signals from the Cherenkov counters and muon catcher are recorded for each trigger and used off-line for particle identification. The average particle rate recorded by the DAQ during the beam-test was 500 particles per spill. This rate is limited by the throughput of the waveform digitizers in the DAQ configuration employed for the beam-test. The maximum sustainable rate of the calorimeter and -layer is dominated by the recovery time of the SiPMs and is per LCM.
6 Signal equalization and response to minimum ionizing particles
The signal response to minimum ionizing particles (mip) of each LCM was measured using a dedicated high statistics sample of non-interacting muons and pions at 4 GeV. The bias voltage for the SiPMs was Vbias = 32 V. Mips are identified by Cherenkov counters located upstream of the beamline and they are selected projecting the information of the silicon chambers at the entrance of the calorimeter and checking if the particle hits a squared region of cm2 in the centre of each LCM. The distribution of the signal response for each LCM is shown in Fig. 12. The mip peak corresponds to the most probable value of the Landau fit of the deposited energy and it was used to equalize the relative response of the entire prototype.
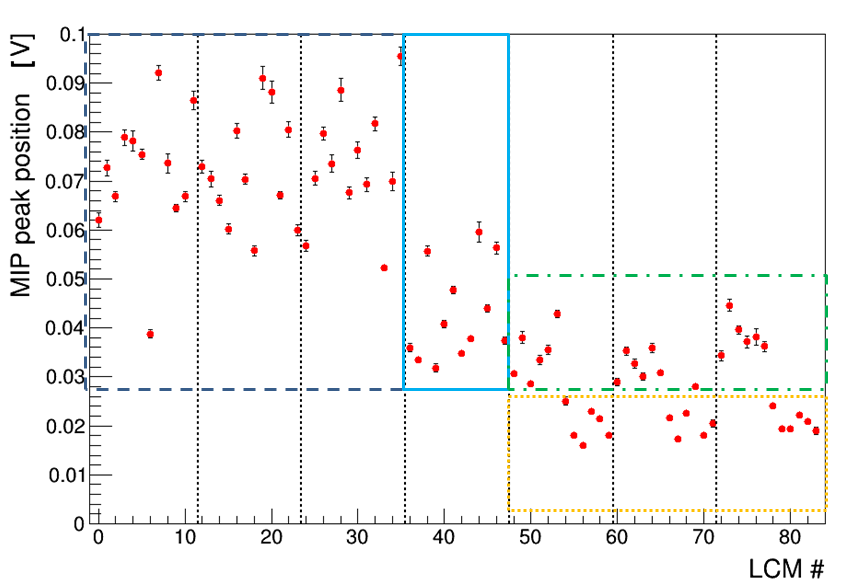
Fig. 12 shows significant variations among the LCMs.
The variation of the signal response among Modules is due to the two different optical fibers (Y11 and BCF-92) used in the assembly of the calorimeter: as expected, LCMs equipped by Y11 fibers have a higher response with respect to modules equipped with BCF-92 fibers because of the better spectral match with the plastic scintillator. In addition, the variations between Module 1 and 2 are due to the improvement of the fiber polishing procedure performed in summer 2018 (see Sec. 3.1). Variation of the LCMs inside the same Module were investigated by a dedicated campaign with a pulsed laser and cosmic rays. They were caused by differences in the gain of the SiPMs at 32 V. This effect was not noticed at the time of the construction because we were not aware of the production batches of the SiPMs and the general feature of the SiPMs ( and I-V curve in reverse bias) were rather uniform. Later on, we were able to trace that the SiPMs used for the construction of the prototype were coming from different production batches but no fast equalization of the gain was possible during the beamtest because there is not a straightforward correlation between the gain at a given voltage and the size of the reverse current. After the test, however, most of the SiPMs of Module 3 were measured one by one with a laser system and the gain difference was computed for the voltage used at CERN. Accounting for this effect, non-uniformities inside Module 3 are reduced to 10%.
Finally, the low signal response of 7th LCM of the uppermost Module (Module 3, see LCM# 7 in Fig. 12) was traced back to an optical fiber damaged during the installation.
The detector response was simulated with GEANT4.
The simulation includes the iron-scintillator tiles, the WLS fibers and a plastic box that holds all calorimeter components.
It does not include the scintillation process and light propagation. The physics list employed is FTFP_BERT_HP [12, 32].
The expected signal in each LCM is thus proportional to the energy deposit in the scintillator smeared with the contribution due to photoelectron statistics (the measured value is 82 p.e./mip in a single LCM at Vbias = 31 V).
Unlike electrons (see Sec. 7), saturation effects in the SiPMs are negligible.
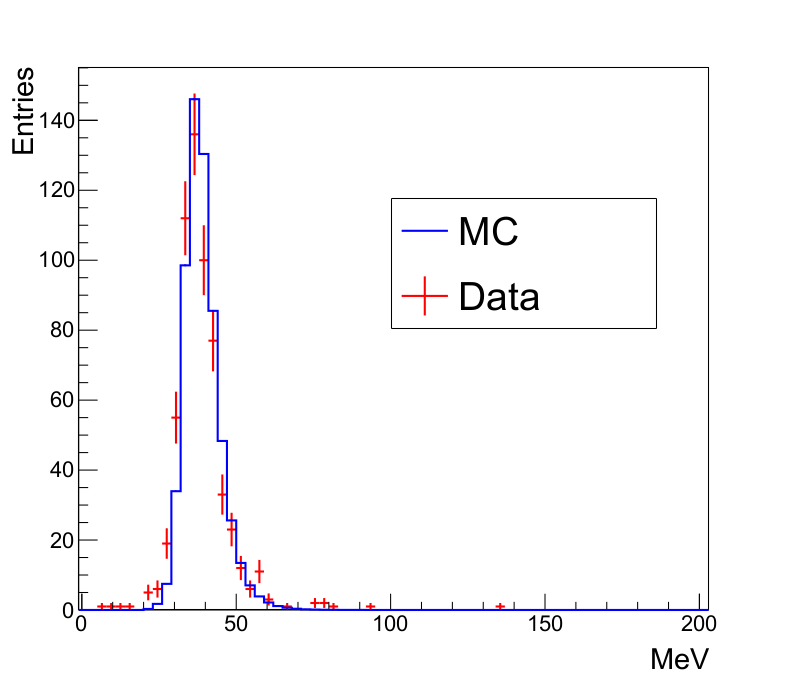
The mip energy deposit is in good agreement with simulations.
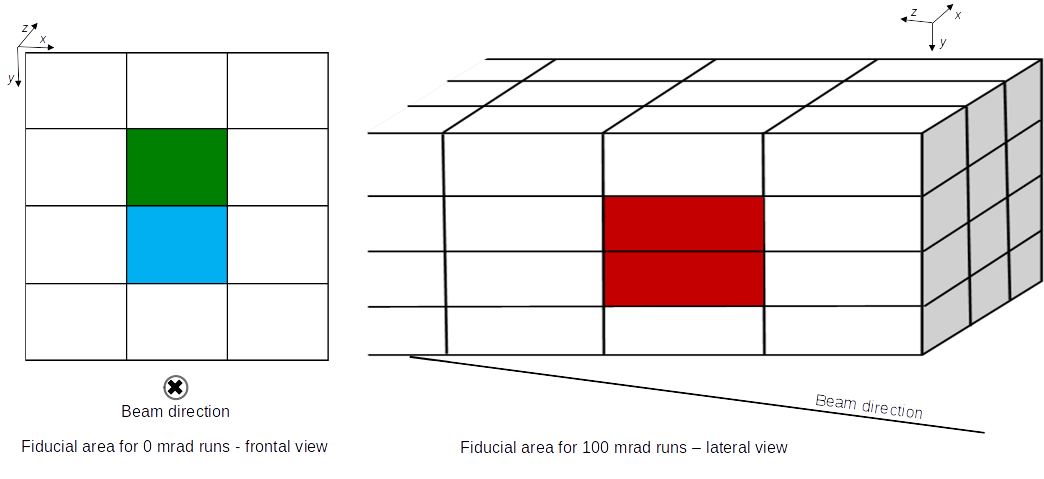
Fig. 13 shows the shape of the energy deposit for muons impinging on a 3 3 cm2 on the front face of the calorimeter for data (3 GeV run, Vbias = 31 V) and Monte Carlo simulation. This area corresponds to the green square of the Fig. 14.
Data were converted from arbitrary units (ADC counts) to MeV by equalizing the energy deposit of the electrons in the data (up to saturation) to the energy deposit of the electrons in the MC simulation.
The data response for muons is empirically reduced by 20% to account for limitations in the MC detector description (lack of full optical simulation) and the different calorimetric response between electron and muons (e/mip ratio).
7 Response to electrons
The calorimeter under test provides full containment of electromagnetic showers up to 5 GeV for particles impinging on the front face and from the lateral side.
The tilted geometry reproduces its actual operating conditions in the decay tunnel, where positrons from reach the detector with an average angle of mrad [2, 1].
Dedicated runs with energy (1-5 GeV) and tilt angles (0, 50, 100 and 200 mrad) relevant for neutrino physics application were carried out during the beam-test, in order to evaluate the response to electromagnetic showers.
Electrons were selected by the Cherenkov counters located upstream the silicon detectors.
The bias voltage for the SiPMs was Vbias = 31 V.
The silicon chambers are used to select single particles hitting a fiducial area with negligible lateral leakage:
for the front face run it amounts to 63 cm2 in the center of the calorimeter, while for tilted runs it corresponds to particle impinging on a projected area in the front face of the calorimeter of cm2, as shown in Fig. 14.
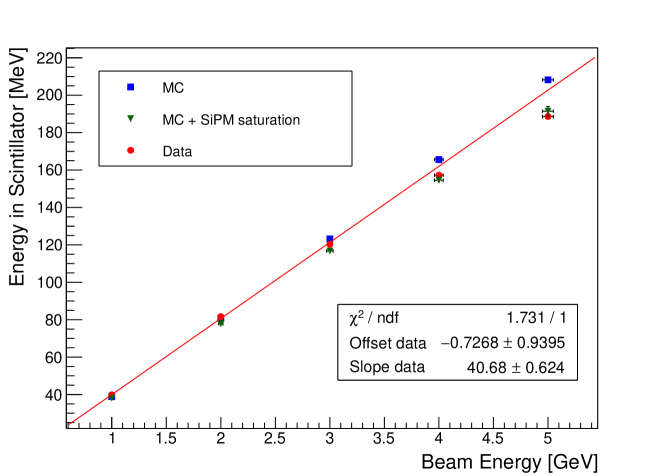
The results indicate that, as for the shashlik design [15], the performance of the calorimeter is the same for front and inclined runs. On the other hand, a clear deviation from linearity is visible above 3 GeV for all runs. Fig. 15 shows the reconstructed energy in the scintillator for data and MC. The linear fit (red line) results from the data points up to 3 GeV. At 4 (5) GeV, the data show a deviation from linearity of (). Most of this effect has been traced back to saturation of the SiPMs, which is enhanced by a rather large correlated noise (cross-talk) of the SiPMs at V. The correlated noise was measured in a dedicated setup at the INFN Bologna labs in 2019 and turns out to be 44% at V and 65% at V. To account for these effects, the average expected number of p.e. (including the single photon efficiency of the SiPM) in a LCM hit by an electron is smeared for Poisson fluctuations () and increased by cross-talk effects: . Note that such correction is just an approximation that neglects the correlation between saturation effects and cross talk: the latter is suppressed especially at high light intensities because the pixel occupancy is already nearly 100%. For a complete treatment – which is outside the scope of this paper – see [33, 34, 35, 36]. In the present case, the SiPMs have 9340 cells but the fibers are put in mechanical contact with the SiPMs and illuminate a maximum number of cells . We can thus approximate the number of expected fired cells in the SiPM due to saturation as
| (7.1) |
The uncertainty in this formula arises from the uncertainty on the actual size of the surface illuminated by the fibers ( and by the above-mentioned approximations [33, 34]. Still, Eq. 7.1 is able to account for non linearities in the detector to at least 4 GeV. Fig. 15 shows the Monte Carlo prediction before and after the corrections for saturation effects.
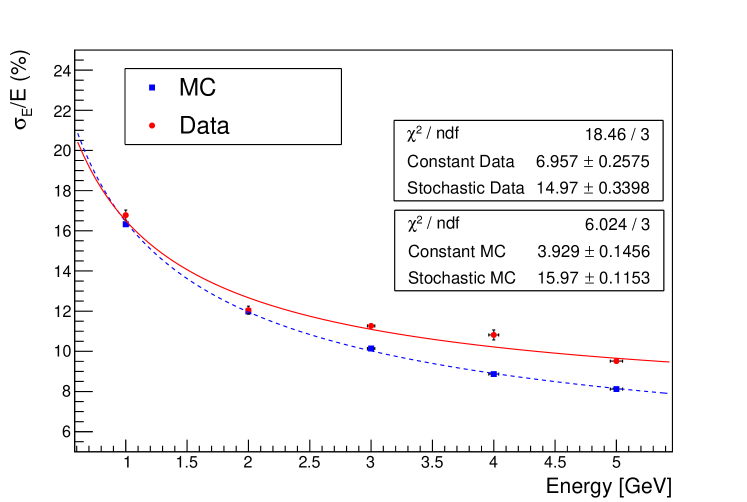
The energy resolution as a function of the beam energy for particles hitting the front face of the calorimeter is shown for a 0 mrad run in Fig. 16 for data (red dots) and simulation (blue squares). The points are fitted to , and being the sampling (stochastic) and constant term, respectively. The resolution at 1 GeV is 17%. As expected, discrepancies with the simulation are visible in the high energy range due to the large difference in the response of the downstream modules and to SiPM saturation effects. In particular, saturation is stronger for electrons impinging in the center of the LCM where the energy is deposited mostly in a single module. Events close to the border of two adjacent modules share the deposited energy among multiple LCMs without saturating the SiPMs. This effects creates a spurious dependence on the impact point that broadens the energy distribution contributing to a worse and a poorer quality of the fit. This source of non gaussianity contributes to the constant term together with standard calibration effects. In our case, calibration effects mostly results from having chosen modules and submodules (last plane of Module 3) with different components (see Tab. 1) for R&D and procurement reasons and installing the lowest performance modules downstream the calorimeter. Hence, showers leaking after the third longitudinal plane of Module 3 are affected by lower response LCMs where, in addition, the equalization is more complex due to multiple scattering in Module 3.
8 Response to charged pions
Longitudinal segmented calorimeters are employed for electron/hadron separation. In ENUBET, this feature is needed to separate positrons from charged pions in the few GeV range. The prototype under test allows for a complete longitudinal containment of pions and partial containment in the transverse direction. The response of the detector can therefore be used to validate the ENUBET simulation and the expected monitoring performance of the decay tunnel instrumentation.
Since all variables employed by the ENUBET analysis are based on the energy deposition pattern in the LCM, this pattern was tested with a beam in the same energy range as for the electron. For this study we recorded front runs in the fiducial area depicted in Fig. 11 (green square).
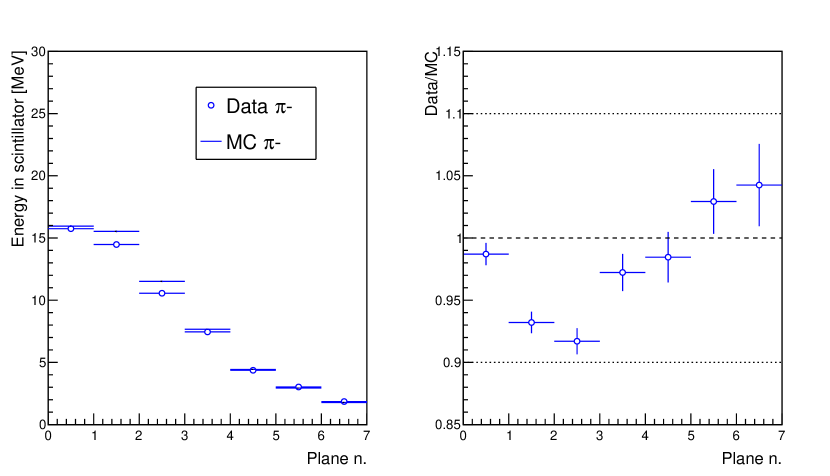
Pions are selected with the Cherenkov counters (no signal in any of the counters) and traced down to the front face of the calorimeter. The mean energy deposited in each plane of the calorimeter is evaluated and compared with the simulation. In this case, saturation effects are negligible and we observe no difference between the saturation-corrected Monte Carlo and the uncorrected simulation. Fig. 17 (right) shows the average energy deposited in the scintillator (data/MC ratio) as a function of shower depth for 3 GeV pions. The shower depth is expressed as number of calorimeter plane: plane 0 represent the front face of the calorimeter, while plane 7 is the end of the calorimeter. The whole calorimeter depth corresponds to and 3.15 .
9 Tests of the photon veto
The -layers were characterized in terms of single mip response, timing resolution and light collection efficiency. Moreover, to tag positrons from decays and reject pairs produced in the conversion of photons in the -layer the capability of the -layer to separate one mip from two mips was investigated.
Firstly, 3 doublets were exposed to charged particles in a standalone configuration, i.e. without the calorimeter. The trigger was given by the coincidence of two 33 cm2 scintillator pads and a 1515 cm2 pad readout by fast Hamamatsu R9880 U-210 PMTs [38]. The SiPMs were operating with +4 V overvoltage and the signals were sampled every 0.5 ns.
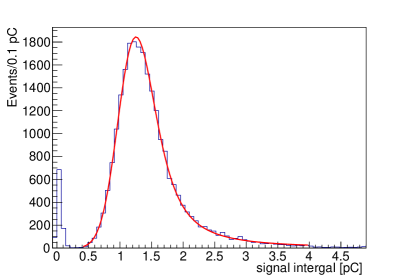
In the standalone configuration, the -layer tiles were exposed to 4 GeV pions. In total 28000 1-mip events were recorded. The distribution of the integral of the fast output signals in one -layer tile is shown in Fig. 18 (a) and is fitted with a Landau function convoluted with a Gaussian function. The MPV of the signal integral obtained from the fit corresponds to 25 p.e. for a mip crossing a single tile.
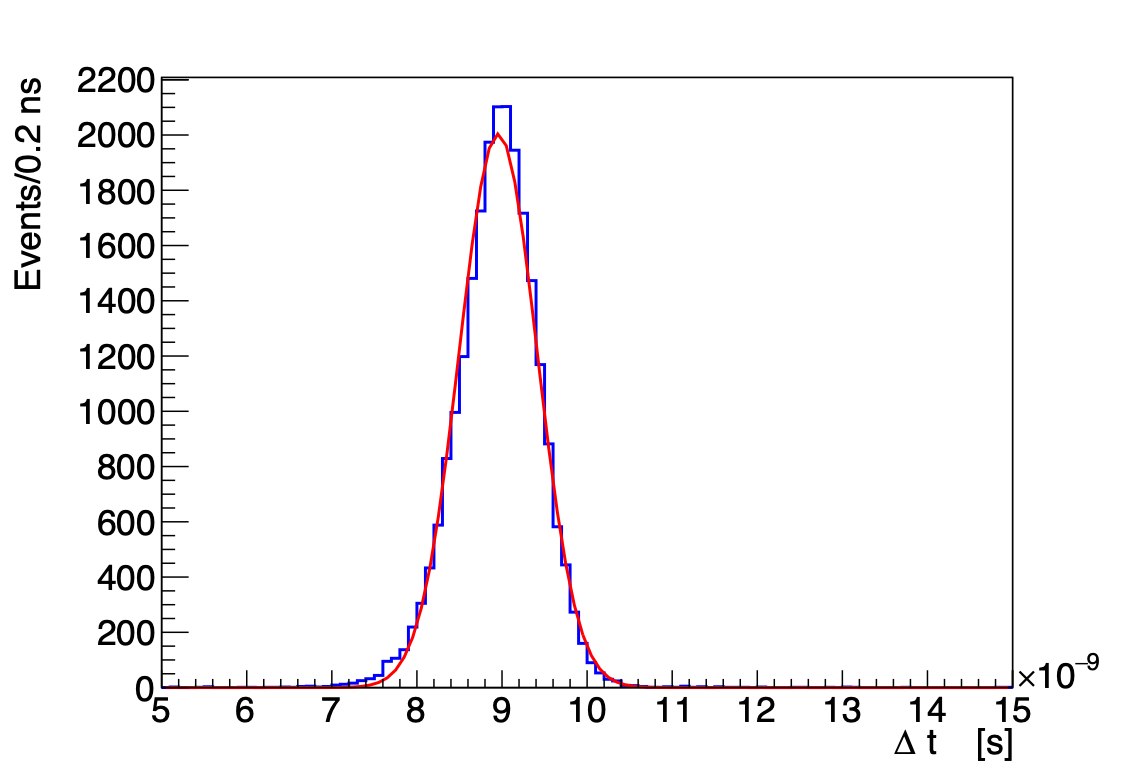
The time resolution was computed from the distribution of the time difference t between the PMT and the SiPM. The threshold was set to 10% of the signal amplitude and the time resolution is defined as the sigma of the t distribution. Fig. 18 (b) shows the distribution of the fast output signals from the 1 mip data. The distribution is fitted with a Gaussian function and the sigma is 460 ps. After subtracting the PMT time resolution ( 200 ps) the measured time resolution is 400 ps.
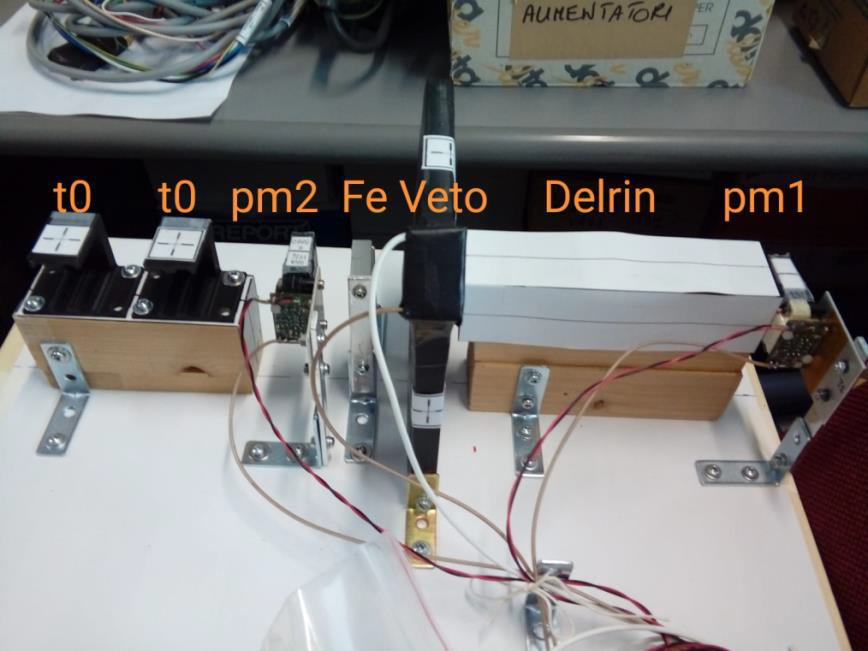
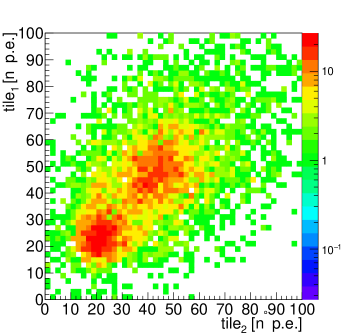
The 1 versus 2 mip separation capability of the photon veto was studied exploiting charge-exchange reactions () as a source of photons. We set up a new configuration (see Fig. 19) where a block of polyoxymethylene (Derlin®) was installed along the beamline just after the 33 cm2 scintillator pad (pm1) to produce pion charge exchange. Another 33 cm2 scintillator pad (pm2) is placed just before the -layer. In addition, we installed a block of iron between the 1515 cm2 scintillator pad and pm2, to convert into pairs. In this configuration the 1515 cm2 pad acts as a VETO for 1 mip particles and we acquired about 29000 events. These events are a mixture of 1 mip and 2 mip events. 1 mip events are due either to the inefficiency of the VETO or to converted photons where only one charged particle reaches the -layer. Fig. 20 (a) shows the number of p.e. collected in one tile versus the number of p.e. collected in another tile. The two peaks corresponding to 1 and 2 mip distributions respectively are clearly visible.
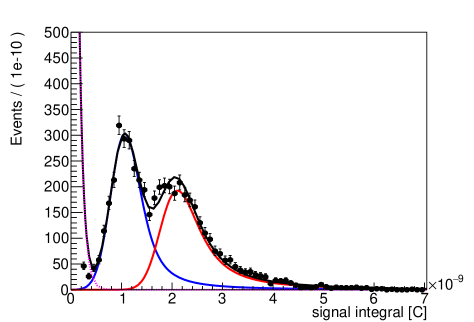
In order to assess the 1 versus 2 mip separation capability the data of a single tile were used to tune a model by composing the 1 mip signal pdf (Landau convoluted with a Gaussian) with the 2 mip background pdf (Landau convoluted with another Landau convoluted with a Gaussian) together with the dark current distribution (exponential) and subtracting the noise pedestal. Fig. 20 (b) shows the fit of the data (black dots) with the composite model (black line): the signal (blue line) and the background (red line) pdf are shown separately.
The signal and background pdf were used to generate 106 MC events of 1 mip and 2 mip crossing a tile of -layer. A cut on the signal integral in one tile was studied assuming a signal to noise ratio Ns/Nb of 2.3 as predicted by the MC simulation.
The optimal cut on the signal integral that maximizes the significance is 1.8 pC for which a signal selection efficiency of 87% and a background rejection efficiency of 89% are obtained. The corresponding value for the purity is 95%.
Using the beam-test data we also studied the possibility to reduce the sampling rate down to 500 MS/s (250 MS/s). In this case, the waveforms of the fast output sampled by the digitizer every 0.5 ns were sub-sampled off-line every 2 (4) ns. The fast output signal has a rising time of about 3.5 ns and a resolution of 500 MS/s still allows to sample the rising edge of the waveform. The sampling at 2 ns, hence, is suitable to measure the rising edge of the signal with a time resolution ns, i.e. well below the requirements of ENUBET. On the other hand, sampling at 4 ns is compatible with the rising time of the signal and the waveform cannot be safely reconstructed.
The light collection efficiency was measured in a configuration of 4 doublets of -layers combined with the calorimeter (Fig. 8). In this case, we recorded only runs with the calorimeter tilted at 100 mrad with respect to the beam axis and hence only 4 tiles were crossed by charged particles. Muon tracks were selected by the Cherenkov detectors and we employed the silicon chambers to identify events where the charged particle crosses the -layer. Considering three consecutive tiles of the photon veto, we computed the efficiency of the tile located in the middle The efficiencies measured for the tiles under test were all above 99%.
10 Conclusions
In this paper, we presented the construction and testbeam performance of a small scale prototype of the ENUBET instrumented decay tunnel. The scintillation light produced in the calorimeter and photon veto is read out by WLS fibers running along the edges of the tiles to reduce potential radiation damage of the SiPMs. The calorimeter response to mip, electrons and pions is in good agreement with expectations in the energy range of interest for ENUBET (1-3 GeV) but some discrepancies in the electron response were observed above this range (>4 GeV, see Sec. 7). The electromagnetic resolution is 17% at 1 GeV and the sampling term is the dominant contribution in the 1-3 GeV range. Non-linearities in the electron response are visible at higher energies due to partial saturation of the SiPMs and non-uniformity of response of the LCMs. Both can be improved by tuning the size of the SiPMs and the equalization of the gain (see Sec. 6 and 7). The photon veto was tested in standalone mode and combined with the calorimeter during the experimental campaign. The 1-mip efficiency of two doublets is % and the 1 mip sample can be disentangled from the 2-mip component with a 95% purity in the background conditions of ENUBET.
In conclusion, the lateral readout calorimeter equipped with the -layer fulfills the specifications of ENUBET and is well suited for the instrumented tunnel of monitored neutrino beams.
Acknowledgments
This project has received funding from the European Union’s Horizon 2020 Research and Innovation programme under Grant Agreement no. 681647 and the Italian Ministry for Education and Research (MIUR, bando FARE, progetto NUTECH). The authors gratefully acknowledge CERN and the PS staff for successfully operating the East Experimental Area and for continuous supports to the users. We thank J. Bernhard, L. Gatignon, M. Jeckel and H. Wilkens for help and suggestions during the data taking on the PS-T9 beamline. We are grateful to the INFN workshops of Bologna, Milano Bicocca and Padova for the construction of detector and, in particular, to D. Agugliaro, S. Banfi, G. Ceruti, L. Degli Esposti, M. Furini, R. Gaigher, L. Garizzo, M. Lolli, R. Mazza, A. Pitacco, L. Ramina, M. Rampazzo, C. Valieri and F. Zuffa.
References
- [1] A. Longhin, L. Ludovici and F. Terranova, A novel technique for the measurement of the electron neutrino cross section, Eur. Phys. J. C 75 (2015) 155.
- [2] A. Berra et al. [ENUBET Collaboration], Enabling precise measurements of flux in accelerator neutrino beams: the ENUBET project, CERN-SPSC-2016-036; SPSC-EOI-014.
- [3] The ERC ENUBET Project: documentation available at http://enubet.pd.infn.it/ .
- [4] F. Acerbi et al., CERN-SPSC-2018-034, SPSC-I-248, Geneva, 2018.
- [5] F. Pupilli et al., Positron identification in the ENUBET instrumented decay tunnel, PoS NEUTEL2017 (2018) 078.
- [6] A. Longhin, F. Terranova et al., [ENUBET Collaboration], NP06/ENUBET annual report for the CERN-SPSC, CERN-SPSC-2020-009, 2020.
- [7] A. Meregaglia, ENUBET: Enhanced NeUtrino BEams from kaon Tagging, JINST 11 (2016) C12040.
- [8] A. Hocker et al., TMVA - Toolkit for Multivariate Data Analysis, CERN-OPEN-2007-007, physics/0703039 [physics.data-an].
- [9] P. Eckert, R. Stamen and H. Schultz-Coulon, Study of the Response and Photon-Counting Resolution of Silicon Photomultipliers using a Generic Simulation Framework, JINST 7 (2012), P08011.
- [10] S. Agostinelli et al. [GEANT4 Collaboration], GEANT4: A Simulation toolkit, Nucl. Instrum. Meth. A 506 (2003) 250.
- [11] J. Allison et al. [GEANT4 Collaboration], Geant4 developments and applications, IEEE Trans. Nucl. Sci. 53 (2006) 270.
- [12] J. Allison et al., Recent developments in Geant4, Nucl. Instrum. Meth. A 835 (2016) 186.
- [13] G. Battistoni, S. Muraro, P.R. Sala, F. Cerutti, A. Ferrari, S. Roesler, A. Fassò, J. Ranft, The FLUKA code: Description and benchmarking, Proceedings of the Hadronic Shower Simulation Workshop 2006, Fermilab 6–8 September 2006, M.Albrow, R. Raja eds., AIP Conference Proceeding 896 (2007) 31.
- [14] A. Fassò, A. Ferrari, J. Ranft, and P.R. Sala, FLUKA: a multi-particle transport code, CERN-2005-10 (2005), INFN/TC_05/11, SLAC-R-773
- [15] G. Ballerini et al., Testbeam performance of a shashlik calorimeter with fine-grained longitudinal segmentation, JINST 13 (2018) P01028.
- [16] A. Berra et al., A compact light readout system for longitudinally segmented shashlik calorimeters, Nucl. Instrum. Meth. A 830 (2016) 345.
- [17] A. Berra et al. [SCENTT Collaboration], Shashlik calorimeters with embedded SiPMs for longitudinal segmentation, IEEE Trans. Nucl. Sci. 64 (2017) 1056.
- [18] F. Acerbi et al., Polysiloxane-based scintillators for shashlik calorimeters, Nucl. Instrum. Meth. A 956 (2020) 163379.
- [19] F. Acerbi et al., Irradiation and performance of RGB-HD Silicon-Photomultipliers for calorimetric applications, JINST 14 (2019) P02029.
- [20] M. Antonello et al. [MicroBooNE, LAr1-ND and ICARUS-WA104 Collaborations], A Proposal for a Three Detector Short-Baseline Neutrino Oscillation Program in the Fermilab Booster Neutrino Beam, arXiv:1503.01520 [physics.ins-det].
- [21] B. Abi et al. [DUNE Collaboration], The Single-Phase ProtoDUNE Technical Design Report, arXiv:1706.07081 [physics.ins-det].
- [22] I. De Bonis et al., LBNO-DEMO: Large-scale neutrino detector demonstrators for phased performance assessment in view of a long-baseline oscillation experiment, arXiv:1409.4405 [physics.ins-det].
- [23] ELJEN Technology, 1300 W. Broadway, Sweetwater, TX 79556, USA.
- [24] Saint-Gobain Group, Les Miroirs 18, avenue d’Alsace, 92400 Courbevoie, France.
- [25] KURARAY CO., LTD., Ote Center Building,1-1-3, Otemachi, Chiyoda-ku, Tokyo 100-8115, Japan
- [26] Advansid s.r.t., Via Sommarive 18, I-38123 Povo, Trento, Italy
- [27] CAEN S.p.A. Via Vetraia, 11, 55049, Viareggio (LU), Italy
- [28] http://sensl.com/downloads/ds/DS-MicroJseries.pdf
- [29] D. C. Carey, K. L. Brown, F. Rothacher, SLAC-R-95-462, Stanford, 1995.
- [30] T. J. Roberts, K. B. Beard, D. Huang, S. Ahmed, D. M. Kaplan and L. K. Spentzouris, Conf. Proc. C 0806233 (2008) WEPP120 .
- [31] M. Prest, G. Barbiellini, G. Bordignon, G. Fedel, F. Liello, F. Longo, C. Pontoni and E. Vallazza, The AGILE silicon tracker: An innovative gamma-ray instrument for space, Nucl. Instrum. Meth. A 501 (2003) 280.
- [32] A. Dotti [GEANT4 Hadronic Working Group], Description of hadron-induced showers in calorimeters using the GEANT4 simulation toolkit, NSS MIC Conference Record, doi:10.1109/NSSMIC.2011.6154433
- [33] L. Gruber, S. E. Brunner, J. Marton and K. Suzuki, Over saturation behavior of SiPMs at high photon exposure, Nucl. Instrum. Meth. A 737 (2014) 11.
- [34] K. Kotera, W. Choi and T. Takeshita, Describing the response of saturated SiPMs, arXiv:1510.01102 [physics.ins-det].
- [35] V. Regazzoni, F. Acerbi, G. Cozzi, A. Ferri, C. Fiorini, G. Paternoster, C. Piemonte, D. Rucatti, G. Zappalà, N. Zorzib and A. Gola, Characterization of high density SiPM non-linearity and energy resolution for prompt gamma imaging applications JINST 12 (2017) P07001.
- [36] F. Acerbi and S. Gundacker, Understanding and simulating SiPMs, Nucl. Instrum. Meth. A 926 (2019) 16.
-
[37]
GEANT4 physics validation and verification (ATLAS TileCal). Available at:
geant4.cern.ch/results/validation_plots/full_setup/HEP_detectors/ATLAS/
atlas_calo.shtml - [38] Information available at: https://www.hamamatsu.com/resources/pdf/etd/R9880UTPMH1321E.pdf