A Computational Assessment of the Efficacy of Halides
as Shape-Directing Agents in Nanoparticle Growth
Abstract
We report a comprehensive study of aqueous halide adsorption on nanoparticles of gold and palladium that addresses several limitations hampering the use of atomistic modeling as a tool for understanding and improving wet-chemical synthesis and related applications. A combination of thermodynamic modeling with density functional theory (DFT) calculations and experimental data is used to predict equilibrium shapes of halide-covered nanoparticles as a function of the chemical environment. To ensure realistic and experimentally relevant results, we account for solvent effects and include a large set of vicinal surfaces, several adsorbate coverages as well as decahedral particles. While the observed stabilization is not significant enough to result in thermodynamic stability of anisotropic shapes such as nanocubes, non-uniformity in the halide coverage indicates the possibility of obtaining such shapes as kinetic products. With regard to technical challenges, we show that inclusion of surface-solvent interactions lead to qualitative changes in the predicted shape. Furthermore, accounting for non-local interactions on the functional level yields a more accurate description of surface systems.
I Introduction
Wet-chemical synthesis has emerged as one of the primary routes for obtaining metal nanoparticles (NPs) with tailored properties. One of the most important processes in the aqueous synthesis environment is the adsorption of ions on the NP surface. Detailed understanding of the influence of ion adlayers on growth, morphology, and physicochemical properties of NPs is therefore crucial for the continued development of nanotechnology.
Halides are one of the prototypical ionic species found in aqueous NP solutions as components of common metal salts, surfactants, and cleaning agents Lohse et al. (2014); Ghosh and Manna (2018). In aqueous solution, halides tend to form adlayers on metal surfaces Magnussen et al. (1995); Magnussen (2002), resulting in lower surface energies and stabilization of higher-index facets. The propensity of halides to adsorb is highly sensitive to the atomic structure of the surface, resulting in facet-dependent adlayer structures. Since this can in turn stabilize different NP morphologies Nikoobakht and El-Sayed (2001); Johnson et al. (2002); Chang et al. (2007) and guide NP growth, halides are commonly considered as “shape-directing agents”. For instance, during the growth of gold nanorods bromide plays an integral role in promoting the growth of, initially spherical, seed particles into rods Ha et al. (2007); Si et al. (2012); Hubert et al. (2008); Meena et al. (2016); Almora-Barrios et al. (2014). Similarly, several studies have found the presence of bromide conducive to Pd nanocube growth Chang et al. (2007); Lim et al. (2009); Peng et al. (2013). Halides can also influence NP growth through other pathways, including the formation of metal complexes with the precursor and surface smoothing through oxidative etching Xiong et al. (2005); Zheng et al. (2014).
While the importance of parameters such as halide species, concentration, and counter ion is generally acknowledged, a quantitative understanding of their impact has yet to be achieved. This can partly be attributed to a gap between experimental and theoretical work. Experiments take place in a complex chemical environment where the metal precursor commingles with other reactants such as surfactants and reducing agents, which is often neglected completely in modeling work. This holds true in particular for density functional theory (DFT) calculations, which despite being the main workhorse of computational surface science face technical challenges, e.g, with respect to obtaining accurate surface energies Singh-Miller and Marzari (2009); Patra et al. (2017) and accounting for solvation effects Asthagiri et al. (2003); Grossman et al. (2003); Persson et al. (2012). A comprehensive analysis of halide adsorption must therefore address multiple aspects. Here, as a step toward this goal, we present an extensive quantitative investigation of halide adsorption in aqueous solution on Au and Pd surfaces as well as NPs, which are of interest for a wide range of applications in nanomedicine Murthy (2007); Dumas and Couvreur (2015); Tran et al. (2017), clean energy Wadell et al. (2015); Namba et al. (2018) and catalysis Thompson (2007); Pérez-Lorenzo (2012); Bej et al. (2016). We employ a thermodynamic model that uses a combination of data from DFT calculations and experimental free energies to create Wulff constructions. Our model enables quantitative predictions for equilibrium shape and surface area density of halide-covered NPs as a function of concentration in the range relevant for synthesis. In contrast, previous DFT-based investigations into the thermodynamics of halide adsorption on metal surfaces have largely approached the problem from an electrochemical perspective, describing the stable adsorbate geometry on single surfaces as a function of the electrode potential Roman et al. (2014); Gossenberger et al. (2015); Groß and Sakong (2019). The combination DFT calculations with experimental data allows us to compensate for short comings in DFT calculations, including ionization and solvation, without increasing the computational burden. The inclusion of a large number of high-index facets renders the predicted shapes more realistic. The next two sections introduce the key features of the thermodynamic model and provide a summary of the computational methodology, which is followed by results and discussion. Additional material, including a detailed description of the modeling approach as well as complementary results, is presented in the Supplementary Information (SI).
II Thermodynamic model
In equilibrium, a particle with fixed volume minimizes its surface free energy by assuming a shape described by a set of points
| (1) |
where is the surface free energy Wulff (1901). This is known as Wulff’s theorem and is referred to either as the Wulff shape (WS) or Wulff construction. For a given crystalline NP of material \ceM, it is typically sufficient to consider only a small set of orientations described by Miller indices .
If the twin boundary energy of is known, Wulff’s theorem can be generalized to twinned particles, the most prominent examples are decahedra and icosahedra. The latter comprise five and twenty tetrahedral grains, respectively, that are patched together to fill space Marks (1983, 1984).
We are interested in the case where a NP is in equilibrium with a source of adsorbates \ceX. The free energy can then be written as the sum of the free energy of the clean surface and the change induced by adsorption of units of \ceX, i.e.
| (2) |
For an aqueous halide , we can approximate the surface free energy of adsorption on the right-hand side of Eq. (2) using total energies from DFT calculations by
| (3) |
To avoid a charged slab calculation, a thermodynamic cycle Sellers et al. (1996) is used to replace that would otherwise appear in Eq. (3) with the energy of a neutral system from which the appropriate multiple of the work function is subtracted.
In Eq. (3), the chemical environment, i.e., temperature, pressure, and concentration, is represented by the chemical potential . The surface free energy of adsorption is a linear function of where the slope is equal to the adsorbate surface area density . For fixed , the slope is furthermore proportional to the coverage , where is the area of the primitive surface cell. To obtain the dependence of on the chemical environment we assume ideal solution conditions, under which
| (4) |
Here, the -superscript indicates that the quantity is given at standard state, defined by and . The first term on the right-hand side of Eq. (4) is thus the chemical potential at the standard state conditions. Here, we calculate its value using a scheme in the spirit of Ref. Persson et al., 2012, where DFT calculations are combined with experimental reaction energies, in the present case taken from the curated and consistency-checked data provided in Ref. Hunenberger and Reif, 2011. (Details are provided in the first section of the SI.) Furthermore, the two first terms on the right-hand side of Eq. (3) contain surface-solvent interactions. Since explicit inclusion of water molecules at the DFT level is computationally expensive, they are accounted for here using an implicit solvation model Mathew et al. (2014); Mathew and Hennig (2016).
III Computational details
All DFT calculations were carried out with the Vienna ab initio simulation package Kresse and Hafner (1993) (VASP, version 5.4.4), which uses plane-wave basis sets Kresse and Furthmüller (1996) and the projector augmented wave method Blöchl (1994); Kresse and Joubert (1999). To accurately model surfaces well as bulk systems, the van-der-Waals density functional with consistent-exchange (CX) Berland and Hyldgaard (2014) was employed. For comparison, a subset of the calculations was also carried out using the local density approximation (LDA), Perdew-Burke-Ernzerhof (PBE),Perdew et al. (1996) and Perdew-Burke-Ernzerhof for solids (PBEsol) functionals Perdew et al. (2008). The plane-wave basis set was truncated at a cut-off energy of , and the electronic levels were smeared using a Gaussian scheme with smearing parameter . For Brillouin zone integration, Monkhorst-Pack and -centered grids were used depending on the symmetry of the unit cell, with a -point density of . Geometry optimization was performed for all systems, during which the atomic positions were allowed to relax until the forces were less than .
For the calculations of the bare surface energies, we employed the extrapolation approach described in Refs. Boettger, 1994,Fiorentini and Methfessel, 1996 using slabs of different thickness for each . For the adsorbate calculations, surfaces were modeled using slabs with an approximate thickness of where is the lattice constant of the parent crystal. Spurious interactions with periodic images were minimized by introducing a vacuum region of in the direction normal to the slabs. To account for interactions between surface and solvent, the VASPsol implicit solvation model Mathew et al. (2014); Mathew and Hennig (2016) was applied to both clean and adsorbate-covered slabs. In addition to the three low-index surfaces , , ,111For the missing-row reconstruction was included. adsorption was also modeled on slabs of the high-index surfaces , , , , , , , , and . For each slab halide coverages corresponding to were considered. On the surface, the coverage was realized in a unit cell. For , , and we included all commonly considered high-symmetry sites. For all other surfaces we employed Bayesian optimization to determine the most stable configurations Todorović et al. (2019).
The obtained surface energies were subsequently used to construct WSs of single crystalline as well as decahedral and icosahedral NPs and average (facet-weighted) surface energies using the wulffpack Python package Rahm and Erhart (2020).
IV Results and discussion
IV.1 Clean surface properties
We first assess the efficacy of various exchange-correlation (XC) functionals for accurately representing quantities important in the modeling of surface systems. To this end, the lattice constant, clean surface energy as well as the work function are reported for the late non-magnetic face-centered cubic transition metals (Table 1). The set of XC functionals includes LDA, PBE, and PBEsol, all of which are commonly used in surface calculations. This set is extended by the non-local CX functional, since several recent studies have highlighted the advantages of including non-local correlations for obtaining accurate results for surfaces Löfgren et al. (2016); Patra et al. (2017) as well as bulk systems Ilawe et al. (2015); Gharaee et al. (2017). For each combination of functional and quantity, mean absolute error (MAE) and mean absolute percentage error (MAPE) were calculated relative to available experimental data Haas et al. (2009); Tyson (1975); Tyson and Miller (1977); Derry et al. (2015).
| Quantity | Element | XC Functional | Exp. | |||
|---|---|---|---|---|---|---|
| LDA | PBE | PBEsol | CX | |||
| Cu | ||||||
| Ag | ||||||
| Au | ||||||
| (Å) | Pd | |||||
| Pt | ||||||
| MAE | ||||||
| MAPE | ||||||
| Cu | ||||||
| Ag | ||||||
| Au | ||||||
| (J) | Pd | |||||
| Pt | ||||||
| MAE | ||||||
| MAPE | ||||||
| Cu | ||||||
| Ag | ||||||
| Au | ||||||
| (eV) | Pd | |||||
| Pt | ||||||
| MAE | ||||||
| MAPE | ||||||
For the lattice constants, PBEsol and CX both offer comparable improvement over LDA and PBE, respectively. The calculated values are in quantitative agreement with previous benchmarks for bulk systems Gharaee et al. (2017), where it was found that CX outperforms PBEsol also when a wider range of bulk properties and materials is considered.
Experimentally, surface energies are commonly derived from surface tension measurements on liquid droplets, which provide a facet-weighted average surface energy Tran et al. (2016). Here, a significant improvement is seen in the MAPE values in going from conventional generalized gradient approximation (GGA) functionals to CX. In particular, while PBE gives reasonable results for surface energies of simple metals Tran et al. (2016), the MAPE of 35% found here suggests that caution should be exercised in the application of PBE to late transition metals. It is well-known that LDA, on the other hand, yields relatively accurate surface energies Vitos et al. (1998), which can, however, be attributed to an error-cancellation effect Patra et al. (2017). As can be seen from the MAPE values the systematic extension of DFT to include non-local interactions represented by CX leads to a slight improvement over LDA. The systematic increase in surface energy seen when comparing CX to either PBE or PBEsol reflects the contribution of non-local correlation to the energetic cost of cleaving a crystal to create a surface.
The work functions exhibit similar trends as the lattice constants, with PBE and LDA systematically under and overestimating experimental data, respectively. The MAPE is reduced by about when either PBEsol or CX are used instead, with the latter being slightly closer to the experimental values.
Overall, CX outperforms the other functionals over the range of elements and properties included in this comparison. Since both surface energy and work function appear explicitly in the surface free energy of adsorption in Eq. (3), CX is thus the preferred functional for the present purpose.
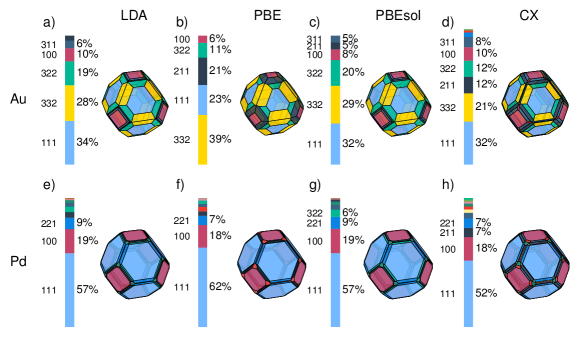
While XC functionals can exhibit large differences in predictions of surface energies, the equilibrium shape of a NP is sensitive to surface energy ratios rather than absolute values by virtue of Wulff’s theorem Eq. (1). For this reason, we also compare actual WSs obtained via the above set of functionals for Au and Pd. To give an accurate representation of the WS, the set of three low-index facets is further augmented by several high-index facets.
The WSs for single crystalline particles (Fig. 1) reveal that, while both Au and Pd particles have shapes derived from the regular truncated octahedron (RTO) with additional faceting provided by high-index surfaces, the fractional area occupied by the facets varies not only in magnitude, but also in ordering when the XC functional is changed. The differences are most pronounced in the case of Au, where a large portion of the surface is occupied by high index facets. For instance, PBE predicts and as the facets with highest occupancy at and , respectively. With CX, however, the order is reversed with of and only of . ThePBE results compare well with the Au and Pd Wulff constructions obtained using the same functional in Ref. Tran et al., 2016.
In conclusion, the choice of XC functional has ramifications that go beyond the degree of numerical agreement with experiment, and can lead to qualitative differences in predicted NP shapes.
IV.2 Particle morphology and the halogen group
Before presenting any results related to halide adsorption, we note that typical wet-chemical synthesis concentrations are on the order of . Hence, we use as a representative value for aqueous states throughout the remainder of the text, unless the concentration dependence is explicitly considered. Similarly, while variations in temperature and pressure can in principle be accounted for in Eq. (3), we restrict ourselves to ambient conditions.
The basic features of halogen adsorption on metal surfaces can be appreciated by observing the changes in surface adsorption energy as the adsorbate state is changed from the dimerized state to the aqueous ion. This is illustrated in Fig. 2 for the surface of Au and Pd. The results for the aqueous ions are given both with and without corrections for surface-solvent interactions provided by the VASPsol implicit solvation model.222 Due to problems internal to VASPsol, we were not able to obtain data for the fully solvated state in the case of \ceI^- (https://github.com/henniggroup/VASPsol/issues/34; accessed: 2019/10/15). Note that we use the thermodynamic sign convention where more negative surface free energies indicate greater stability. Furthermore, Fig. 2 shows the surface adsorption energies as given by Eq. (3) where the contribution from the clean surface is not included. Negative (positive) energies thus correspond to exothermic (endothermic) reactions.
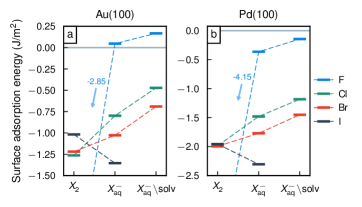
In the dimerized state, halogen adsorption strength correlates closely with electronegativity. This is clearly observed, for example, on (Fig. 2a, left) where the most electronegative halogens are also more strongly adsorbed. In going from dimer to solvated ion, however, the trend is reversed (Fig. 2a,b middle) and the adsorption strength decreases in the order . This reversal reflects differences in ion-solvent interaction, where light halide ions interact more strongly with the solvent resulting in weaker adsorption Habib and Bockris (1980). Similar results have previously been obtained from PBE calculations complemented by thermodynamic data Almora-Barrios et al. (2014). Including the surface-solvent interaction shifts the adsorption energy upward by more than . For \ceCl^- and \ceBr^- on , this shift is as large as the change in adsorption energy in going from dimerized state to aqueous ion, and for \ceF^- it can even result in a sign change of the adsorption energy. Therefore, it is clear these interactions cannot, in general, be neglected.
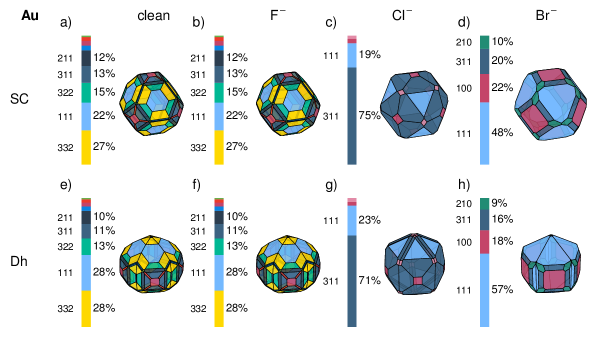
We now consider the influence of halide adsorption on NP shape. Here, the use of the generalized Wulff constructions enables us to also include decahedral NPs in our predictions. This requires knowledge of twin boundary energies, for which we obtained and with CX, in good agreement with experimental estimates Suzuki and Barrett (1958); Xu et al. (1991).
On Au NPs, adsorption of \ceF^- (Fig. 3b,f) is largely endothermic, and a distribution of facets primarily comprising and vicinal facets (Fig. 3b, f) is obtained, identical to a clean NP under aqueous solvation conditions (Fig. 3a,e). Adsorption of \ceCl^- is, on the other hand, exothermic and leads to changes in faceting. While the area fraction of remains similar to the clean case, with around for both single-crystalline and decahedral NPs, most high-index facets are eliminated. Indeed, the facet distribution is dominated by , which accounts for of the available area (Fig. 3c,g). Upon replacement of \ceCl^- by \ceBr^-, the area fractions again undergo significant changes resulting in a WS with , as well as smaller amounts of and (Fig. 3d,h).
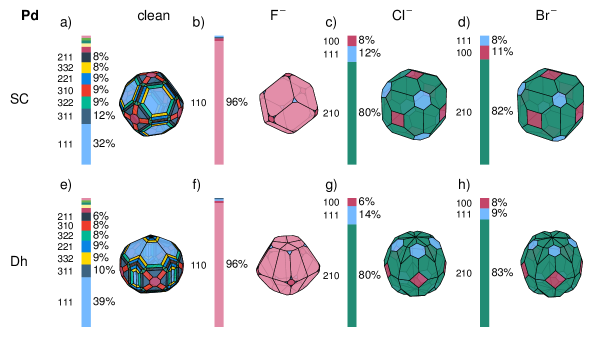
In the case of Pd, \ceF^- adsorption can be exothermic, in particular facets are stabilized relative to clean, aqueous NPs (Fig. 4a,b). For single-crystalline NPs this yields a rhombic dodecahedron, while one obtains a truncated pentagonal bipyramid in the case of decahedral symmetry (Fig. 4e,f). In contrast to Au, the shapes obtained in the presence of \ceCl^- or \ceBr^- are similar to each other (single-crystalline NPs: Fig. 4c,d; decahedral NPs: Fig. 4g,h) with about of their surfaces being facets alongside smaller fractions of and . We note that the prevalence of facets in this case is largely due to geometric constraints since the surface free energy is of similar magnitude for a wide range of concentrations (Fig. S2).
In combination, the significant differences in faceting with halide adsorption and NP composition show that morphology prediction for halide-covered NPs is non-trivial. It is also noteworthy that without the use of an implicit-solvation model, high-index facets do not appear in any of the above WSs (Figs. S3 and S4). Hence, even if the adsorbate state is properly accounted for in the thermodynamic analysis, failure to include surface-solvent interactions can result in qualitatively incorrect predictions.
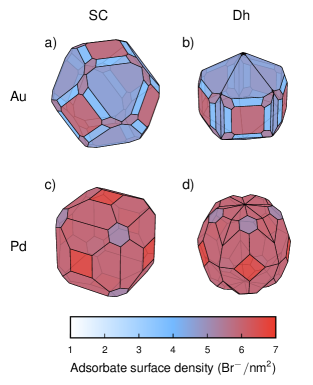
In addition to NP faceting, we can study the halide coverage, or surface area density. The analysis leads to the important observation that for both Au and Pd NPs, the area density of adsorbates at fixed bulk concentration is facet dependent. Considering for example \ceBr^- on Au (Fig. 5a) at a concentration of , the surface area density on and facets is and , respectively, corresponding to coverages of and . This can yield anisotropic shapes since growth can be hampered in the case of high coverage. In a kinetically controlled synthesis, in which the surface diffusion is slow compared to the arrival rate of monomers at the surface, this would promote growth on and turn octahedra into cubes Qi et al. (2015) while increasing the aspect ratio of decahedra Xia et al. (2013); Qi et al. (2019).
IV.3 Sensitivity to the chemical environment
Our thermodynamic model allows for the prediction of NP energetics and shape changes as a function of thermodynamic control parameters. The most relevant parameter in this case is the halide concentration, which in a typical NP synthesis is on the order of .
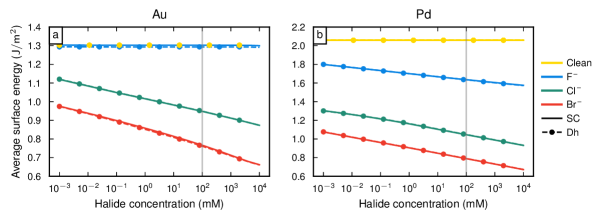
In applications where protecting the NPs against agglomeration is the primary concern, the reduction in the average (facet-weighted) surface energy with respect to the clean NP provides a measure of the overall stabilization that can be achieved by halide capping. The stabilization follows the expected energetic ordering (Fig. 6; also see Fig. 2). Increasing the halide concentration yields an exponential decrease in with the exception of \ceF^- on Au. In the latter case, since the adsorption is endothermic on many gold facets, no stabilization is observed. At a concentration of , \ceBr^- adsorption leads to a decrease of by and for Au and Pd, respectively. Thus, halide adsorption can significantly lower the average surface energy of the NP providing a quantitative measure for the efficacy of halides as capping agents.
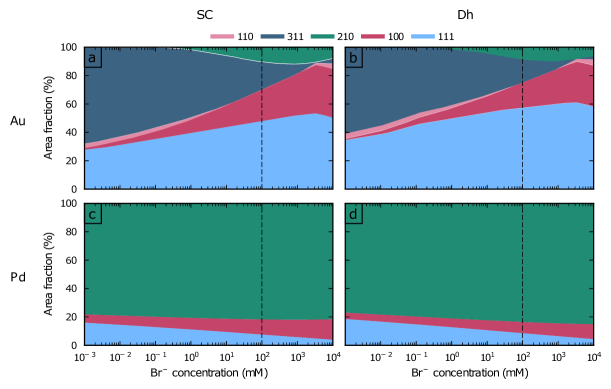
To complement the WSs presented in the previous section, we also map the facet area fractions as a function of the halide concentration (Fig. 7). For brevity, the results presented here are restricted to \ceBr^-, since this is arguably the most important halide in shape-controlled NP synthesis. The corresponding maps for \ceF^- and \ceCl^- can be found in the SI (Figs. S5 and S6.).
We observe that the sensitivity to Br concentration is largest for Au NPs, and crucially, that qualitative changes to the faceting can occur within the range of experimentally relevant concentrations. This is most clearly illustrated by the {310} facets, which can be eliminated by increasing the concentration to . For comparison, the area fraction at the representative concentration is (Fig. 7a,b dashed lines). Correspondingly, the amount of () increases from () to (). It should furthermore be noted that the concentration dependence is non-monotonic for the entire set of facets. For instance, the area fraction of facets attains a maximum at .
For Pd NPs, the facet area fractions (Fig. 7c,d) change monotonically with concentration and at a lower rate than for Au. Regardless of the concentration, facets represent about of the surface area and as the concentration increases the fraction of facets grows at the expense of .
The above analysis shows, in conjunction with the results presented for the halide substitutions (Fig. 3 and 4), that the shape of Au and Pd NPs can be tuned to some extent by changing either halide species or concentration. The effect is, however, not significant enough to render anisotropic shapes such as cubes thermodynamically stable.
V Conclusions and outlook
In this study, we have demonstrated how DFT calculations combined with an implicit-solvation model and experimental data can be used to formulate a thermodynamic model with the ability to predict the equilibrium shape and surface area density of halides on aqueous NPs under realistic conditions, including finite temperature, pressure and halide concentration. Our contribution thus helps bridge the gap between experimental and theoretical studies of aqueous NPs.
For Au and Pd particles, halide species and concentration play an important role in determining NP faceting. In particular for Au NPs, qualitative differences in faceting can be obtained by varying the concentration of \ceCl^- and \ceBr^-, the two halides most commonly encountered in wet-chemical synthesis. Here, the non-monotonic response of the distribution of facet area fractions to changes in concentration underscores the subtlety of NP shape prediction in complex environments and underscores the need for accurate atomistic simulations. We emphasize, however, that adsorption of halides alone cannot stabilize anisotropic shapes such as cubes or rod-like particles.
Furthermore, our calculations reveal that the halide surface area density is facet dependent and for both Au and Pd NPs the highest density is found on the facets. Our results are thus consistent with the picture of halides as capping-agents that can selectively passivate one or more facets and, given the right geometry and kinetic conditions, promote their growth Xia et al. (2013).
In light of the above conclusions regarding the relation between halides and shape anisotropy, it is evident that further investigations into the synergistic effects between halides and their cations, most notably cetyltrimethylammonium bromide (CTAB), are required. Some steps in this direction have already been taken using classical molecular dynamics (MD) Meena and Sulpizi (2013); Meena et al. (2016) as well as DFT simulations Almora-Barrios et al. (2014); Jain et al. (2014). In the case of classical MD, the reliability of any force-field description of the halide-metal interface must be carefully evaluated since traditional force-fields do not account for effects such as charge transfer and polarization at the interface Senftle et al. (2016); Geada et al. (2018). In the case DFT calculations, the thermodynamic model utilized in the present work is in principle straightforward to apply to systems where both anions and cations are present, but the accuracy is limited by the quality of the available thermodynamic data.
Another aspect of NP shape prediction that was deemed to be outside the scope of the present study concerns the treatment of finite size effects. It is well-known that the Wulff construction does not account for such effects and the predicted WSs can thus only be considered realistic for large particles. Quantifying the limit for when a NP can be considered large in this sense is important given the high area fractions predicted here for high-index facets such as and . More precisely, from a geometric point of view a NP needs to be large enough to accommodate stepped surfaces in the first place, and the energetic penalty incurred by the facet edges and corners needs to be considered. As a result, a small NP may end up exposing smaller amounts of vicinal facets then what is predicted by a particular WS.
Acknowledgments
This work was funded by the Knut and Alice Wallenberg Foundation (2014.0226), the Area of Advance Nano at Chalmers, the Swedish Research Council (2015-04153, 2018-06482), and the Strategic Swedish Research Initiative (RMA15-0052). Computer time allocations by the Swedish National Infrastructure for Computing at C3SE (Gothenburg), NSC (Linköping), and PDC (Stockholm) are gratefully acknowledged.
References
- Lohse et al. (2014) S. E. Lohse, N. D. Burrows, L. Scarabelli, L. M. Liz-Marzán, and C. J. Murphy, Chemistry of Materials 26, 34 (2014).
- Ghosh and Manna (2018) S. Ghosh and L. Manna, Chemical Reviews 118, 7804 (2018).
- Magnussen et al. (1995) O. M. Magnussen, B. M. Ocko, R. R. Adzic, and J. X. Wang, Physical Review B 51, 5510 (1995).
- Magnussen (2002) O. M. Magnussen, Chemical Reviews 102, 679 (2002).
- Nikoobakht and El-Sayed (2001) B. Nikoobakht and M. A. El-Sayed, Langmuir 17, 6368 (2001).
- Johnson et al. (2002) C. J. Johnson, E. Dujardin, S. A. Davis, C. J. Murphy, and S. Mann, Journal of Materials Chemistry 12, 1765 (2002).
- Chang et al. (2007) G. Chang, M. Oyama, and K. Hirao, Acta Materialia 55, 3453 (2007).
- Ha et al. (2007) T. H. Ha, H.-J. Koo, and B. H. Chung, The Journal of Physical Chemistry C 111, 1123 (2007).
- Si et al. (2012) S. Si, C. Leduc, M.-H. Delville, and B. Lounis, ChemPhysChem 13, 193 (2012).
- Hubert et al. (2008) F. Hubert, F. Testard, and O. Spalla, Langmuir 24, 9219 (2008).
- Meena et al. (2016) S. K. Meena, S. Celiksoy, P. Schäfer, A. Henkel, C. Sönnichsen, and M. Sulpizi, Physical Chemistry Chemical Physics 18, 13246 (2016).
- Almora-Barrios et al. (2014) N. Almora-Barrios, G. Novell-Leruth, P. Whiting, L. M. Liz-Marzán, and N. López, Nano Letters 14, 871 (2014).
- Lim et al. (2009) B. Lim, M. Jiang, J. Tao, P. H. C. Camargo, Y. Zhu, and Y. Xia, Advanced Functional Materials 19, 189 (2009).
- Peng et al. (2013) H.-C. Peng, S. Xie, J. Park, X. Xia, and Y. Xia, Journal of the American Chemical Society 135, 3780 (2013).
- Xiong et al. (2005) Y. Xiong, J. Chen, B. Wiley, Y. Xia, S. Aloni, and Y. Yin, Journal of the American Chemical Society 127, 7332 (2005).
- Zheng et al. (2014) Y. Zheng, J. Zeng, A. Ruditskiy, M. Liu, and Y. Xia, Chemistry of Materials 26, 22 (2014).
- Singh-Miller and Marzari (2009) N. E. Singh-Miller and N. Marzari, Physical Review B 80, 235407 (2009).
- Patra et al. (2017) A. Patra, J. E. Bates, J. Sun, and J. P. Perdew, Proceedings of the National Academy of Sciences 114, E9188 (2017).
- Asthagiri et al. (2003) D. Asthagiri, L. R. Pratt, and J. D. Kress, Physical Review E 68, 041505 (2003).
- Grossman et al. (2003) J. C. Grossman, E. Schwegler, E. W. Draeger, F. Gygi, and G. Galli, The Journal of Chemical Physics 120, 300 (2003).
- Persson et al. (2012) K. A. Persson, B. Waldwick, P. Lazic, and G. Ceder, Physical Review B 85, 235438 (2012).
- Murthy (2007) S. K. Murthy, Intenational Journal of Nanomedicine 2, 129 (2007).
- Dumas and Couvreur (2015) A. Dumas and P. Couvreur, Chemical Science 6, 2153 (2015).
- Tran et al. (2017) S. Tran, P.-J. DeGiovanni, B. Piel, and P. Rai, Clinical and Translational Medicine 6, 44 (2017).
- Wadell et al. (2015) C. Wadell, F. A. A. Nugroho, E. Lidström, B. Iandolo, J. B. Wagner, and C. Langhammer, Nano Letters 15, 3563 (2015).
- Namba et al. (2018) K. Namba, S. Ogura, S. Ohno, W. Di, K. Kato, M. Wilde, I. Pletikosić, P. Pervan, M. Milun, and K. Fukutani, Proceedings of the National Academy of Sciences 115, 7896 (2018).
- Thompson (2007) D. T. Thompson, Nano Today 2, 40 (2007).
- Pérez-Lorenzo (2012) M. Pérez-Lorenzo, The Journal of Physical Chemistry Letters 3, 167 (2012).
- Bej et al. (2016) A. Bej, K. Ghosh, A. Sarkar, and D. W. Knight, RSC Advances 6, 11446 (2016).
- Roman et al. (2014) T. Roman, F. Gossenberger, K. Forster-Tonigold, and A. Groß, Physical Chemistry Chemical Physics 16, 13630 (2014).
- Gossenberger et al. (2015) F. Gossenberger, T. Roman, and A. Groß, Surface Science Surface Science and Electrochemistry - 20 years later, 631, 17 (2015).
- Groß and Sakong (2019) A. Groß and S. Sakong, Current Opinion in Electrochemistry Bioelectrochemistry ? Electrocatalysis, 14, 1 (2019).
- Wulff (1901) G. Wulff, Zeitschrift für Krystallographie und Mineralogie 34, 449 (1901).
- Marks (1983) L. D. Marks, Journal of Crystal Growth 61, 556 (1983).
- Marks (1984) L. D. Marks, Philosophical Magazine A 49, 81 (1984).
- Sellers et al. (1996) H. Sellers, E. M. Patrito, and P. P. Olivera, Surface Science 356, 222 (1996).
- Hunenberger and Reif (2011) P. Hunenberger and M. Reif, Single-Ion Solvation: Experimental and Theoretical Approaches to Elusive Thermodynamic Quantities, Theoretical and Computational Chemistry Series (The Royal Society of Chemistry, 2011).
- Mathew et al. (2014) K. Mathew, R. Sundararaman, K. Letchworth-Weaver, T. A. Arias, and R. G. Hennig, The Journal of Chemical Physics 140, 084106 (2014).
- Mathew and Hennig (2016) K. Mathew and R. G. Hennig, arXiv: 1601.03346 (2016).
- Kresse and Hafner (1993) G. Kresse and J. Hafner, Physical Review B 47, 558 (1993).
- Kresse and Furthmüller (1996) G. Kresse and J. Furthmüller, Physical Review B 54, 11169 (1996).
- Blöchl (1994) P. E. Blöchl, Physical Review B 50, 17953 (1994).
- Kresse and Joubert (1999) G. Kresse and D. Joubert, Physical Review B 59, 1758 (1999).
- Berland and Hyldgaard (2014) K. Berland and P. Hyldgaard, Physical Review B 89, 035412 (2014).
- Perdew et al. (1996) J. P. Perdew, K. Burke, and M. Ernzerhof, Physical Review Letters 77, 3865 (1996).
- Perdew et al. (2008) J. P. Perdew, A. Ruzsinszky, G. I. Csonka, O. A. Vydrov, G. E. Scuseria, L. A. Constantin, X. Zhou, and K. Burke, Physical Review Letters 100, 136406 (2008).
- Boettger (1994) J. C. Boettger, Physical Review B 49, 16798 (1994).
- Fiorentini and Methfessel (1996) V. Fiorentini and M. Methfessel, Journal of Physics: Condensed Matter 8, 6525 (1996).
- Note (1) For the missing-row reconstruction was included.
- Todorović et al. (2019) M. Todorović, M. U. Gutmann, J. Corander, and P. Rinke, npj Computational Materials 5, 35 (2019).
- Rahm and Erhart (2020) J. Rahm and P. Erhart, Journal of Open Source Software 5, 1944 (2020).
- Löfgren et al. (2016) J. Löfgren, H. Grönbeck, K. Moth-Poulsen, and P. Erhart, The Journal of Physical Chemistry C 120, 12059 (2016).
- Ilawe et al. (2015) N. V. Ilawe, J. A. Zimmerman, and B. M. Wong, Journal of Chemical Theory and Computation 11, 5426 (2015).
- Gharaee et al. (2017) L. Gharaee, P. Erhart, and P. Hyldgaard, Physical Review B 95, 085147 (2017).
- Haas et al. (2009) P. Haas, F. Tran, and P. Blaha, Physical Review B 79, 085104 (2009).
- Tyson (1975) W. R. Tyson, Canadian Metallurgical Quarterly 14, 307 (1975).
- Tyson and Miller (1977) W. R. Tyson and W. A. Miller, Surface Science 62, 267 (1977).
- Derry et al. (2015) G. N. Derry, M. E. Kern, and E. H. Worth, Journal of Vacuum Science and Technology A 33, 060801 (2015).
- Tran et al. (2016) R. Tran, Z. Xu, B. Radhakrishnan, D. Winston, W. Sun, K. A. Persson, and S. P. Ong, Scientific Data 3, sdata201680 (2016).
- Vitos et al. (1998) L. Vitos, A. V. Ruban, H. L. Skriver, and J. Kollár, Surface Science 411, 186 (1998).
- Note (2) Due to problems internal to VASPsol, we were not able to obtain data for the fully solvated state in the case of \ceI^- (https://github.com/henniggroup/VASPsol/issues/34; accessed: 2019/10/15).
- Habib and Bockris (1980) M. A. Habib and J. O. Bockris, in Comprehensive Treatise of Electrochemistry: The Double Layer, edited by J. O. Bockris, B. E. Conway, and E. Yeager (Springer US, Boston, MA, 1980) pp. 135–219.
- Suzuki and Barrett (1958) H. Suzuki and C. S. Barrett, Acta Metallurgica 6, 156 (1958).
- Xu et al. (1991) J.-h. Xu, W. Lin, and A. J. Freeman, Physical Review B 43, 2018 (1991).
- Qi et al. (2015) X. Qi, T. Balankura, Y. Zhou, and K. A. Fichthorn, Nano Letters 15, 7711 (2015).
- Xia et al. (2013) X. Xia, S. Xie, M. Liu, H.-C. Peng, N. Lu, J. Wang, M. J. Kim, and Y. Xia, Proceedings of the National Academy of Sciences 110, 6669 (2013).
- Qi et al. (2019) X. Qi, Z. Chen, T. Yan, and K. A. Fichthorn, ACS Nano 13, 4647 (2019).
- Meena and Sulpizi (2013) S. K. Meena and M. Sulpizi, Langmuir 29, 14954 (2013).
- Jain et al. (2014) T. Jain, A. R. Tehrani-Bagha, H. Shekhar, R. Crawford, E. Johnson, K. Nørgaard, K. Holmberg, P. Erhart, and K. Moth-Poulsen, Journal of Materials Chemistry C 2, 994 (2014).
- Senftle et al. (2016) T. P. Senftle, S. Hong, M. M. Islam, S. B. Kylasa, Y. Zheng, Y. K. Shin, C. Junkermeier, R. Engel-Herbert, M. J. Janik, H. M. Aktulga, T. Verstraelen, A. Grama, and A. C. T. v. Duin, npj Computational Materials 2, 1 (2016).
- Geada et al. (2018) I. L. Geada, H. Ramezani-Dakhel, T. Jamil, M. Sulpizi, and H. Heinz, Nature Communications 9, 1 (2018).