An intermittent extreme BL Lac: MWL study of 1ES 2344+514 in an enhanced state
Abstract
Extreme High-frequency BL Lacs (EHBL) feature their synchrotron peak of the broadband spectral energy distribution (SED) at 1017 Hz. The BL Lac object 1ES 2344+514 was included in the EHBL family because of its impressive shift of the synchrotron peak in 1996. During the following years, the source appeared to be in a low state without showing any extreme behaviours. In August 2016, 1ES 2344+514 was detected with the ground-based -ray telescope FACT during a high -ray state, triggering multi-wavelength (MWL) observations.
We studied the MWL light curves of 1ES 2344+514 during the 2016 flaring state, using data from radio to VHE rays taken with OVRO, KAIT, KVA, NOT, some telescopes of the GASP-WEBT collaboration at the Teide, Crimean, and St. Petersburg observatories, Swift-UVOT, Swift-XRT, Fermi-LAT, FACT and MAGIC. With simultaneous observations of the flare, we built the broadband SED and studied it in the framework of a leptonic and an hadronic model.
The VHE -ray observations show a flux level of 55% of the Crab Nebula flux above 300 GeV, similar to the historical maximum of 1995. The combination of MAGIC and Fermi-LAT spectra provides an unprecedented characterization of the inverse-Compton peak for this object during a flaring episode. The index of the intrinsic spectrum in the VHE -ray band is . We find the source in an extreme state with a shift of the position of the synchrotron peak to frequencies above or equal to Hz.
Keywords:BL Lacertae objects: individual: 1ES 2344+514 – galaxies: active – gamma-rays: galaxies
1 Introduction
Blazars00footnotetext: corresponding authors: M. Manganaro, A. Arbet Engels, D. Dorner. contact.magic@mpp.mpg.de
also member of FACT Collaboration.
also member of MAGIC Collaboration. are radio-loud Active Galactic Nuclei (AGN), whose relativistic jets are aligned along our line of sight. A common classification of blazars into two main subcategories of BL Lac objects (BL Lacs, after the BL Lacertae object) and Flat Spectrum Radio Quasars (FSRQ) is based on the properties of their optical spectra (Urry &
Padovani, 1995). BL Lacs are generally characterized by their very weak or absent emission/absorption lines in the optical band. The majority of blazars emitting in the very-high-energy (VHE, GeV) band belong to the BL Lacs family (57 so far)111http://tevcat.uchicago.edu/,Wakely &
Horan (2008).
Typically, BL Lacs display a broadband spectral energy distribution (SED) characterized by a two-humped structure (Ghisellini et al., 2017). The first hump of the SED, known as the synchrotron bump, is attributed to synchrotron radiation by relativistic electrons. In some cases, the host galaxy contributes to the first hump of the SED in the optical and infrared band, making a careful correction (see i.e. Nilsson et al., 2007) necessary. The high energy bump is often identified as being produced by inverse-Compton (IC) scattering of the synchrotron photons by the same population of electrons. This scenario represents the simplest leptonic model (one-zone Synchrotron Self Compton, SSC), but there are competing models including hadronic components (e.g. Cerruti et al., 2015). The position of the synchrotron peak is widely used to further define three different types of BL Lac objects: the low, intermediate, and high-frequency BL Lac objects (see Padovani & Giommi, 1995; Böttcher, 2007, and references therein). LBL (low-frequency BL Lacs) have their synchrotron peak in the sub-millimeter to infrared wavelengths ( Hz), while HBL (high-frequency peaked BL Lacs) in the ultraviolet (UV) to X-ray bands ( Hz). IBL (intermediate-frequency BL Lacs) feature their synchrotron peak in between the above mentioned ranges (Padovani & Giommi, 1995).
In the past decades, new observations have revealed (Aharonian et al., 2007a, b, c; Acciari et al., 2010) that a handful of sources show a at unusually high X-ray energies with 1017 Hz. Based on this extreme behaviour, Costamante et al. (2001) proposed an additional category of BL Lacs, the extreme high-frequency BL Lacs (EHBL). As a consequence of an unusually high , EHBL can also have the IC hump peaking at unusually high frequency in the -ray band. Thus, the shift of the whole SED generally translates also in a particularly hard X-ray and VHE -ray spectra with a photon index .
Despite the above-mentioned spectral features characterizing EHBL, recent multi-wavelength (MWL) observations show that such objects can have very different temporal behaviour. Some of them, such as 1ES 0229+200 (Aharonian et al., 2007c) the archetypal EHBL, seem to constantly exhibit extreme properties. On the other hand, other objects have been identified to belong to the EHBL family only on a temporary basis (Ahnen et al., 2018; Foffano et al., 2019). The TeV detected BL Lac 1ES 2344+514 belongs to the latter group. So far, this object showed a significantly above Hz only during flaring state, as reported by Giommi et al. (2000).
Located at a redshift of z=0.044 (Perlman et al., 1996), 1ES 2344+514 was discovered by the Einstein Slew Survey (Elvis et al., 1992) in the 0.2 keV–4 keV energy range.
The first detection in VHE rays was obtained in 1995 by the Whipple 10 m telescope during an intense flare, with a flux corresponding to % of the Crab Nebula flux above 350 GeV (Catanese et al., 1998; Schroedter et al., 2005). In 1996, 1ES 2344+514 showed a very variable behaviour in the X-ray band (Giommi et al., 2000) on a timescale of approximately 5 ks when the source was at its brightest state: impressive rapid changes of the X-ray spectrum slope, together with a large shift by a factor of 30 or more of , put this source for the first time in the EHBL family. An analogous behaviour was observed a few months later in another source, Mrk 501, during an outburst in April 1997 (Pian et al., 1998). In this case, the synchrotron peak shifted to energies around or above 100 keV, making the source an additional member of the EHBL family. It should be noted that recently in 2012, Mrk 501 also exhibited an intermittent extreme behaviour during a low state (Ahnen et al., 2018).
Following the extreme event of 1ES 2344+514, MWL campaigns have been organized to study the source (Godambe et al., 2007; Albert et al., 2007; Acciari et al., 2011; Aleksić et al., 2013) and to model the broadband SED using simultaneous and quasi-simultaneous data. During most of these campaigns, the source was found in a lower state in the X-ray and VHE -ray band with respect to previous observations (Catanese et al., 1998; Giommi et al., 2000), so the broadband SED obtained were mainly describing the source during low activity. In all those occasions, a one-zone SSC model was found to well describe the data. Different observations by IACT (Imaging Atmospheric Cherenkov Telescopes) over the past years have revealed the source to have variable flux states in the VHE -ray band. The integral flux is generally less than 10% of the Crab Nebula flux, excluding two short flares with 60% and 50% of the Crab Nebula flux level (Catanese et al., 1998; Acciari et al., 2011). More recent VHE -ray data for this source have been presented in Allen et al. (2017), where the temporal properties of 1ES 2344+514 are studied on short and long timescales in the VHE -ray band, and no significant flaring activity was observed since 2008.
In the present work, we report on the observations of a VHE -ray flare of 1ES 2344+514 in August 2016, detected by FACT (First G-APD Cherenkov Telescope), and followed up by many instruments, including the MAGIC (Major Atmospheric Gamma Imaging Cherenkov) telescopes, the Fermi-LAT (Large Area Telescope), Swift-XRT and Swift-UVOT, TCS (Telescope Carlos Sánchez), KAIT (Katzman Automatic Imaging Telescope), KVA (Kungliga Vetenskapsakademien), Stella, LX-200, AZT-8, NOT (Nordic Optical Telescope) IAC80 and OVRO (Owens Valley Radio Observatory). We collected a dataset from simultaneous and quasi-simultaneous MWL observations of a flaring state. FACT and MAGIC are both IACT devoted to the study of VHE rays. It is worth to note that, for this source, the combination of Fermi-LAT and MAGIC data for the first time offers an unprecedented characterisation of the IC peak during a flaring state.
The paper is structured as follows. In Sect. 2, the details of the observations performed by the instruments involved are reported, together with the description of the dedicated analysis. In Sect. 3, the MWL light curves and their variability are discussed. Sect. 4 is devoted to the analysis of the spectra in the VHE -ray and X-ray band, to describe the IC and the synchrotron peak respectively. In Sect. 5, the broadband SED is presented together with the modeling, while in Sect. 6, we discuss in detail the extreme behaviour of the source during this particular flaring state. Conclusions are drawn in Sect. 7.
2 Multi-wavelength Observations
In this section, the details of the observations and the data analysis for the various instruments are reported.
2.1 VHE -ray observations with FACT and MAGIC
The FACT telescope, located at the Observatorio del Roque de los Muchachos (ORM) in La Palma, has been observing at TeV energies since October 2011 (Anderhub et al., 2013). The excellent performance and stability of the used semi-conductor photosensors (Biland et al., 2014) combined with the observing strategy maximizes the observation time and minimizes the observational gaps (Dorner et al., 2019). An automatic on-site quick-look analysis provides with low latency publicly available results222https://fact-project.org/monitoring and allows for More details on the analysis can be found in Appendix A.
1ES 2344+514 has been monitored by FACT since August 2012 for a total of more than 1950 hours (status at October 2019). When the flux found in the quick-look analysis exceeds 50% of the flux of the Crab Nebula at TeV energies, an alert is issued to MWL partners. For 1ES 2344+514, seven flare alerts have been issued in five years. One of these alerts was sent on MJD 57610 (10 August 2016) and triggered the MWL campaign presented here. The dataset used in this study includes 118.6 hours after data-quality selection from 65 nights between MJD 57568 (29 June 2016) and MJD 57645 (14 September 2016). To remove data obtained during bad weather, the cosmic-ray rate (Hildebrand et al., 2017) has been used after correcting it for the effect of zenith distance and threshold, as described in Mahlke et al. (2017) and Bretz (2019). The light curve has been determined using the analysis chain described in Beck et al. (2019) calculating the excess rate using the Lightcurve Cut. Based on the excess rate of the Crab Nebula, the standard candle at TeV energies, the dependencies of the excess rate from trigger threshold (which changes with the ambient light conditions) and zenith distance are determined and corrected for. Also the correction for the effect of the Saharan Air Layer (SAL) is applied (details in Appendix A). Using simulated data, the energy threshold of this analysis is determined to be 775 GeV for a Crab-Nebula-like spectrum. For a harder spectrum, as measured for 1ES 2344+514 at VHE rays during previous observing campaigns, the energy threshold is accordingly higher ( GeV for a spectral slope of 2.46 as in Allen et al., 2017).
MAGIC is a stereoscopic system consisting of two 17 m diameter IACT located at the ORM, on the Canary Island of La Palma. The current sensitivity for observations at small angular distances from the zenith (zd: ) above 289 GeV is of the Crab Nebula flux in 50 h (Aleksić et al., 2016).
MAGIC started to observe 1ES 2344+514 on MJD 57611 (11 August 2016), triggered by the enhanced activity in the VHE range revealed by FACT. We collected data in the zenith distance range of and the analysis was performed using the standard MAGIC analysis framework MARS (Zanin et al., 2013; Aleksić et al., 2016). After the applied quality cuts, the surviving events amounted to N; N; N in a total of 0.87 hr of data after quality cuts. A full description of the MAGIC systematic uncertainties can be found in Aleksić et al. (2016) and references therein. The source was detected with a significance of in 0.62 hr. The flux above 300 GeV was , which corresponds to the 55% of the Crab Nebula flux in the same energy range.
The following night, MJD 57612 (12 August 2016), MAGIC observed again the source for 0.48 hr, and found a more than three times lower flux with respect to the previous night, corresponding to above 300 GeV (16% of the Crab Nebula flux above 300 GeV). The significance for MJD 57612 (12 August 2016) was found to be in 0.48 hr of observations.
2.2 HE -ray observations with Fermi-LAT
The LAT is a pair-conversion telescope on board the Fermi satellite and has been monitoring the high-energy (HE, 0.1 GeV GeV) -ray sky for almost 12 yr. The instrument is able to cover a wide energy range from 20 MeV to GeV (Atwood et al., 2009; Ackermann et al., 2012). The LAT normally operates in survey mode with an all-sky coverage on a hr timescale. The analysis presented here was carried out using the unbinned-likelihood tools from the version v10r0p5 of the Fermi Science Tools software333http://fermi.gsfc.nasa.gov/ssc/.
For this work, we considered a region of interest (ROI) with a radius of 15∘ around 1ES 2344+514 and selected Source class events in an energy range from 0.1 GeV to 300 GeV. In addition, we applied a cut of 52∘ for the rocking angle as well as a maximum zenith distance of 100∘ to reduce contamination from the Earth limb photons. We used the instrument response function P8R2_SOURCE_V6 and the diffuse background models444http://fermi.gsfc.nasa.gov/ssc/data/access/lat/
BackgroundModels.html gll_iem_v06 and iso_P8R2_SOURCE_V6_v06.
A first unbinned-likelihood analysis was performed considering LAT data over a 6-month period between MJD 57509 (01 May 2016) and MJD 57691 (30 October 2016). All point sources from the 3FGL catalog (Acero
et al., 2015) within 15∘ from 1ES 2344+514 were included in the model. During the fit, the flux normalisations and the spectral parameters of the sources were free to vary, but were fixed to the catalog values for the sources which are located further than 6∘ from 1ES 2344+514 or have a detection significance in the 3FGL catalog lower than . As in the 3FGL catalog, we modeled 1ES 2344+514 with a simple power law with index . After this first fit, sources resulting in a test statistics TS (Mattox
et al., 1996) were removed from the model and a second unbinned-likelihood analysis was performed considering the simplified model. We also searched for new sources potentially detected by the LAT within 6∘ from the target. A TS sky map does not reveal significant sources not included in the 3FGL or in the 4FGL catalogs. In addition, we note that none of sources reported in the 4FGL catalog, but absent from the 3FGL catalog, were significantly detected.
The output model from the second unbinned-likelihood analysis was used to build a light curve between MJD 57567.5 (28 June 2016) and MJD 57644.5 (13 September 2016) in the 0.3 GeV–300 GeV energy range. For the light curve calculation, the spectral shape of 1ES 2344+514 and the normalisation of the diffuse background models were left free to vary. All the remaining sources had their spectral shapes parameters fixed to the values obtained from the second unbinned-likelihood analysis. Since 1ES 2344+514 is a faint source for LAT, we adopted a 7 days binning (Abdo
et al., 2009).
For time bins resulting in a detection with a TS below 4, we quote an upper limit at 95% confidence level (C.L.).
Over the period covered by the light curve, we report a clear detection with TS . The spectrum is best described with a power-law index of . To build the broadband SED used for the modeling, we consider a spectrum averaged over 1 month centred around the MAGIC observations (MJD 57596.5 to MJD 57626.5). The best-fit spectral index is in this case (TS ).
2.3 X-ray observations with Swift-XRT
The Neil Gehrels Swift observatory (Swift) has pointed to the source eight times from August 2016 to November 2016. The raw images by the X-ray Telescope (XRT, Burrows et al., 2004) onboard the Swift satellite, are analyzed. These eight observations, performed in photon counting mode for the period from MJD 57613.52 (13 August 2016) to MJD 57696.18 (4 November 2016), have a total exposure time of hr with an average integration time of 0.44 hr each. Following the procedure described by Fallah Ramazani et al. (2017) and assuming fixed equivalent Galactic hydrogen column density (Kalberla et al., 2005), we fitted the spectrum of each observation assuming all possible combination of pixel-clipping together with two mathematical models (power law and log parabola), and normalization energy keV. During the MAGIC campaign, the five X-ray spectra during the MWL campaign are quite hard (photon index, ) and in all cases they can be described by a power-law model. The constant flux () hypothesis is rejected at more than C.L..
2.4 UV observations with Swift-UVOT
The UV data of 1ES 2344+514 were obtained by the Swift-UVOT telescope in three UV bands (W1, M2 and W2, Roming et al., 2005). The aperture photometry analysis was performed using standard Swift/UVOT software tools available within the HEASOFT package (version 6.24) along with calibration data from the latest release of CALDB (version 20170922). An aperture radius of 5 arcsec was used for all the filters. The background flux level was estimated in a circle of 20 arcsec radius located close to 1ES 2344+514. Both background and source regions were verified not to be contaminated with light from any nearby objects. The fluxes were dereddened following the Equation (2) from Roming et al. (2009) using the value of (Schlafly & Finkbeiner, 2011). In the UV band, the contribution of the host galaxy was negligible.
2.5 Optical and near-infrared observations with Tuorla, WEBT and KAIT
The Tuorla blazar monitoring program555http://users.utu.fi/kani/1m/ obtained optical ( band, Cousins) data of the source between MJD 57500 (22 April 2016) and MJD 57650 (19 September 2016). The Kungliga Vetenskapsakademien (KVA) telescope and Nordic Optical Telescope (NOT), both located at the ORM, were used for these observations. The data are analyzed using the differential photometry method described by Nilsson et al. (2018).
Additional optical and near-infrared data have been acquired thanks to the Whole Earth Blazar Telescope666http://www.oato.inaf.it/blazars/webt/ (WEBT, e.g. Villata et al., 2007; Raiteri et al., 2017) consortium. The WEBT was born in 1997 with the aim of organising monitoring campaigns on specific blazars in a MWL context. In 2007, the WEBT started the GLAST-AGILE Support Program (GASP, e.g. Villata et al., 2009), to provide low-energy data of a list of selected objects that could complement the high-energy observations by the -ray satellites. 1ES 2344+514 is one of the sources regularly monitored within the GASP. In this framework, observations were performed at the Crimean (AZT-8), St. Petersburg (LX-200), and Teide (IAC80, STELLA and TCS telescopes) observatories.
From the observed -band flux densities of the source we subtracted the contribution by the host galaxy and nearby companions according to the prescriptions by Nilsson et al. (2007). This contribution depends on both the aperture radius adopted for the photometry and the seeing. We then corrected for the Galactic extinction from (Schlafly & Finkbeiner, 2011), as it was done with UVOT data sample. Intercalibration among the different datasets was refined by checking the consistency of the R-band light curve.
Optical images of 1ES 2344+514 were obtained with the Katzman Automatic Imaging Telescope (KAIT; Filippenko et al., 2001) at the Lick Observatory. All images were reduced using a custom pipeline (Ganeshalingam et al., 2010) before doing the photometry. We applied a 9-pixel aperture (corresponding to ) for photometry. Several nearby stars were chosen from the Pan-STARRS1777http://archive.stsci.edu/panstarrs/search.php catalog for calibration, their magnitudes were transformed into the Landolt magnitudes using the empirical prescription presented by Tonry et al. (2012), equation 6. All the KAIT images were taken without filter (namely in band), which is the closest to the filter (see Tonry et al., 2012). We therefore calibrate all the band result to the Pan-STARRS1 -band magnitude. Data from KAIT have been as well corrected for the host-galaxy contribution together with the other optical data, with the procedure described above.
In the near-infrared (NIR), data were obtained at the Teide Observatory with the TCS telescope in the framework of the GASP-WEBT collaboration. To estimate the contribution of the host galaxy to the JHK photometry, we proceeded as done e.g. in Raiteri et al. (2010) for the host galaxy of BL Lacertae. We used a de Vaucouleurs galaxy profile with an effective radius of 10.9 arcsec (Nilsson et al., 2007) to estimate the host-galaxy contribution within the aperture radius used (10 arcsec). This resulted in 48% of the total host flux. We corrected the observed magnitude of the host, (Nilsson et al., 2007) for the Galactic extinction and applied the Mannucci et al. (2001) colour indices for elliptical galaxies to estimate the deabsorbed magnitudes of the host in bands. We converted them into absorbed flux densities and subtracted 48% of these values from the observed source fluxes. Finally, we corrected for the Galactic extinction values from (Schlafly & Finkbeiner, 2011) to get the deabsorbed jet fluxes.
2.6 Radio observations with OVRO
The 15 GHz data of 1ES 2344+51.4 were obtained within the OVRO 40-m Telescope blazar monitoring program (Richards et al., 2011). The OVRO 40 m uses off-axis dual-beam optics and a cryogenic pseudo-correlation receiver with a 15 GHz centre frequency and 3 GHz bandwidth. Calibration is achieved using a temperature-stable diode noise source to remove receiver gain drifts and the flux density scale is derived from observations of 3C 286 assuming the Baars et al. (1977) value of 3.44 Jy at 15.0 GHz. The systematic uncertainty of about 5% in the flux density scale is not included in the error bars. Complete details of the reduction and calibration procedure can be found in Richards et al. (2011).
3 Analysis of the MWL light curves
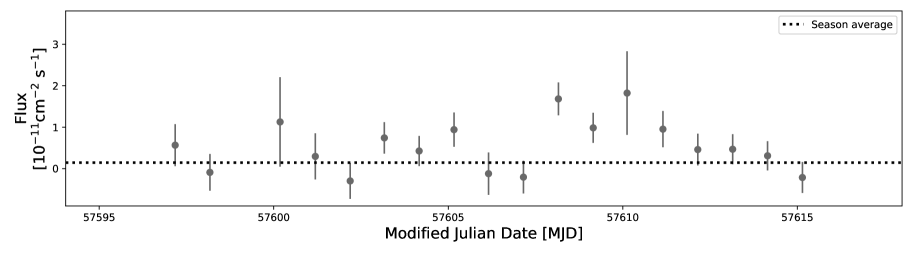
The MWL light curves from radio to VHE energies are shown in Fig. 1 and include all observations from MJD 57567 to MJD 57645 (20 June 2016 to 14 September 2016). The MAGIC, Swift-XRT, Swift-UVOT, optical & OVRO light curves are daily binned. The Fermi-LAT and FACT light curves are both 7-day binned. As the VHE flux observed by FACT after MJD 57620 (20 August 2016) is consistent with no signal and showing no significant variability, the last FACT time bin is integrated over a period of month. For comparison purposes, we show as dashed black lines the seasonal average (from June 2016 to December 2016) in the FACT light curve, and the 7-years average taken from Acciari et al. (2011) in the MAGIC light curve. Regarding Fermi-LAT and Swift-XRT observations, we select as reference values the flux from the 3FGL catalog (Acero et al., 2015) and the low flux measured by Giommi et al. (2000) in 1998, respectively.
The MAGIC observations were triggered thanks to the FACT detection of an enhanced state on MJD 57610 (10 August 2016). On MJD 57611 (11 August 2016), the MAGIC measurements indeed show a strong flaring episode in the VHE -ray band, which corresponds to GeV) cm-2 s-1. In order to directly compare with the Whipple observations, we compute the flux for the 11 August 2016 (MJD 57611) also above 350 GeV and obtain GeV) cm-2 s-1, corresponding to of the Crab Nebula flux, which is comparable to the historical maximum.
In the following night (MJD 57612–12 August 2016), a strong decrease is visible with GeV) cm-2 s-1, corresponding to of the Crab Nebula flux. Consequently, we observe a reduction of the flux by a factor . It therefore constitutes a clear indication of a day timescale variability, which was already reported in Acciari et al. (2011) as well as during the 1995 historical flare. So far, no significant intra-night variability in the VHE -ray band has been detected for 1ES 2344+514. Significant variability on such short timescale is also not found during any of the MAGIC and FACT observations. The most recent long-term study of VHE -ray emission from 1ES 2344+514 was published by the VERITAS collaboration (Allen et al., 2017). Despite a flux variability detected from seasons to season, the observations from 2008 to 2015 showed no significant flare. Over this period of approximately 7 years, the averaged flux is of the Crab Nebula flux. When assuming this state as the emission baseline, the MAGIC observations performed on MJD 57611 (11 August 2016) reveal a -fold higher flux.
The FACT long-term light curve also displays an enhanced flux level of cm-2 s-1 above 810 GeV between MJD 57603 (03 August 2016) and MJD 57615 (15 August 2016). This corresponds to of the Crab Nebula flux, which is above the seasonal average ( of the Crab Nebula; dashed line in the top panel of Fig. 1). The last time bin, averaged over about one month, shows that the source enters again a low state after MJD 57620 (20 August 2016). Over the latter period, the source is not significantly detected by FACT. The measured flux lies below the seasonal average. The computation of an upper-limit at 95% C.L. results in cm-2 s-1 ( of the Crab Nebula flux).
In this work, we present for the first time simultaneous HE and VHE -ray observations during a flaring state of 1ES 2344+514. The -LAT 0.3 GeV-300 GeV light curve is shown in the third panel from the top in Fig. 1. The firm detection (TS = 110.5) obtained between MJD 57567.5 (28 June 2016) and MJD 57644.5 (13 September 2016) allows an unprecedented constrain of the IC bump of the SED. The highest weekly averaged flux seen by LAT during this campaign is –300 GeV) cm-2 s-1 and is temporally coincident with the VHE high state observed by MAGIC and FACT. Nevertheless, the relatively large statistical uncertainty prevents to claim a significant HE flux increase, which could be associated to the VHE flare. We do not find any sign of short-term variability based on a 2-days binning light curve close to the VHE flare. Between MJD 57602.5 (2 August 2016) and MJD 57609.5 (9 August 2016) the FACT light curve is at its maximum and reveals an enhanced activity over several days in the VHE -ray band. In the same time period, LAT observations only results in a TS below 3 and an upper limit at 95% C.L. is quoted. We stress that the low TS is mainly due to a small exposure that is about 14 times lower than for the other time bins, and may not be caused by a drop in the GeV flux. Between MJD 57567.5 (28 June 2016) and MJD 57644.5 (13 September 2016), the averaged flux yields –300 GeV) cm-2 s-1. This amounts to a flux that is around times higher than what is reported in the 3FGL catalog and confirms an enhanced state during the overall studied period. The best fit spectral parameters using a power-law model result in a spectrum with a photon index of = .
The VHE -ray flaring episode is also accompanied with an elevated X-ray emission state. The first Swift-XRT observation took place on MJD 57613 (13 August 2016). The Swift-XRT daily binned light curve shows an energy flux of erg cm-2 s-1 close to the simultaneous MAGIC-FACT observations. In comparison with the average flux obtained from the multi-year Swift-XRT light curve shown in Aleksić et al. (2013), this yields an approximately three times higher energy flux. However, we note that such emission state remains moderately high compared to the flare that happened in December 2007, where a peak flux of erg cm-2 s-1 was detected (Acciari et al., 2011). Unfortunately, no strictly simultaneous X-ray observations are available at the highest VHE -ray state seen by MAGIC on MJD 57611 (11 August 2016). Thus, the possibility of a higher X-ray flux during the latter day compared to MJD 57613 (13 August 2016) remains.
The light curve from Swift-UVOT is shown in the fourth panel from the bottom. The points are simultaneous with the X-ray light curve, and they show a hint of activity after the VHE -ray flare, a short period of time which unfortunately is not covered by the other instruments.
We collected optical data acquired by several instruments in the band. The best sampled curve was obtained with the KAIT telescope. The highest flux density in the optical band is registered on MJD 57595 (26 June 2016), which is few days before the highest VHE -ray flux observed by MAGIC, MJD 57611 (11 August 2016). It corresponds to 1.89 mJy which is not particularly high for this source (see e.g. Albert et al., 2007).
The maximum flux density in the radio band is observed on MJD 57631 (31 August 2016) and corresponds to 0.201 Jy. The latter value is slightly higher than the averaged one ( Jy) recorded in Aleksić et al. (2013), making the radio light curve interesting: it would have been important to complement the radio data with a VLBI (Very Long Baseline Interferometry) map, which can identify possible emitted knots or reconnections in the jet, but unfortunately there are none available which could be considered for our study. 1ES 2344+514 is very faint usually for VLBI observations.
As the optical ( band) and OVRO data are better sampled with respect to the other wavebands, we use the Discrete Correlation Function (Edelson & Krolik, 1988) to search for correlations with potential time lag. No significant correlation between these two bands was found.
3.1 Variability
Based on the data shown in Fig. 1, we carry out a search for flux variability in the different energy bands.
As mentioned in the previous section, VHE variability has been observed from yearly to daily timescale for this object. The strong flux decrease between the two MAGIC observations constitutes an additional clear evidence of variability at a timescale of day. Unfortunately, because of the limited amount of available data, more sophisticated variability analysis based on MAGIC data is not possible. The much larger dataset collected by FACT offers the possibility to search for variability on a longer timescale. A fit of a constant flux to the weekly binned light curve yields a , based on which the hypothesis of a constant emission can be rejected at a level.
A variability index of in the 3FGL catalog indicates that 1ES 2344+514 is unlikely (<1%) a steady HE emitter (Acero et al., 2015). Compared to other typical TeV blazars such as Mrk 421 () or Mrk 501 () this value is rather low, but remains significantly higher than other established EHBL like 1ES 0229+200 () or 1ES 2037+521 (). A constant fit to the Fermi-LAT light curve shown in Fig. 1 gives a /d.o.f. = , which is consistent with a constant flux emission in the 0.3 GeV-300 GeV range. The low variability in HE is a well known feature of EHBL, but it could be due to the long integration time (because of the low luminosity) that washes out the flux variations.
From the Swift-XRT light curve, a general trend of a decreasing X-ray flux is visible from erg cm-2 s-1 to erg cm-2 s-1 along the days after the flare. A constant fit to the five available observations gives a , which matches a p-value of , and is therefore a significance detection of flux variability. X-ray flux variability is a typical behaviour of the source and was reported several times for flaring episodes as well as during particularly low state. The most notable and strongest X-ray variability is described in Giommi et al. (2000) during the December 1996 flare, when for the first time roughly hourly variability is clearly visible. During low state, X-ray variability is reported in Aleksić et al. (2013), though on longer timescales (/day). Here also, only variability on roughly daily timescale can be claimed and no shorter timescale variability is detected. The X-ray spectral variability will be discussed in details in Sect. 4.
Regarding the lower energy bands, in the UV and near-IR no significant variability is detected. On the other hand, the optical -band and 15 GHz radio light curves are statistically inconsistent with a constant flux and from the fit we obtain and , respectively. This reveals some evolution also at the lowest energy of the broadband emission spectrum.
| Date | Exposure | /d.o.f. | ||
|---|---|---|---|---|
| (s) | erg cm2 | |||
| 13 August 2016 (MJD 57613) | 1651 | 2.960.22 | 1.930.06 | 36/36 |
| 20 August 2016 (MJD 57620) | 1134 | 3.390.32 | 1.940.07 | 24.2/26 |
| 23 August 2016 (MJD 57623) | 1833 | 2.230.13 | 2.100.05 | 33.1/43 |
| 26 August 2016 (MJD 57626) | 2333 | 2.510.15 | 2.010.05 | 44.24/56 |
| 29 August 2016 (MJD 57629) | 1987 | 1.920.11 | 2.000.05 | 45.39/51 |
| 27 October 2016 (MJD 57688) | 1456 | 1.060.10 | 1.900.08 | 24.4/20 |
| 29 October 2016 (MJD 57690) | 1453 | 0.980.10 | 2.020.07 | 22.4/26 |
| 01 November 2016 (MJD 57693) | 1359 | 1.090.11 | 1.950.07 | 20.8/25 |
| 04 November 2016 (MJD 57696) | 1518 | 1.210.12 | 1.940.08 | 19.5/25 |
4 Spectral analysis
4.1 X-ray spectral analysis and synchrotron peak identification
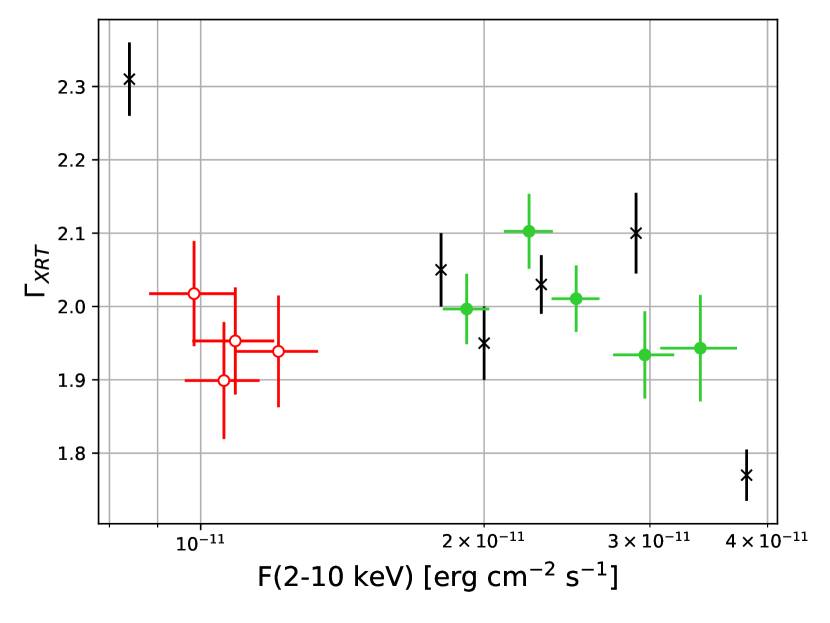
We study the X-ray emission by considering all Swift-XRT observations of 1ES 2344+514 from MJD 57613 (13 August 2016) to MJD 57696 (4 November 2016). This represents a broader time range than the one presented in Fig. 1 and also provides a more comprehensive range of flux states. Table 1 summarizes the flux values together with the corresponding photon indices. The power-law index versus the 2 keV–10 keV flux is plotted in Fig. 2. A clear separation is visible between high and low flux states: the solid green symbols correspond to the five observations temporally closer to the flaring state in the VHE -ray band. Data after MJD 57698 (29 August 2016) are plotted with open red symbols. For these days, the 2 keV–10 keV flux is lower, erg cm-2 s-1, which is comparable to the archival low state from MJD 50990 (26 June 1998), plotted with a black asterisk in Fig. 2. Such a flux level in the 2 keV–10 keV band is also typical during low state in this energy band (Acciari et al., 2011).
All spectra are well fitted with photon indices around or below 2 on the 0.3 keV–10 keV range. This hardness is typical of an EHBL (Costamante et al., 2001), thus in agreement with a location of close or above 1017 Hz. Until now, all studies of 1ES 2344+514 have revealed the usual harder-when-brighter behaviour in the X-ray band. It has been reported during high (Acciari et al., 2011) as well as during low state (Aleksić et al., 2013). From Fig. 2, this trend is however not visible. Swift-XRT observations are fully consistent with a constant photon index and no spectral variability is visible. Based on a constant fit, the spectra are in agreement with a constant hard photon index of 2, at least during the considered period. This result contrasts with the previous observed strong spectral variability. Interestingly, if we exclude the strong X-ray flare of December 2007 (Acciari et al., 2011), the dynamical range of the 2 keV–10 keV fluxes presented in this paper is quite typical for 1ES 2344+514. We are therefore probing typical X-ray states where one would naturally expect the standard harder-when-brighter trend that was reported in all previous studies. A comparison with the black asterisks in Fig. 2 that represents archival BEPPO-SAX observations (Giommi et al., 2000) clearly illustrates the peculiar behaviour of 1ES 2344+514 during 2016.
The closest spectrum in time to the VHE flare, from MJD 57613 (13 August 2016), has a photon index with no indication of curvature or steepening at higher energy. This constitutes a strong hint that we are describing the rising flank of the synchrotron component, and thus is located at the edge, or beyond, the energy range covered by Swift-XRT (i.e., Hz) for this day. Based on archival data, Nilsson et al. (2018) estimated a significantly lower, at Hz. Regarding the spectra obtained in October and November 2016, they show a similar hardness, despite the almost three times lower flux. As a comparison, for a similar 2 keV–10 keV flux, Acciari et al. (2011) and Giommi et al. (2000) measured a much softer photon index of –2.4, clearly implying a peak located Hz.
None of the Swift-XRT observation shows a statistical preference for a log-parabola shape. In order to search for spectral curvatures, which would help to constrain , we increase the statistics by grouping the observations according to their flux states and perform a spectral analysis on the summed datasets. We define three groups as following: the high flux state close to the VHE flare from MJD 57613 (13 August 2016) until MJD 57620 (20 August 2016), the intermediate flux state from MJD 57623 (23 August 2016) until MJD 57629 (29 August 2016) and the low flux state from MJD 57688 (27 October 2016) until MJD 57696 (04 November 2016). We find that only the intermediate flux state group shows a preference for a log-parabola shape. The derived is keV ( Hz), in agreement with an extreme state. Regarding the high flux state group, no curvature is found and the spectral analysis on this summed dataset reveals a power-law index of 1.930.05 (). This hardness supports a shift of the synchrotron peak above or at the edge of the Swift-XRT passband (i.e., Hz). The low state group gives a power-law index of 2.030.05 (), indicating a peak around a few Hz.
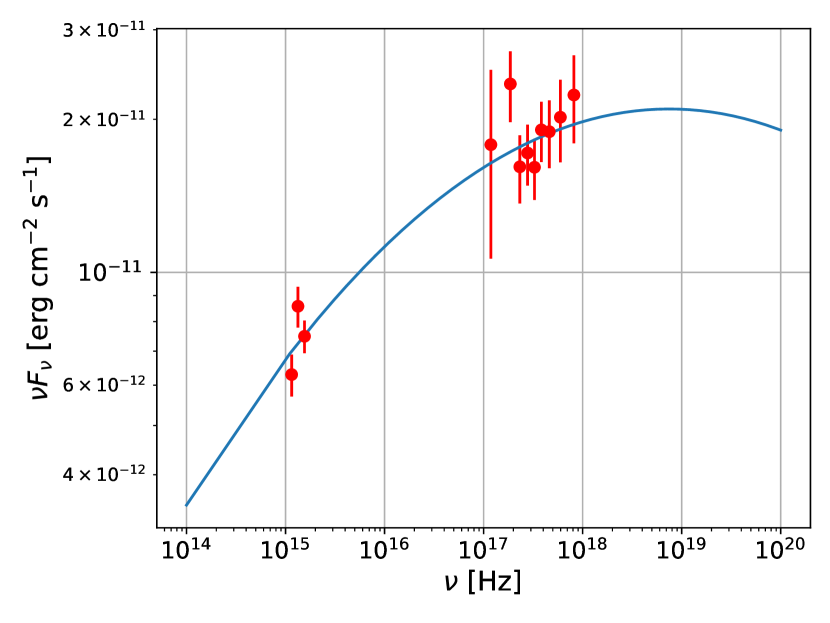
In an attempt to better locate and quantify the potential frequency shift of the peak close to the flare seen by FACT and MAGIC, we combine the SED from Swift-XRT observations of MJD 57613 (13 August 2016) with strictly simultaneous UV data obtained with the Swift-UVOT instrument (UVW1, UVM2, UVW2). The resulting plot is shown in Fig. 3. As in Aleksić et al. (2013), we follow the same procedure presented in Tramacere et al. (2007) and we fit of a log-parabola shape to the combined SED:
| (1) |
where is the peak location and the curvature. The resulting curve is shown in Fig. 3. The lack of data above Hz leads to large uncertainties in the fitted parameters. The best fit value for the peak location is Hz ( keV). The same study presented in Aleksić et al. (2013) during rather low X-ray state (F(2 –10 keV) erg cm-2 s-1) yielded a peak between keV and keV, which is close to an order of magnitude lower. Despite being not able to precisely constrain the peak from the observations alone, Fig. 3 and the measured hard photon index of confirm a shift above Hz on MJD 57613 (13 August 2016). Interestingly, from the observations by BEPPO-SAX during the 1996 flare (Giommi et al., 2000) the 2 keV–10 keV flux level and spectral properties are comparable to our results on MJD 57613 (13 August 2016).
A further estimation of the is given by means of the leptonic modeling in Sec. 5.2.
| Epochb | (observed spectrum) | (intrinsic spectrum) | [% C.N.] | ||
|---|---|---|---|---|---|
| Whipple | 19951 | 2.54 | not reported | 63% | 350 GeV |
| MAGIC | 20072 | 2.95 | 2.66 | 10% | 200 GeV |
| VERITAS | 200720083 (low state) | 2.78 | 7.6% | 300 GeV | |
| 200720083 (flare) | 2.43 | 48% | 300 GeV | ||
| MAGIC | 20084 | 2.4 | 2.2 | 2.5% | 300 GeV |
| VERITAS | 2007-20155 | 2.46 | 2.15 | 7% | 350 GeV |
| MAGIC | 20166 | 2.25 | 2.04 | 33% | 300 GeV |
-
aValues determined above the energy reported in the last column from previous VHE -ray observations and from the most recent VHE -ray flare in 2016.
bDatasets described in detail: 1Schroedter et al. (2005), 2Albert et al. (2007), 3Acciari et al. (2011),4Aleksić et al. (2013), 5Allen et al. (2017), 6this work.
| MJD | [cm-2 s-1 TeV-1] | /d.o.f. | Prob. | ||
|---|---|---|---|---|---|
| combined | observed | 23% | |||
| intrinsic | 28% | ||||
| 57611 | observed | 84.8% | |||
| intrinsic | 84.1% | ||||
| 57612 | observed | 66% | |||
| intrinsic | 64% |
| MJD | [cm-2 s-1 TeV-1] | /d.o.f. | Prob. | |||
|---|---|---|---|---|---|---|
| combined | observed | 26% | ||||
| intrinsic | 27% | |||||
| 57611 | observed | 58% | ||||
| intrinsic | 60% | |||||
| 57612 | observed | 71% | ||||
| intrinsic | 71% |
4.2 Study of the VHE -ray spectrum
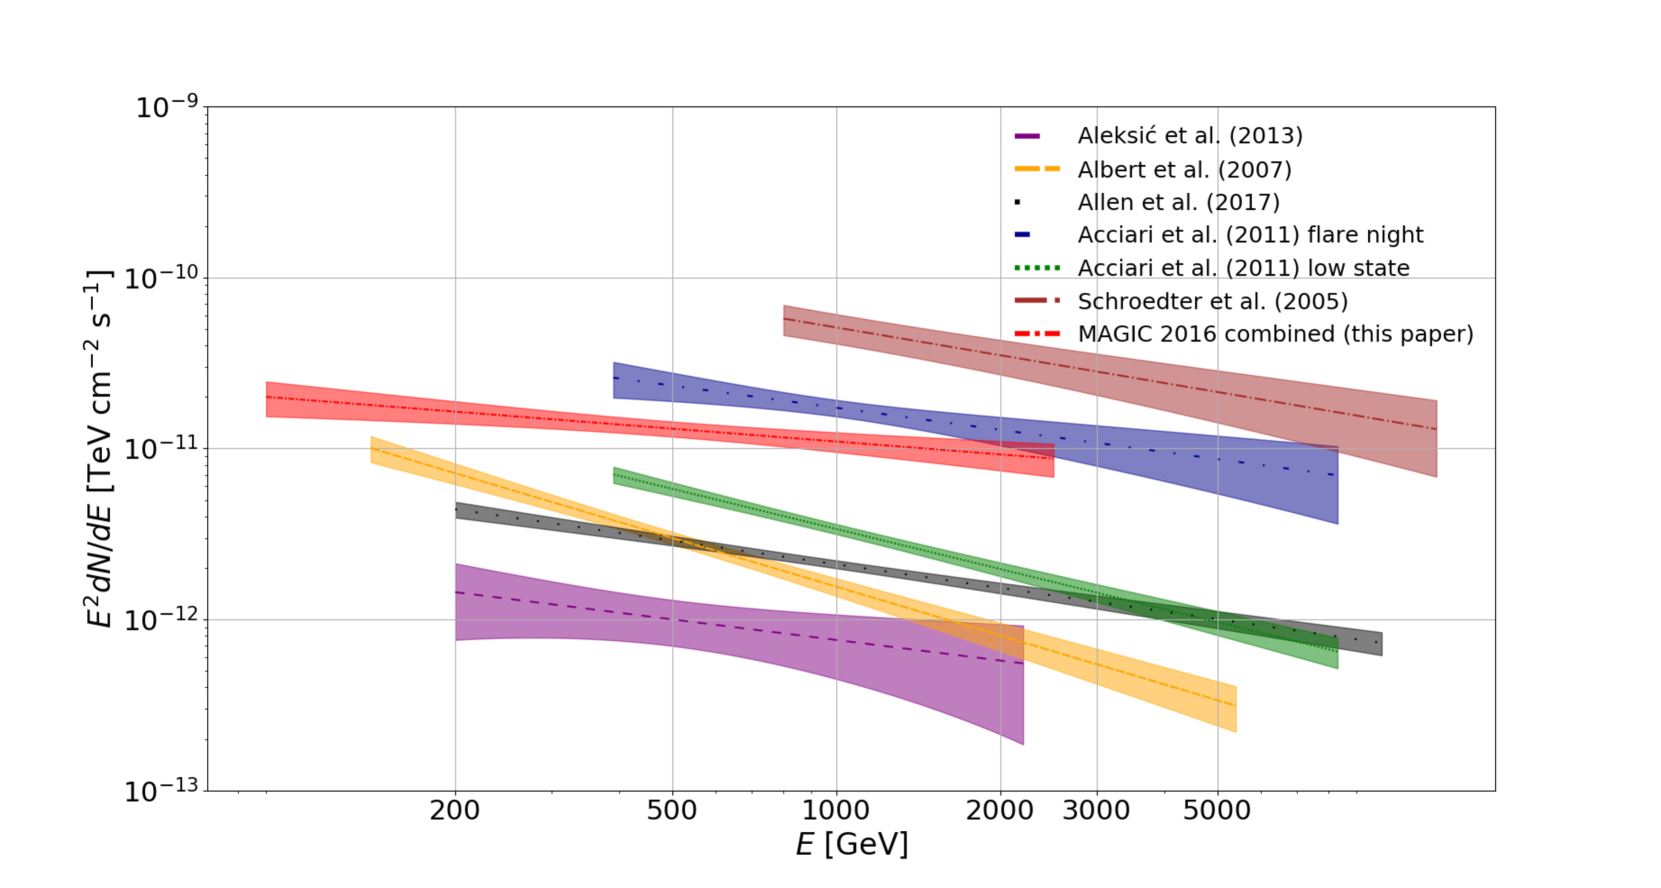
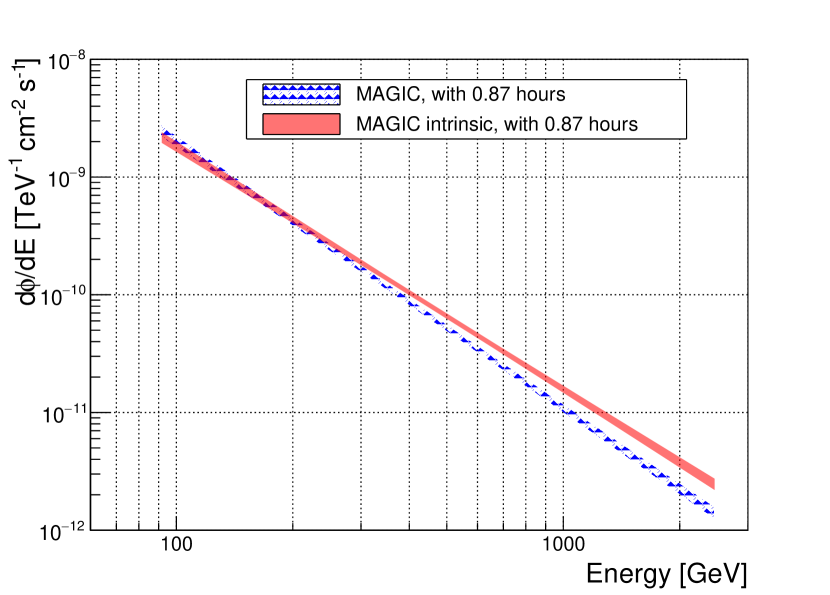
We gather together all the VHE -ray spectra of 1ES 2344+514 present in the literature so far (up to November 2019). The corresponding SEDs, in the form , are plotted in Fig. 4. The parameters from the respective power-law fit are listed in Table 2. The combined differential energy spectrum from MAGIC 2016 observations is shown in Fig. 5(a): the (blue) striped band represents the unfolded observed spectrum, while the (red) full band the corresponding spectrum corrected for extragalactic background light (EBL) absorption. In the present work, we use the EBL model of Domínguez et al. (2011) for EBL correction. The spectrum after EBL correction is defined as intrinsic. The combined observed SED of this work is also reported in Fig. 4 for comparison purposes. The differential VHE -ray spectra can be successfully described by a simple power law between 90 GeV and 2.5 TeV,
| (2) |
where the normalization constant , the spectral index and the goodness of the fit (/d.o.f.) are reported in Table 3. The best-fit value of the index obtained from the combined MAGIC spectrum is . The intrinsic spectrum is best described by .
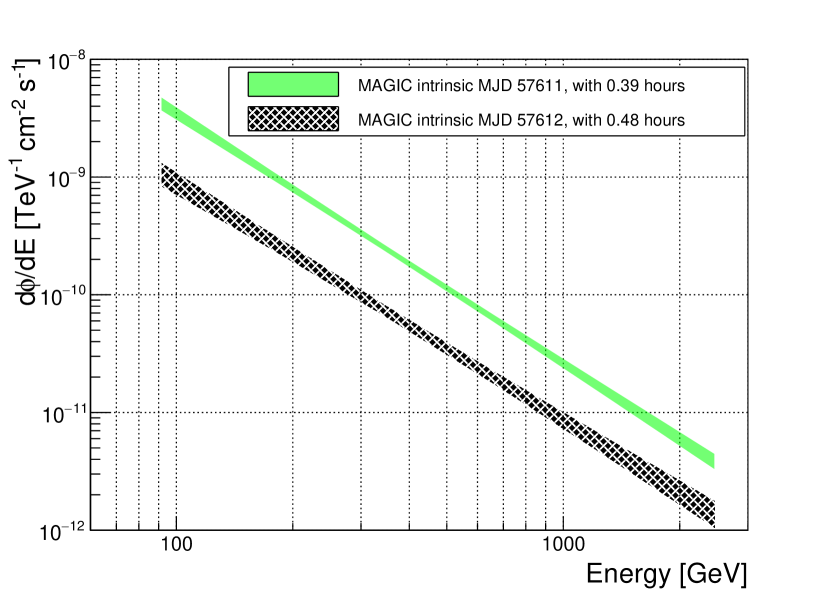
In Table 2 the other values of from previous publications in the VHE -ray band are presented. Observed and intrinsic spectra are compared. The -index values are accompanied by the corresponding flux in percent of the flux of the Crab Nebula. Table 2 also shows the energy above which the integral flux is calculated for the corresponding observations. It is not possible to see a clear harder-when-brighter behaviour as typical of HBL. Table 3 reveals that the indices from MAGIC observations are describing a quite hard spectrum, which maintains its hardness even during the second night of MAGIC observations (MJD 57612 – 12 August 2019), when the flux drops from the 55% to 16% of the Crab Nebula flux above 300 GeV. The shift in differential flux between MJD 57611 (11 August 2016) spectrum and the one from MJD 57612 (12 August 2016) is shown in Fig. 5(b). Even if a clear decrease in flux is observed between the two consecutive nights, the hardness of the index does not vary significantly. Therefore, we do not observe a harder-when-brighter behaviour on short timescales and the position of the IC peak is not changing over the two nights of observation. Interestingly, a VHE -ray spectrum with similar hardness was also observed when the source was in a lower activity state (as in Aleksić et al. 2013, =2.2 when flux is 2.5% of the Crab Nebula –see Table 2).
The MAGIC spectra were also fitted with a log-parabola spectral shape defined by:
| (3) |
The obtained values of the spectral parameters , and are listed in Table 4. No spectral variability is observed and a log-parabola shape is not significantly preferred with respect to a simple power-law. Based on the best-fitted and , the IC peak is located at GeV.
As discussed in Sec. 4.1, we confirm that an elevated flux of 1ES 2344+514 can lead to an extreme X-ray state. In the case of Mrk 501 in 2012, Ahnen et al. (2018) showed that such extreme X-ray states also led to a large shift of the IC peak, to about TeV, with hard power-law slopes well below 2 at VHE. Differently, the strong shift of the synchrotron peak of 1ES 2344+514 in 2016 does not seem to be accompanied with a comparable extreme VHE state. The IC peak remains below TeV as revealed by the spectral fits. An extreme state in the X-ray regime thus does not always coincide with hard-TeV spectra. In this sense, the 2016 flare of 1ES 2344+514 resembles more the Mrk 501 flare of 1997 (Pian et al., 1998). This complex EHBL phenomenology is described extensively in recent works (Foffano et al., 2019; Costamante et al., 2018; Acciari et al., 2020).
5 Broadband SED and modeling
5.1 MWL data and simultaneity
In Fig. 6 we show the broadband SED from radio to VHE energies using quasi-simultaneous observations (red solid squares) around the first Swift-XRT observation that took place on MJD 57613 (13 August 2016). For comparison purposes, we add archival data (in dark grey color, small solid dots) taken from the SSDC (ASI Science Data Centre) database888http://www.asdc.asi.it/.
For the VHE -ray band, we used the MAGIC SED from the night MJD 57612 (12 August 2016). On that night, the flux in VHE rays was lower with respect to the first night observed with MAGIC, but closer in time to the first Swift-XRT pointing. As shown in Fig. 5(b), despite the difference in flux between the two observations, the spectral slope is in both cases best fitted by an intrinsic index of .
From the FACT daily binned light curve (see Fig. 8 of the Appendix A), we observe a very similar behaviour in the VHE -ray band between the night MJD 57612 (12 August 2016) for which we have MAGIC data, and the next night MJD 57613 (13 August 2016), for which we do not have MAGIC observations. The measurements by FACT are indeed consistent with a constant flux of % that of the Crab Nebula flux above 810 GeV. Furthermore, we note an absence of spectral variability both in the VHE and X-ray over the MWL campaign (see Fig. 2 and Fig. 5(b)). Hence, it implies only a limited bias in terms of flux and spectral shape that is induced in our SED study when assuming the MAGIC spectrum from MJD 57612 (12 August 2016) to be simultaneous with the one measured by Swift-XRT on MJD 57613 (12 August 2016).
We complement the MAGIC data with contemporaneous HE observations provided by the Fermi-LAT instrument. The SED points in Fig. 6 are integrated over 1 month (centred around the MAGIC observing window, from MJD 57596.5 to MJD 57626.5) due to the faintness of the source for the LAT detector. Despite the low flux, which is a common characteristic among HBL and EHBL, the LAT significantly detected the source over this 1 month period with a TS = 41. The best fit spectral index is = , while the average over the entire studied period is = . As already mentioned in Sect. 3, no strong hint of spectral or flux variability on a weekly timescale was detected in the Fermi-LAT light curve. This is consistent with the modest variability of HBL and EHBL in the HE band reported in previous studies (Foffano et al., 2019). This allows us to assume that the LAT SED points are a good approximation of a LAT SED strictly simultaneous with the MAGIC observations. Additionally, we note a very smooth connection between the Fermi-LAT and MAGIC SED.
5.2 Leptonic model description
We adopt a one-zone SSC model assuming a stationary population of electrons as a first possible emission scenario to describe the broadband SED (Maraschi & Tavecchio, 2003; Krawczynski et al., 2004). This simple model was already applied to 1ES 2344+514 (Albert et al., 2007; Acciari et al., 2011; Aleksić et al., 2013; Tavecchio et al., 2010).
For this study we make the following assumptions:
-
•
A spherical homogeneous emission zone with radius that is filled with relativistic electrons and moving relativistically along the jet with a bulk Lorentz factor .
-
•
The jet axis is aligned with the line of sight with an angle = 1/; the advantage of such a standard configuration is to reduce the number of degrees of freedom, as the Doppler factor becomes equal to the bulk Lorentz factor (i.e., = ).
-
•
The emitting zone is embedded in an homogeneous magnetic field .
We use the open-source software naima (Zabalza, 2015) to compute the synchrotron and IC emissivities.
The electron energy distribution (EED) is described by a simple power-law function,
| (4) |
where is a normalization constant which is adjusted to match an EED with an energy density of erg cm-3. The adimensional parameters and are the minimum and maximum electron Lorentz factors, respectively. This simple parametrization of the EED reduces the number of degrees of freedom and is able to well describe the observed SED.
In Table 5, we list the obtained one-zone SSC parameters, and the corresponding model is plotted in black in Fig. 6. We select a value of for the Doppler factor which is typical for HBLs (Tavecchio et al., 2010). The size of the emitting region can usually be constrained by the light crossing time , where is the observed flux variability timescale. The strong flux decay observed by MAGIC between MJD 57611 and MJD 57612 (11 and 12 August 2016) indicates a day timescale variability at VHE and we therefore set cm consistently with the light-crossing time for . This value is also very similar to the one used in previous models performed on 1ES 2344+514 (see Aleksić et al., 2013; Tavecchio et al., 2010).
| Parameter | Value |
|---|---|
| [G] | 0.02 |
| 30 | |
| [ cm] | 1 |
| [erg cm-3] | 0.008 |
| 2.6 | |
| [] | 3.0 |
| [] | 3.0 |
| aSee text for a detailed description of each parameter. |
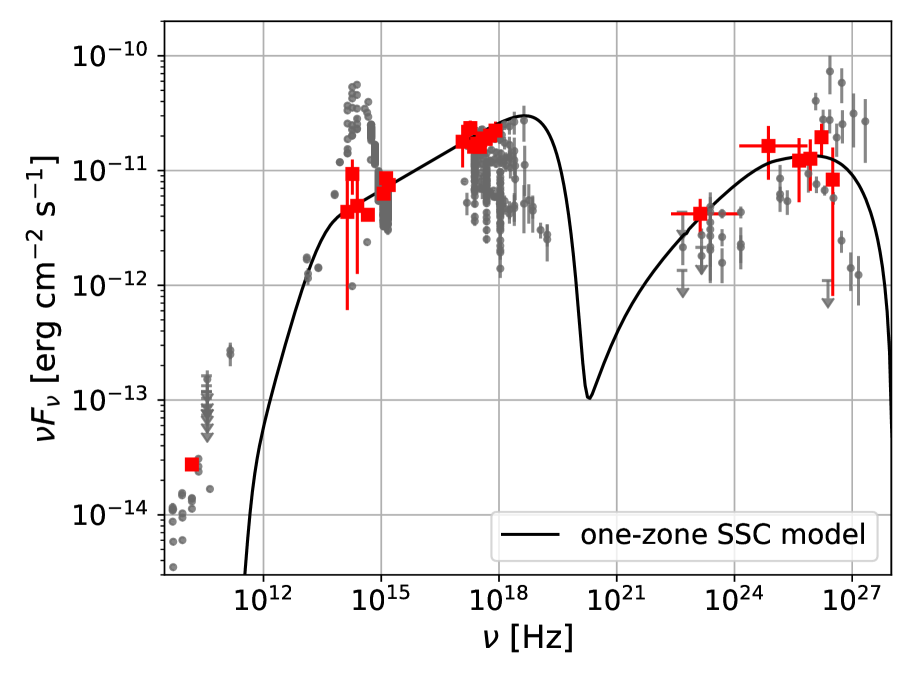
In general, we find a very good agreement between the model and the data from infrared to TeV energies. Additionally, the model reproduces well the hardness measured by MAGIC in the VHE rays (). Only the OVRO data (15 GHz), as well as all the archival radio data, are not well reproduced and strongly underestimated by the model. The size of the emitting blob (which is constrained by the daily variability timescale at VHE) is small enough such that the radio emission is self-absorbed. Hence, the radio flux likely originates from broader regions of the jet that become transparent at those energies. These regions can have very complex environments and morphologies, which are not included in our model.
The one-zone SSC model in Fig. 6 implies Hz keV, similarly to Giommi et al. (2000) where the authors conclude that on MJD 50424 (7 December 1996) the shifted to energies keV. It corresponds to an impressive shift of the peak to higher energies by roughly two orders of magnitude with respect to the low state reported in Aleksić et al. (2013), or from the estimation done by Nilsson et al. (2018) using archival data.
From the model, the peak of the IC component is located at Hz TeV. This agrees well with log-parabolic fits discussed in Sec. 4. The obtained is higher by almost 1 order of magnitude with respect to the modeling performed during low states discussed in Aleksić et al. (2013) and Acciari et al. (2011).
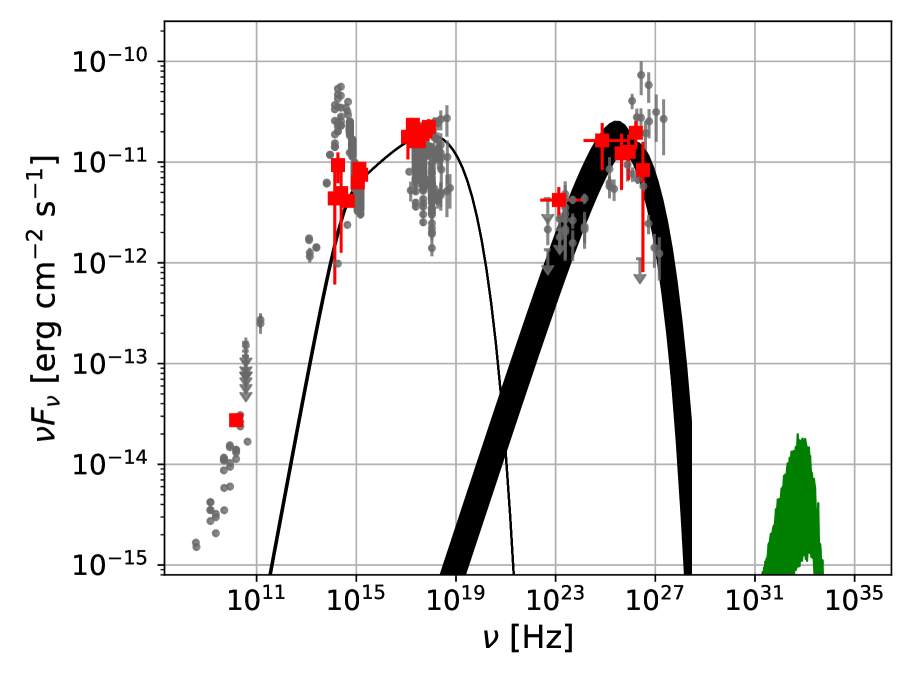
5.3 Hadronic model description
In general, the low-energy hump of the SED is explained in both leptonic and hadronic models by synchrotron radiation of relativistic electrons. The models differ in the origin of the high energy hump, by IC or associated with the emission by relativistic protons in the jet, respectively. Aharonian (2000) and Mücke & Protheroe (2001) initially explored proton-synchrotron scenarios and showed that they are viable solutions to the -ray emission. One of the major weaknesses of blazar hadronic models is that they often require a very high (super-Eddington) luminosity of the proton population needed to reproduce the observations. This is particularly true for the hadronic modeling of bright FSRQ, as discussed by Zdziarski & Bottcher (2015) and others. For low-luminosity HBL, a successful hadronic modeling can be achieved with total powers well below the Eddington luminosity of the super-massive black hole that powers the jet. We investigate a standard proton-synchrotron scenario using the code described in Cerruti et al. (2015). To limit the number of free parameters of the model, we make the following physical assumptions:
-
•
The Doppler factor is fixed to , a value typical for blazars, and identical to the one used for the leptonic model.
-
•
The radius of the emitting region is constrained by the observed variability timescale via the usual causality argument as , where has been fixed to one day as described in Sec. 5.2.
-
•
The maximum Lorentz factor of protons is computed by equating the acceleration and cooling timescales: the first one is expressed as , where is a parameter defining the efficiency of the acceleration mechanism, fixed to ; the cooling timescales considered here are the adiabatic one, , and the synchrotron one.
-
•
Protons and electrons are supposed to share the same acceleration mechanism, and thus the power-law index of the injected particle distribution is the same:
-
•
The energy distribution of electrons at equilibrium is computed assuming that the main cooling mechanism is synchrotron radiation, which is always the case for proton-synchrotron solutions characterized by magnetic field values of the order of 10 G–100 G.
As discussed in Cerruti et al. (2015), the synchrotron radiation by protons, when is defined via the equation of acceleration and cooling timescales, is characterized by a degeneracy in the – plane: spectra with the same peak frequency lie on a line in the Log()–Log() plane described by . The maximum proton-synchrotron peak frequency is defined by the transition from the adiabatic-dominated regime to the synchrotron-cooling dominated regime, and it is equal to .
We systematically study the parameter space scanning over , and on the normalization of the proton distribution . We produce 1500 models in the following parameter space: , , and the proton normalisation , where corresponds to the proton density which provides a synchrotron spectrum at the level of the MAGIC spectra. We compute a posteriori the of all models with respect to the data, identify the solution with the minimum , and select only solutions which are comprised within a corresponding to .
The optical and NIR data are compatible with a spectral break associated with the synchrotron self-absorption located around this energy band. This feature breaks the degeneracy in the – plane, resulting in a rather well constrained value for the magnetic field, the emitting region size, as well as the maximum energy of the proton distribution (see Table 6). The resulting set of models are plotted as a black band in Fig. 7. In addition, we show with a green band the expected flux of neutrino arising from p- interactions. In our particular case, the latter component is rather low for the following reason: the particle density for both protons and leptons (which are producing the target photon field for p- interactions) is much lower compared to the leptonic case in order to compensate for the large magnetic field ( G) and also for suppressing the SSC contribution and let the proton-synchrotron dominate.
Overall, there is a rather good agreement between the models and the data points from optical to TeV. The high energy hump is narrower compared to the leptonic model and this creates a small tension with the spectral shapes as seen by Fermi-LAT and MAGIC. The models tend to give a harder HE -ray spectrum than the one measured by Fermi-LAT, while the opposite trend is visible regarding the MAGIC data. From this point of view, the high energy hump is better described in the leptonic model. We note that the shape of the high-energy hump is directly linked to the spectral slope of the proton energy distribution. The latter is obtained based on the assumptions that electrons and protons are accelerated following the same mechanisms (i.e., ). Since we further assume the synchrotron radiation to be the main cooling mechanism for the electrons, this implies , in order to have . Thus, relaxing one of these assumptions will result in a better description of the high energy component.
| Proton-synchrotron | |
| 30 | |
| [1015 cm] | |
| [days] | |
| [G] | |
| [erg cm-3] | |
| [cm-3] | |
| [10erg cm-3] | |
| 1 | |
| [10-4] | |
| [10erg cm-3] | |
| [10-4] | |
| [1045 erg s-1] |
aThe quantities flagged with a star (⋆) are derived quantities, and not model parameters. The luminosity of the emitting region has been calculated as , where , and , , and are (respectively) the energy densities of the magnetic field, the electrons, and the protons.
6 Discussion of the extreme behaviour
The MWL observations presented in this paper clearly reveal a renewed extreme behaviour accompanied with a particularly high state in the VHE range during August 2016. On MJD 57613 (13 August 2016), the spectral analysis in the range 0.3 keV–10 keV results in a power-law index harder than 2, with a flux as high as during the December 1996 flare. This strongly suggests a location of the synchrotron peak Hz, thus fulfilling the criteria to be classified as “extreme” following Costamante et al. (2001). Recent published works proposed that there is not a single population of EHBL: some of them show very soft VHE spectra, while others have hard-VHE spectra (Foffano et al., 2019; Costamante et al., 2018). The VHE -ray spectrum measured here by MAGIC (spectral index of ) possibly indicates 1ES 2344+514 as a transitional source between HBL-like EHBL and hard-TeV EHBL. The latter class of HBL is characterized by spectral indices significantly harder than 2 (Foffano et al., 2019).
Within the SSC scenario, a shift of the complete broadband SED is confirmed. Based on the model parameters, we derive a Hz keV and a Hz TeV. These are significantly different from the results obtained during low emission states. Using the archival data, Nilsson et al. (2018) estimated a at Hz.
The impressive displacements of both the synchrotron and IC peaks imply an unusual increase of the energy of the emitting electrons. Accordingly, we find that must reach values of a few times , and thus indicate that the EED extends without significant cutoff or break up to TeV energies. In all previous works, during low states, the SSC modeling resulted in a EED showing a clear break at values around –, which is about 1 order of magnitude lower than the found here. Bonnoli et al. (2015) similarly inferred that the EED extend without clear break to to model a small sample of EHBL.
Additionally to the extreme value of , we find that a low magnetic field G is necessary to describe the SED. The magnetic field usually lies between 0.1-1 G in leptonic models for HBL (see Tavecchio et al., 2010), but can be as low as – G in the case of EHBL. A low magnetic field is required to account for an IC component peaking close to the TeV regime as well as the large separation from . In SSC models, we expect a dependency between the magnetic field (and Doppler factor) and the peaks of the two emission bumps as (Tavecchio & Ghisellini, 2016).
As a direct consequence of a low magnetic field combined with an EED extending up to a few TeV, we obtain an emitting region which is far below energy equipartition, i.e. , where is the magnetic energy density and is the electrons energy density. Based on the resulting SSC parameters and calculating the jet energetics following the prescription in Celotti & Ghisellini (2008), we get . Hence, the magnetic energy density is extremely low compared to the energy density stored in the EED. This feature is commonly seen in SED modeling of BL Lac objects during a flaring episode, such as the one we observed in this work. Therefore, it sets challenges to explain the electron acceleration mechanism, which is generally thought to be done through the transfer of the magnetic energy to kinetic energy, up to the point where equipartition is reached (Komissarov et al., 2007). Interestingly, Costamante et al. (2018) modeled a small set of EHBL and showed that an energy equipartition far below unity can also persists during quiescent states. We also computed based on the models parameters obtained in previous works on 1ES 2344+51.4 (Aleksić et al., 2013; Acciari et al., 2011; Tavecchio et al., 2010; Albert et al., 2007). All of them result in values of typically –.
A similar consideration is made in acciari2019EHBL, where a catalog of EHBL is presented and studied in a MWL context using three different modelings. While all modelings give a good description of the observations, the obtained magnetisations substantially differ. A single-zone SSC model applied to their data requires a critically low magnetization, consistent with the results shown in this paper. The proton-synchrotron model was instead providing a highly magnetized jet, still far from equipartition. On the other hand, adopting the so-called spine-layer model (Ghisellini et al., 2005), a two-component SSC model comprising a structured jet as emission zone, a quasi-equipartition of the magnetic field and matter could be achieved. Nevertheless, with the data at hand, no model was favoured.
The contemporaneous Fermi-LAT spectral points were obtained based on a significant detection of the source on a 1-month timescale. Up to now, no significant spectral points in the HE band have been combined with a contemporaneous VHE spectrum obtained on such a short timescale for 1ES 2344+514. The combined MAGIC and Fermi-LAT SED is better described when is around rather than close to unity. The main reason for this is that, when reducing , we increase the pool of electrons that are dominantly responsible for the rising edge of the IC bump. Consequently, the IC flux increases in the HE band. A high around therefore provides a narrower IC peak. A high minimum energy in the EED is a recurrent feature in EHBL. We note that is constrained by the (host-galaxy corrected) IR/optical data and can not be increased arbitrarily high.
The proton-synchrotron models also describe the data well, with a electrons synchrotron peak frequency at Hz.
With respect to the leptonic model, the hadronic models require a much larger magnetic field indicating that the emission zone has an equipartition parameter well above 1, generating the opposite situation than in the SSC model. As seen in Tab. 6, the magnetic field energy densities are – higher than the energy density of the particles in the jet.
The low luminosity commonly found in EHBL does not require super-Eddington luminosity for the proton population and we find a maximum total jet luminosity of erg s-1. For supermassive black holes of solar masses, as estimated for 1ES 2344+514 (Barth et al., 2003), Eddington luminosity is about 1 order of magnitude higher.
For the reasons explained in Sect. 5.3, the predicted neutrino flux resulting from interactions is much lower than the high energy hump of the SED and lies well below the sensitivity of the IceCube neutrino detector. Thus, within pure hadronic scenarios, no neutrino are expected to be detected by current neutrino detectors, even during flaring events of 1ES2344+514. In agreement with our results, the IceCube Collaboration evaluated a 90% CL upper limit of the muon neutrino flux of 1ES 2344+514 at (Aartsen et al., 2019).
In our hadronic modeling, we obtain that, by construction, the shortest cooling timescale is the adiabatic one, and the proton population shows no cooling break (). As shown in Tab. 6, the variability timescale expected from adiabatic cooling is below or around one day and remains consistent with the daytime scale variability observed in the present flare.
The models we applied to the present broadband dataset can both successfully describe the MWL SED.
7 Summary and Conclusions
Triggered by the FACT detection of enhanced flux in the TeV range, on MJD 57611 (11 August 2016) the MAGIC telescopes started to observe the BL Lac object 1ES 2344+514.
The MAGIC observations resulted in a detection with a significance of in less than one hour and a measured flux of 55% of the Crab Nebula flux above 300 GeV. This flux is comparable with the historical maximum detected from this source in 1995 (Catanese et al., 1998). On the following night (MJD 57612–12 August 2016) the signal was already fading and the measured flux was 16% of the Crab Nebula flux above 300 GeV. We gathered MWL data from instruments in the radio, optical, NIR, UV, X-ray and HE band to complement the VHE -ray observations: with simultaneous data taken on MJD 57613 (13 August 2016) we built a broadband SED describing the flaring state and modeled it within two alternative scenarios: a leptonic SSC, and a proton-synchrotron model.
For the first time in this source, Fermi-LAT data with MAGIC data allow us to constrain the IC hump on short timescales. A leptonic model applied to the data gives a peak frequency Hz TeV. .
We find the source in an extreme synchrotron state, with a peak frequency obtained from the leptonic model at Hz, corresponding to keV. The shift of the with respect to previous observations (Aleksić et al., 2013; Nilsson et al., 2018) is of about two orders of magnitude.
We also find a harder than usual VHE -ray spectrum ( after EBL correction). The hardness of the spectrum does not vary between the first and the second night of observation, even if the latter one is characterized by a three times lower flux.
The leptonic and hadronic models both describe successfully the data. On the other hand, they imply a significantly different magnetization of the emitting zone.
We conclude that the BL Lac object 1ES 2344+514 belongs to that subcategory of EHBL which reveal to be extreme only in some circumstances (see Mrk 501 in 2012; Ahnen et al., 2018), and does not show the typical characteristic of persistent extreme SED as for instance the archetypal EHBL 1ES 0229+200 does (Aharonian et al., 2007c). This “intermittent” extremeness could be studied acquiring more MWL data in the next years. Time-dependent modelling to interpret the broadband SED could help to elucidate this peculiarity.
There is still more to discover about the EHBL family and future MWL campaigns will help to unveil their nature and to move towards a classification of those interesting powerful AGN.
Acknowledgements
We would like to thank the Instituto de Astrofísica de Canarias for the excellent working conditions at the Observatorio del Roque de los Muchachos in La Palma. The financial support of the German BMBF and MPG, the Italian INFN and INAF, the Swiss National Fund SNF, the ERDF under the Spanish MINECO (FPA2017-87859-P, FPA2017-85668-P, FPA2017-82729-C6-2-R, FPA2017-82729-C6-6-R, FPA2017-82729-C6-5-R, AYA2015-71042-P, AYA2016-76012-C3-1-P, ESP2017-87055-C2-2-P, FPA2017-90566-REDC), the Indian Department of Atomic Energy, the Japanese JSPS and MEXT, the Bulgarian Ministry of Education and Science, National RI Roadmap Project DO1-153/28.08.2018 and the Academy of Finland grant nr. 320045 is gratefully acknowledged. This work was also supported by the Spanish Centro de Excelencia “Severo Ochoa” SEV-2016-0588 and SEV-2015-0548, and Unidad de Excelencia “María de Maeztu” MDM-2014-0369, by the Croatian Science Foundation (HrZZ) Project IP-2016-06-9782 and the University of Rijeka Project 13.12.1.3.02, by the DFG Collaborative Research Centers SFB823/C4 and SFB876/C3, the Polish National Research Centre grant UMO-2016/22/M/ST9/00382 and by the Brazilian MCTIC, CNPq and FAPERJ. The FACT collaboration acknowledges the important contributions from ETH Zurich grants ETH-10.08-2 and ETH-27.12-1 as well as the funding by the Swiss SNF and the German BMBF (Verbundforschung Astro- und Astroteilchenphysik) and HAP (Helmoltz Alliance for Astroparticle Physics) are gratefully acknowledged. Part of this work is supported by Deutsche Forschungsgemeinschaft (DFG) within the Collaborative Research Center SFB 876 "Providing Information by Resource-Constrained Analysis", project C3. We are thankful for the very valuable contributions from E. Lorenz, D. Renker and G. Viertel during the early phase of the project. We thank the Instituto de Astrofísica de Canarias for allowing us to operate the telescope at the Observatorio del Roque de los Muchachos in La Palma, the Max-Planck-Institut für Physik for providing us with the mount of the former HEGRA CT3 telescope, and the MAGIC collaboration for their support. This article is based partly on observations made with the 1.5 TCS and IAC80 telescopes operated by the IAC in the Spanish Observatorio del Teide. This article is also based partly on data obtained with the STELLA robotic telescopes in Tenerife, an AIP facility jointly operated by AIP and IAC. We acknowledge support from Russian Scientific Foundation grant 17-12-01029. A.V.F. and W.Z. are grateful for support from NASA grant NNX12AF12G, the Christopher R. Redlich Fund, the TABASGO Foundation, and the Miller Institute for Basic Research in Science (U.C. Berkeley). KAIT and its ongoing operation were made possible by donations from Sun Microsystems, Inc., the Hewlett-Packard Company, AutoScope Corporation, Lick Observatory, the US National Science Foundation, the University of California, the Sylvia and Jim Katzman Foundation, and the TABASGO Foundation. Research at Lick Observatory is partially supported by a generous gift from Google.
W.M. acknowledges support from CONICYT project Basal AFB-170002. The OVRO 40-m monitoring program is supported in part by NASA grants NNX08AW31G, NNX11A043G, and NNX14AQ89G, and NSF grants AST-0808050 and AST-1109911. This research has made use of data and/or software provided by the High Energy Astrophysics Science Archive Research Center (HEASARC), which is a service of the Astrophysics Science Division at NASA/GSFC and the High Energy Astrophysics Division of the Smithsonian Astrophysical Observatory. We acknowledge the use of public data from the Swift data archive. This research has made use the TeVCat online source catalog (http://tevcat.uchicago.edu). Part of this work is based on archival data, software or online services provided by the Space Science Data Center - ASI.
Affiliations
1 Inst. de Astrofísica de Canarias, E-38200 La Laguna, and Universidad de La Laguna, Dpto. Astrofísica, E-38206 La Laguna, Tenerife, Spain
2 Università di Udine, and INFN Trieste, I-33100 Udine, Italy
3 National Institute for Astrophysics (INAF), I-00136 Rome, Italy
4 ETH Zurich, CH-8093 Zurich, Switzerland
5 Technische Universität Dortmund, D-44221 Dortmund, Germany
6 Croatian Consortium: University of Rijeka, Department of Physics, 51000 Rijeka; University of Split - FESB, 21000 Split; University of Zagreb - FER, 10000 Zagreb; University of Osijek, 31000 Osijek; Rudjer Boskovic Institute, 10000 Zagreb, Croatia
7 Saha Institute of Nuclear Physics, HBNI, 1/AF Bidhannagar, Salt Lake, Sector-1, Kolkata 700064, India
8 Centro Brasileiro de Pesquisas Físicas (CBPF), 22290-180 URCA, Rio de Janeiro (RJ), Brasil
9 IPARCOS Institute and EMFTEL Department, Universidad Complutense de Madrid, E-28040 Madrid, Spain
10 University of Lodz, Faculty of Physics and Applied Informatics, Department of Astrophysics, 90-236 Lodz, Poland
11 Università di Siena and INFN Pisa, I-53100 Siena, Italy
12 Deutsches Elektronen-Synchrotron (DESY), D-15738 Zeuthen, Germany
13 Istituto Nazionale Fisica Nucleare (INFN), 00044 Frascati (Roma) Italy
14 Max-Planck-Institut für Physik, D-80805 München, Germany
15 Institut de Física d’Altes Energies (IFAE), The Barcelona Institute of Science and Technology (BIST), E-08193 Bellaterra (Barcelona), Spain
16 Università di Padova and INFN, I-35131 Padova, Italy
17 Università di Pisa, and INFN Pisa, I-56126 Pisa, Italy
18 Universitat de Barcelona, ICCUB, IEEC-UB, E-08028 Barcelona, Spain
19 The Armenian Consortium: ICRANet-Armenia at NAS RA, A. Alikhanyan National Laboratory
20 Centro de Investigaciones Energéticas, Medioambientales y Tecnológicas, E-28040 Madrid, Spain
21 Universität Würzburg, D-97074 Würzburg, Germany
22 Finnish MAGIC Consortium: Finnish Centre of Astronomy with ESO (FINCA), University of Turku, FI-20014 Turku, Finland; Astronomy Research Unit, University of Oulu, FI-90014 Oulu, Finland
23 Departament de Física, and CERES-IEEC, Universitat Autònoma de Barcelona, E-08193 Bellaterra, Spain
24 Japanese MAGIC Consortium: ICRR, The University of Tokyo, 277-8582 Chiba, Japan; Department of Physics, Kyoto University, 606-8502 Kyoto, Japan; Tokai University, 259-1292 Kanagawa, Japan; RIKEN, 351-0198 Saitama, Japan
25 Inst. for Nucl. Research and Nucl. Energy, Bulgarian Academy of Sciences, BG-1784 Sofia, Bulgaria
26 now at University of Innsbruck
27 also at Port d’Informació Científica (PIC) E-08193 Bellaterra (Barcelona) Spain
28 also at Dipartimento di Fisica, Università di Trieste, I-34127 Trieste, Italy
29 also at INAF-Trieste and Dept. of Physics & Astronomy, University of Bologna
30 University of Geneva, Department of Astronomy, Chemin d’Écogia 16, 1290 Versoix, Switzerland
31 also at RWTH Aachen University
32 Department of Astronomy, University of California, Berkeley, CA 94720-3411, USA
33 Miller Senior Fellow, Miller Institute for Basic Research in Science, University of California, Berkeley, CA 94720, USA
34 Finnish Centre for Astronomy with ESO (FINCA), University of Turku, FI-20014, Turku, Finland
35 Aalto University Metsähovi Radio Observatory, Metsähovintie 114, 02540 Kylmälä, Finland
36 Owens Valley Radio Observatory, California Institute of Technology, Pasadena, CA 91125, USA
37 Astronomical Institute, St. Petersburg State University, Universitetskij Pr. 28, Petrodvorets, St. Petersburg 198504, Russia
38 Main (Pulkovo) Astronomical Observatory of RAS, Pulkovskoye shosse 60, St. Petersburg 196149, Russia
39 Departamento de Astronomía, Universidad de Chile, Camino El Observatorio 1515, Las Condes, Santiago, Chile
40 INAF, Osservatorio Astrofisico di Torino, I-10025 Pino Torinese, Italy
currently at 3
Data availability
References
- Aartsen et al. (2019) Aartsen M. G., et al., 2019, European Physical Journal C, 79, 234
- Abdo et al. (2009) Abdo A. A., et al., 2009, ApJ, 707, 1310
- Acciari et al. (2010) Acciari V. A., et al., 2010, ApJ, 715, L49
- Acciari et al. (2011) Acciari V. A., et al., 2011, ApJ, 738, 169
- Acciari et al. (2020) Acciari V. A., et al., 2020, ApJS, 247, 16
- Acero et al. (2015) Acero F., et al., 2015, ApJS, 218, 23
- Ackermann et al. (2012) Ackermann M., et al., 2012, ApJS, 203, 4
- Aharonian (2000) Aharonian F. A., 2000, New Astron., 5, 377
- Aharonian et al. (2007a) Aharonian F., et al., 2007a, A&A, 470, 475
- Aharonian et al. (2007b) Aharonian F., et al., 2007b, A&A, 473, L25
- Aharonian et al. (2007c) Aharonian F., et al., 2007c, A&A, 475, L9
- Ahnen et al. (2018) Ahnen M. L., et al., 2018, A&A, 620, A181
- Albert et al. (2007) Albert J., et al., 2007, ApJ, 662, 892
- Aleksić et al. (2013) Aleksić J., et al., 2013, A&A, 556, A67
- Aleksić et al. (2016) Aleksić J., et al., 2016, Astroparticle Physics, 72, 76
- Allen et al. (2017) Allen C., et al., 2017, MNRAS, 471, 2117
- Anderhub et al. (2013) Anderhub H., et al., 2013, Journal of Instrumentation, 8, P06008
- Atwood et al. (2009) Atwood W. B., et al., 2009, ApJ, 697, 1071
- Baars et al. (1977) Baars J. W. M., Genzel R., Pauliny-Toth I. I. K., Witzel A., 1977, A&A, 500, 135
- Barth et al. (2003) Barth A. J., Ho L. C., Sargent W. L. W., 2003, ApJ, 583, 134
- Beck et al. (2019) Beck M., et al., 2019, in 36th International Cosmic Ray Conference (ICRC2019). p. 630
- Biland et al. (2014) Biland A., et al., 2014, Journal of Instrumentation, 9, P10012
- Bonnoli et al. (2015) Bonnoli G., Tavecchio F., Ghisellini G., Sbarrato T., 2015, MNRAS, 451, 611
- Böttcher (2007) Böttcher M., 2007, Ap&SS, 309, 95
- Bretz (2019) Bretz T., 2019, Astroparticle Physics, 111, 72
- Burrows et al. (2004) Burrows D. N., et al., 2004, in Flanagan K. A., Siegmund O. H. W., eds, Society of Photo-Optical Instrumentation Engineers (SPIE) Conference Series Vol. 5165, Proc. SPIE. pp 201–216, doi:10.1117/12.504868
- Catanese et al. (1998) Catanese M., et al., 1998, ApJ, 501, 616
- Celotti & Ghisellini (2008) Celotti A., Ghisellini G., 2008, MNRAS, 385, 283
- Cerruti et al. (2015) Cerruti M., Zech A., Boisson C., Inoue S., 2015, MNRAS, 448, 910
- Costamante et al. (2001) Costamante L., et al., 2001, A&A, 371, 512
- Costamante et al. (2018) Costamante L., Bonnoli G., Tavecchio F., Ghisellini G., Tagliaferri G., Khangulyan D., 2018, MNRAS, 477, 4257
- Domínguez et al. (2011) Domínguez A., et al., 2011, MNRAS, 410, 2556
- Dorner et al. (2009) Dorner D., Nilsson K., Bretz T., 2009, A&A, 493, 721
- Dorner et al. (2019) Dorner D., et al., 2019, in 36th International Cosmic Ray Conference (ICRC2019). p. 665
- Edelson & Krolik (1988) Edelson R. A., Krolik J. H., 1988, ApJ, 333, 646
- Elvis et al. (1992) Elvis M., Plummer D., Schachter J., Fabbiano G., 1992, ApJS, 80, 257
- Fallah Ramazani et al. (2017) Fallah Ramazani V., Lindfors E., Nilsson K., 2017, A&A, 608, A68
- Filippenko et al. (2001) Filippenko A. V., Li W. D., Treffers R. R., Modjaz M., 2001, in Paczynski B., Chen W.-P., Lemme C., eds, Astronomical Society of the Pacific Conference Series Vol. 246, IAU Colloq. 183: Small Telescope Astronomy on Global Scales. p. 121
- Foffano et al. (2019) Foffano L., Prandini E., Franceschini A., Paiano S., 2019, MNRAS, 486, 1741
- Fruck et al. (2014) Fruck C., Gaug M., Zanin R., Dorner D., Garrido D., Mirzoyan R., Font L., 2014, arXiv e-prints, p. arXiv:1403.3591
- Ganeshalingam et al. (2010) Ganeshalingam M., et al., 2010, ApJS, 190, 418
- Ghisellini et al. (2005) Ghisellini G., Tavecchio F., Chiaberge M., 2005, A&A, 432, 401
- Ghisellini et al. (2017) Ghisellini G., Righi C., Costamante L., Tavecchio F., 2017, MNRAS, 469, 255
- Giommi et al. (2000) Giommi P., Padovani P., Perlman E., 2000, MNRAS, 317, 743
- Godambe et al. (2007) Godambe S. V., et al., 2007, Journal of Physics G Nuclear Physics, 34, 1683
- Hildebrand et al. (2017) Hildebrand D., et al., 2017, in 35th International Cosmic Ray Conference (ICRC2017). p. 779
- Kalberla et al. (2005) Kalberla P. M. W., Burton W. B., Hartmann D., Arnal E. M., Bajaja E., Morras R., Pöppel W. G. L., 2005, A&A, 440, 775
- Komissarov et al. (2007) Komissarov S. S., Barkov M. V., Vlahakis N., Königl A., 2007, MNRAS, 380, 51
- Krawczynski et al. (2004) Krawczynski H., et al., 2004, ApJ, 601, 151
- Mahlke et al. (2017) Mahlke M., et al., 2017, in 35th International Cosmic Ray Conference (ICRC2017). p. 612
- Mannucci et al. (2001) Mannucci F., Basile F., Poggianti B. M., Cimatti A., Daddi E., Pozzetti L., Vanzi L., 2001, MNRAS, 326, 745
- Maraschi & Tavecchio (2003) Maraschi L., Tavecchio F., 2003, ApJ, 593, 667
- Mattox et al. (1996) Mattox J. R., et al., 1996, ApJ, 461, 396
- Mücke & Protheroe (2001) Mücke A., Protheroe R. J., 2001, Astroparticle Physics, 15, 121
- Nilsson et al. (2007) Nilsson K., Pasanen M., Takalo L. O., Lindfors E., Berdyugin A., Ciprini S., Pforr J., 2007, A&A, 475, 199
- Nilsson et al. (2018) Nilsson K., et al., 2018, A&A, 620, A185
- Padovani & Giommi (1995) Padovani P., Giommi P., 1995, ApJ, 444, 567
- Perlman et al. (1996) Perlman E. S., et al., 1996, ApJS, 104, 251
- Pian et al. (1998) Pian E., et al., 1998, ApJ, 492, L17
- Raiteri et al. (2010) Raiteri C. M., et al., 2010, A&A, 524, A43
- Raiteri et al. (2017) Raiteri C. M., et al., 2017, Nature, 552, 374
- Richards et al. (2011) Richards J. L., et al., 2011, ApJS, 194, 29
- Roming et al. (2005) Roming P. W. A., et al., 2005, Space Sci. Rev., 120, 95
- Roming et al. (2009) Roming P. W. A., et al., 2009, ApJ, 690, 163
- Schlafly & Finkbeiner (2011) Schlafly E. F., Finkbeiner D. P., 2011, ApJ, 737, 103
- Schroedter et al. (2005) Schroedter M., et al., 2005, ApJ, 634, 947
- Tavecchio & Ghisellini (2016) Tavecchio F., Ghisellini G., 2016, MNRAS, 456, 2374
- Tavecchio et al. (2010) Tavecchio F., Ghisellini G., Ghirlanda G., Foschini L., Maraschi L., 2010, MNRAS, 401, 1570
- Tonry et al. (2012) Tonry J. L., et al., 2012, ApJ, 750, 99
- Tramacere et al. (2007) Tramacere A., et al., 2007, A&A, 467, 501
- Urry & Padovani (1995) Urry C. M., Padovani P., 1995, PASP, 107, 803
- Villata et al. (2007) Villata M., et al., 2007, A&A, 464, L5
- Villata et al. (2009) Villata M., et al., 2009, A&A, 504, L9
- Wakely & Horan (2008) Wakely S. P., Horan D., 2008, International Cosmic Ray Conference, 3, 1341
- Zabalza (2015) Zabalza V., 2015, Proc. of International Cosmic Ray Conference 2015, p. 922
- Zanin et al. (2013) Zanin R., et al., 2013, in Proceedings of the 33rd International Cosmic Ray Conference (ICRC2013): Rio de Janeiro, Brazil, July 2-9, 2013. p. 0773 (http://inspirehep.net/record/1412925/files/icrc2013-0773.pdf)
- Zdziarski & Bottcher (2015) Zdziarski A. A., Bottcher M., 2015, MNRAS, 450, L21
Appendix A Insights on FACT analysis
The quality of the data is evaluated using an artificial trigger rate having a threshold that is set with a digital-to-analog (DAC) converter in DAC counts (Anderhub et al., 2013). For this analysis, the artificial trigger rate above a threshold of 750 DAC-counts (hereafter ) is calculated. This threshold is high enough such that accidental triggers are highly suppressed and the measured rate is due to cosmic-ray induced air showers. Evaluating the dependence of on the zenith distance, a corrected rate is calculated.
To account for seasonal changes of the cosmic-ray rate due to variations in Earth’s atmosphere, a reference value is determined for each moon period. Data with good quality are selected using a cut of . This rather conservative cut was chosen, as part of the data (including the flare) were taken, when the weather phenomenon Calima occurred, a.k.a. Saharan Air Layer (SAL), i.e. a layer carrying dust from the Sahara which can extend from the African coast to the Caribbean (Dorner et al., 2009; Fruck et al., 2014).
As the SAL absorbs Cherenkov photons, the observed size of the showers is reduced. Consequently, the reconstructed energy of -ray showers, which is mainly proportional to the size of the shower, is biased (i.e., the observed energy is lower than the true energy of the incoming ray) and the trigger efficiency decreases resulting in a reduction of the reconstructed -ray flux. This also affects the cosmic-ray rate and its dependency on the dust concentration is shown in Beck et al. (2019). Therefore, the standard data selection cut of would have cut away a large fraction the data suffering from the SAL. Instead, we adopt the above-mentioned conservative cut and apply a correction to the -ray flux. Given its strong dependency on the SAL, the can be used to estimate the energy bias in the observed -ray showers. First, under the assumption of a constant cosmic-ray flux (following a power law with index ), the reduction in the can be translated into a bias in the observed energy that is responsible for the measured decrease in the cosmic-ray rate. Secondly, assuming that the portion of Cherenkov light affected by the SAL is similar between hadronic and -ray showers, the estimated energy bias is further used to calculate a correction factor applied to the measured -ray flux. We consider here that 1ES 2344+514 follows a power-law with index (Allen et al. (2017)). The correction factors are calculated on a nightly basis and consist of at most % percent of the flux, thus remaining within the statistical uncertainties. We complement the FACT observations reported in Sec. 3 with the daily light curve around the flare in Fig. 8.