Observational constraints on the slope of the radial acceleration relation at low accelerations
Abstract
The radial acceleration relation (RAR) locally relates the ‘observed’ acceleration inferred from the dynamics of a system to the acceleration implied by its baryonic matter distribution. The relation as traced by galaxy rotation curves is one-to-one with remarkably little scatter, implying that the dynamics of a system can be predicted simply by measuring its density profile as traced by e.g. stellar light or gas emission lines. Extending the relation to accelerations below those usually probed by practically observable kinematic tracers is challenging, especially once accounting for faintly emitting baryons, such as the putative warm-hot intergalactic medium, becomes important. We show that in the low-acceleration regime, the (inverted) RAR predicts an unphysical, declining enclosed baryonic mass profile for systems with ‘observed’ acceleration profiles steeper than (corresponding to density profiles steeper than isothermal – ). If the RAR is tantamount to a natural law, such acceleration profiles cannot exist. We apply this argument to test the compatibility of an extrapolation of the rotation curve-derived RAR to low accelerations with data from galaxy-galaxy weak lensing, dwarf spheroidal galaxy stellar kinematic, and outer Milky Way dynamical measurements, fully independent of the uncertainties inherent in direct measurements of the baryonic matter distribution. In all cases we find that the data weakly favour a break to a steeper low-acceleration slope. Improvements in measurements and modelling of the outer Milky Way, and weak lensing, seem like the most promising path toward stronger constraints on the low-acceleration behaviour of the RAR.
keywords:
dark matter – gravitation – galaxies: kinematics and dynamics – gravitational lensing: weak1 Introduction
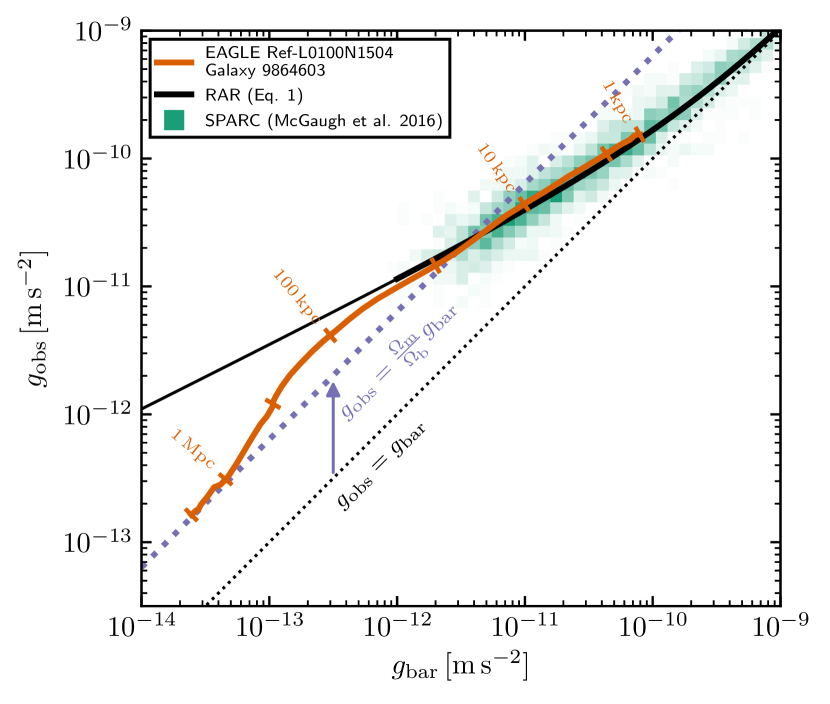
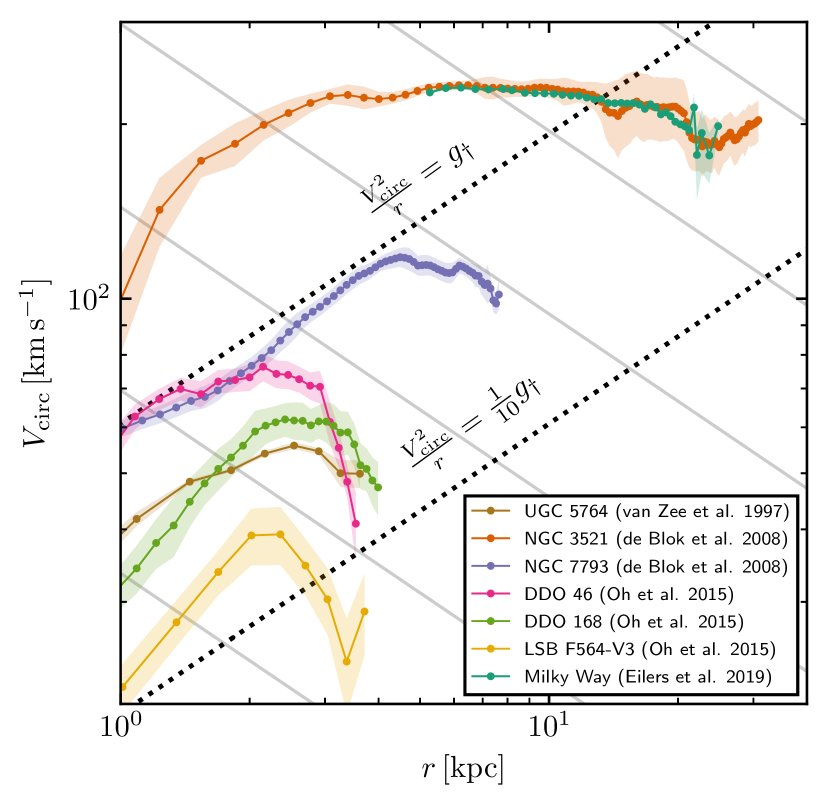
McGaugh et al. (2016) used galaxy rotation curve measurements to show that there is a tight relationship between the ‘observed’ local circular acceleration, , within a galaxy, and the acceleration expected at the same location given the visible distribution of matter, . They show (reproduced in Fig. 1) that the following functional form provides a good fit to the data for late-type galaxies over the observed range in accelerations ():
| (1) |
with , which we will assume throughout this work111We will sometimes refer to Eq. 1 with this value of as the ‘fiducial RAR’ below.. They also note that the observed scatter in the relation seems to be consistent with originating entirely from measurement uncertainties, i.e. the intrinsic relation has nearly zero scatter, and Lelli et al. (2017) further point out that the residuals from their fiducial relation do not correlate with stellar surface brightness, galaxy size, or gas fraction. At the high-acceleration end, , that is, the observed acceleration is fully explained by the observed mass distribution. At the low-acceleration end, however, the observed acceleration is higher than the Newtonian expectation if light follows mass. This can be explained either by the presence of additional mass – either dark matter or, more prosaically, baryons not yet accounted for – or by a departure from the Newtonian theory of gravity in the low-acceleration limit.
The low-acceleration limit of Eq. 1 happens to be exactly that proposed in the theory of MOdified Newtonian Dynamics (MOND; Milgrom, 1983), leading the RAR to be interpreted by some as strong evidence in support of MOND (e.g. Famaey & McGaugh, 2012; Kroupa, 2012; McGaugh, 2015). The emergent gravity (EG) theory of Verlinde (2017) also has the same222The transition between the high- and low-acceleration limits has a slightly different form than that of Eq. 1, see Appendix A low-acceleration limit (Brouwer et al., 2017), and the Weyl conformal gravity theory also has a similar low-acceleration behaviour (Islam & Dutta, 2020). Others argue that the RAR can be explained in -based models of galaxy formation without fine-tuning beyond requiring that galaxies follow the observed scaling relations in mass, characteristic velocity, and size (e.g. van den Bosch & Dalcanton, 2000; Kaplinghat & Turner, 2002; Santos-Santos et al., 2016; Keller & Wadsley, 2017; Navarro et al., 2017; Ludlow et al., 2017; Dutton et al., 2019; Wheeler et al., 2019).
Since the initial definition of the RAR by McGaugh et al. (2016), the claim that the acceleration scale in Eq. 1 is universal has been called into question (e.g. Rodrigues et al., 2018; Rong et al., 2018; Stone & Courteau, 2019; Chan & Del Popolo, 2020; Zobnina & Zasov, 2020). Stone & Courteau (2019) further suggest that the scatter may be much larger than claimed by McGaugh et al. (2016). Though these observations may yield useful insight into the physical interpretation of the RAR, for the present study we will assume a fixed value of , and negligible scatter.
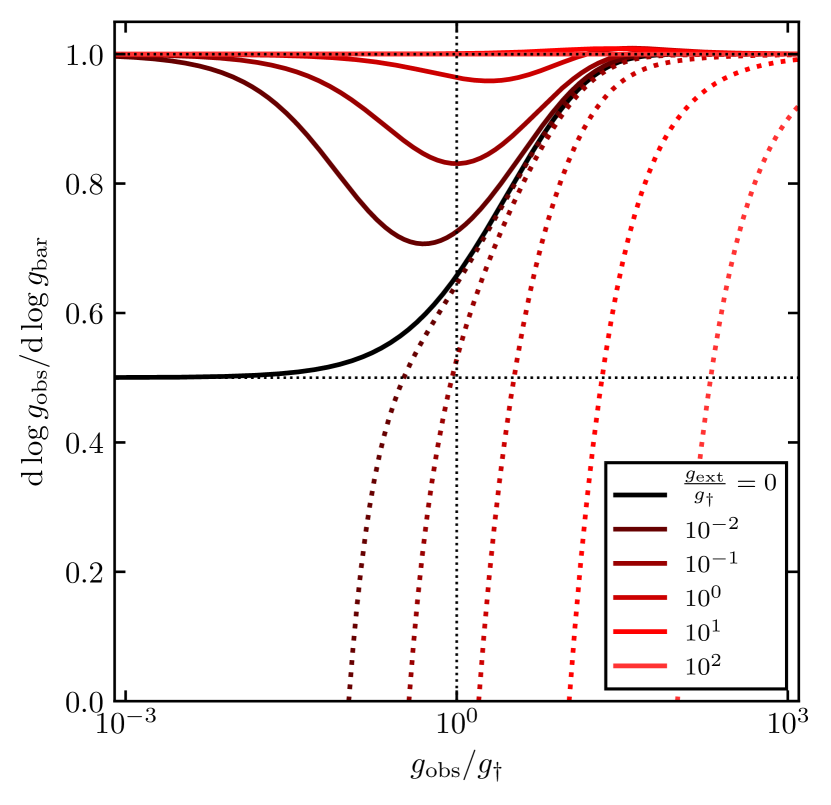
Although the rotation curve-based measurement of the RAR (McGaugh et al., 2016) extends decades in acceleration below , there is a case to push to lower accelerations in order to discriminate between modified gravity and dark matter models. In MOND, for instance, the scaling should continue to arbitrarily small accelerations, whereas in a universe with a baryon fraction the RAR should eventually bend again and converge to on scales large enough that the enclosed ratio of baryonic and dark matter reliably converges to the cosmic mean, as illustrated in Fig. 1. An extension of the RAR to sufficiently low accelerations should therefore be able to discriminate between theories. In practice both of these predictions are more complicated: in the MOND case, once acceleration fields external to the system under study become important, corrections for the external field must be taken into account (Brada & Milgrom, 2000, and references therein), while in neighbouring haloes constitute departures from spherical symmetry which must in principle be taken into account on the scales in question. Nevertheless, it seems clear that the low-acceleration behavior of the RAR should be qualitatively different in these two scenarios.
The RAR can be extended decades toward lower accelerations by including dwarf spheroidal (dSph) galaxies. Lelli et al. (2017) attempted this and found tentative evidence for an upturn in the relation, but were hampered by concerns regarding the possible modified gravity corrections needed to account for the external acceleration field due to either the Milky Way or Andromeda. It is challenging to extend the relation any further since measurements must be made either in extremely low-mass, intrinsically faint systems which are currently only observable in close proximity to more massive hosts, or at large distances around more massive systems. In the latter case, eventually the unknown distribution of baryons in the ‘warm-hot intergalactic medium’, and other difficult-to-observe phases, becomes a dominant systematic uncertainty on (Fukugita et al., 1998; Fukugita & Peebles, 2004; de Graaff et al., 2019; Ghari et al., 2019): any upturn in the RAR at the low-acceleration end is suspect since is always implicitly a lower limit.
In Sec. 2 we outline a simple argument which shows that, if Eq. 1 holds, some acceleration profiles have no corresponding physically allowed baryonic acceleration profiles , implying that a lower limit can be placed on the low-acceleration slope of the RAR without measuring . In Secs. 2.1–2.4 we outline how this argument can be applied in practice for the cases of galaxy rotation curves, galaxy-galaxy weak gravitational lensing, stellar kinematics in dSph galaxies, and the orbits of satellites of the Milky Way. We summarize in Sec. 3.
2 The RAR as a predictor of baryons
As it is usually presented (Eq. 1), the RAR implies that the dynamics of a system can be predicted from its baryonic mass distribution: . However, this function can be inverted in order to predict the baryonic mass distribution. The functional form proposed by McGaugh et al. (2016) is not analytically invertible, but is straightforward to invert numerically.
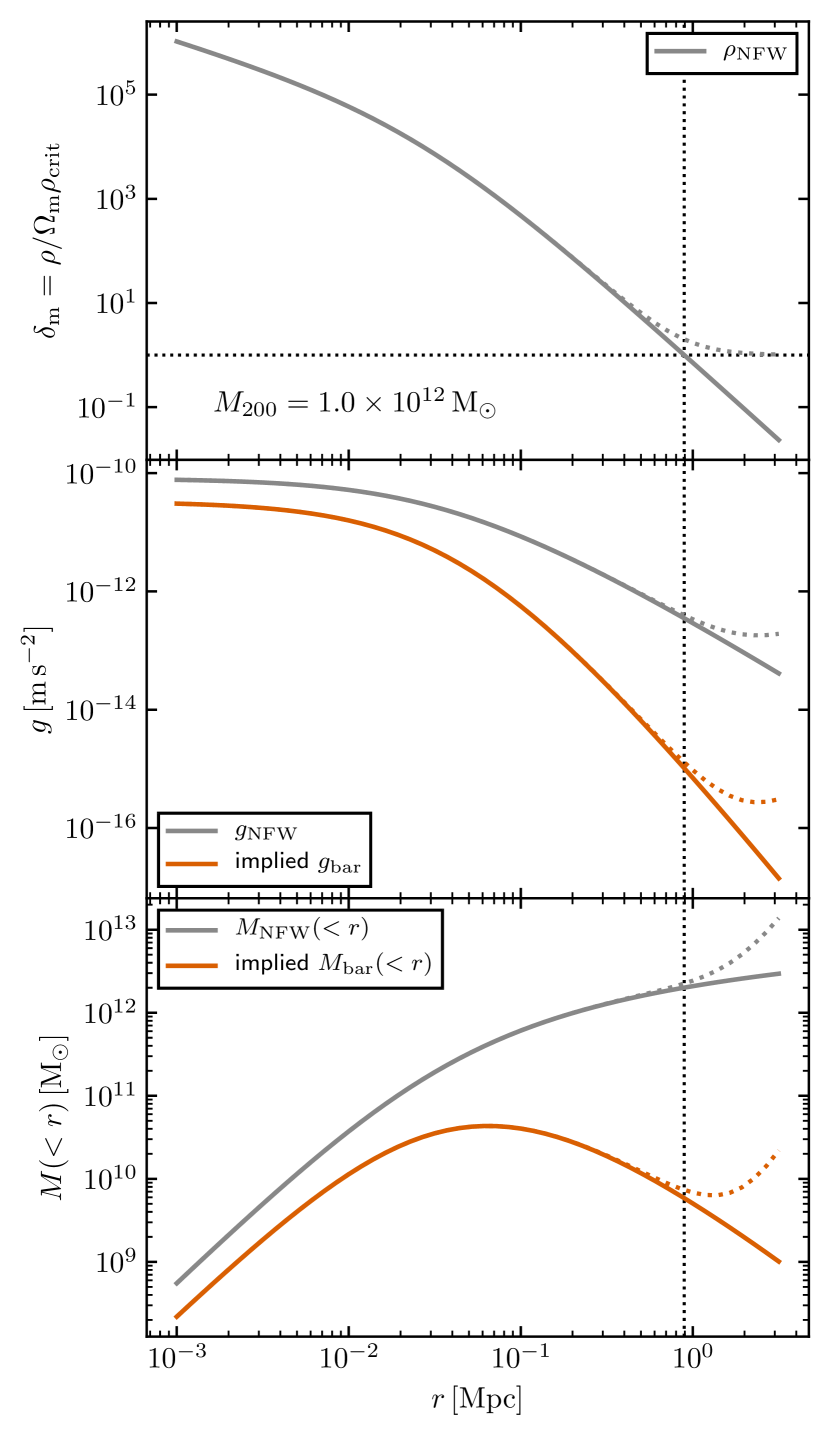
In Fig. 2, we show an illustrative application of this inverted function. For simplicity, we assume spherical symmetry throughout this example. We use an NFW halo model (Navarro et al., 1996) as an example as it aptly illustrates the mutual incompatibility between the modified gravity and dark matter-based interpretations of the RAR. The upper panel shows the density profile such a model with a mass333The mass is defined as that enclosed within a sphere with a mean enclosed density the critical density for closure, . and concentration , in units of the mean matter density. The concentration is chosen such that the halo lies approximately on the mass-concentration relation of Ludlow et al. (2014) for . The vertical dotted line marks the radius where the halo density crosses the mean matter density444We adopt and ., intended as a crude estimate of the location of the extreme outer edge of the halo. The dotted line corresponds to the same NFW profile summed with a constant background density equal to the cosmic mean. The centre panel of Fig. 2 shows with a grey line the corresponding acceleration profile:
| (2) | ||||
| (3) |
where is the mass enclosed within radius (shown with a grey line in the lower panel). We then solve Eq. 1 for the baryonic acceleration profile implied assuming555In a dark matter model it would seem natural to instead assume , which would lead to a qualitatively similar result below. However in alternative theories of gravity such as MOND, accelerations do not add linearly, so we assume to preserve the generality of our example. . The implied , assuming only that Eq. 1 holds, is shown with the orange line. The dotted lines of corresponding colour include the constant background density, as in the upper panel. The corresponding cumulative mass profiles are shown in the lower panel. The implied (orange line) is clearly unphysical: a cumulative mass profile must be monotonically increasing.
The above example illustrates that some acceleration profiles, such as the in Fig. 2, cannot arise in a universe where the RAR is taken to be a natural law. The conditions required to produce declining profiles (which are unphysical) depend on the acceleration scale. When , then and any physically reasonable observed acceleration profile should imply a physically reasonable . In the low acceleration limit , however, , which gives:
| (4) |
While the above example is loosely inspired by a galaxy model including baryons and (non-baryonic) dark matter, this is not required for our argument to be valid. Clearly, any inferred to increase less steeply than linearly with radius will lead to a declining cumulative baryonic mass profile – or, in terms of density, any profile inferred to fall off more steeply than isothermal () will be problematic.
One interesting implication of the above is that it is possible to test for some types of departures from Eq. 1 without measuring the baryonic acceleration profile. Provided the system being considered is close to spherically symmetric and close to dynamical equilibrium, if its observed acceleration profile (i.e. inferred from a dynamical measurement) implies a density profile steeper than isothermal in a region where , then666Since on the RAR , implies . there is no physical baryonic mass profile that will place the system on the fiducial RAR.
In the next sections we explore possible observational signatures of acceleration profiles that would imply a departure from in the low-acceleration limit777We give a derivation of the acceleration-dependent limit on the slope in Appendix A..
2.1 Rotation curves
Applying the above argument to the speed of a particle on a circular orbit in a spherically symmetric potential leads to a simple constraint on rotation curves compatible with the low-acceleration limit of the RAR. The implied baryonic mass profile is:
| (5) |
Therefore any rotation curve which is declining () in a region where leads to a declining . Note that regardless of whether Eq. 1 holds, rotation curves with slopes falling more steeply than cannot be interpreted as tracers of the total mass profile, independent of the acceleration scale – this limit corresponds to the Keplerian (point mass) circular velocity curve.
Given that the RAR was defined by McGaugh et al. (2016) using galaxy rotation curves, we do not expect these to deviate systematically from the RAR. However, since even a single compelling example of a low-acceleration, declining rotation curve has implications for the physical interpretation of the RAR, we have searched archival rotation curves for any examples meriting further consideration. We have not identified any compelling measurements of low-acceleration, declining rotation curves (see also de Blok et al., 2008; Martinsson et al., 2016), but touch on a few debated examples for completeness. We show a small selection of apparently declining rotation curves in Fig. 3, noting that the error bars shown correspond to the uncertainties quoted in the cited works and are not homogeneously defined.
2.1.1 External galaxies
The SPARC (Lelli et al., 2016) compilation used by McGaugh et al. (2016) includes only one example of a potentially declining rotation curve at low accelerations, UGC 5764, drawn from van Zee et al. (1997), which we reproduce in Fig. 3. However, the decline is only seen on one side of the disc and the reported rotation curve is consistent with a flat slope, within the reported uncertainties.
The study of i kinematics of THINGS survey (Walter et al., 2008) galaxies by de Blok et al. (2008) discusses at length the possible examples of declining rotation curves in their sample, in the context of searching for the signature of the ‘edge’ of dark matter haloes. We reproduce two examples from their analysis, NGC 3521 and NGC 7793, in Fig. 3, which had previously been held up as rare examples of ‘truly declining rotation curves’ (Carignan & Puche, 1990; Casertano & van Gorkom, 1991). However, de Blok et al. (2008) state that an outer decline cannot be unambiguously established for any of their galaxies within the uncertainties on their rotation speeds and inclinations. For NGC 7793, they cite difficulty in modelling an apparent outer warp, while for NGC 3521 the combination of only a mild decline and relatively large uncertainties make the flat rotation curve hypothesis difficult to reject.
We also reproduce in Fig. 3 three rotation curves from the Oh et al. (2015) analysis of the LITTLE THINGS survey (Hunter et al., 2012): those of DDO 46, DDO 168 and LSB F564-V3. Oh et al. (2015) did not comment on individual systems, however Iorio et al. (2017) re-analyzed most of the same galaxies with a qualitatively different 3D fitting technique and commented on any differences in the results. They did not find a declining rotation curve for DDO 168, and pointed out several kinematic irregularities – a clear bar in both the stellar and gas distributions, a ‘very irregular’ outer disc, possibly warped, and possible signs of significant amounts of inflowing/outflowing gas – which may account for the differences. DDO 168 also has a companion, DDO 167, at a projected separation of only 33 kpc (Johnson et al., 2015). Unfortunately neither DDO 46 nor LSB F564-V3 appear in the Iorio et al. (2017) analysis: the former was excluded due to its low inclination (and thus large and uncertain correction to the rotation velocity), while the reason for the exclusion of the latter is unclear. A rotation curve for LSB F564-V3 was also determined by Trachternach et al. (2009, note that in that work the name LSB D564-8 is used), who found no decline in the outer parts. Furthermore, inspection of figs. A.49 & A.7 in Oh et al. (2015) reveals that the declining part of the rotation curves of DDO 46 and LSB D564-8 occurs in regions of very low signal-to-noise ratio.
Finally, we note that the rotation curves of DDO 46, DDO 168 and LSB F564-V3 cannot be interpreted as tracers of the enclosed mass, as they fall more steeply than the Keplerian limit (illustrated by the slope of the thin grey lines in Fig. 3): if taken at face value, the declining rotation velocities in the outer parts of these galaxies imply a (nonsensical) declining cumulative dynamical mass profile.
We conclude that evidence in the literature for low-acceleration, declining rotation curves for external galaxies is marginal, at best. The unique case of the Milky Way, however, may be more constraining, as we elaborate below.
2.1.2 The Milky Way
We also reproduce the Milky Way rotation curve of Eilers et al. (2019) in Fig. 3. Their rotation curve is based on 6-dimensional kinematic information for red giant stars, relying particularly on the APOGEE and Gaia surveys for spectroscopic and astrometric measurements, respectively. We discuss analyses of other kinematic tracers in the outer Milky Way, outside the stellar disc, in Sec. 2.4.
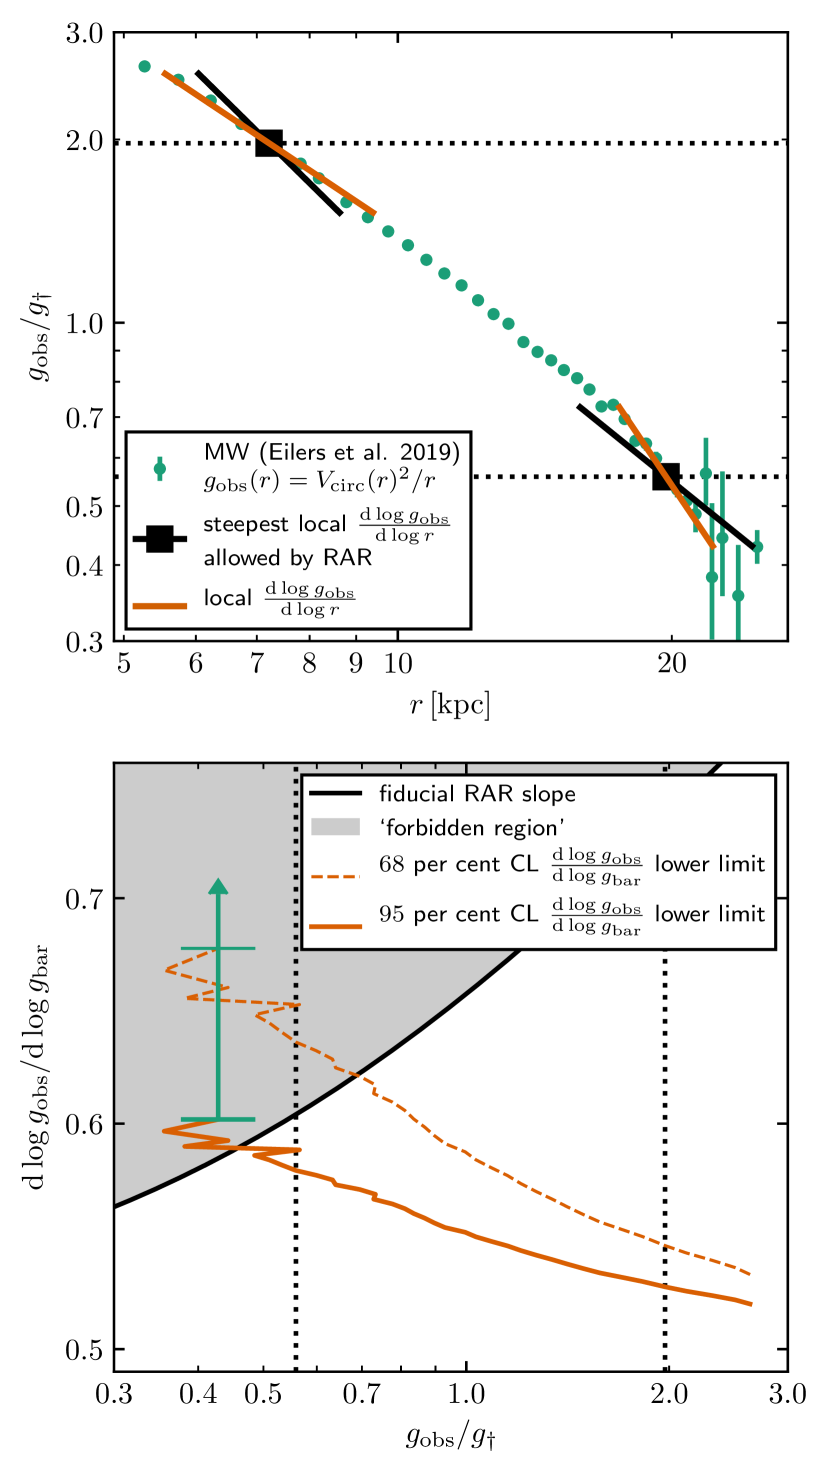
Eilers et al. (2019) reported a significant detection of a gradient in rotation velocity out to a distance of (see also Ablimit et al., 2020, who find the same gradient using Cepheids, albeit with more local fluctuations along the rotation curve). The region of the Milky Way spanned by the Eilers et al. (2019) analysis is in the transition region between the high- and low-acceleration limits of Eq. 1 (see Fig. 3: the Milky Way curve crosses the diagonal dashed line corresponding to , marking the approximate location of the transition between the high- and low-acceleration regimes), so the limiting slope of the rotation curve – or equivalently the acceleration profile – compatible with the fiducial RAR is varying with radius. We illustrate this in Fig. 4; further details are given in Appendix A. In the upper panel, we show the acceleration profile of the Milky Way, derived from the rotation curve as , with points and error bars. The steepest compatible with Eq. 1 is a function of acceleration, we show the limiting slope with black line segments for two example points marked with black squares. At the higher acceleration example point, the Milky Way acceleration profile is shallower than the limit, as illustrated by the orange line segment, which is tangent to the data at the same point. At the lower acceleration point, however, the orange tangent is steeper than the limit implied by Eq. 1, which constitutes evidence for a downward bend away from the fiducial relation.
We further quantify this evidence in the lower panel of Fig. 4. The slope of the fiducial RAR (Eq. 1) as a function of acceleration is shown with the black curve. As the argument laid out in Sec. 2 yields a lower limit on , a constraint lying above this curve – in the grey shaded region – implies a break to a steeper low-acceleration slope than that of Eq. 1. To derive the constraint on the slope as a function of acceleration , we assume the linear fit to the rotation curve given in eq. 7 of Eilers et al. (2019), with the solar radius . We neglect the uncertainties in the solar radius and normalization of the linear fit as the constraint on the RAR slope is minimally sensitive to these. For simplicity, we assume that the statistical and systematic uncertainties on the slope measurement both follow a Gaussian distribution and add the widths in quadrature, for a total standard deviation of . The and per cent upper limits on the (linear) rotation curve slope are then and , respectively. These are the values used to compute the 68 per cent (dashed line) and 95 per cent (solid line) confidence lower limits on the RAR slope in the lower panel of Fig. 4. Comparing with the upper panel, the example at higher acceleration (the dotted lines mark the same two acceleration values in both panels), where the data have a shallow slope compatible with Eq. 1 as described above, yields a constraint well below the black curve in the lower panel. The example at higher acceleration, where the data visually describe a slope steeper than is compatible with the RAR, on the other hand, correspond to a region where the slope of the fiducial relation is excluded at per cent confidence. We summarize the strongest constraint from this measurement, found at the lowest acceleration, corresponding to the outermost radius, with the green symbol in the lower panel: the two horizontal bars mark the and per cent confidence lower limits, joined with an arrow. The width of the horizontal bars is representative of the per cent confidence interval for the acceleration at this radius. We will use similar symbols in figures below.
We note that even incremental improvements of this measurement have the potential to turn this into a very strong limit: the exclusion curves in Fig. 4 are extremely sensitive to the slope of the rotation curve888E.g. the large exponent in Eq. 5 (but note the exponent is acceleration dependent, Eq. 5 holds exactly only in the low-acceleration limit).. For instance, inspecting fig. 3 in Eilers et al. (2019), there is a (formally not significant) hint that the slope of the rotation curve may steepen to beyond – were this steepening999Note that given the current constraint on the rotation speed at , the gradient in the circular velocity cannot be steeper than about – any steeper corresponds to a logarithmic slope , which implies a declining cumulative dynamical mass profile. For similar reasons, the slope must break to a shallower slope before . measured with confidence, the evidence for a steepening relative to the fiducial RAR at low acceleration would be at the -level. Any modest improvements in the size of the confidence intervals at large radii, or the radial extent of the measurement, also have the potential to yield interesting constraints on the low-acceleration behaviour of the RAR.
We next turn to other probes of the low-acceleration regime.
2.2 Weak gravitational lensing
The quantity most straightforwardly inferred from measured galaxy shapes in galaxy-galaxy weak gravitational lensing (hereafter abbreviated GGL) is the excess surface density (ESD) , i.e. the difference between the mean surface density enclosed within radius and the local surface density at radius . This is closely related to the convergence , where , and are the angular diameter distance to the lens and to the source, respectively, and is the angular diameter distance between the lens and the source. While in practice it is not generally possible to uniquely infer the volume density profile given , computing given is simply a matter of evaluating:
| (6) |
where . For the isothermal case , the ESD is particularly simple: . This is illustrated in the left panels of Fig. 5 with the heavy black line (dimensionless units are assumed, with an arbitrary normalization constant). Another simple case is that of a point mass – the surface density is for all , and the mean enclosed density falls off as , implying , illustrated with the orange dashed line in Fig. 5. We also show the profiles for a series of power law profiles both steeper (orange) and shallower (black) than isothermal, with greater departures from shown with thinner lines. Under the assumption of a power-law density profile, an ESD which falls off faster than (orange lines) implies a volume density profile which falls off too steeply to be compatible with Eq. 1 in the low-acceleration regime.
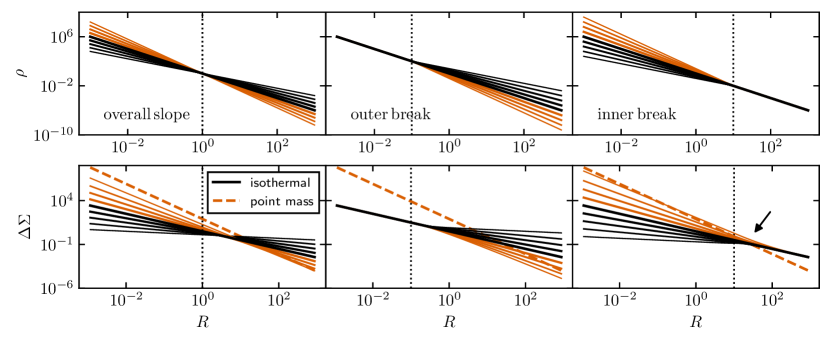
Though not all astrophysically plausible density profiles are power laws – e.g. the NFW and most other dark matter halo models – all may be approximated by a (possibly large) series of power law segments. In the centre and right panels of Fig. 5, we illustrate the profiles corresponding to two-segment power law profiles where either the inner (centre panels) or outer (right panels) density profile segment goes as . We note that only density profiles which are for some radii steeper than – highlighted in orange – give rise to ESD profiles which are anywhere steeper than – also highlighted in orange. This suggests that GGL is a promising technique for constraining the low-acceleration slope of the RAR, especially considering that GGL measurements can extend to very large () radii and, consequently, low accelerations. We identify one caveat, highlighted with an arrow in the lower right panel of Fig. 5: a steep inner leads to a steepening in extending to somewhat larger radii. A steep in a high-acceleration region, where this is compatible with the fiducial RAR, could therefore lead to a steep in a low-acceleration region. Care must be taken to take this into account, but a sufficiently extended ESD profile should still be able to constrain the low-acceleration slope of the RAR.
We have assumed above that the gravitational lensing effect is that of general relativity. However, there are potentially appealing interpretations of the RAR which explain the correlation between and as due to a departure from the GR force law at low accelerations. We note that our method of looking for acceleration profiles which imply declining cumulative baryonic mass profiles is also applicable, for instance, in MOND: the MOND potential for a point mass leads to a lensing effect which, in the low-acceleration limit, would imply, in the context of GR, a mass profile (Milgrom, 2013), that is the ‘singular isothermal sphere’ (SIS) profile. Adding mass to the lens at must necessarily make rise more steeply, so conversely an apparent mass profile rising more gradually than the SIS implies less mass at , but for a point mass there is no mass at to remove, which is simply a re-statement of our argument above. An analogous argument holds for the case of EG (Brouwer et al., 2017); whether the same argument holds in other theories of modified gravity would need to be assessed on a case-by-case basis.
Constraining the RAR using GGL requires some additional care – particularly in ensuring that the measured region is indeed in the low-acceleration regime. The ESD profiles published in Brouwer et al. (2017, see their fig. 3) are constructed from galaxy shape measurements from the (at the time partially completed) Kilo-Degree Survey (KiDS; de Jong et al., 2013; Hildebrandt et al., 2017) in a region overlapping with the Galaxy and Mass Assembly (GAMA; Driver et al., 2011; Robotham et al., 2011; Liske et al., 2015) spectroscopic survey. The lens galaxies used were selected to be the most massive objects within a neighbourhood in radius, reducing, but not eliminating, contamination by the acceleration field of neighbouring objects (particularly important in the context of a MOND interpretation of the RAR, see Appendix B). Guided by Fig. 5, we explore below whether current GGL measurements are likely to yield interesting constraints on the low-acceleration behaviour of the RAR; a more thorough analysis leveraging the (now completed) KiDS survey data set will be presented in a companion paper (Brouwer et al., in preparation).
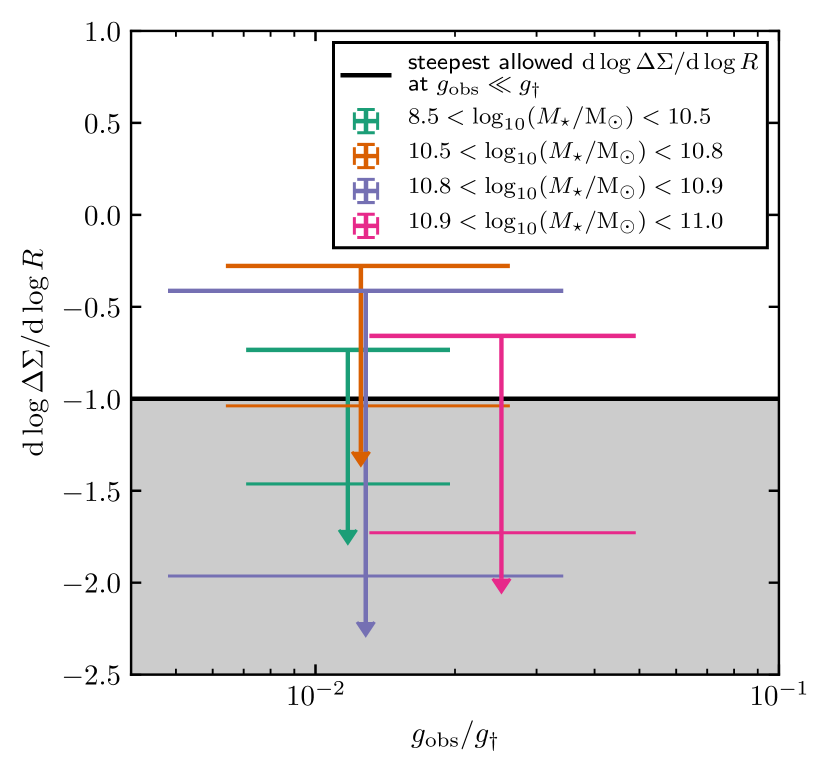
In contrast to the circular velocity curve, whose slope can be directly translated to a limit on the slope of Eq. 1 (see Appendix A), such a limit as a function of acceleration cannot be expressed in terms of the slope of the ESD profile because it depends both on the local and mean enclosed surface densities. However, as detailed in the discussion surrounding Fig. 5, the low-acceleration limit of Eq. 1 is inconsistent with . We therefore estimate in the outer (i.e. lowest acceleration) parts of the ESD profiles of Brouwer et al. (2017) and compare with this limit in Fig. 6.
We estimate by constraining the parameters of a power law using the three101010We have repeated this analysis using from the three up to the ten outermost points, in all cases the qualitative interpretation outlined below is unchanged. outermost measurements in each panel of fig. 3 in Brouwer et al. (2017). We marginalize over the normalization parameter and plot the and percentiles of the distribution for the power law slope as the corresponding upper limits in Fig. 6. The acceleration is in general not straightforward to estimate given only , however for a density profile, corresponding to a ESD profile, there is a very simple relation: , where (i.e. the deprojection is accounted for). The observed ESD profiles are close to , so for simplicity we assume this expression to estimate , using the per cent confidence interval for the power law fit evaluated at the radius corresponding to the -outermost point in each profile.
Fig. 6 shows that the ESD profiles of these lens galaxies are steeper than at per cent confidence, but not at per cent confidence, at accelerations of . At these accelerations the slope of Eq. 1 is very close to its low-acceleration limit (see Fig. 9), so these measurements constitute weak evidence for a break in the RAR to a slope steeper than the fiducial value at low-acceleration. We note that we see no evidence for this measurement to be subject to the ‘false-positive exclusion’ case illustrated in Fig. 5, but that ruling this out definitively requires a more in depth analysis and would be facilitated by a measurement with higher signal-to-noise ratio. Such an analysis of improved measurements will be included in Brouwer et al. (in preparation).
2.3 Jeans modelling of resolved stars in dwarf spheroidals
At first glance, dSph galaxies seem to be ideal candidates to probe the low-acceleration behaviour of the RAR: their densities are so low that even in their centres the acceleration is, at most, comparable to . However, while the low-acceleration regime is relatively easy to access via measurements of these objects, their close proximity to the Milky Way (or Andromeda) makes the interpretation of these measurements extremely challenging. Being embedded in the tidal field of the Galaxy, it is likely that none of the dSphs discussed in this section are truly in dynamical equilibrium. Interpretation in the context of modified gravity theories such as MOND are even more challenging as even a spatially constant external acceleration field can qualitatively and anisotropically change the dynamics of an embedded system. We nevertheless derive limits on the low-acceleration slope of the RAR based on measurements of these systems, and discuss their reliability in light of these issues, below (see also Appendix B).
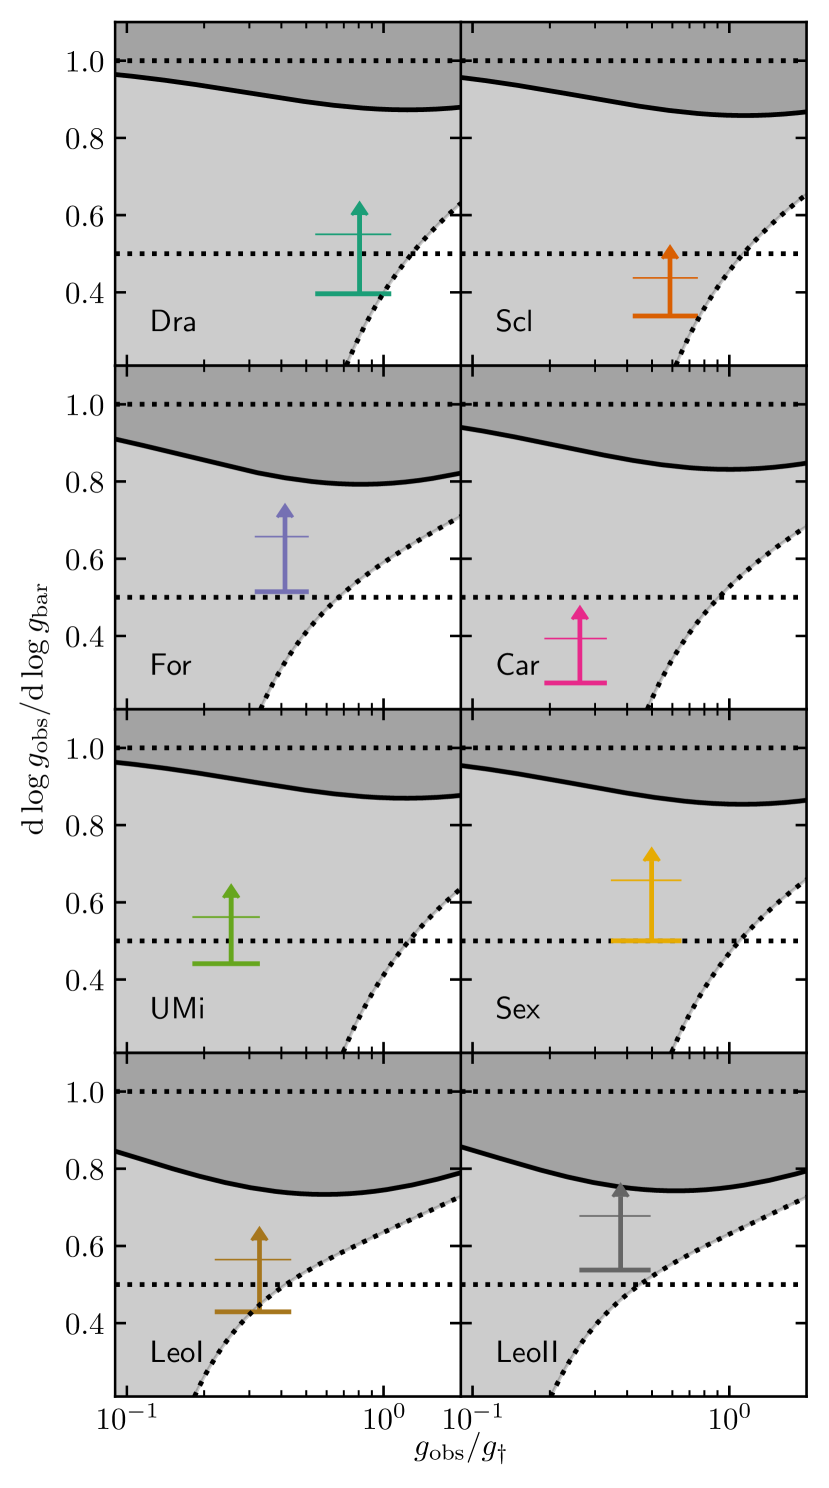
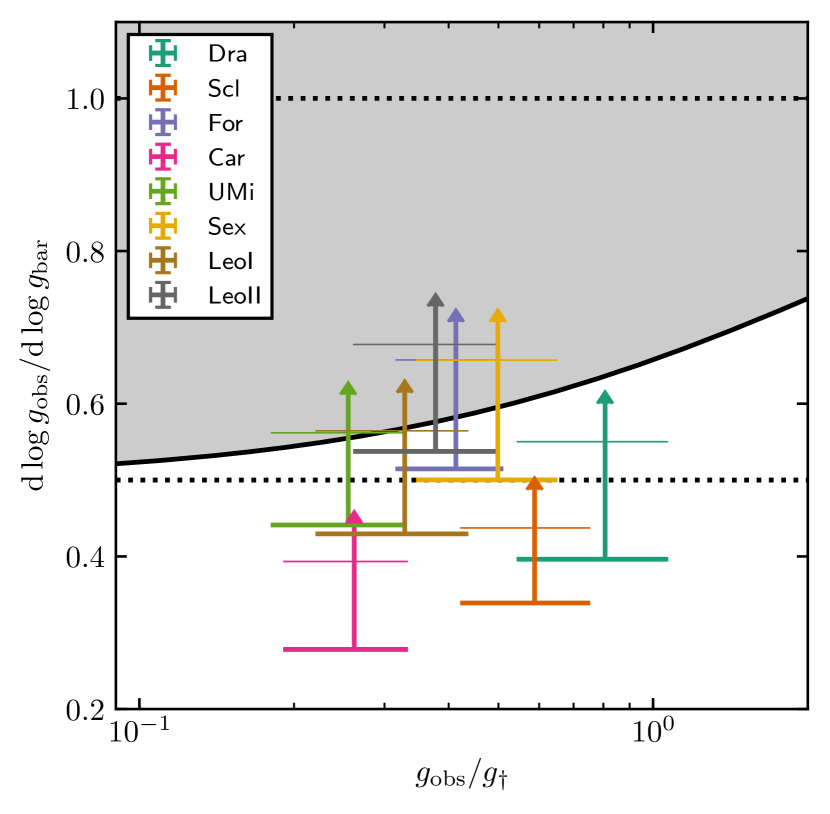
We use the Jeans models for 8 dSph galaxies presented in Read et al. (2019, see their figs. 3 & 4): Dra, Scl, For, Car, UMi, Sex, LeoI and LeoII; we omit WLM and Aqr which have qualitatively different observations and analysis, and/or very weakly constrained density profiles. Read et al. (2019) used their Jeans modeling routine GravSphere (Read & Steger, 2017; Read et al., 2018, see also the tests of the method by Genina et al., 2019) to constrain a density profile for each dSph. The density profile is represented as a series of connected power law segments in the intervals between , , , , and , times the projected half-light radius of the population of tracer stars. This profile can be described by parameters: the slope in the radial intervals and an overall normalizaton. It is clear from a visual inspection of figs. 3 & 4 in Read et al. (2019) that the confidence intervals for the density profiles of several of the dSphs include slopes steeper than isothermal, and in some cases that density slopes may be excluded at high confidence.
The joint posterior probability distribution for the density profile parameters was estimated by Read et al. (2019) using a Markov chain Monte Carlo estimator. We derive the marginalized constraints on the enclosed mass within each radius where the slope changes, and on the individual slopes, directly from the Markov chain samples. The measurements at the outermost radii invariably give the strongest constraint on the low-acceleration slope of the RAR, so we focus on these below. We translate the constraint on the enclosed mass into one on , and that on the slope of the density profile into a lower limit on the slope of the radial acceleration relation (see Appendix A). The resulting exclusion limits on the low-acceleration RAR slope at (thin horizontal bars) and per cent confidence (thick horizontal bars) as a function of acceleration scale are illustrated in Fig. 7. There is some weak evidence ( per cent confidence) from LeoII, Sex111111The radial coverage of the stellar spectroscopy in Sextans extends only to per cent of the half-light radius, whereas for the other dSphs discussed here the coverage extends at least to 2 half-light radii., For, UMi and LeoI for a break from the fiducial RAR toward a steeper low-acceleration slope.
Improving these constraints seems realistic: it should be mostly a matter of shrinking the confidence intervals on the density profiles of the dSphs. One straightforward (but tedious and expensive in terms of telescope time) way to achieve this is to obtain more spectra of stars in each system, but this may not even be necessary: the focus of the Read et al. (2019) study was the inner slope of the density profile. It is conceivable that some simple adjustments to the modelling process, e.g. how the data are binned, may lead to improved constraints on the outer density slopes.
An important caveat to the above discussion is that Jeans modelling assumes a spherical system which is in dynamical equilibrium. If either of these assumptions is significantly violated, the models may not accurately reflect the actual mass profile of the system under consideration. The tests of GravSphere by Genina et al. (2019) suggest that the confidence intervals in Fig. 7 (and Fig. 11) are likely reliable despite the mild asphericity and departures from equilibrium in realistic dSph galaxies. However, McGaugh & Wolf (2010) show that the deviation of dSphs from the baryonic Tully-Fisher relation (BTFR; McGaugh et al., 2000, the RAR can be thought of as the spatially resolved analogue of the BTFR) anti-correlates with an estimate of how close each system is to dynamical equilibrium.
Note that in MOND, the fact that the Milky Way dSphs are embedded in the acceleration field of the Galaxy implies a significant correction to the expected relation between and , i.e. the RAR (Brada & Milgrom, 2000). This does not change the limits derived for the RAR slope (symbols in Fig. 7), but does change the expected slope of the RAR at a given acceleration (line in Fig. 7). We elaborate on this external field effect (EFE) in Appendix B. Other modifications to gravity which predict the RAR may have qualitatively similar, but quantitatively different, corrections which would need to be accounted for on an individual basis.
2.4 Outer Milky Way
In Sec. 2.1.2 above, we discussed the constraint on the low-acceleration RAR slope from the Milky Way rotation curve as determined from the rotation speeds of stars in the disc. However, other populations of dynamical tracers extend further into the outer Milky Way and may also yield interesting constraints on the low-acceleration behaviour of the RAR. There is an extensive literature aiming broadly to constrain the mass profile of the Galaxy (see Wang et al., 2020, for a recent review and data compilation; see also Sofue, 2020). We do not attempt an exhaustive consideration of every published measurement, but instead consider a few examples likely to be more constraining in the context of the argument of Sec. 2. We note that many studies (e.g. Kafle et al., 2014; Watkins et al., 2019; Zhai et al., 2018; Sohn et al., 2018; Posti & Helmi, 2019) assume a form of the gravitational potential (or, equivalently, density profile, circular velocity curve, etc.), usually motivated by the NFW halo profile, which excludes a low-acceleration slope ab initio. Other studies adopt priors on the power law slope of the potential which already exclude the fiducial RAR (e.g. Eadie & Jurić, 2019; Vasiliev, 2019), or calibrate on or otherwise tie their analysis to the predictions of galaxy formation simulations assuming the cosmology (e.g. Xue et al., 2008; Patel et al., 2018; Li et al., 2019; Cautun et al., 2019; Callingham et al., 2019), implicitly assuming that the density profile has a form similar to that found in such simulations. While these are well-motivated priors, we focus below instead on studies which allow for the possibility of radial profiles compatible with the low-acceleration limit of Eq. 1.
We begin by considering fig. 2 in the review of Wang et al. (2020), which collates measurements of the mass enclosed within various radii in the outer Milky Way from nearly individual publications. All are subject to various assumptions and possible systematic biases (and some exclude the fiducial RAR by construction, as discussed above), but the wide variety of methodologies guarantees that some, at least, are independent. The overall picture that emerges is one where the mass profile rises with a slope shallower than unity at radii corresponding to accelerations , suggesting that the RAR for the Milky Way must bend down from the fiducial shape. We estimate constraints on the low-acceleration slope of the RAR based on a small selection of these studies below.
Deason et al. (2012) used a sample of blue horizontal branch (BHB) stars in the Milky Way stellar halo observed in the course of the Sloan Digital Sky Survey (SDSS) to constrain the parameters of a model of the distribution function for the stars. They fixed the parameters describing the density of tracers (stars) and fit only for the velocity anisotropy of tracers, and the slope and normalization of the gravitational potential. Their modelling preferred a slope121212 corresponds to a density profile , while is the Keplerian potential. for the gravitational potential of at () per cent confidence (estimated from their fig. 2) in the radial interval . The constraint is slightly weaker – but still favours – if the tracer density is assumed to be spherical rather than flattened, a possibility that the authors considered less likely. We plot the corresponding approximate and per cent confidence lower limits on the RAR slope in Fig. 8 with the thick and thin horizontal bars, respectively; the width of the bars is set by the accelerations at and assuming the authors’ preferred normalization of the gravitational potential ( in their notation). This measurement weakly disfavours the low-acceleration slope of the fiducial RAR.
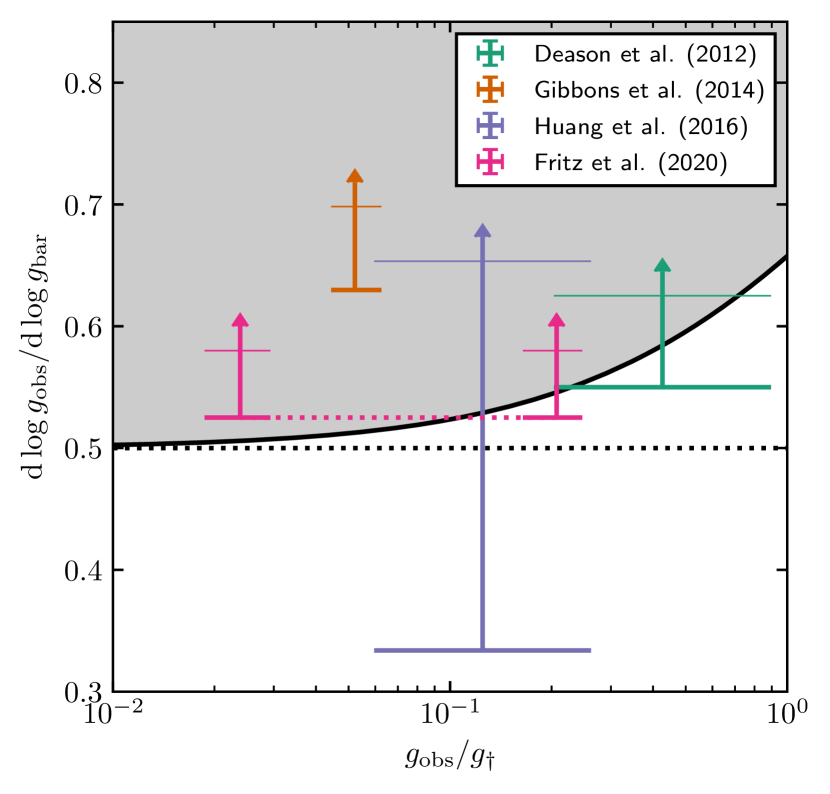
Bhattacharjee et al. (2014) used multiple outer Milky Way kinematic tracers (stellar halo K-giants, BHB stars, and a heterogenous mix of globular clusters, field horizontal branch stars and dSph satellites). They treated each population separately and used a Jeans analysis to constrain the circular velocity curve in the radial interval spanned by each tracer population. They found a gentle decline from around the edge of the stellar disc () out to at least (see e.g. their fig. 5), corresponding to an acceleration scale where the slope of the fiducial RAR is expected to be very close to its asymptotic value of . As explained above, the constraint on the RAR slope is extremely sensitive to the rotation curve slope, so even the gentle decline is likely enough to argue against the fiducial RAR, although a flat slope beyond would seem difficult to exclude conclusively from these measurements, given the estimated errors.
In Belokurov et al. (2014), the authors pointed out that the rate of precession of an orbit depends on the slope of the potential; there is no precession in a Keplerian potential, while an orbit in a flat potential (corresponding to a density profile ) precesses by per radial period. They showed that the shape of the Sagittarius stellar stream favours a density slope steeper than . Gibbons et al. (2014) extend the same analysis. They assumed a circular velocity curve which is flat in the inner part and has a power law slope of in the outer part, with the transition occurring at a characteristic radius as described in their eq. 4. The corresponding constraint on the RAR slope is:
| (7) |
Based on their fig. 12, we estimate , and . Their measurement extends to radii of , so we use this interval and the median values for to fix the acceleration scale (i.e. the width of the symbol in Fig. 8). We estimate a conservative () per cent confidence lower limit on the RAR slope by evaluating Eq. 7 at assuming values offset by 2 (1) standard deviations, for upward from the median, and for , downward – i.e. the offsets which give the weakest constraints131313These offsets run counter the clear correlation between and (Gibbons et al., 2014, fig. 12), but accounting for the correlation would make the limit stronger, so this decision is again conservative.. This measurement represents a very strong exclusion of the low-acceleration slope of the fiducial RAR. Even at , where the constraint is weaker because of the higher acceleration, and because the constraint on the circular velocity curve slope is shallower, the fiducial RAR slope is still rejected at per cent confidence. This is intuitively easy to understand: if Eq. 1 holds, then the precession angle of the Saggitarius stream should be per radial period, a possibility which is straightforward to exclude (Belokurov et al., 2014). However, if the precession angle per period is modified by an effect not captured in the model of Gibbons et al. (2014), then this strong limit does not hold – for instance, the predicted precession angle differs, in general, in modified gravity theories. In the particular case of MOND, for instance, the expected precession angle for the Sagittarius stream orbiting the Galactic disc (without dark matter) is nearly identical to that expected in Newtonian gravity for a Milky Way with a mildly oblate dark matter halo, making the stream a poor discriminant between these two scenarios (Read & Moore, 2005).
Huang et al. (2016) measured a circular velocity for the Milky Way combining observations of H i gas, primary red clump giant and halo K-giant stars. They derived weaker constraints than Eilers et al. (2019, see Sec. 2.1.2) at radii , but the K-giant sample they used allowed them to extend their measurement out to , so we focus here on the portion of the measurement at large radii. We estimate an upper limit on in the interval (avoiding the putative ‘ring’ features, see e.g. their fig. 12) as follows. We constrain the parameters of a cubic polynomial using the data in this interval assuming that the uncertainties quoted in their table 3 are Gaussian, and under the constraint that . This prior interval is limited at the lower end by the slope for a Keplerian potential and at the upper end by the plausible hypothesis that the circular velocity curve should not be sharply rising at these large radii. From the posterior distribution for the parameters of the polynomial, we derive the and per cent lower limits on the slope as a function of radius, then take the maximum (i.e. most constraining) value along the two curves and plot the corresponding limits on the RAR slope in Fig. 8, with the acceleration scale fixed by the interval spanned by the circular velocity curve in the radial range considered. There is clearly some evidence for a declining rotation curve – indeed this is easily visible by eye in their fig. 12 – but the uncertainties are large enough that it is impossible to exclude a near-flat slope with high confidence.
Fritz et al. (2020) provided constraints on the mass within and of the Galactic centre, and on the power-law slope of the mass profile, , between these radii. They used the Watkins et al. (2010) mass estimator applied to a sample of Milky Way satellites with proper motion measurements. They found that this estimator is biased when applied to numerical simulations of dark matter haloes from the ELVIS suite but derive a correction for this, thus implicitly assuming that an analogous bias applies when the estimator is applied to the Milky Way data. We adopt their estimate ( per cent confidence interval), and roughly estimate the and per cent lower limits on this value as and , respectively. We plot the constraint on the RAR slope:
| (8) |
in Fig. 8 at accelerations derived from the enclosed mass141414We use ‘case 1’ from their table 1, which is the largest mass estimate and therefore the most conservative choice in the context of constraining the RAR slope. within and with two symbols connected by a dotted line, where using the inner radius corresponds to the more conservative assumption. We note that the mass profile slope is in practice simply derived from the two enclosed mass estimates under the assumption that the mass profile is a power law. If the profile is assumed instead to have more freedom in shape, then the most that can be said is that it should have the average slope at some radius in the interval considered. Altogether, this measurement is suggestive of a steepening at low acceleration relative to the fiducial RAR, but depending on the interpretation perhaps only at marginal significance, and in addition dependent on validity of the assumed bias correction.
Taken altogether, the limits shown in Fig. 8 – which we stress we have estimated rather crudely – suggest that analyses of various dynamical tracers in the outer Milky Way are likely either able to or on the brink of yield strong constraints on the low-acceleration behaviour of the RAR.
3 Summary and Conclusions
McGaugh et al. (2016) established the RAR as a tight empirical scaling relation for late-type galaxies, at least out to the lowest accelerations probed by their H i gas discs. Given such an empirical relation, it is natural to explore the limits of its applicability. That the relation might depart from the extrapolation of the fiducial form of Eq. 1 was nearly immediately recognized: dSph galaxies apparently have higher than would be expected for their (Lelli et al., 2017), but the interpretation of this fact is debated (e.g. the external field effect in MOND, see Appendix B and Fattahi et al., 2018). Though the measurements are more difficult than for late types, early type galaxies seem to lie on the relation (Lelli et al., 2017), while galaxy clusters seem to lie well above the relation (Chan & Del Popolo, 2020). Interestingly, may vary from galaxy-to-galaxy (Rodrigues et al., 2018; Chan & Del Popolo, 2020; Zobnina & Zasov, 2020). The significance of the small scatter of the relation has been debated (e.g. Stone & Courteau, 2019), and the scatter is now known to depend on radius within each galaxy, beyond what would be expected from the radial dependence of observational uncertainties (Santos-Santos et al., 2019; Ren et al., 2019).
In this work we have suggested a new means to search for departures from the fiducial RAR (Eq. 1), without measuring the baryonic mass profile and independent of all uncertainties associated thereto. At low accelerations, if Eq. 1 holds and the system in question is close enough to dynamical equilibrium and spherical symmetry, then the (inversion of the) relation predicts that there are otherwise plausible acceleration profiles which are unphysical on the grounds that they imply a declining cumulative baryonic mass profile (Sec. 2). This argument can place a lower limit on the slope of the RAR, i.e. it is sensitive to breaks to steeper slopes at the low-acceleration end. The method could also be adapted to derive a limit on instead of the RAR slope, if this parameter is allowed to vary rather than being fixed as we have assumed throughout this work.
The physical significance of the RAR is open to interpretation. It can be seen as a tracer of the connection between a galaxy and its dark halo, arising from the intricate interplay between the masses and structural parameters of both. In modified gravity theories such as MOND or EG, the relation is instead a fundamental prediction. The low-acceleration behaviour of the RAR may be a strong discriminant between these two scenarios: in the dark matter picture, a large enough sphere must enclose the cosmic average ratio of baryons and dark matter – the RAR should then bend back down to join the line (Fig. 1) – whereas in MOND should continue to arbitrarily low accelerations (modulo e.g. the external field effect, see Appendix B); EG makes a similar prediction. The generic prediction for dark halo profiles has a density slope steeper than at large radii (Navarro et al., 1996, 1997) – a prediction which, provided the acceleration scale is low enough and baryons scarce enough, is in direct conflict with the fiducial RAR. Looking for the RAR to break to a steeper slope can therefore be viewed as qualitatively equivalent to searching for the ‘edge’ of dark matter haloes.
Our main conclusions are summarized as follows:
-
•
None of the analyses from the literature which we have considered provides definitive, model-independent evidence for a break to a RAR slope steeper than the fiducial at low accelerations. However, several measurements are suggestive of such a break at per cent () confidence.
-
•
Rotation curves from the literature provide no compelling examples of declining rotation curves in the low-acceleration regime – which would imply a break from the fiducial RAR – with the possible exception of that of the Milky Way.
-
•
Galaxy-galaxy weak lensing is a promising means to apply our method, and we will pursue this further in a companion paper (Brouwer et al., in prep).
-
•
Recent analysis of the internal dynamics of dSph satellites of the Milky Way is on the cusp of placing strong limits on the low-acceleration RAR, but improving the constraints may be challenging151515Interestingly, the dSph constraints seem to argue very strongly against a MOND interpretation: combining the demands that (i) dSphs lie on the RAR and (ii) that the low-acceleration RAR have a slope of , in conjunction with accounting for the EFE, seem totally incompatible (Appendix B), unless the dSphs are significantly out of dynamical equilibrium (McGaugh & Wolf, 2010)..
-
•
We derived constraints on the RAR slope from the results of several studies of the dynamics of objects in the outer Milky Way – while these are approximate, they suggest that the outskirts of the Galaxy are a promising place to look for the means to place strong constraints on the RAR slope, possibly even by leveraging existing data sets.
Acknowledgements
J. Read for providing the Markov chains from Read et al. (2019) used in Sec. 2.3, and J. Read and A. Genina for guidance on their use. A. Deason, J. Read, J. Peñarrubia, M. Cautun, G. Eadie, L. Posti, C. Frenk, A. Fattahi, A. Benítez-Llambay, T. Theuns, A. Genina, E. Valentijn for useful feedback. https://math.stackexchange.com user Paul Enta for identifying an identity for integration of hypergeometric functions useful in Sec. 2.2. KAO acknowledges support by the European Research Council (ERC) through Advanced Investigator grant to C. S. Frenk, DMIDAS (GA 786910). ADL acknowledges financial supported from the Australian Research Council (project number FT160100250). This research has made use of NASA’s Astrophysics Data System.
References
- Ablimit et al. (2020) Ablimit, I., Zhao, G., Flynn, C., & Bird, S. A. 2020, arXiv e-prints, arXiv:2004.13768
- Belokurov et al. (2014) Belokurov, V., Koposov, S. E., Evans, N. W., et al. 2014, MNRAS, 437, 116
- Bhattacharjee et al. (2014) Bhattacharjee, P., Chaudhury, S., & Kundu, S. 2014, ApJ, 785, 63
- Brada & Milgrom (2000) Brada, R., & Milgrom, M. 2000, ApJ, 541, 556
- Brouwer et al. (2017) Brouwer, M. M., Visser, M. R., Dvornik, A., et al. 2017, MNRAS, 466, 2547
- Callingham et al. (2019) Callingham, T. M., Cautun, M., Deason, A. J., et al. 2019, MNRAS, 484, 5453
- Carignan & Puche (1990) Carignan, C., & Puche, D. 1990, AJ, 100, 394
- Casertano & van Gorkom (1991) Casertano, S., & van Gorkom, J. H. 1991, AJ, 101, 1231
- Cautun et al. (2019) Cautun, M., Benitez-Llambay, A., Deason, A. J., et al. 2019, arXiv e-prints, arXiv:1911.04557
- Chan & Del Popolo (2020) Chan, M. H., & Del Popolo, A. 2020, MNRAS, 492, 5865
- Crain et al. (2009) Crain, R. A., Theuns, T., Dalla Vecchia, C., et al. 2009, MNRAS, 399, 1773
- de Blok et al. (2008) de Blok, W. J. G., Walter, F., Brinks, E., et al. 2008, AJ, 136, 2648
- de Graaff et al. (2019) de Graaff, A., Cai, Y.-C., Heymans, C., & Peacock, J. A. 2019, A&A, 624, A48
- de Jong et al. (2013) de Jong, J. T. A., Verdoes Kleijn, G. A., Kuijken, K. H., & Valentijn, E. A. 2013, Experimental Astronomy, 35, 25
- Deason et al. (2012) Deason, A. J., Belokurov, V., Evans, N. W., & An, J. 2012, MNRAS, 424, L44
- Driver et al. (2011) Driver, S. P., Hill, D. T., Kelvin, L. S., et al. 2011, MNRAS, 413, 971
- Dutton et al. (2019) Dutton, A. A., Macciò, A. V., Obreja, A., & Buck, T. 2019, MNRAS, 485, 1886
- Eadie & Jurić (2019) Eadie, G., & Jurić, M. 2019, ApJ, 875, 159
- Eilers et al. (2019) Eilers, A.-C., Hogg, D. W., Rix, H.-W., & Ness, M. K. 2019, ApJ, 871, 120
- Famaey & McGaugh (2012) Famaey, B., & McGaugh, S. S. 2012, Living Reviews in Relativity, 15, 10
- Fattahi et al. (2018) Fattahi, A., Navarro, J. F., Frenk, C. S., et al. 2018, MNRAS, 476, 3816
- Fritz et al. (2020) Fritz, T. K., Di Cintio, A., Battaglia, G., Brook, C., & Taibi, S. 2020, arXiv e-prints, arXiv:2001.02651
- Fukugita et al. (1998) Fukugita, M., Hogan, C. J., & Peebles, P. J. E. 1998, ApJ, 503, 518
- Fukugita & Peebles (2004) Fukugita, M., & Peebles, P. J. E. 2004, ApJ, 616, 643
- Genina et al. (2019) Genina, A., Read, J. I., Frenk, C. S., et al. 2019, arXiv e-prints, arXiv:1911.09124
- Ghari et al. (2019) Ghari, A., Haghi, H., & Zonoozi, A. H. 2019, MNRAS, 487, 2148
- Gibbons et al. (2014) Gibbons, S. L. J., Belokurov, V., & Evans, N. W. 2014, MNRAS, 445, 3788
- Hildebrandt et al. (2017) Hildebrandt, H., Viola, M., Heymans, C., et al. 2017, MNRAS, 465, 1454
- Huang et al. (2016) Huang, Y., Liu, X. W., Yuan, H. B., et al. 2016, MNRAS, 463, 2623
- Hunter et al. (2012) Hunter, D. A., Ficut-Vicas, D., Ashley, T., et al. 2012, AJ, 144, 134
- Iorio et al. (2017) Iorio, G., Fraternali, F., Nipoti, C., et al. 2017, MNRAS, 466, 4159
- Islam & Dutta (2020) Islam, T., & Dutta, K. 2020, Phys. Rev. D, 101, 084015
- Johnson et al. (2015) Johnson, M. C., Hunter, D., Wood, S., et al. 2015, AJ, 149, 196
- Kafle et al. (2014) Kafle, P. R., Sharma, S., Lewis, G. F., & Bland-Hawthorn, J. 2014, ApJ, 794, 59
- Kaplinghat & Turner (2002) Kaplinghat, M., & Turner, M. 2002, ApJ, 569, L19
- Keller & Wadsley (2017) Keller, B. W., & Wadsley, J. W. 2017, ApJ, 835, L17
- Kroupa (2012) Kroupa, P. 2012, PASA, 29, 395
- Lelli et al. (2016) Lelli, F., McGaugh, S. S., & Schombert, J. M. 2016, AJ, 152, 157
- Lelli et al. (2017) Lelli, F., McGaugh, S. S., Schombert, J. M., & Pawlowski, M. S. 2017, ApJ, 836, 152
- Li et al. (2019) Li, Z.-Z., Qian, Y.-Z., Han, J., et al. 2019, arXiv e-prints, arXiv:1912.02086
- Liske et al. (2015) Liske, J., Baldry, I. K., Driver, S. P., et al. 2015, MNRAS, 452, 2087
- Ludlow et al. (2014) Ludlow, A. D., Navarro, J. F., Angulo, R. E., et al. 2014, MNRAS, 441, 378
- Ludlow et al. (2017) Ludlow, A. D., Benítez-Llambay, A., Schaller, M., et al. 2017, Phys. Rev. Lett., 118, 161103
- Martinsson et al. (2016) Martinsson, T. P. K., Verheijen, M. A. W., Bershady, M. A., et al. 2016, A&A, 585, A99
- McGaugh (2015) McGaugh, S. S. 2015, Canadian Journal of Physics, 93, 250
- McGaugh et al. (2016) McGaugh, S. S., Lelli, F., & Schombert, J. M. 2016, Phys. Rev. Lett., 117, 201101
- McGaugh et al. (2000) McGaugh, S. S., Schombert, J. M., Bothun, G. D., & de Blok, W. J. G. 2000, ApJ, 533, L99
- McGaugh & Wolf (2010) McGaugh, S. S., & Wolf, J. 2010, ApJ, 722, 248
- Milgrom (1983) Milgrom, M. 1983, ApJ, 270, 365
- Milgrom (2013) —. 2013, Phys. Rev. Lett., 111, 041105
- Navarro et al. (2017) Navarro, J. F., Benítez-Llambay, A., Fattahi, A., et al. 2017, MNRAS, 471, 1841
- Navarro et al. (1996) Navarro, J. F., Frenk, C. S., & White, S. D. M. 1996, ApJ, 462, 563
- Navarro et al. (1997) —. 1997, ApJ, 490, 493
- Oh et al. (2015) Oh, S.-H., Hunter, D. A., Brinks, E., et al. 2015, AJ, 149, 180
- Patel et al. (2018) Patel, E., Besla, G., Mandel, K., & Sohn, S. T. 2018, ApJ, 857, 78
- Posti & Helmi (2019) Posti, L., & Helmi, A. 2019, A&A, 621, A56
- Read & Moore (2005) Read, J. I., & Moore, B. 2005, MNRAS, 361, 971
- Read & Steger (2017) Read, J. I., & Steger, P. 2017, MNRAS, 471, 4541
- Read et al. (2018) Read, J. I., Walker, M. G., & Steger, P. 2018, MNRAS, 481, 860
- Read et al. (2019) —. 2019, MNRAS, 484, 1401
- Ren et al. (2019) Ren, T., Kwa, A., Kaplinghat, M., & Yu, H.-B. 2019, Physical Review X, 9, 031020
- Robotham et al. (2011) Robotham, A. S. G., Norberg, P., Driver, S. P., et al. 2011, MNRAS, 416, 2640
- Rodrigues et al. (2018) Rodrigues, D. C., Marra, V., del Popolo, A., & Davari, Z. 2018, Nature Astronomy, 2, 668
- Rong et al. (2018) Rong, Y., Li, H., Wang, J., et al. 2018, MNRAS, 477, 230
- Santos-Santos et al. (2016) Santos-Santos, I. M., Brook, C. B., Stinson, G., et al. 2016, MNRAS, 455, 476
- Santos-Santos et al. (2019) Santos-Santos, I. M. E., Navarro, J. F., Robertson, A., et al. 2019, arXiv e-prints, arXiv:1911.09116
- Schaye et al. (2015) Schaye, J., Crain, R. A., Bower, R. G., et al. 2015, MNRAS, 446, 521
- Sofue (2020) Sofue, Y. 2020, arXiv e-prints, arXiv:2004.11688
- Sohn et al. (2018) Sohn, S. T., Watkins, L. L., Fardal, M. A., et al. 2018, ApJ, 862, 52
- Stone & Courteau (2019) Stone, C., & Courteau, S. 2019, ApJ, 882, 6
- Trachternach et al. (2009) Trachternach, C., de Blok, W. J. G., McGaugh, S. S., van der Hulst, J. M., & Dettmar, R. J. 2009, A&A, 505, 577
- van den Bosch & Dalcanton (2000) van den Bosch, F. C., & Dalcanton, J. J. 2000, ApJ, 534, 146
- van Zee et al. (1997) van Zee, L., Haynes, M. P., Salzer, J. J., & Broeils, A. H. 1997, AJ, 113, 1618
- Vasiliev (2019) Vasiliev, E. 2019, MNRAS, 484, 2832
- Verlinde (2017) Verlinde, E. 2017, SciPost Physics, 2, 016
- Walter et al. (2008) Walter, F., Brinks, E., de Blok, W. J. G., et al. 2008, AJ, 136, 2563
- Wang et al. (2020) Wang, W., Han, J., Cautun, M., Li, Z., & Ishigaki, M. N. 2020, Sci. China Phys. Mech. Astron., 64, 109801
- Watkins et al. (2010) Watkins, L. L., Evans, N. W., & An, J. H. 2010, MNRAS, 406, 264
- Watkins et al. (2019) Watkins, L. L., van der Marel, R. P., Sohn, S. T., & Evans, N. W. 2019, ApJ, 873, 118
- Wheeler et al. (2019) Wheeler, C., Hopkins, P. F., & Doré, O. 2019, ApJ, 882, 46
- Xue et al. (2008) Xue, X. X., Rix, H. W., Zhao, G., et al. 2008, ApJ, 684, 1143
- Zhai et al. (2018) Zhai, M., Xue, X.-X., Zhang, L., et al. 2018, Research in Astronomy and Astrophysics, 18, 113
- Zobnina & Zasov (2020) Zobnina, D. I., & Zasov, A. V. 2020, arXiv e-prints, arXiv:2003.08845
Appendix A The acceleration-dependent slope of the RAR
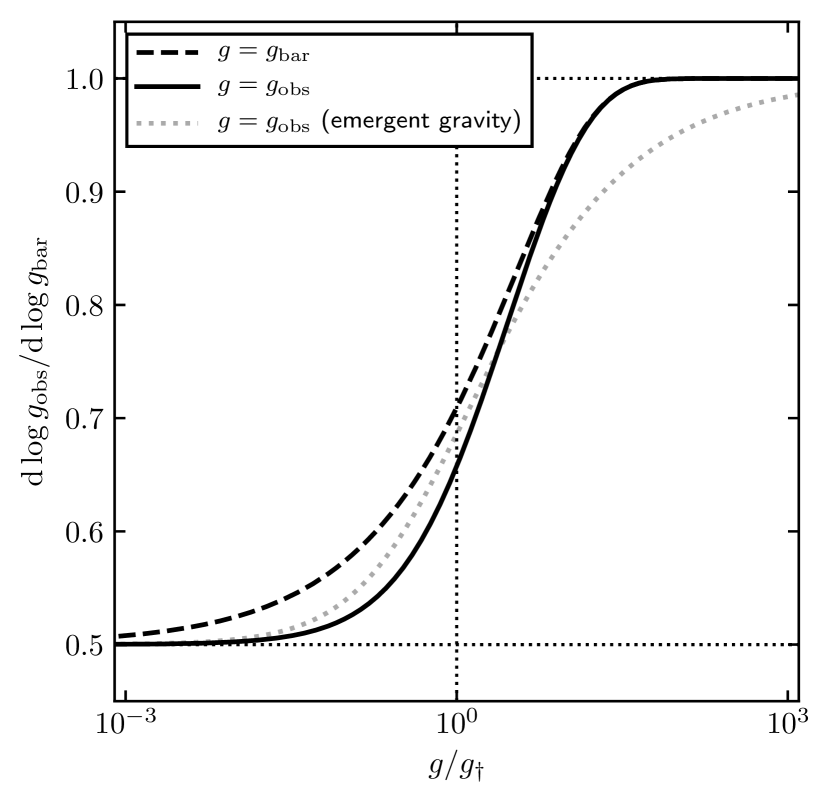
The logarithmic slope of the RAR as expressed in Eq. 1 is:
| (9) |
which we plot as a function of both and in Fig. 9. The slope does not converge to its low-acceleration limit especially quickly as a function of : at , the slope is still . It does converge somewhat more quickly as a function of , since .
In order to determine the limit where a given dynamical measurement implies an unphysical cumulative baryonic mass profile (assuming that Eq. 1 holds), the acceleration scale of the measurement needs to be taken into account as follows. If , then the condition for a physical baryon mass profile is . The equivalent constraint in terms of density, if , is then , or in terms of circular velocity, if , then . Note that , , and refer to the local (at a given radius, corresponding to a given acceleration) power law slope – in general all of these slopes are a function of radius.
Therefore, given a measurement of , , or , the constraint on the RAR slope is , , or , respectively. Of course this applies at the acceleration scale where the measurement is made, so measurements made at lower accelerations, where the fiducial RAR has a shallower slope, are more constraining.
The constraint in terms of the ESD profile , as measured from e.g. GGL, is in the low-acceleration limit; the limit as a function of acceleration scale is not straightforward to express since the correspondence between and must be numerically evaluated, and in practice usually requires additional assumptions about the underlying mass profile.
We note that the acceleration-dependent slope of the acceleration profile predicted by emergent gravity (EG) for a point mass differs only slightly161616It actually has exactly the same functional form as for MOND with the ‘simple’ interpolation function as described in Famaey & McGaugh (2012). from the form of Eq. 9. Following eq. 19 in Brouwer et al. (2017), it is:
| (10) |
is a constant with dimensions of acceleration. In EG, its value is predicted to be . We show this function with a grey dotted line in Fig. 9. The small differences, particularly at , imply that the constraints derived in Sec. 2 are also valid for EG, at least in the limited case where a galaxy is modelled as an isolated point particle.
Appendix B The MOND external field effect
In MOND theories, the internal dynamics of a system can be significantly affected by an external field if the acceleration due to the external field is in the regime . The ‘external field effect’ (EFE) can be approximated171717In addition to the fact that this is an approximate expression, as detailed in Famaey & McGaugh (2012), we neglect here the vector nature of the accelerations: more accurately, the EFE will have an anisotropic effect on the internal dynamics of a system. For the Milky Way dSphs discussed later in this section, this is not wholly unreasonable: is derived from the velocity dispersion along the line of sight, and the sight line from Earth to each dSph lies nearly exactly along the direction of the external acceleration vector. However, the full effect of an anisotropic distortion of the effective acceleration field within the dSphs is unlikely to be so simple. as given in Famaey & McGaugh (2012, eq. 60):
| (11) |
This changes the slope of the RAR predicted by MOND, and so the range of allowed profiles at a given acceleration scale. The bounding curves, analogous to the solid line in Fig. 9, for a range of external field strengths are shown with the solid curves in Fig. 10.
The dSph galaxies discussed in Sec. 2.3 are relatively close to the Milky Way and so are subject to significant EFE corrections in MOND. In Fig. 11 we reproduce the limits from Fig. 7, but with the boundary curves derived from Eq. 11 for an external field where and are the (baryonic) mass of and distance to the Milky Way, assuming the values given in Lelli et al. (2017, table 4). In all cases the constraints become extremely weak. We stress, however, that the EFE applies only in MOND: if the RAR arises for another reason, e.g. as a result of correlations between galaxy and DM halo structural parameters (e.g. van den Bosch & Dalcanton, 2000; Kaplinghat & Turner, 2002; Santos-Santos et al., 2016; Keller & Wadsley, 2017; Navarro et al., 2017; Ludlow et al., 2017; Dutton et al., 2019; Wheeler et al., 2019), in a universe with Newtonian gravity, then the correct limits are those illustrated in Fig. 7.
Readers familiar with the discussion of the EFE in Lelli et al. (2017) may remark that the weakening of the limits after correcting for the EFE seems peculiar – in that discussion, the EFE correction resulted in an effective increase of , which should make the limits in Fig. 11 stronger than those from Fig. 7. This is because Lelli et al. (2017) used what they term an ‘EFE-inspired’ correction, which amounts to simply neglecting the second term on the right side of Eq. 11. This changes the sign of the correction required to account for the external field. The slope predicted for the RAR when this alternative correction is used is shown in Fig. 10 with dotted curves, for a range of external field strengths, and the corresponding bounding curves in Fig. 11 are shown with dotted lines. Interestingly, although this correction places the dSphs on the fiducial RAR (see Lelli et al., 2017, fig. 11), doing so implies unphysical baryonic mass profiles for all 8 dSphs shown in Fig. 11 at per cent confidence. Conversely, if the correction from Eq. 11 is used, the slope of the EFE-corrected RAR will be allowed by the data (as discussed above), but values of and for these galaxies will be such that they lie significantly above the same EFE-corrected RAR.
Finally, we note that interpreting an application of the methodology described in Sec. 2.2 will require careful consideration of the possible impact of the EFE, although unfortunately there is no detailed treatment of lensing in the EFE limit (Milgrom, 2013).