Dynamical masses for the Pleiades binary system HII-2147
Abstract
We report our long-term spectroscopic monitoring of the Pleiades member HII-2147, which has previously been spatially resolved at radio wavelengths in VLBI observations. It has also been claimed to be a (presumably short-period) double-lined spectroscopic binary with relatively sharp lines, although no orbit has ever been published. Examination of our new spectroscopic material, and of the historical radial velocities, shows that the current and previous spectra are best interpreted as showing only a single set of lines of a moderately rapidly rotating star with slowly variable radial velocity, which is one of the sources detected by VLBI. We combine our own and other velocities with the VLBI measurements and new adaptive optics observations to derive the first astrometric-spectroscopic orbit of the G5 + G9 pair, with a period of years. We infer dynamical masses of for the spectroscopically visible star and for the other, along with a distance of pc. The lack of detection of the lines of the more massive component in our spectra can be adequately explained if it is rotating much more rapidly than the star we see. This is consistent with the observation that the lines of the secondary are shallower than expected for a star of its spectral type.
1. Introduction
The Pleiades cluster has served as a valuable laboratory for stellar astrophysics for decades. Astrometric and spectroscopic surveys have found many binary and multiple systems among its 1500 members (e.g., Rosvick et al., 1992; Mermilliod et al., 1992, 1997; Bouvier et al., 1997; Hillenbrand et al., 2018), and yet very few have had their component masses — the most basic stellar property — determined reliably. To our knowledge there are only three examples: the interferometric-spectroscopic binary Atlas (27 Tau, HD 23850; Zwahlen et al., 2004), the eclipsing system HD 23642 (V1229 Tau; Torres, 2003; Munari et al., 2004; Southworth et al., 2005; Groenewegen et al., 2007; David et al., 2016), and more recently HCG 76 (V612 Tau; David et al., 2016), also an eclipsing binary with low-mass components.
Two other eclipsing systems have been found in the Pleiades in recent years that may also eventually lead to accurate dynamical mass determinations. One is HII-2407 (V1283 Tau; David et al., 2015, 2016), which is so far only a single-lined spectroscopic binary and must therefore await detection of the secondary lines before the masses can be determined without assumptions. The other is MHO 9 (EPIC 211075914; David et al., 2016), a long period (42.8 days), low-mass, and very faint system () that is double-lined but for which the available data are still insufficient to obtain meaningful estimates of its properties.
In this paper we report our long-term spectroscopic monitoring of the Pleiades member HII-2147 (V1282 Tau, 2MASS J03490610+2346525, , ). The second data release (DR2) of the Gaia catalog (Gaia Collaboration et al., 2018) reports a trigonometric parallax of mas, corresponding to a distance of pc. The object has been spatially resolved at radio wavelengths into a 60 mas binary with the technique of very long baseline interferometry (VLBI; Melis et al., 2014), in the course of a program prior to Gaia to determine trigonometric parallaxes in the cluster. As is the case for many stars in the Pleiades, HII-2147 is chromospherically active and displays photometric variability likely caused by spots on its surface, and on this basis it has been listed as a member of the RS CVn class. It is also an X-ray source (Voges et al., 1999; Freund et al., 2018) with flaring activity (Gagné et al., 1995). By combining our spectroscopy with new imaging observations and other existing radial-velocity measurements from the literature, we are able to determine the masses of the components, making it the fourth system in the cluster with such empirical measurements.
We have organized the paper as follows. Section 2 discusses the historical radial-velocity measurements of HII-2147 on the basis of which it was claimed to be a double-lined spectroscopic binary, but for which an orbit was mysteriously never derived. After showing that interpretation of the system to be incorrect, we present in the same section our own spectroscopic monitoring spanning more than 37 years. The VLBI observations are described in Section 3, and measurements from new adaptive optics imaging that resolve the pair are presented in Section 4. Then in Section 5 we analyze all of the observations together, including brightness measurements, to derive the first orbital solution for HII-2147 and infer the component masses. Alternate scenarios are presented here as well, to explain the lack of detection of the lines of the primary star in our spectra. In Section 6 we review the measurements of the rotation period and discuss their implications. We conclude in Section 7 with a discussion of the results.
2. Spectroscopy
2.1. CORAVEL observations
In their spectroscopic investigation of the Pleiades cluster, Mermilliod et al. (1992) reported HII-2147 to be a double-lined spectroscopic binary based on observations with the CORAVEL radial-velocity scanner (Baranne et al., 1979) gathered between 1978 and 1991. They indicated the object has a broad cross-correlation profile, and claimed that if taken at face value it would imply a spin rate that is too high for a star of the assumed spectral type (K0V). In support of their conclusion that it is double-lined, they pointed out the location of HII-2147 above the main sequence in the color-magnitude diagram of the cluster. While they were unable to obtain an orbital solution from the measured velocities despite having some 50 observations, they noted that if the observations are reduced as if the star were single-lined, they show a long-term trend indicative of a period longer than 6000 days. A subsequent paper by Queloz et al. (1998) reported individual measurements for the “primary” and “secondary” of and km s-1, respectively, based on the same CORAVEL observations.

The individual CORAVEL radial velocities for the “primary” and “secondary”, augmented with new observations with the same instrument between 1991 and 1994, were published by Mermilliod et al. (2009) and are shown in Figure 1. Occasionally only a single velocity was measured, and was attributed to the “primary” component. The long-term trend is certainly obvious, but we are skeptical that the evidence supports the claim that the visible object is double-lined (presumably with a short orbital period).111Interestingly, Mermilliod et al. (2009) appear less certain about their original claim, listing the object as “SB2?” and reporting the projected rotational velocity as . Furthermore, the summary properties in their Table 11 give the scatter in the velocities of HII-2147 as 5.13 km s-1, which seems inconsistent with the spread in the individual velocities as published, unless the value refers to only one component, or perhaps to the average of the two. Instead, we contend there is a single broad cross-correlation profile, and that the “primary” and “secondary” velocities measured by Mermilliod et al. (1992) are spurious, resulting from the interpretation of the profile as the sum of two widely separated, narrower profiles. We base this contention on the following. i) The “primary”/“secondary” velocity separation seems to always be about 20 km s-1, whereas for a (presumably short-period) double-lined binary observed at random times one would expect to see some range. The only measurements that depart from this pattern are ones in which only a single velocity was measured, and those happen to fall very nearly at the average of the long term trends followed by the “primary” and “secondary” measurements. ii) Experiments with our own observations, described below, where we treated the single broad cross-correlation peak as if it were due to two stars, also gave a nearly constant velocity separation of 20 km s-1, and no convincing evidence of orbital motion. iii) As a more direct indication of the same effect, the measured width of the cross-correlation profiles of our own spectra show no significant change with time, which one would expect to see if the broadened profile were the result of two narrower ones moving relative to one another. iv) The Mermilliod et al. (1992) argument that a single broad correlation profile implies an excessive spin rate was likely based on a typical rotational period for a K star in the Pleiades (roughly 6 days) that has slowed down and settled on the rotational sequence. However, there is in fact a subsample of much more rapidly rotating cluster members of the same spectral type (e.g., Hartman et al., 2010; Rebull et al., 2016) known as ultra-fast rotators (UFRs), whose origin is still being debated (see Butler et al., 1987; Barnes & Sofia, 1996; Brown, 2014; Garraffo et al., 2018). As mentioned earlier, HII-2147 is an active and spotted star. Several direct measurements of its rotation period from the spot modulations now place it at well under a day (see Section 6), making it a member of the class of UFRs; v) The excess brightness of HII-2147 in the color-magnitude diagram can be adequately explained by the companion in the long-term orbit, as we will show later.
We therefore proceed under the assumption that the CORAVEL observations recorded a single, broad set of lines corresponding to a rapidly rotating star, and for the purposes of the orbital analysis below we will approximate the centroid of those broad correlation profiles by the straight average of the “primary” and “secondary” velocities as reported by Mermilliod et al. (2009). We will also adopt provisional uncertainties given by the quadrature sum of the individual “primary” and “secondary” velocity errors as published.
While Figure 1 clearly demonstrates that the star is participating in a long-period binary orbit, neither the CORAVEL observations nor our own (see below) show direct evidence of the spectral lines of the companion. In principle, it is therefore possible that the broad profile we see is the result of the blending (flux-weighted average) of the lines of those two objects, especially given that the long orbital period would imply relatively small radial-velocity amplitudes that could prevent the detection of two separate sets of lines. In that case, one would expect changes in the width of the correlation profile with time as the velocity separation widens and narrows throughout the orbit. However, no such changes are seen, as mentioned above, which argues that the correlation profile is dominated by the lines of only one object.
2.2. New spectroscopy
Spectroscopic monitoring of HII-2147 at the Center for Astrophysics (CfA) began in 1982, and continued until 2020 with several different instruments and telescopes, as follows. The initial observation was made with CfA Digital Speedometer (DS; Latham, 1992) on the 4.5m-equivalent Multiple Mirror Telescope (Mount Hopkins, Arizona, USA) before its conversion to a monolithic 6.5m telescope. Five additional observations through 2003 December were made with copies of this instrument on the 1.5m Tillinghast Reflector Echelle Spectrograph at the Fred L. Whipple Observatory (also on Mount Hopkins) and with the (now closed) 1.5m Wyeth reflector at the Oak Ridge Observatory (Harvard, Massachusetts, USA). These instruments were equipped with intensified photon-counting Reticon detectors, and recorded a single echelle order 45 Å wide centered at a wavelength near 5187 Å containing the Mg I b triplet, at a resolving power of . Reductions were performed with a custom pipeline, and the wavelength calibration was based on exposures of a thorium-argon (ThAr) lamp before and after each science exposure. Twilight observations were obtained regularly at dusk and dawn and used to maintain the velocity zero point (see Latham, 1992) by applying small run-to-run corrections generally smaller than 2 km s-1. The signal-to-noise ratios of these six observations range between about 10 and 24 per resolution element of 8.5 km s-1.
Beginning in 2011, the observations were continued with the Tillinghast Reflector Echelle Spectrograph (TRES; Szentgyorgyi & Fűrész, 2007; Fűrész, 2008), a bench-mounted fiber-fed instrument providing a resolving power of and covering the wavelength region 3800–9100 Å in 51 orders. For the order centered at 5187 Å that we used for the velocity determinations, the signal-to-noise ratios range from about 15 to 48 per resolution element of 6.8 km s-1. A total of 35 spectra of HII-2147 were collected with this instrument through 2020 March. Wavelength calibrations relied on ThAr exposures preceding and following the science frames, as above, and the reductions were carried out with a separate dedicated pipeline. The velocity zero point was monitored by taking exposures of several IAU radial-velocity standard stars, and typically varies by less than 50 m s-1, which is more than sufficient for this work. Spectra of the same standard stars from the DS were used to place both sets of observations on a common velocity system, which is within about 0.14 km s-1 of the reference frame defined by observations of minor planets in the solar system (see Stefanik et al., 1999; Latham et al., 2002).
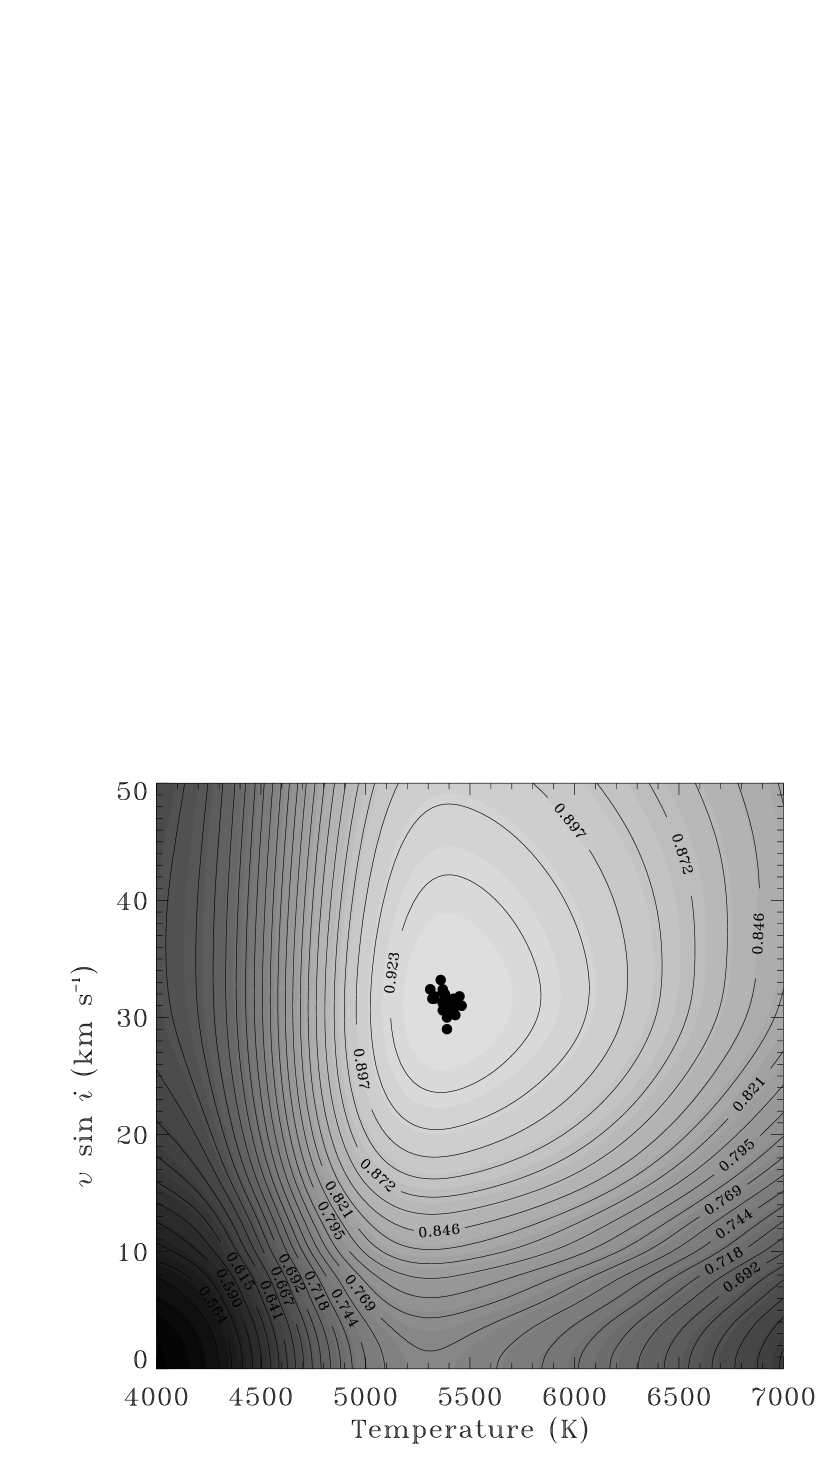
All our spectra appear single-lined, and show significant rotational broadening. Radial velocities were measured by cross-correlation using the IRAF task xcsao.222IRAF is distributed by the National Optical Astronomy Observatories, which is operated by the Association of Universities for Research in Astronomy, Inc., under contract with the National Science Foundation. The template was selected from a pre-computed library of synthetic spectra based on model atmospheres by R. L. Kurucz, and a line list tuned to better match the spectra of real stars (see Nordström et al., 1994; Latham et al., 2002). The wavelength region covered by these templates is limited to 300 Å centered at 5187 Å, and the two most important parameters for velocity determinations are the effective temperature () and rotational broadening (). The optimal values of these parameters were determined by running a grid of cross correlations over broad ranges for a fixed surface gravity of and solar metallicity, and adopting the and values giving the highest correlation averaged over all exposures, following Torres et al. (2002). For this analysis we used the more numerous and higher quality TRES spectra. The result may be visualized in Figure 2, and yielded a best temperature of K and . The temperature corresponds roughly to spectral type G9, based on the tabulations of Gray (1992) or Pecaut & Mamajek (2013). For the radial velocity determinations we adopted template parameters of 5500 K and 30 km s-1, the nearest in our grid. The heliocentric radial velocities along with their uncertainties are listed in Table 1. Given that HII-2147 is chromospherically active, these uncertainties likely include a contribution from distortions in the line profiles caused by spots moving across the stellar disk.
| HJD | ||
|---|---|---|
| (2,400,000) | (km s-1) | (km s-1) |
| 45302.8166 | 3.50 | 1.50 |
| 45308.6940 | 0.61 | 2.57 |
| 45341.7564 | 3.82 | 2.46 |
| 51238.7338 | 4.29 | 0.90 |
| 52920.8970 | 3.23 | 3.13 |
| 52975.7620 | 4.05 | 1.81 |
| 55846.9010 | 12.15 | 1.18 |
| 55964.7124 | 12.86 | 1.80 |
| 56322.7765 | 9.42 | 1.53 |
| 56347.6118 | 11.15 | 1.03 |
| 56617.6476 | 9.61 | 0.97 |
| 56644.7420 | 9.83 | 0.92 |
| 56669.6778 | 8.89 | 0.71 |
| 56675.7899 | 9.39 | 0.74 |
| 56693.6257 | 9.79 | 0.88 |
| 56694.6127 | 10.95 | 0.91 |
| 56731.6706 | 8.59 | 0.78 |
| 56902.9993 | 8.35 | 0.70 |
| 56927.0248 | 8.62 | 0.97 |
| 56934.8492 | 8.55 | 0.78 |
| 56944.8326 | 7.87 | 0.72 |
| 56959.9076 | 9.10 | 0.73 |
| 56962.7465 | 8.45 | 0.76 |
| 56970.8194 | 7.82 | 0.69 |
| 56972.7779 | 9.21 | 0.68 |
| 56978.7084 | 9.34 | 0.75 |
| 56987.6674 | 9.70 | 0.73 |
| 57001.7034 | 8.52 | 0.64 |
| 57026.7480 | 8.69 | 0.60 |
| 57062.6000 | 8.41 | 0.89 |
| 57090.6127 | 8.44 | 0.63 |
| 57294.0219 | 7.12 | 0.72 |
| 58157.5983 | 3.58 | 0.68 |
| 58424.7888 | 0.89 | 1.04 |
| 58451.7360 | 1.27 | 1.11 |
| 58476.7761 | 0.68 | 0.79 |
| 58503.7663 | 0.19 | 0.66 |
| 58770.8336 | 0.88 | 1.32 |
| 58886.7129 | 0.08 | 1.20 |
| 58923.6722 | 0.74 | 1.67 |
| 58924.6516 | 0.17 | 0.68 |
| 47467.035 | 7.4 | 1.30 |
| 52536. | 4.72 | 0.75 |
The rotational broadening we measure for HII-2147 is consistent with other estimates from the literature: Soderblom et al. (1993) reported , White et al. (2007) reported (although they pointed out that their result is probably overestimated by 6–9 km s-1), and Mermilliod et al. (2009) gave . Several of our spectra show signs of contamination from moonlight. To prevent this from biasing the measured velocities, we reanalyzed the affected spectra with the two-dimensional cross-correlation algorithm TODCOR (Zucker & Mazeh, 1994), which uses two templates, one for each set of spectral lines. We adopted the same template as above for HII-2147, and a solar template for the contaminating light. The final heliocentric radial velocities after these corrections, along with their uncertainties, are listed in Table 1.
In order to test the idea that the broad cross-correlation profile of HII-2147 may be the sum of two narrower profiles, as claimed by Mermilliod et al. (1992), we again used TODCOR with identical temperatures as before for the “primary” and “secondary” templates, and rotational broadenings of 6 and 10 km s-1, near those reported by Queloz et al. (1998). The resulting “primary” and “secondary” velocities showed a nearly constant separation of about 20 km s-1, as noted earlier of the CORAVEL velocities. After removal of an obvious long-term trend, we were unable to establish a reasonable double-lined orbital solution, as had been found earlier by Mermilliod et al. (1992) for the CORAVEL measurements. We therefore take this as evidence that our spectroscopic observations are best interpreted as featuring a single broad cross-correlation profile.
Additional spectroscopic observations were secured at the Lick Observatory with the Shane 3m telescope. Light was fed into the coudé focus that houses the Hamilton echelle spectrograph (Vogt, 1987), and all observations used Dewar#4 with the detector windowed to record light from 3850 to 9250 Å. With the exception of the Nov. 2012 epoch (HJD 2,456,257.87), a 640 m-wide slit was employed yielding a spectral resolving power of 62,000, as measured from the FWHM of single titanium-argon (TiAr) arc lines in comparison spectra. For the Nov. 2012 epoch, an 800 m-wide slit was used resulting in . Data reduction for the Hamilton echelle spectrograph with IRAF tasks is outlined in detail in Lick Technical Report No. 74.333http://astronomy.nmsu.edu/cwc/Software/irafman/manual.html Briefly, the data were bias subtracted, flat-fielded, extracted, and finally wavelength-calibrated with TiAr arc lamp spectra (see Pakhomov & Zhao, 2013). Signal-to-noise ratios for these observations range from 65 to 100 per pixel at a mean wavelength of 6000 Å. A stable radial velocity standard star (usually HR 124 or HD 4203; Nidever et al., 2002) was observed each night along with HII-2147, and used as the template for the cross-correlations, with adopted absolute velocities as reported by Nidever et al. (2002). The 9 Lick radial-velocity measurements and uncertainties, based typically on the five best spectral orders, are given in Table 2 in the heliocentric frame.
| HJD | ||
|---|---|---|
| (2,400,000) | (km s-1) | (km s-1) |
| 56257.86531 | 11.8 | 0.5 |
| 56581.89577 | 9.4 | 0.4 |
| 56610.95804 | 11.2 | 0.6 |
| 56678.80577 | 9.9 | 0.5 |
| 56711.72436 | 10.3 | 0.6 |
| 56904.95041 | 8.2 | 0.5 |
| 57262.94947 | 7.9 | 0.5 |
| 57349.81417 | 5.0 | 0.6 |
| 57752.75111 | 5.4 | 0.6 |
2.3. Archival radial velocities
Aside from the CORAVEL and our own observations, only a few isolated measurements of the radial velocity of HII-2147 have appeared in the literature. Soderblom et al. (1993) published a single measurement from 1988, and White et al. (2007) published another from 2002. The latter happens to fall at a time near a radial-velocity minimum (see below), when few other observations are available, making it potentially constraining. In order to place those two measurements on the same reference frame as ours, we compared the velocities of other Pleiades stars measured by these authors with observations of the same stars from our own survey of the cluster. Based on 7 stars in common with Soderblom et al. (1993), we established a correction of to bring their measurement of HII-2147 onto the CfA zero point. Similarly, from 10 stars we determined a correction of for the White et al. (2007) measurement. The adjusted velocities from these two literature sources are included at the end of Table 1. Additionally, HII-2147 is included in the Gaia/DR2 catalog (Gaia Collaboration et al., 2018) with the identifier number 66503449709270400. The average radial velocity reported there is , obtained from 7 transits over a period of 22 months. The large uncertainty is due perhaps to real changes, or to reduced precision because of the rotational broadening of the spectral lines. However, as it is only an average and the velocity is changing, we have chosen not to make use of that value.
2.4. Evidence for the companion
The combination of all available radial velocities reveals a periodicity of about 18 years that is shown in Figure 3. If we assume, based on its temperature, that the star with visible lines is somewhat less massive than the Sun, a preliminary spectroscopic orbital solution then yields the unexpected result that the companion is more massive than the star we see. This raises the question of why we do not detect the lines of this companion in our spectra. One possible explanation might be very rapid rotation. Based on previous experience with similar spectroscopic material obtained for other objects with the DS and TRES instruments, we estimate that if the companion were rotating at a projected velocity of 100 km s-1 or more, its lines would be very broad and difficult to distinguish, particularly since they would be heavily blended with those of the visible star. This possibility seems consistent with the evidence mentioned earlier of a very short rotation period ( 1 day) associated with HII-2147, based on photometric modulation due to spots, provided that periodic signal comes from the companion. Alternatively, the companion may itself be a close binary, which could make its detection more challenging.

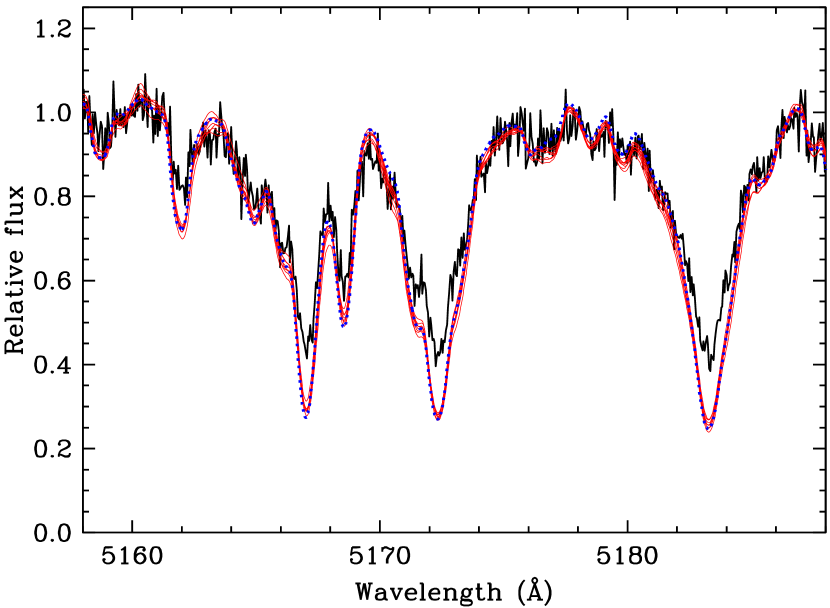
While the spectral lines of the companion are not seen directly, there is indirect evidence of its presence from the fact that the features of the visible star appear shallower than expected for a star of its spectral type. To illustrate this, we selected TRES spectra of 8 sharp-lined stars from our ongoing spectroscopic survey of the Pleiades that are within 50 K of the measured temperature of HII-2147 (determined in the same way as described in Section 2.2), and are not known to be binaries. We broadened these observed spectra using the rotational kernel of Gray (1992) to match the rotational broadening of HII-2147, and shifted them to a common wavelength scale. These 8 stars are compared in Figure 4 against an exposure of HII-2147, clearly showing the veiling effect attributable to star A. For reference, we overplot the synthetic template used earlier to derive the velocities (blue dotted line), which is seen to be a good representation of the single stars. A more quantitative discussion of the line dilution will be presented below in Section 7. We note, finally, that a veiling effect for HII-2147 was reported also by Kounkel et al. (2019), based on a near-infrared spectrum in the band.
3. VLBI observations
HII-2147 was observed by Melis et al. (2014) between 2011 and 2013, as part of a program to determine trigonometric parallaxes of several Pleiades members using very long-baseline interferometry (VLBI) at radio frequencies (a continuum frequency of 8.4 GHz, corresponding to 3.6 cm). The original goal was to address the disagreement between the Hipparcos measurement of the distance to the cluster and determinations by other methods. HII-2147 was found to be a double source with a separation around 60 mas, and accurate positions for the equinox J2000 referenced to the background quasar J0347+2339 were reported for both components, oriented NW and SE at the time. In deriving a parallax for HII-2147, the authors included acceleration terms in right ascension and declination in order to model the slow motion in an unknown orbit over the two-year observing period. Orbital motion was in fact evident from the opposite signs of the acceleration terms for the two components. This astrometric motion corresponds to the same orbit suggested by the radial velocities, although the portion covered by the astrometry is small (only 10% of a cycle). Nevertheless, the VLBI observations do help to constrain that orbit by providing the angular scale, and we use them below for that purpose under the assumption that the source of the radio emission is coincident with the center of each stellar disk. These observations also constrain the parallax of the system. However, they do not identify which of the components is the one we observed spectroscopically.
4. Adaptive optics imaging
There are no observations of HII-2147 in the literature that resolve the pair, although several attempts have been made at both optical and near-infrared (NIR) wavelengths (Bouvier et al., 1997; Metchev & Hillenbrand, 2009; Mason et al., 2009), including a lunar occultation observation by Richichi et al. (2012).
Due to the limited phase coverage of the VLBI observations, and in order to supplement the astrometry, adaptive optics (AO) imaging observations were carried out for this work with the Mauna Kea Observatory Keck Adaptive Optics system (Wizinowich et al., 2000; Wizinowich, 2013) on UT 03 and 05 February 2013, as well as on UT 03 November 2019. The Keck Adaptive Optics system was fed into NIRC2, a camera with a InSb Aladdin-3 array. All NIRC2 observations were performed in the “Narrow” camera mode, with a plate scale of 001 pixel-1. HII-2147 served as its own guide star for the AO system.
The observations on the first two nights consisted of a 5-point dither pattern sequence. On UT 03 February 2013, short exposures (2 seconds) in which the binary system was not saturated in each frame were obtained in each of the (1.248 m), (1.633 m), and (2.146 m) bands. High quality adaptive optics corrections were obtained with average Strehl ratios of 0.6 in the band, 0.35 in , and 0.2 in . On UT 05 February 2013, longer exposures (50 seconds) were obtained in the band to search for faint companions to the binary system (no such companions were seen).
Unsaturated observations on UT 03 November 2019 were obtained through , , and (2.124 m) filters, and were taken with a 0.2 second integration time using 10 coadds and the CDS sampling mode. The NIRC2 subarray was set to pixels. Observations were gathered in a 3-point dither pattern of five exposures at each location, with each leg being 15, for a total of 15 observations in each filter. The average differential image motion monitor (DIMM) measure of the seeing during the observations was 038. Observations of V1090 Tau were made as a PSF reference calibrator star. Those exposures were taken with an identical subarray, integration time, and coadd as the HII-2147 observations.
The data were analyzed using custom scripts that perform the standard tasks of nonlinearity correction, dark subtraction, and flat fielding. These scripts also perform “de-striping”, a rectification of spatially correlated detector noise that is mirrored across the quadrants of the NIRC2 detector, and which dominates the photometric noise budget in the readnoise-limited regime. Finally, the scripts use bilinear interpolation to estimate values for pixels impacted by cosmic rays, as well as for the hot pixels and dead pixels that were identified in super-stacks of darks and flats, as described by Kraus et al. (2016).
Each science frame was then iteratively analyzed with PSF-fitting photometry to find the best-fit template that minimized the residuals after PSF subtraction, as described by Kraus et al. (2016). The first stage found the best-fit binary model (separation , position angle (P.A.) , and magnitude difference ) given an empirical template of a single star. The second stage then measured the goodness-of-fit for the 1000 archival frames of single stars that were taken closest in time and in the same filter, doubling each potential template with the same binary parameters and then scaling and subtracting it from the science frame. The two steps were then repeated until the same empirical template PSF was found to yield the lowest value in two consecutive iterations, and that PSF was adopted as the template for that science frame.
| HJD | ||||
|---|---|---|---|---|
| (2,400,000) | (mas) | (degree) | (mag) | Filter |
| 56326.8063 | ||||
| 56326.8040 | ||||
| 56326.8017 | ||||
| 58790.5065 | ||||
| 58790.5041 | ||||
| 58790.5013 |
We derived final coordinates and the magnitude difference of the two components using the least-squares minimization package MPFIT in IDL (Markwardt, 2009). We converted NIRC2 pixel values into sky coordinates using the same methods as described in Dupuy et al. (2016) and Dupuy & Liu (2017), with the only difference being that we reversed the sign of the P.A. offset of in the Yelda et al. (2010) calibration, as noted by Bowler et al. (2018). We report the mean of the separation, P.A., and magnitude difference derived from the set of images taken in each of the three filters (see Table 3), and we adopt errors based on the rms of measurements from each data set, with systematic uncertainties in the astrometric calibration (e.g., in P.A.) added in quadrature to these rms values for the final errors. An image of HII-2147 in the band is shown in Figure 5.
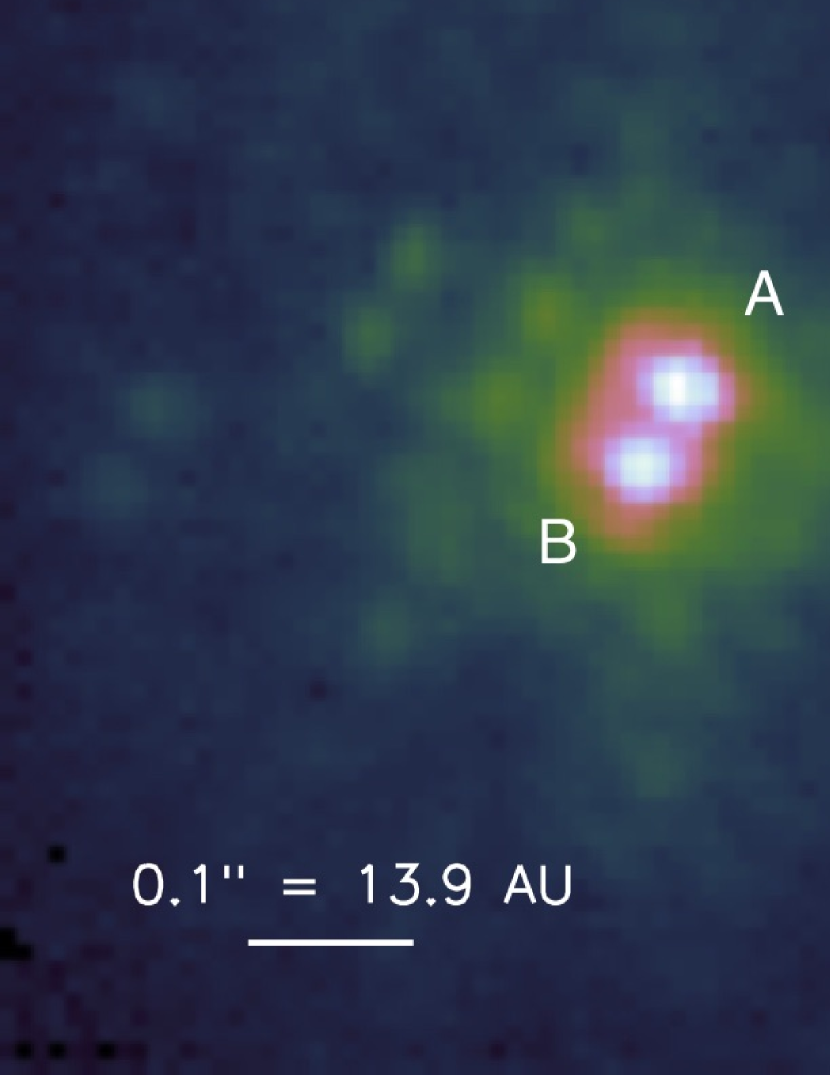
The 2013 observations clearly identify the fainter component as the one to the SE, whereas by 2019 orbital motion had moved the fainter star to the NW. The angular separations happen to be similar at both epochs. The measured magnitude differences are consistent between the two sets of observations, in all three near-infrared bandpasses.
If both components of HII-2147 are single main-sequence stars, the less massive one should be fainter. On this basis, we tentatively identify the star whose velocities we measured (which we indicated earlier is less massive than its companion) as the one to the SE in 2013 (NW in 2019), and we refer to it hereafter as ‘star B’, or the ‘secondary’. The other component, whose lines we do not see, will be ‘star A’.
5. Orbital analysis
The radial-velocity measurements from all sources were combined with the astrometry from VLBI and our AO imaging into a global analysis to determine the orbital elements of HII-2147. The parameters we solved for are the following: the orbital period (), the angular semimajor axis of the relative orbit (), the eccentricity parameters and (where is the eccentricity and the longitude of periastron of the primary), the cosine of the orbital inclination angle (), the position angle of the ascending node for equinox J2000 (), a reference time of periastron passage (), the center-of-mass velocity of the system (), and the velocity semiamplitude of the spectroscopically visible secondary star (). Inclusion of the VLBI data adds the following free parameters: the parallax (), the barycenter proper motion components ( and ), and offsets ( and ) between the position of the barycenter at the average time of the VLBI observations ( HJD = 2012.9011) and a reference position taken to be the average of the measured VLBI positions (, ). Parallax factors were calculated using the position of the Earth’s center as provided by the JPL Horizons web interface.444 https://ssd.jpl.nasa.gov/horizons.cgi In addition, we solved for a possible zero-point offset between the CORAVEL and CfA velocities (), and another between the CfA and Lick velocities (). Both of these offsets are to be added to the velocities from the corresponding data sets in order to place them on the CfA system.
A further constraint on the orbital elements is provided, in principle, by the proper motion measured by Gaia. This will in general be different from the proper motion of the center of mass, because of the acceleration caused by the stars moving around each other (see, e.g., Brandt, 2018). However, our attempts to incorporate this constraint resulted in significant tension with the VLBI measurements, and a poorer fit. Consequently, we have elected not to use this measurement.555We note that a comment associated with this Gaia/DR2 entry in the VizieR catalog (Ochsenbein et al., 2000) indicates there was a duplicate source in the original data reduction that was discarded. This may indicate observational, cross-matching, or processing problems, possibly compromising the astrometric or photometric results. We believe this may explain the difficulty we pointed out.
Our method of analysis used the emcee666http://dfm.io/emcee/current code of Foreman-Mackey et al. (2013), which is a Python implementation of the affine-invariant MCMC ensemble sampler proposed by Goodman & Weare (2010). We used 100 walkers with chain lengths of 20,000 each, after discarding the burn-in. Uniform (non-informative) priors over suitable ranges were adopted for all of the above parameters, and convergence of the chains was checked visually, requiring also a Gelman-Rubin statistic of 1.05 or smaller for each parameter (Gelman & Rubin, 1992).
The relative weighting between the different data sets (CORAVEL, CfA, Lick, VLBI) was handled by including additional adjustable parameters to rescale the observational errors as needed to achieve reduced values near unity. For the velocities those parameters were taken to be multiplicative factors , , and with uniform priors; for the VLBI measurements, whose internal errors appeared from a preliminary analysis to be underestimated, they were “jitter” terms and to be added quadratically to the internal errors, with log-uniform priors.777The measured VLBI positions are affected by additional systematic errors stemming from the uncertainty in the position of the phase-referencing calibrator (the quasar J0347+2339; see Section 3). However, as we are only interested in changes in position, those systematic errors have no impact on our analysis. All of these terms were solved for self-consistently and simultaneously with the other orbital quantities (see Gregory, 2005). Precession corrections to J2000.0 for the position angles of the AO measurements are very small, but were applied nevertheless for completeness.
The results of the MCMC analysis are given in the second column of Table 4 (Solution 1), where we report the mode of the posterior distribution for each parameter along with the 68.3% credible intervals. The orbital period corresponds to years. The bottom of the table presents derived properties including the total mass of the system, , the masses of the two components ( and ) and their mass ratio (), the distance, the linear semimajor axis of the orbit (), and the inferred velocity semi-amplitude of the unseen primary component (). These derived quantities were computed by directly combining the chains of the adjusted quantities involved.
| Parameter | Solution 1 | Solution 2 |
|---|---|---|
| (Adopted) | ||
| (days) | ||
| (mas) | ||
| (degree) | ||
| (HJD2,400,000) | ||
| (km s-1) | ||
| (km s-1) | ||
| (mas) | ||
| (mas yr-1) | ||
| (mas yr-1) | ||
| (mas) | ||
| (mas) | ||
| (km s-1) | ||
| (km s-1) | ||
| (km s-1) | ||
| (km s-1) | ||
| (km s-1) | ||
| (mas) | ||
| (mas) | ||
| Derived quantities | ||
| (degree) | ||
| (degree) | ||
| Distance (pc) | ||
| (au) | ||
| (km s-1) | ||
| () | ||
| () | ||
| () | ||
Note. — Solution 2 incorporates a prior on the mass ratio , derived from the NIR magnitude differences (see text). For both solutions, the parameter values listed correspond to the mode of the respective posterior distributions, and the uncertainties represent the 68.3% credible intervals.
Appealing to a 125 Myr solar-metallicity model isochrone for the Pleiades from the PARSEC series (Chen et al., 2014), we find that a star with the mass of the secondary () is expected to have an effective temperature of about 5220 K, which is somewhat lower than our spectroscopically measured value ( K). A further check on the accuracy of our solution can be made using the measured masses to predict the primary/secondary magnitude differences in the NIR. These can then be compared against the measured values from Table 3. Similarly, we can calculate the expected total system brightness at both optical and NIR wavelengths, for comparison with the magnitudes in the Gaia/DR2 and 2MASS catalogs. For these tests we have preferred not to rely entirely on the model isochrone used above to predict fluxes, as we find that it does not match the empirical color-magnitude diagram of the cluster sufficiently well for our purposes. Instead, we developed semi-empirical relations to predict fluxes in the Gaia and 2MASS bandpasses as a function of mass. Briefly, we fit spline relations to the empirical color-magnitude diagram of the Pleiades, and then used the models to provide the connection between masses and observed bandpass magnitudes in the two photometric systems. The details of this derivation are given in the Appendix, where we also present a test of the accuracy of these relations using the other binary systems in the Pleiades that have dynamically measured masses.
Using these semi-empirical relations, we find that the expected 2MASS magnitudes from our Solution 1 for the combined light of HII-2147 agree quite well with the measured values (see Table 5). The corresponding predictions for the Gaia bandpasses are also formally consistent within the uncertainties, although they are all systematically brighter than the measured magnitudes by about 0.1 mag, on average. On the other hand, the predicted magnitude differences between stars A and B are all larger than observed by 0.2–0.3 mag, However, the uncertainties in this case are large enough that there is again formal consistency with the measurements. The inflated uncertainties for , , and are a reflection of the relatively imprecise value of the mass ratio, which is what largely determines those magnitude differences.
| Parameter | Solution 1 | Solution 2 | Measurements |
|---|---|---|---|
| (Adopted) | |||
| (mag) | |||
| (mag) | |||
| (mag) | |||
| (mag) | |||
| (mag) | |||
| (mag) | |||
| (mag) | |||
| (mag) | |||
| (mag) |
Note. — Solution 2 uses a prior on the mass ratio (see text). The magnitude differences in the last three rows of the last column are averages of the values in Table 3 in each bandpass. Uncertainties for the Gaia magnitudes have been arbitrarily increased, to account for possible biases in the models used to derive the semi-empirical relations mentioned in the text (see the Appendix).
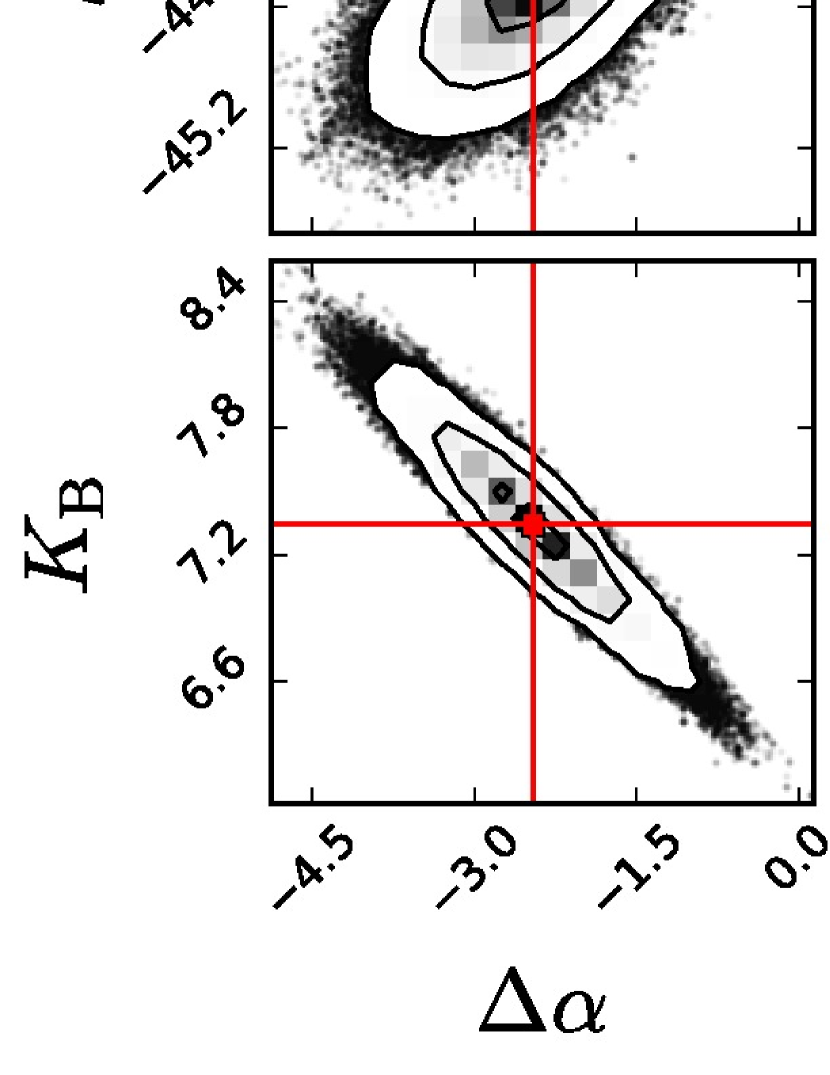
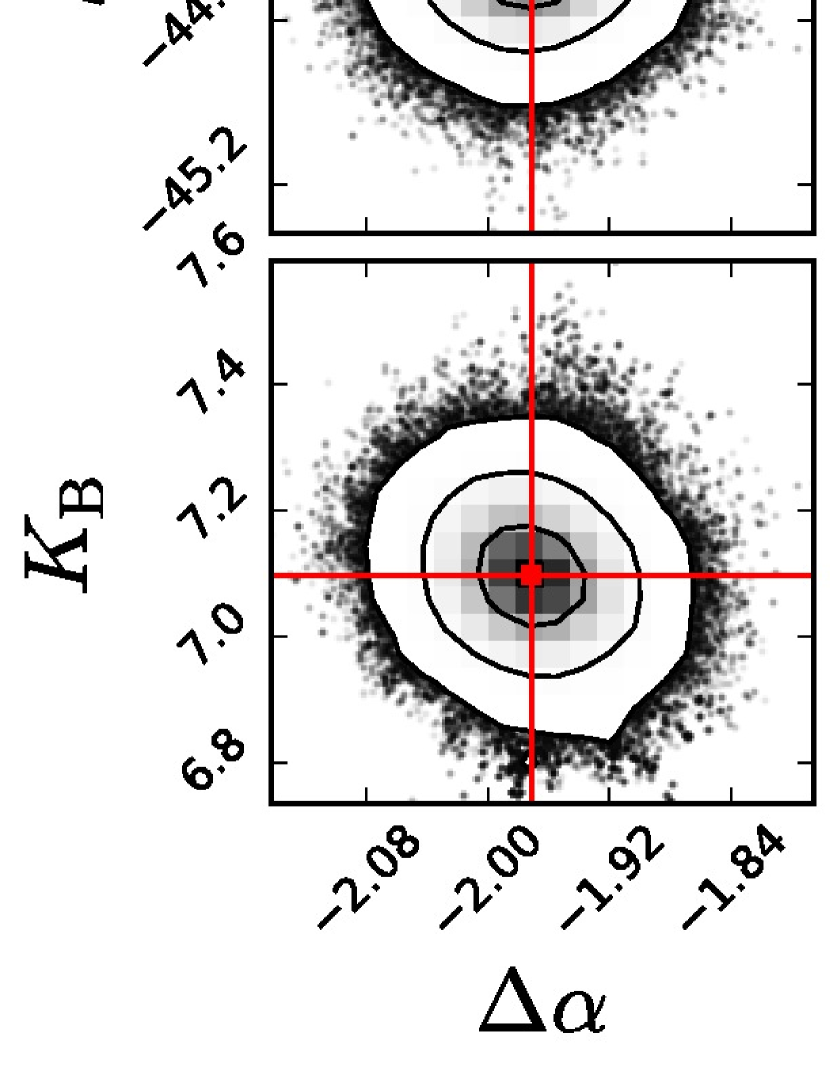
The fact that the predicted magnitude differences are worse, in a systematic sense, than those for the combined light suggests the possibility of a small bias in the mass ratio . The only observations used in our analysis that constrain are the VLBI measurements for the primary and secondary, which are measured separately on an absolute reference frame. The constraint is weak, however, because the VLBI observations only cover a small fraction of the orbit. The accuracy of the mass ratio will then depend critically on how well the center of mass can be located on the plane of the sky, as represented by the free parameters and . These two variables happen to be the ones most strongly correlated amongst themselves and with other free parameters, so it would not be surprising if they were affected by subtle biases. Indeed, correlates very strongly with (correlation coefficient ), with (), and with (), whereas shows significant correlation with (+0.965) and (). This is illustrated in the top panel of Figure 9.
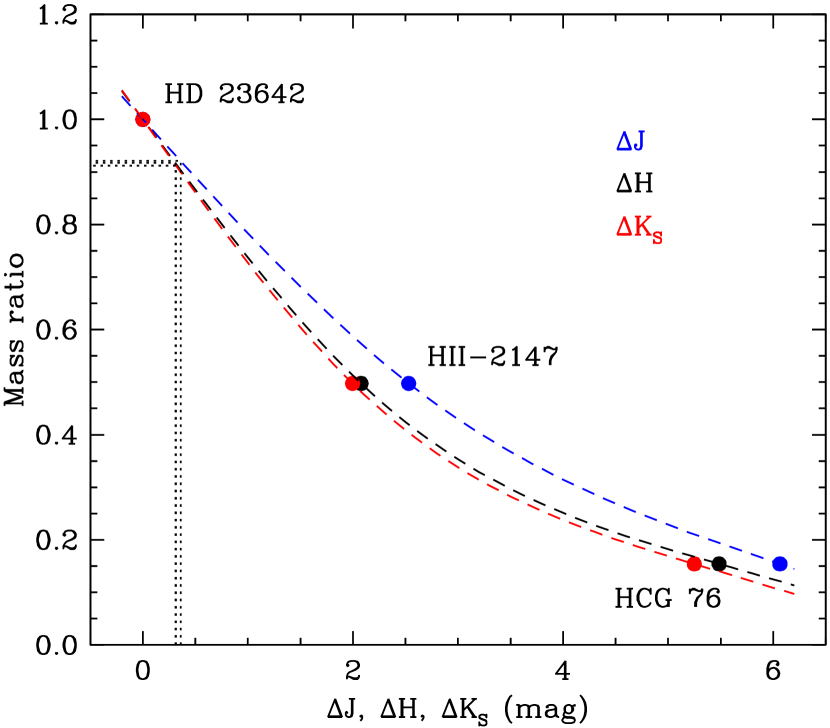
The availability of the near-infrared magnitude differences from our AO observations presents an opportunity to check or improve the accuracy of the mass ratio, as they are the measurements with the closest connection to . To this end, we constructed an empirical relation that allows us to predict from a difference in brightness in the bandpasses. For this, we enlisted the other binaries in the Pleiades that have measured masses. As none of them have NIR brightness measurements for the individual components, we opted instead to use their total system masses along with their combined-light 2MASS magnitudes. Only two of the three available systems have reliable 2MASS magnitudes (HD 23642 and HCG 76; David et al., 2016), with the third (Atlas, ) being too bright. To these we therefore added HII-2147 itself, and used its total mass from Solution 1 together with its combined magnitudes from the 2MASS catalog. We then calculated the ratio of the total masses of HII-2147 and HCG 76 with respect to the total mass of HD 23642 (the more massive system), and the magnitude differences in between each of the two lighter systems and HD 23642. A diagram of these three system mass ratios and magnitude differences is shown in Figure 7, with corresponding interpolated spline curves for each filter. Finally, with the measured values of , , and for HII-2147 from Table 3 (averaged between the two AO epochs), we used these curves to infer three values for the mass ratio. The mean and standard deviation are .
We then carried out another orbital solution using the same observations as before, this time applying the above result as a Gaussian prior on the mass ratio. We refer to this as Solution 2. The orbital elements and derived properties we obtained are listed in the last column of Table 4. The results are all very similar to those of our initial analysis, with the anticipated exception of the parameters that were previously highly correlated with each other (see above). For those, the uncertainties are now considerably reduced, as are the mutual correlations (see Figure 9, bottom panel). The mass ratio is slightly larger in the new solution, but more than an order of magnitude more precise. As a result, the individual masses are also somewhat different and considerably better determined, whereas the total mass is essentially unchanged compared to its uncertainty. The predicted combined magnitudes in the Gaia bandpasses agree better than before with the observations, as can be seen in Table 5, while the magnitude differences now track the measured values closely, by construction.
The mass of star B in this new solution is now slightly larger than before, and the corresponding effective temperature according to the PARSEC isochrone is 5350 K, which is much closer to the value we measured spectroscopically. We conclude that this set of orbital parameters is consistent with all available observational constraints for HII-2147.
Our solution leads to a parallax for HII-2147 of mas, corresponding to a linear distance of pc. This is twice as precise as, but in good agreement with the parallax reported in the Gaia/DR2 catalog, after that value is adjusted for a systematic difference compared to VLBI determinations ( mas) following Xu et al. (2019), giving mas.
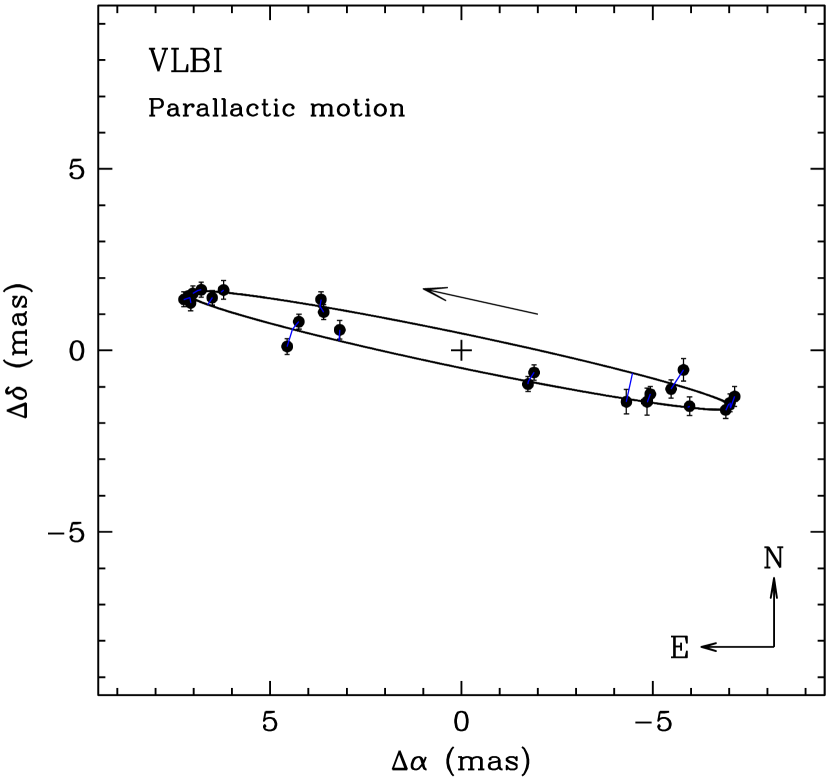
A representation of the path of each star on the plane of the sky together with the VLBI measurements is shown in the top panel of Figure 8, with the arrow indicating the direction and magnitude of the change due to proper motion over the span of one year. The bottom panel shows the parallactic ellipse for HII-2147 along with the VLBI measurements corrected for proper motion and orbital motion, following our Solution 2. The measured position of each component relative to the barycenter is illustrated in the top panel of Figure 9, with the proper motion and parallactic motion removed. Motion in the relative orbit (star B relative to star A) is shown in the bottom panel, including the AO measurements. Orbital motion on the plane of the sky is counterclockwise (direct). The predicted radial-velocity curves for the primary and secondary can be seen in Figure 10 along with the observations.


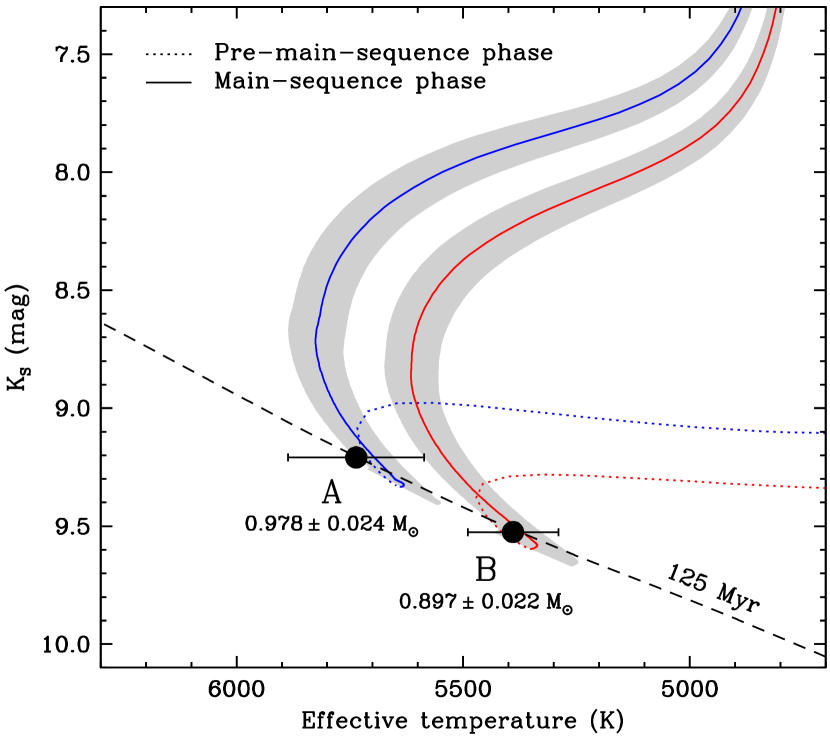
As a check on our mass determinations for HII-2147, we compared the measurements with stellar evolution models from the MIST series (MESA Isochrones and Stellar Tracks; Choi et al., 2016). Most models including these have difficulty matching the color-magnitude diagram of the Pleiades, as mentioned earlier, so here we have compared theory and observations via evolutionary tracks in a diagram of apparent -band magnitude versus effective temperature. An estimate of for the primary was derived from the spectroscopic value for the secondary and a temperature offset calculated using the magnitude differences from AO. The offset was determined by using a 125 Myr MIST isochrone for the Pleiades, and recording the changes in temperature corresponding to changes in brightness from the predicted values for the secondary, at its measured mass. Because the models are used here only in a differential sense, the dependence of the temperature offset (and therefore of the primary temperature) on theory is weak. The average of the three estimates is 350 K, resulting in a final primary temperature of K (conservative uncertainty). Figure 11 indicates that the models are consistent with the component temperatures and brightnesses at their measured masses.
5.1. Alternate scenarios
While Solution 2 provides satisfactory agreement with all astrometric, spectroscopic, and photometric observations for HII-2147, it still requires an explanation for the lack of detection of the lines of star A in our spectra, especially given that it is the more massive component, and should therefore be brighter. A reasonable explanation would be rapid rotation, as mentioned earlier. Another possibility is that star A is itself a close binary, composed of stars Aa and Ab. This could alleviate the mystery somewhat by making the detection of its spectral lines more challenging, more so if one or both of its components are also rapid rotators. Under this scenario, component A can actually be fainter than component B (the spectroscopically visible star), contrary to what we have assumed so far. This is because dividing up its mass among two smaller stars (Aa and Ab) can reduce its total brightness, depending on the mass ratio. This could have significant consequences for the orbital solution, because it would reverse the location of the star that has the measured velocities relative to the VLBI measurements, potentially changing some of the orbital elements. On the other hand, other mass ratios between Aa and Ab would allow it to remain the brighter component.
In principle, we can explore both of these possible triple-star scenarios (Aa + Ab brighter than star B, or vice versa) by adding the mass ratio as a free parameter. However, the astrometric, spectroscopic, and photometric observations used up to now do not constrain this new parameter, so for this we chose to make use of the Gaia and 2MASS magnitudes of HII-2147 as measurements, with their corresponding uncertainties. We used the semi-empirical mass-magnitude relations developed in the previous section to predict the individual magnitudes at each step of the iterations, adding the appropriate term to the likelihood function. As mentioned in the Appendix, we do not expect this mapping between theoretical masses and fluxes to be free from systematic error: there are many physical ingredients in the models that can affect the passband-specific flux predictions in ways that are difficult to quantify. To guard against this, we took two precautions in our new solutions: we allowed for a shift in the mass scale of the models by adding it as one more free parameter in our MCMC analysis (solved simultaneously with the rest), and we conservatively increased the photometric uncertainties from Gaia and 2MASS by adding 0.02 mag in quadrature to the formal errors, as a way of accounting for biases in the model fluxes as well as for variable extinction within the Pleiades cluster. The resulting masses will therefore be model-dependent, to some extent, as opposed to the ones in Solution 2, which are purely empirical.
We produced two new solutions using the magnitudes and the magnitude differences from Table 3 as observables, along with the same astrometric and spectroscopic information used in Solution 2 above. We refer to the new triple-star solution with component A being brighter than star B as Solution 3, and to the one with component A being fainter as Solution 4. Most of the orbital elements are largely unchanged. We report the results for the masses in Table 6, with the values from Solution 2 repeated for reference in the second column.
The total mass of the system is very nearly the same in all three cases, indicating it is robust no matter what the configuration is. This is because it is essentially constrained by the orbital period, the semimajor axis, and the parallax, each of which is well determined to better than 1%. We find that in order to fit the observations, Solution 3 requires a shift in the scale of the model masses of , which seems uncomfortably large: it amounts to almost of the mass of star Ab. Furthermore, for a star with the mass of in this solution, the PARSEC isochrone for the Pleiades predicts an effective temperature of 4970 K, which is more than 400 K cooler than the value we measured spectroscopically ( K). For these reasons we do not consider this model to be plausible. Solution 4, in which component A is fainter than star B, fares somewhat better regarding the temperature, although the predicted value of 5140 K is still 250 K cooler than we measure. Moreover, the offset required in the mass scale of the models is even larger than before, , which is again about of the mass of star Ab in this configuration.
Aside from being more contrived, we conclude that neither of the triple-star scenarios provides a description of the system as satisfactory as Solution 2, given the available observational constraints. Nor do they help in explaining the lack of detection of the lines of another star in our spectra, given that in both cases star Aa would not be too different in mass (and therefore brightness) from star B (see Table 6). The two-star scenario (Solution 2) is thus favored by all available evidence.
| Parameter | Solution 2 | Solution 3 | Solution 4 |
|---|---|---|---|
| (Adopted) | (A is brighter) | (B is brighter) | |
| () | |||
| () | |||
| () | |||
| () | |||
| () | |||
| () | |||
| (K) | 5350 | 4970 | 5140 |
Note. — Solution 2 is our reference solution from the last column of Table 4. Solution 3 has the combined light of component A (composed of stars Aa and Ab) being brighter than star B, and in Solution 4 it is the opposite. represents a shift applied to the mass scale from the models (see text). is the predicted effective temperature from the PARSEC model for the Pleiades for a star with mass (i.e., the spectroscopically visible star). The mass ratio within star A is defined as . The values listed correspond to the mode of the respective posterior distributions, and the uncertainties represent the 68.3% credible intervals.
6. Rotation
Photometric monitoring of HII-2147 by a number of authors has yielded several different estimates of the rotation period based on the modulation due to spots. All are very short, placing the object in the category of the UFRs in the Pleiades (Hartman et al., 2010; Rebull et al., 2016). Norton et al. (2007) analyzed SuperWASP photometry, and reported days with a peak-to-peak amplitude of about 0.04 mag in unfiltered white light. Hartman et al. (2010) used observations from the HATNet transiting planet survey, and gave a period of days that is 2.5 times longer, with a total amplitude of 0.031 mag in the Sloan band. Subsequently, Kiraga (2012) measured a period days that is essentially identical to that of Norton et al. (2007), with an amplitude of about 0.07 mag from the -band ASAS photometry. More recently, Rebull et al. (2016) used observations from NASA’s K2 mission, and reported a preferred rotation period of 0.7768 days with an amplitude of 0.037 mag, as well as a secondary modulation with a much shorter period of 0.1541 days that is exactly half of the value found by Norton et al. (2007) and Kiraga (2012). The various estimates therefore appear to be in the ratios 1:2:5.
If the true spin rate is the fastest one (0.1541 days), it would imply an equatorial rotational velocity of about 250 km s-1 for a star such as component B in HII-2147. Given our spectroscopically measured projected rotational velocity of km s-1 for that star, we infer that it would have to be seen nearly pole-on (°) in order to be responsible for the photometric modulation, which we cannot rule out. For this calculation, we adopted a radius of , based on the PARSEC isochrone. The longer rotation periods would lead to less extreme inclinations relative to the line of sight, of about 14° and 37°, respectively. As none of these angles agree with the orbital inclination, they would imply a misalignment between the spin and orbital axes. Whether or not this is the case, star B is itself clearly an UFR, as its measured projected rotational velocity of 31 km s-1 implies an upper limit to its rotation period of 1.3 days, much shorter than typical for a star of its spectral type in the Pleiades.
On the other hand, a possibility that seems more likely to us is that the rotational modulation signature originates from the primary star, whose lines we do not detect in our spectra. It is the brighter component by nearly a factor of two, if we rely on the PARSEC models for stars of these masses, and very rapid rotation of the primary would in fact be a natural explanation for its non-detection. In that case, both components of HII-2147 would fall in the category of UFRs, and their spin rates would be primordial as tidal forces are negligibly small in an orbit with such a long period. If the rotational signal comes from the primary, an assumed radius for the star of would result in equatorial rotational velocities of about 280, 140, and 55 km s-1 for the three reported values of . The actual line broadening would depend on the inclination angle of its spin axis projected onto the line of sight.
7. Discussion and conclusions
HII-2147 is the fourth system in the Pleiades cluster with dynamical mass determinations. We have shown that previous claims suggesting it contains a pair of sharp-lined stars in a presumably short-period orbit are incorrect, and that based on the currently available observations, the system is best described as consisting of a moderately rotating star with visible spectral features in a slightly eccentric 18-year orbit around a more massive companion. The masses we determine from our new spectroscopic and adaptive optics observations, other radial velocities from the literature, and previously published VLBI measurements that resolve the pair, have relative uncertainties of about 2.5%. They are limited mostly by the precision of the early radial velocities (pre-1995). The masses correspond approximately to stars of spectral types G5 and G9. We also derive a parallax good to better than 0.4%, which is in excellent agreement with the (adjusted) value from Gaia/DR2, though more precise.
The most puzzling aspect of our results is the lack of detection of the lines of the G5 primary star in our spectra, despite multiple attempts carried out with TODCOR using a wide range of template parameters. According to the PARSEC models, that star is expected to be roughly 0.6 mag brighter than the secondary. Circumstantial evidence that the light of star A is attenuating the lines of star B was presented in Section 2.4. We now examine this in a somewhat more quantitative fashion.
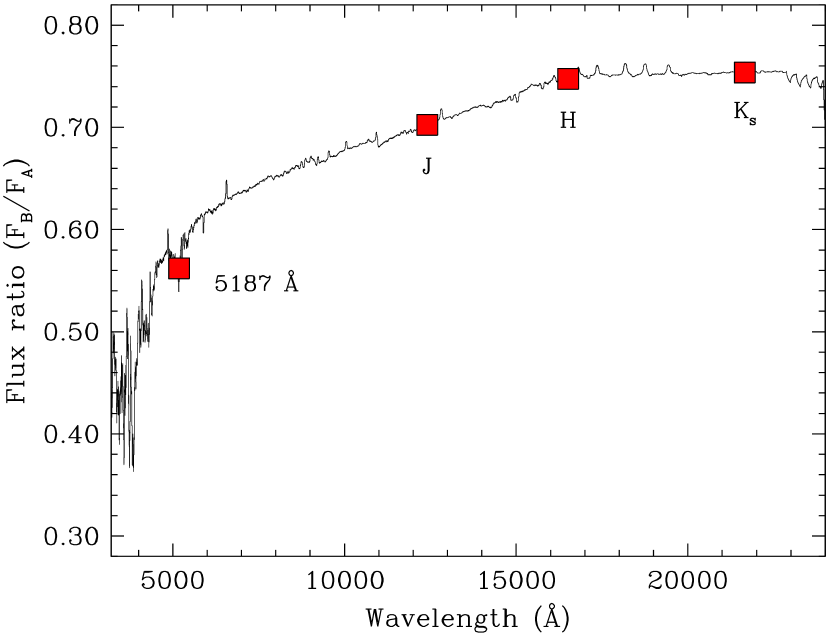
As a first step, we made an independent estimate of the brightness difference between the components using solar-metallicity synthetic spectra based on PHOENIX model atmospheres from the library of Husser et al. (2013). We adopted effective temperatures of 5750 K and 5400 K, near those determined for stars A and B, and a radius ratio estimate of from the PARSEC models. The resulting flux ratio as a function of wavelength is seen in Figure 12. The values for the 2MASS bandpasses (, 0.747, and 0.754, respectively) correspond to magnitude differences of , , and , which are very close to the values measured from our AO observations (see Table 3). The ratio at the mean wavelength of our spectroscopic observations (5187 Å) is 0.56 (). We therefore expect star A to be about 1.8 times brighter than star B in this spectral region.
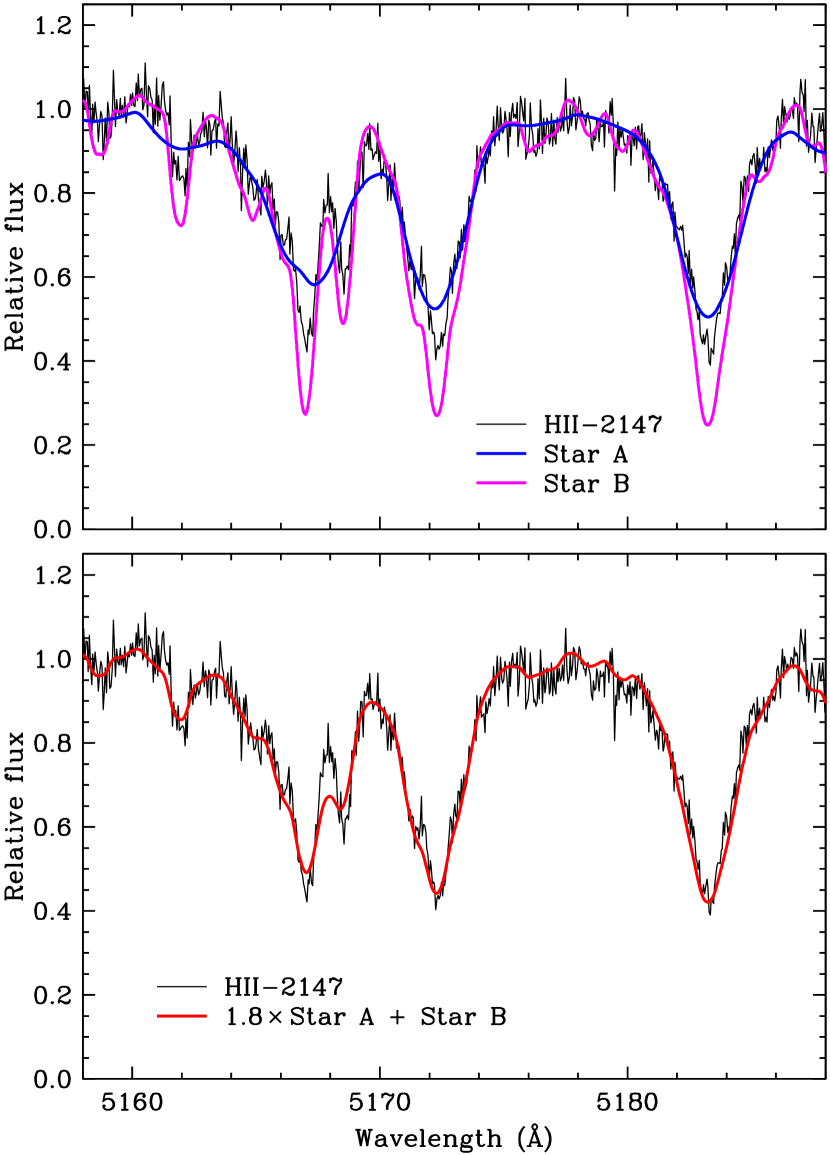
With this information, we then explored the effect on the strength of the lines of star B. Figure 13 (top panel) reproduces the same observed spectrum of HII-2147 from Figure 4, which was shown there to be affected by veiling. Also plotted is the synthetic template we used to derive the radial velocities, which we take to represent star B without dilution. This template provides a very good match to the line profiles of real stars, as illustrated before. To represent star A we have chosen a synthetic template from the same library with a temperature of 5750 K, and an arbitrary rotational broadening of 100 km s-1. The bottom panel of Figure 13 displays the result of adding together the flux of star B and 1.8 times the flux of star A, after renormalization. The comparison with the real spectrum of HII-2147 shows very good agreement in the line depths, providing a satisfactory explanation of the observed degree of veiling.
We view the result of this exercise as a valuable self-consistency check on the various aspects of our analysis, including the mass determinations. It also supports the notion advanced earlier in the paper that rapid rotation is, in fact, responsible for the non-detection of the lines of star A in our spectra.
Although Gaia will not spatially resolve the 18-yr pair and can only measure the motion of its center of light, by the end of the mission it is possible that it could provide some constraints on all of the elements of the A-B orbit (which has the same shape as the photocenter orbit), except for the semimajor axis. Direct spectroscopic detection of star A may be possible with observations of higher signal-to-noise ratio than we have available. In that case, measurement of its radial velocities would result in a better constrained semiamplitude , which would in turn improve the mass determinations further.
References
- Baranne et al. (1979) Baranne, A., Mayor, M., & Poncet, J. L. 1979, Vistas in Astronomy, 23, 279
- Barnes & Sofia (1996) Barnes, S., & Sofia, S. 1996, ApJ, 462, 746
- Bouvier et al. (1997) Bouvier, J., Rigaut, F., & Nadeau, D. 1997, A&A, 323, 139
- Bowler et al. (2018) Bowler, B. P., Dupuy, T. J., Endl, M., et al. 2018, AJ, 155, 159
- Brandt (2018) Brandt, T. D. 2018, ApJS, 239, 31
- Breger (1986) Breger, M. 1986, ApJ, 309, 311
- Brown (2014) Brown, T. M. 2014, ApJ, 789, 101
- Butler et al. (1987) Butler, R. P., Cohen, R. D., Duncan, D. K., et al. 1987, ApJ, 319, L19
- Chen et al. (2014) Chen, Y., Girardi, L., Bressan, A., et al. 2014, MNRAS, 444, 2525
- Choi et al. (2016) Choi, J., Dotter, A., Conroy, C., et al. 2016, ApJ, 823, 102
- David et al. (2016) David, T. J., Conroy, K. E., Hillenbrand, L. A., et al. 2016, AJ, 151, 112
- David et al. (2015) David, T. J., Stauffer, J., Hillenbrand, L. A., et al. 2015, ApJ, 814, 62
- Dupuy et al. (2016) Dupuy, T. J., Kratter, K. M., Kraus, A. L., et al. 2016, ApJ, 817, 80
- Dupuy & Liu (2017) Dupuy, T. J., & Liu, M. C. 2017, ApJS, 231, 15
- Foreman-Mackey et al. (2013) Foreman-Mackey, D., Hogg, D. W., Lang, D., & Goodman, J. 2013, PASP, 125, 306
- Foreman-Mackey (2016) Foreman-Mackey, D. 2016, The Journal of Open Source Software, 24, http://dx.doi.org/10.5281/zenodo.45906
- Freund et al. (2018) Freund, S., Robrade, J., Schneider, P. C., et al. 2018, A&A, 614, A125
- Fűrész (2008) Fűrész, G. 2008, PhD thesis, Univ. Szeged, Hungary
- Gagné et al. (1995) Gagné, M., Caillault, J.-P., & Stauffer, J. R. 1995, ApJ, 450, 217
- Gaia Collaboration et al. (2018) Gaia Collaboration, Brown, A. G. A., Vallenari, A. et al. 2018, A&A, 616, 1
- Gao (2019) Gao, X.-. hua . 2019, PASP, 131, 44101
- Garraffo et al. (2018) Garraffo, C., Drake, J. J., Dotter, A., et al. 2018, ApJ, 862, 90
- Gelman & Rubin (1992) Gelman, A., & Rubin, D. B. 1992, Statistical Science, 7, 457
- Goodman & Weare (2010) Goodman, J., & Weare, J. 2010, Commun. Appl. Math. Comput. Sci., 5, 65
- Gray (1992) Gray, D. F. 1992, The Observation and Analysis of Stellar Photospheres, Vol. 20 (2nd ed.; New York: Wiley), 430
- Gregory (2005) Gregory, P. C. 2005, ApJ, 631, 1198
- Groenewegen et al. (2007) Groenewegen, M. A. T., Decin, L., Salaris, M., et al. 2007, A&A, 463, 579
- Hartman et al. (2010) Hartman, J. D., Bakos, G. Á., Kovács, G., et al. 2010, MNRAS, 408, 475
- Hillenbrand et al. (2018) Hillenbrand, L. A., Zhang, C., Riddle, R. L., et al. 2018, AJ, 155, 51
- Husser et al. (2013) Husser, T.-O., Wende-von Berg, S., Dreizler, S., et al. 2013, A&A, 553, A6
- Kiraga (2012) Kiraga, M. 2012, Acta Astron., 62, 67
- Kounkel et al. (2019) Kounkel, M., Covey, K., Moe, M., et al. 2019, AJ, 157, 196
- Kraus et al. (2016) Kraus, A. L., Ireland, M. J., Huber, D., et al. 2016, AJ, 152, 8
- Latham (1992) Latham, D. W. 1992, in IAU Coll. 135, Complementary Approaches to Double and Multiple Star Research, ASP Conf. Ser. 32, eds. H. A. McAlister & W. I. Hartkopf (San Francisco: ASP), 110
- Latham et al. (2002) Latham, D. W., Stefanik, R. P., Torres, G., et al. 2002, AJ, 124, 1144
- Markwardt (2009) Markwardt, C. B. 2009, Astronomical Data Analysis Software and Systems XVIII, 251
- Mason et al. (2009) Mason, B. D., Hartkopf, W. I., Gies, D. R., et al. 2009, AJ, 137, 3358
- Melis et al. (2014) Melis, C., Reid, M. J., Mioduszewski, A. J., et al. 2014, Science, 345, 1029
- Mermilliod et al. (1997) Mermilliod, J.-C., Bratschi, P., & Mayor, M. 1997, A&A, 320, 74
- Mermilliod et al. (2009) Mermilliod, J.-C., Mayor, M., & Udry, S. 2009, A&A, 498, 949
- Mermilliod et al. (1992) Mermilliod, J.-C., Rosvick, J. M., Duquennoy, A., et al. 1992, A&A, 265, 513
- Metchev & Hillenbrand (2009) Metchev, S. A., & Hillenbrand, L. A. 2009, ApJS, 181, 62
- Munari et al. (2004) Munari, U., Dallaporta, S., Siviero, A., et al. 2004, A&A, 418, L31
- Nidever et al. (2002) Nidever, D. L., Marcy, G. W., Butler, R. P., et al. 2002, ApJS, 141, 503
- Nordström et al. (1994) Nordström, B., Latham, D. W., Morse, J. A., et al. 1994, A&A, 287, 338
- Norton et al. (2007) Norton, A. J., Wheatley, P. J., West, R. G., et al. 2007, A&A, 467, 785
- Ochsenbein et al. (2000) Ochsenbein, F., Bauer, P., & Marcout, J. 2000, A&AS, 143, 23
- Pakhomov & Zhao (2013) Pakhomov, Y. V., & Zhao, G. 2013, AJ, 146, 97
- Pecaut & Mamajek (2013) Pecaut, M. J., & Mamajek, E. E. 2013, ApJS, 208, 9
- Queloz et al. (1998) Queloz, D., Allain, S., Mermilliod, J.-C., et al. 1998, A&A, 335, 183
- Rebull et al. (2016) Rebull, L. M., Stauffer, J. R., Bouvier, J., et al. 2016, AJ, 152, 113
- Richichi et al. (2012) Richichi, A., Chen, W. P., Cusano, F. et al. 2012, A&A, 541, A96
- Rosvick et al. (1992) Rosvick, J. M., Mermilliod, J.-C., & Mayor, M. 1992, A&A, 255, 130
- Skrutskie et al. (2006) Skrutskie, M. F., Cutri, R. M., Stiening, R., et al. 2006, AJ, 131, 1163
- Soderblom et al. (1993) Soderblom, D. R., Jones, B. F., Balachandran, S., et al. 1993, AJ, 106, 1059
- Southworth et al. (2005) Southworth, J., Maxted, P. F. L., & Smalley, B. 2005, A&A, 429, 645
- Stassun et al. (2019) Stassun, K. G., Oelkers, R. J., Paegert, M. et al. 2019, AJ, in press (arXiv:1905.10694)
- Stefanik et al. (1999) Stefanik, R. P., Latham, D. W., & Torres, G. 1999, in IAU Coll. 170, Precise Stellar Radial Velocities, ASP Conf. Ser. 185, eds. J. B. Hearnshaw and C. D. Scarfe (San Francisco, CA: ASP), 354
- Szentgyorgyi & Fűrész (2007) Szentgyorgyi, A. H., & Fűrész, G. 2007, RMxAC, 28, 129
- Taylor (2008) Taylor, B. J. 2008, AJ, 136, 1388
- Torres (2003) Torres, G. 2003, Information Bulletin on Variable Stars, 5402, 1
- Torres et al. (2002) Torres, G., Neuhäuser, R., & Guenther, E. W. 2002, AJ, 123, 1701
- Voges et al. (1999) Voges, W., Aschenbach, B., Boller, T., et al. 1999, A&A, 349, 389
- Vogt (1987) Vogt, S. S. 1987, PASP, 99, 1214
- White et al. (2007) White, R. J., Gabor, J. M., & Hillenbrand, L. A. 2007, AJ, 133, 2524
- Wizinowich et al. (2000) Wizinowich, P., Acton, D. S., Shelton, C., et al. 2000, PASP, 112, 315
- Wizinowich (2013) Wizinowich, P. 2013, PASP, 125, 798
- Xu et al. (2019) Xu, S., Zhang, B., Reid, M. J., et al. 2019, ApJ, 875, 114
- Yelda et al. (2010) Yelda, S., Lu, J. R., Ghez, A. M., et al. 2010, ApJ, 725, 331
- Zucker & Mazeh (1994) Zucker, S., & Mazeh, T. 1994, ApJ, 420, 806
- Zwahlen et al. (2004) Zwahlen, N., North, P., Debernardi, Y., et al. 2004, A&A, 425, L45
We describe here our procedure to develop a relation to predict the magnitudes of Pleiades stars in the Gaia and 2MASS bandpasses as a function of mass, which we used in Section 5 to verify the accuracy of Solution 1 and to explore alternate configurations for HII-2147 involving three stars.
We began by establishing purely empirical relations between color and brightness using the list of 1454 likely Pleiades members published recently by Gao (2019), based on astrometric and photometric observations from the Gaia/DR2 catalog. We fitted cubic spline relations to the (single-star) main sequence in diagrams of absolute , , and magnitude as a function of the observed color, where the absolute magnitudes were computed using the parallax of each star to reduce scatter due to the non-negligible depth of the cluster. Note that all of these photometric quantities are affected by extinction, although the effect is relatively small in the Pleiades ( mag; Taylor, 2008).101010Reddening is not uniform across the Pleiades cluster, being smaller on the eastern side than the western side (see Breger, 1986; Taylor, 2008). As individual estimates are not available for all 1454 members, we have chosen to adopt here an average of 0.04 that suffices for this work. Next, to provide the necessary connection with stellar mass, we adopted a mapping between mass and theoretical color from the 125 Myr, solar metallicity PARSEC isochrone used in the main text. The model colors were adjusted by applying reddening in the amount of (Stassun et al., 2019), to make them more consistent with the observed colors (i.e., with the abscissa of the empirical spline relations). Reliance on models for the mass-color mapping will of course not be perfect because of deficiencies in the model fluxes (due, e.g., to missing opacity sources), but is unavoidable, and in the end this two-step procedure allows us to predict the brightness and color of a star from its mass more accurately than using the models alone. We illustrate this below. In a similar fashion, we developed spline relations to predict the , , and magnitudes in the 2MASS system as a function of the observed color.
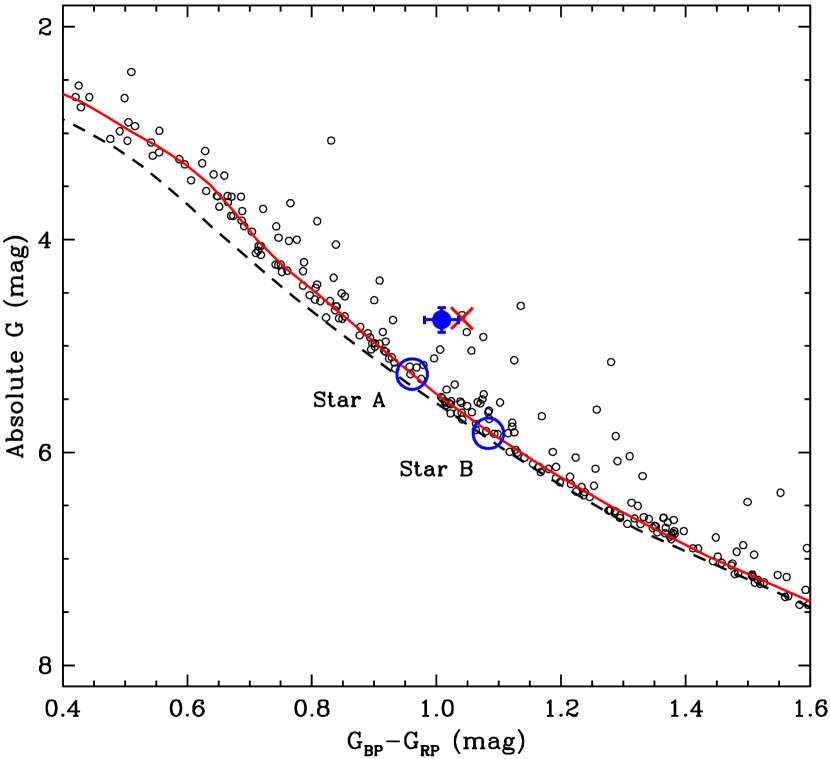
Figure 14 shows the location of the two stars in the color-magnitude diagram of the Pleiades based on Gaia photometry, together with other cluster members from the list of Gao (2019). The observed location of HII-2147 above the single-star sequence is represented by the red cross, and the point with error bars marks the predicted location of the combined light according to the masses derived in Solution 2, based on our semiempirical spline relations (red solid line). The dashed line represents the 125 Myr solar-metallicity PARSEC isochrone for the Pleiades (Chen et al., 2014), which does not provide as good a match to the observations.
As a sanity check, we tested the ability of these relations to predict the true colors of stars as a function of mass by using the few examples in the Pleiades that are in binary systems and have dynamically measured masses. One of them, Atlas, has its brightness measurements compromised by saturation, and is also beyond the range of our calibrations. The other two, HD 23642 and HCG 76 (David et al., 2016), are within the validity range, but are near the edges of our relations (upper and lower ends, respectively). Nevertheless, with the individual masses in each of these systems, we predicted their brightness in the Gaia bandpasses and then calculated the color index for the combined light, for comparison with the measurements from Gaia. For HD 23642 our relations predict a index of 0.096 mag, whereas the measured value is 0.107 mag. For HCG 76 we obtain mag, and the measured value is 2.913 mag. Given that the reddening toward these two objects may be different than the mean value we have adopted for the cluster, we consider these differences ( and +0.012 mag) to be small, and therefore to support the accuracy or our calibration.