Seeds of Life in Space (SOLIS)
VIII. SiO isotopic fractionation and a new insight in the shocks of L1157-B1 ††thanks: Based on observations carried out with the IRAM NOEMA interferometer. IRAM is supported by INSU/CNRS (France), MPG (Germany) and IGN (Spain)
††thanks: The cleaned cubes and the spectra are available in electronic form at the CDS via anonymous ftp to cdsarc.u-strasbg.fr (130.79.128.5) or via http://cdsweb.u-strasbg.fr/cgi-bin/qcat?J/A+A/
Abstract
Context. Contrary to what is expected from models of Galactic chemical evolution (GCE), the isotopic fractionation of silicon (Si) in the Galaxy has been recently found to be constant. This finding calls for new observations, also at cores scales, to re-evaluate the fractionation of Si.
Aims. L1157-B1 is one of the outflow shocked regions along the blue-shifted outflow driven by the Class 0 protostar L1157-mm, and is an ideal laboratory to study the material ejected from the grains in very short timescales, i.e. its chemical composition is representative of the composition of the grains.
Methods. We imaged 28SiO, 29SiO and 30SiO = 2-1 emission towards L1157-B1 and B0 with the NOrthern Extended Millimeter Array (NOEMA) interferometer as part of the Seeds of Life in Space (SOLIS) large project. We present here a study of the isotopic fractionation of SiO towards L1157-B1. Furthermore, we use the high spectral resolution observations on the main isotopologue, 28SiO, to study the jet impact on the dense gas. We present here also single-dish observations obtained with the IRAM 30m telescope and Herschel-HIFI. We carried out a non-LTE analysis using a Large Velocity Gradient (LVG) code to model the single-dish observations.
Results. From our observations we can show that (i) the (2-1) transition of the main isotopologue is optically thick in L1157-B1 even at high velocities, and (ii) the [29SiO/30SiO] ratio is constant across the source, and consistent with the solar value of 1.5.
Conclusions. We report the first isotopic fractionation maps of SiO in a shocked region and show the absence of a mass dependent fractionation in 29Si and 30Si across L1157-B1. A high-velocity bullet in 28SiO has been identified, showing the signature of a jet impacting on the dense gas. With the dataset presented in this paper, both interferometric and single-dish, we were able to study in great detail the gas shocked at the B1a position and its surrounding gas.
Key Words.:
ISM: clouds - ISM: molecules - radio lines: ISM1 Introduction
Studying the early stages in star and planetary systems formation is important for understanding the evolution of matter in the ISM, and finally our astrochemical origins. In particular, isotopic ratios are of pivotal importance to follow the chemical link in the evolution of the material in dense molecular clouds, nursery of new stars, to a planetary system like our own (e.g. Caselli & Ceccarelli 2012, and references therein).
Jets are common in protostars, as they are an efficient way to release angular momentum (Frank et al. 2014, and references therein), and they have a deep effect on the chemical and physical evolution of the ISM. Indeed, shocks created by the fast (at least 100 km s-1) jet propagating through the protostellar high-density cocoon are a unique place to study what is released by dust mantles and refractory cores as a consequence of processes such as sputtering and shattering (Bachiller et al., 2001; Fontani et al., 2014; Codella et al., 2017; Lefloch et al., 2017; Cheng et al., 2019; Kong et al., 2019; Ospina-Zamudio et al., 2019; Tychoniec et al., 2019).
One prototypical shock laboratory is the L1157 outflow. The Class 0 low-mass protostar L1157-mm, located at 350 pc (Zucker et al., 2019), is characterised by an episodic precessing jet (Gueth et al., 1996; Podio et al., 2016) that produced several shocked regions. L1157-B1 is a shocked region along the outflow driven by L1157-mm. L1157-B1 is one of the best places to study the material released from dust mantles because it is kinematically very young (2103 yr) (Codella et al., 2017). Previous observations of L1157-B1 have shown a very rich chemistry (Bachiller et al., 2001; Arce et al., 2008; Codella et al., 2009; Fontani et al., 2014; Codella et al., 2015, 2017; Lefloch et al., 2017; Codella et al., 2020). Interferometric observations show structure at small scale along the southern outflow lobe of L1157: the three large molecular clumps, called B0, B1 and B2, have been resolved into more subclumps (Benedettini et al., 2007). Some of the subclumps in B0, B1 and B2 are shown in Figure 1. Based on the jet radial velocity observed in the inner knots and on the precession model presented in Podio et al. (2016), the kinematical ages of the different shocked regions range from 1340 yr (B0), to 1550 yr (B1a) and 2530 yr (B2), at a distance of 350 pc. In particular, L1157-B1 is a laboratory to study the molecules released in the gas-phase from the surface of dust grains, and the interplay of the chemistry in the gas-phase and on the dust.
SiO is an excellent tracer of shocked gas in outflows. Silicon is released in the gas phase from the grains because of sputtering and grain-grain collisions along the shock, and it is oxidised to SiO (Schilke et al., 1997; Caselli et al., 1997). Therefore, SiO can be studied efficiently in a shock given that its abundance is expected to increase by orders of magnitude (Gusdorf et al. 2008a, b; Guillet et al. 2011; Podio et al. 2017, and references therein). The studies of SiO towards L1157-B1 include: the interferometric map of the 2-1 transition of the main isotopologue (Gueth et al., 1998), single-dish observations of multiple lines of the main isotopologue (Bachiller & Pérez Gutiérrez, 1997; Bachiller et al., 2001; Nisini et al., 2007), and single-dish observations of the rarer isotopologues 29SiO and 30SiO (Podio et al., 2017).
Here we present the first maps of the silicon isotopologues of SiO towards L1157-B1 (28SiO, 29SiO and 30SiO) observed in the framework of SOLIS (Seeds Of Life In Space; Ceccarelli et al. 2017), an IRAM NOrthern Extended Millimeter Array (NOEMA) large programme aimed at investigating the formation of complex molecules during the early stages of the star formation process. With this dataset we can study the isotopic fractionation of Si around a Sun-like protostar, and better constrain the origin of the SiO high velocity component. Furthermore, we complement the SOLIS data with previously obtained single-dish observations of SiO emission towards L1157-B1 from J=2-1 to 12-11.
The paper is structured as follows: the observations carried out with NOEMA, the IRAM 30m telescope and Herschel-HIFI are presented in Section 2, the results of the single-dish and interferometric observations are presented in Section 3, with a focus on the SiO isotopic fractionation in L1157-B1 and the kinematics. The non-LTE analysis of the IRAM 30m spectra are summarised in Section 4. In Section 5 we discuss the isotopic fractionation of SiO in the framework of the Galactic chemical evolution, as well as the signature of the jet coming from the protostar L1157-mm. Finally, our conclusions are summarised in Section 6.
2 Observations
2.1 NOEMA
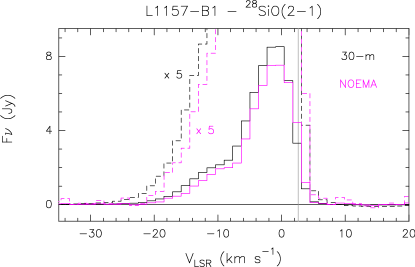
L1157-B1 was observed for 6.7 h at 3 mm with the IRAM NOEMA array during 1 track on April 7th 2018 (9 antennas) using the C configuration. The shortest and longest projected baselines are 24 m and 644 m, respectively. The phase centre is = 20h39m10s.21, = +68∘01′10′′.5. The 28SiO, 29SiO and 30SiO = 2-1 lines listed in Table 1 were observed using the Polyfix correlator, with a total spectral band of 8 GHz, and a spectral resolution of 2.0 MHz (7.3 km s-1). The main isotopologue has been observed also at high spectral resolution (62.5kHz, 0.22 km s-1). Calibration was carried out following standard procedures, using GILDAS-CLIC ***http://www.iram.fr/IRAMFR/GILDAS/. The bandpass was calibrated on 3C84, while the absolute flux was fixed by observing LkH101, 2010+723, and 1928+738. The final uncertainty on the absolute flux scale is 10. The phase rms was 60∘, the typical precipitable water vapour (pwv) was 6-10 mm, and the system temperature 80-120 K. Images were produced using natural weighting, and restored with a clean beam of 3.′′8 2.′′8 (PA= –167.8∘). The rms noise in the broadband cubes was 0.6-1.7 mJy beam-1, depending on the frequency. Our NOEMA observations recover 80 of the flux from the 28SiO (2-1) emission compared to the IRAM 30m observations, see Appendix B. The integrated intensities of the rarer isotopologues in both the NOEMA and IRAM 30m spectra match within 20%. Being 20% consistent with the calibration error of the observations, it does not have an impact on the quantities that we derive in the isotopic ratio maps.
2.2 IRAM 30-m
The single-dish observations of the SiO, 29SiO, and 30SiO lines from = 2-1 to = 8-7 (see Table 1 for the frequencies) have been obtained using the IRAM 30-m antenna in the context of the ASAI Large Program (Astrochemical Surveys At IRAM; Lefloch et al. 2018). The spectra are shown in Figure 2. Observations have been done in Wobbler Mode at the position of the B1 shock , namely at = 20h 39m 102, = +68 01 105, i.e. at = +25 and = -635 from the L1157-mm protostar. The present observations have been performed during several runs in 2011 and 2012 using the EMIR receiver connected with the FTS spectrometers providing a spectral resolution of 200 kHz (i.e. 0.2 km s-1 to 0.7 km s-1, depending on the frequency). More details can be found in Lefloch et al. (2018). The weaker spectra have been smoothed to 1.4 km s-1 to increase the S/N ratio. The Half Power Beam Width (HPBW) spans from 7 to 29, depending on the frequencies. The forward (Feff) and beam (Beff) efficiencies are in the 0.80-0.95, and 0.34-0-81 ranges, respectively. The final rms, in main-beam temperature, goes from 1 mK (at 85 GHz) to 25 mK (342 GHz).
2.3 Herschel-HIFI
The SiO, 29SiO, and 30SiO = 12-11 transitions (Table 1 reports their frequencies) were observed with Herschel-HIFI on 2010 October 27 and 2009 August 1, during the unbiased spectral survey CHESS (e.g. Ceccarelli et al. 2010) with the HIFI bands 1a, at the same position used for the IRAM 30-m observations. The spectra are shown in Figure 2. A receiver in double side band mode was used, with a total integration time of 8912 s. The Wide Band Spectrometer was used, with a velocity resolution of about 0.15 km s-1. The SiO(12-11) spectrum has been successively smoothed to 4 km s-1 to increase the S/N ratio. The forward (Feff) and beam (Beff) efficiencies are 0.96 and 0.73, respectively. The Half Power Beam Width (HPBW) is about 42 (Roelfsema et al., 2012). Data were processed with the ESA-supported package HIPE (Herschel Interactive Processing Environment) and analysed using the GILDAS-CLASS software ††footnotemark: . The flux uncertainty is around 15%. The rms, in main-beam temperature, is about 12-13 mK.
| line | Frequencya𝑎aa𝑎aMüller et al. (2013) | Eup | HPBW | rms | Vpeak | Tmb-peak | [-23, -13] | [-13, -3] | [-3, +5] |
| MHz | (K) | (”) | (mK) | (km/s) | (K) | (K km/s) | (K km/s) | (K km/s) | |
| SiO | |||||||||
| 2-1 | 86846.96 | 6 | 28 | 2 | -1.6 | 1.72 | 1.51 0.01 | 8.22 0.01 | 9.60 0.01 |
| 3-2 | 130268.61 | 13 | 19 | 9 | -0.2b𝑏bb𝑏bThe velocity difference between the 3-2 28SiO transition and all other transitions reported here is only one velocity channel, hence we consider its velocity in accordance with the others. | 2.86 | 1.93 0.03 | 12.13 0.03 | 17.41 0.03 |
| 5-4 | 217104.98 | 31 | 11 | 3 | -1.6 | 2.51 | 2.58 0.01 | 13.03 0.01 | 15.11 0.01 |
| 6-5 | 260518.02 | 44 | 9 | 5 | -1.6 | 1.69 | 1.66 0.02 | 8.93 0.02 | 9.37 0.02 |
| 8-7 | 347330.59 | 75 | 7 | 17 | -1.6 | 0.93 | 0.83 0.06 | 5.75 0.06 | 4.49 0.06 |
| 12-11c | 520881.09 | 163 | 41 | 13 | -1.6 | 0.04 | 0.17 0.05 | 0.06 0.04 | |
| 29SiO | |||||||||
| 2-1 | 85759.20 | 6 | 29 | 1 | -1.6 | 0.19 | 0.12 0.01 | 0.74 0.01 | -c𝑐cc𝑐c The integrated intensity at low velocities of the transition of 29SiO is not reported here because the line is blended with the 41,3-3-2,2 transition of 13CH3OH. |
| 3-2 | 128637.05 | 12 | 19 | 10 | -1.6 | 0.24 | 0.18 0.04 | 1.03 0.04 | 1.34 0.03 |
| 5-4 | 214385.75 | 31 | 11 | 3 | -1.6 | 0.16 | 0.11 0.01 | 0.72 0.01 | 0.83 0.01 |
| 6-5 | 257255.22 | 43 | 10 | 4 | -1.6 | 0.11 | 0.07 0.02 | 0.46 0.02 | 0.49 0.01 |
| 7-6 | 300120.47 | 58 | 8 | 10 | -1.6 | 0.05 | 0.25 0.04 | 0.18 0.03 | |
| 8-7 | 342980.84 | 74 | 7 | 25 | - | - | |||
| 12-11c | 514359.34 | 161 | 41 | 13 | - | - | |||
| 30SiO | |||||||||
| 2-1 | 84746.17 | 6 | 29 | 1 | -1.6 | 0.10 | 0.10 0.01 | 0.49 0.01 | 0.52 0.01 |
| 4-3 | 169486.88 | 20 | 15 | 28 | -1.6 | 0.17 | 0.6 0.1 | 0.7 0.1 | |
| 5-4 | 211853.47 | 31 | 12 | 3 | -1.6 | 0.11 | 0.06 0.01 | 0.53 0.01 | 0.57 0.01 |
| 6-5 | 254216.66 | 43 | 10 | 3 | -1.6 | 0.08 | 0.07 0.01 | 0.35 0.01 | 0.39 0.01 |
| 12-11d𝑑dd𝑑d The transitions are taken with Herschel/HIFI (LP CHESS). All the other spectra are taken with IRAM-30m (LP ASAI). | 508285.78 | 159 | 42 | 12 | - | - | |||
3 Results
3.1 Single-dish spectra
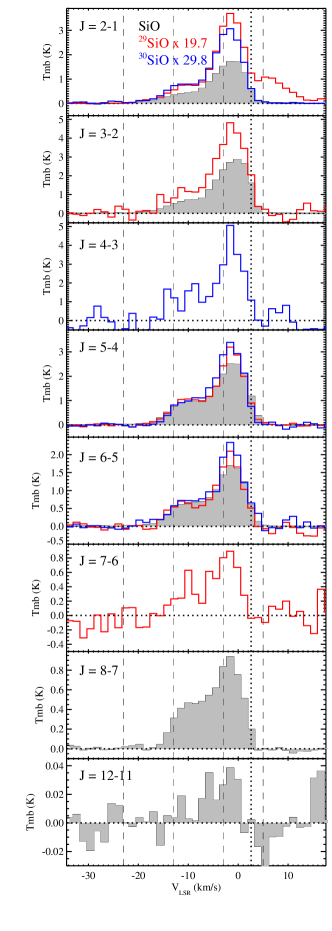
We detected 6 lines of 28SiO (up to = 12-11), 5 lines of 29SiO (up to = 7-6), and 4 lines of 30SiO (up to = 6-5), thus collecting a large SiO dataset (spanning from 86 GHz to 521 GHz). The spectra are shown in Figure 2 and the line properties are summarised in Table 1. The SiO lines peak at blue-shifted velocity, –4 km s-1 with respect to systemic velocity (vsys = +2.6 km s-1). Moreover, the SiO lines show a high-velocity wing extending up to -20 km s-1 likely originating in the strong shock occurring where the jet impacts the cavity walls (see Section 3.4). The single-dish spectra are used to characterise the physical properties of the emitting gas via the LVG analysis described in Section 4, and therefore the integrated intensities reported in Table 1 are divided into three velocity intervals: low velocity (LV) from -3 to +5 km s-1, high velocity (HV) from -13 to -3 km s-1, and extreme high velocity (EHV) from -23 to -13 km s-1.
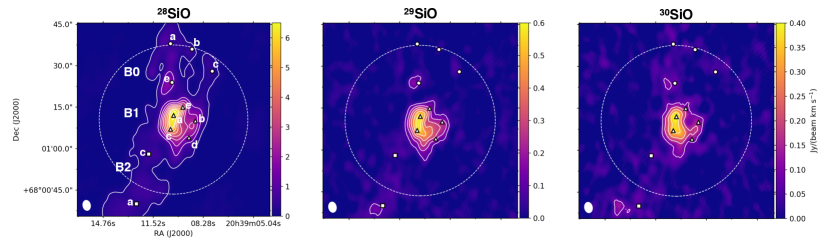
3.2 Integrated intensity maps
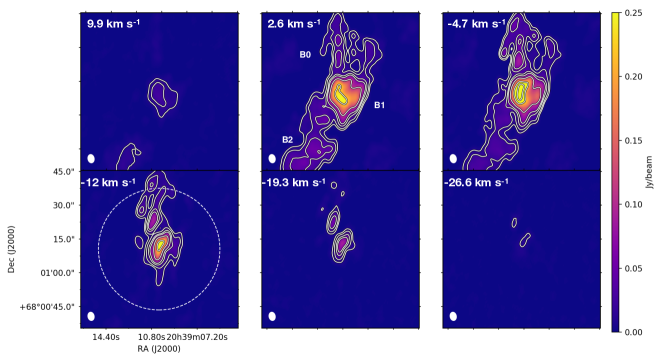
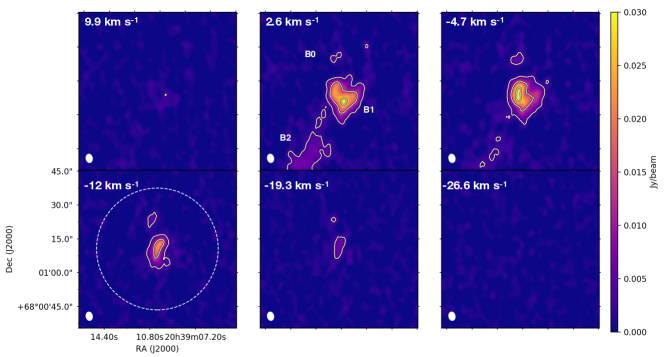
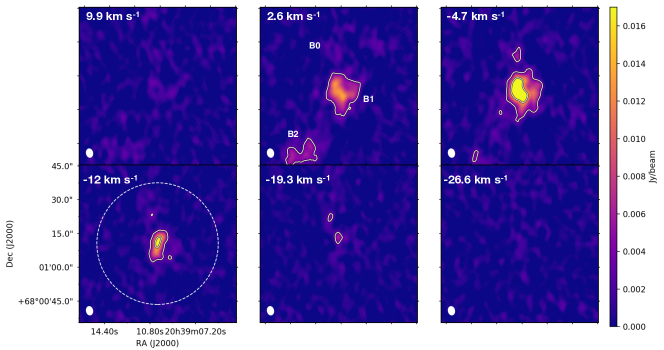
Figure 1 shows the image of the emission of the =2-1 transitions of 28SiO, 29SiO and 30SiO obtained with 7 km s-1 spectral resolution. The intensity has been integrated between -22.95 and 6.25 km s-1, i.e. in 4 channels centred at 2.6, -4.7, -12, and -19.3 km s-1 respectively, where emission from the rarer SiO isotopologues is detected (see Section 3.3). The channel maps for all three isotopologues are presented in the Appendix A (Figures A.1-A.3). The map of 28SiO (2-1) had already been reported in Gueth et al. (1998) using IRAM-PdBI with 4 antennas. The present NOEMA dataset has an improvement in the noise level of a factor of 20 (rms = 18.3 mJy/beam vs. 0.9 mJy/beam) and allows us to image higher (blue) velocities, up to –20 km s-1, as described in more detail in Section 3.4. The integrated intensity maps in Figure 1 show the structure of the bow shock B1, the B0 wall, and also some structure towards the shocked region B2. The rarer isotopologues show the same emission morphology of the main isotopologue, 28SiO, with the maximum located at = 20h39m10s.26, = +68∘01′10′′.61. This position is consistent, within the beam size, with the B1a clump shown in Benedettini et al. (2007) and thought to be the position where the precessing jet driven by L1157-mm impacts the cavity wall (Gueth et al., 1998). The rarer isotopologues also trace the so-called ”finger” in the south part of B1, identified at low velocities in SiO (Gueth et al., 1998) and in CS (Benedettini et al., 2007), which lies along the jet direction and is thought to be associated with the magnetic precursor of the shock (Bachiller et al., 2001). Given that B2 is outside the primary beam, we will be cautious on quantitative measurements towards that position.
3.3 SiO isotopic fractionation in L1157-B1
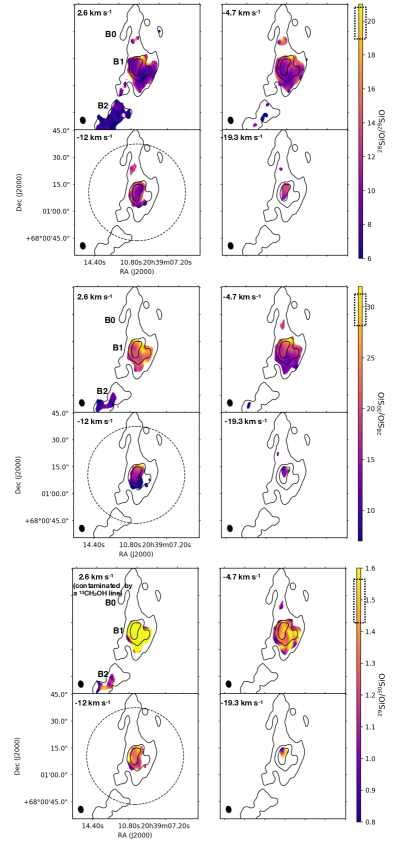
While the emission of the main isotopologue, 28SiO, is detected with more than 5 in all six channels shown in Figure A.1, the rarer isotopologues are detected only in the central 4 channels, from +2.6 to –19.3 km s-1, shown in Figures A.2 and A.3. For this reason, we only use these channels to compute the integrated intensity maps (Figure 1) and the isotopic ratio maps (Figure 3). A threshold of 5 has been applied to the maps of the different isotopologues before computing the isotopic ratio maps. The Solar isotopic ratios are: [28Si/29Si] = 19.7, [28Si/30Si]= 29.8, and [29Si/30Si]= 1.5 (Anders & Grevesse, 1989).
The [28SiO/29SiO] and [28SiO/30SiO] ratios in the maps shown in Figure 3 (upper and middle panel) are lower than the Solar ratios (shown as a dotted box in the colour bar), which can be interpreted as an indirect proof that the 28SiO (2-1) line is optically thick in the whole region and at all velocities that we imaged. Podio et al. (2017) measured the [28SiO/29SiO] and [28SiO/30SiO] ratios from single-dish observations of the (5-4) and (6-5) transitions, and showed that while the high-velocity wings are in agreement with the solar isotopic ratios, in the low velocities the ratios are 10–15 lower, suggesting a large optical depth of the main isotopologue.
Contrary to what happens in the isotopic ratio maps involving the main isotopologue, the [29SiO/30SiO] ratio shown in the lower panel of Figure 3 is quite uniform around the Solar ratio of 1.5 in all channels except the one at +2.6 km s-1. This deviation can be explained with a contamination by the 41,3-3-2,2 transition of 13CH3OH, as shown in Figure 2 of Podio et al. (2017). The value of the [29SiO/30SiO] ratio averaged within a beam in the channel at –19.3 km s-1 is 1.14, while in the channels at –12.0 km s-1 and –4.7 km s-1 ranges from 1.1 to 1.5. Considering an uncertainty of 20 on our maps and of 5 on the Solar isotopic ratio (Anders & Grevesse, 1989), these values are consistent with the Solar value of 1.5, and do not show any variation across the source. Studying the isotopic fractionation in galactic sources (as L1157-B1), and comparing it with the Solar value (defined 4.6 Gyr ago), gives information on the environment where the Sun and Solar system were formed, as well as the processes that formed them. Our results confirm what was reported in Podio et al. (2017) based on single-dish observations: there has not been a significant change in the Si isotopic ratios in the past 4.6 billion years. Furthermore, with the present dataset, we can now exclude local changes in the isotopic ratios within the shocked region in L1157-B1.
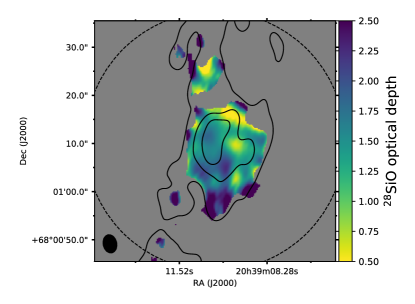
We compute the optical depth () map for the 28SiO (2-1) transition across the core, see Figure 4. Following what is described in Mangum & Shirley (2015), we have computed the optical depth of the main isotopologue assuming that the emission of both 28SiO and 30SiO is co-spatial, that the atomic Solar ratio of [28Si/30Si]= 29.8 is the same as the molecular ratio, and that the two isotopologues have similar line profiles:
| (1) |
Towards the B0 and B1 clumps, the values of averaged within a beam range from 1.0 to 2.2, comparable with the values reported in Podio et al. (2017) derived from single-dish observations ( = 0.7-1.9). The southern clump B2 is outside the primary beam and hence not considered in this discussion.
3.4 Kinematics: the jet signature
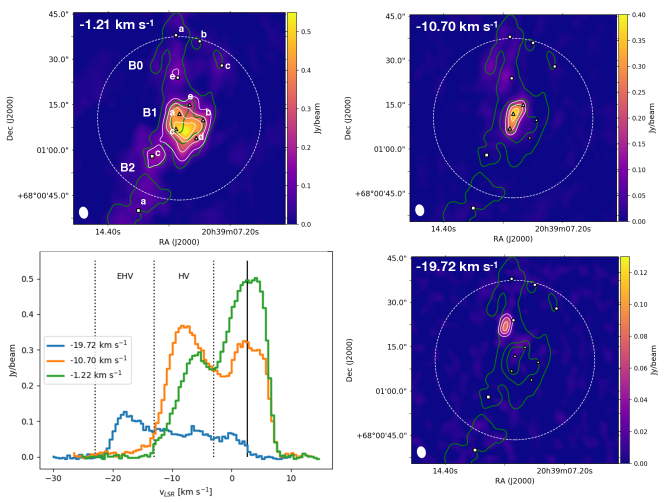
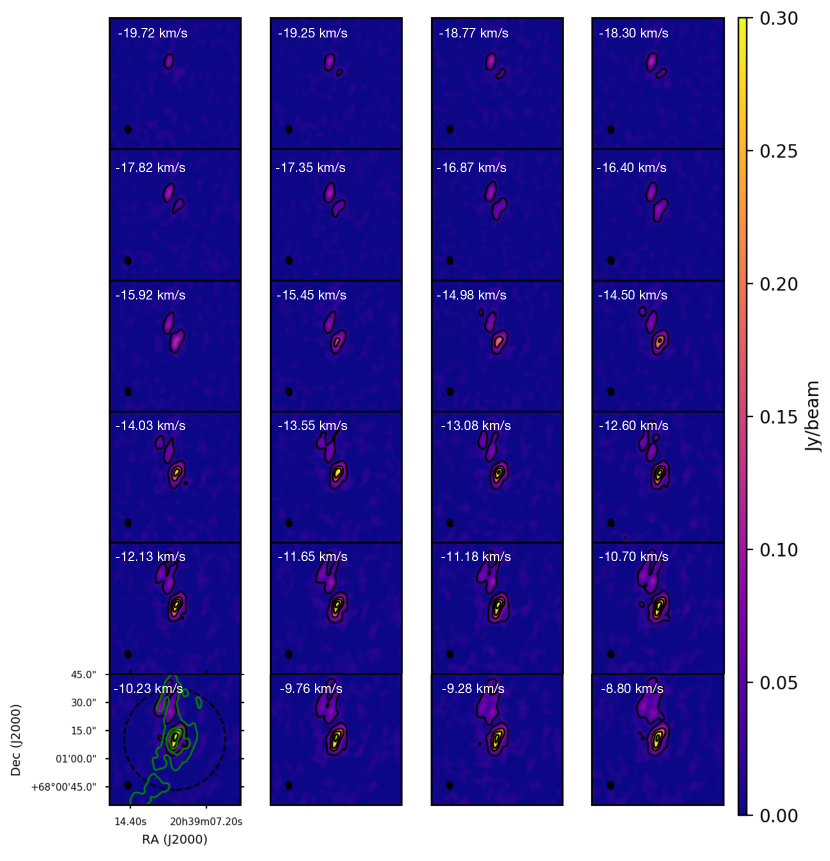
As reported in Section 2, we have imaged the main isotopologue, 28SiO, also with high-velocity resolution (0.22 km s-1). We successively smoothed the spectra to 0.5 km s-1 in order to further increase the S/N ratio (see Figure 5 for a sample of spectra), and obtained an unprecedented view of the high velocity component of the (2-1) transition. This allows us to look for signatures of the expected impacts of the jet against the cavity walls. In Figure 5, we show three representative velocity channel maps, at very high (–19.72 km s-1), high (–10.70 km s-1), and low velocity (–1.22 km s-1): using such images we selected the intensity peaks and extracted the corresponding spectra (see Figure 5, bottom left). As a first result, we confirm that, within the B1 structure, the highest velocity SiO emission (see the channel map centred at –10.70 km s-1) is associated with the B1a clump (Benedettini et al., 2007). This position is indeed considered the youngest impact between the jet (never directly imaged outside the protostar; Podio et al. 2016) and the B1 cavity (see also Busquet et al. 2014 and Benedettini et al. 2012 on H2O, OI and high- CO PACS Herschel data).
Furthermore, the present dataset allows us to image, for the first time, very high velocity SiO emission outside B1, namely towards the northern B0 clump (see the channel map centred at –19.72 km s-1 in Figure 5). The comparison between the spectra extracted in the three different intensity peaks clearly shows how the low velocity emission looses its importance in the B1a and B0 peaks. The green spectrum in Figure 5 shows a peak close to the systemic velocity of the source (+2.6 km s-1, shown as a vertical line) and a very broad blue-shifted wing, with a hint of a second peak around –7.5 km s-1. The orange spectrum shows a double peak structure with the blue-shifted peak brighter than the peak close to the systemic velocity. The most extreme is represented by the blue spectrum, extracted at the peak position of the –19.72 km s-1 channel map, which definitely differs with respect to the other two spectra, showing almost no emission at the systemic velocity and the expected profile for a shock driven by a high-speed jet (see e.g. Lefloch et al. 2015, and references therein). As B0 is the youngest shock in the region, it provides a unique opportunity to study which grain species are released by the shock to the gas phase.
3.5 High and extremely high velocity SiO emission maps
In order to better characterise the origin and nature of the SiO emitting gas, we roughly divided the integrated emission in three intervals, based on the spectra showed in Figure 5 and discussed in the previous section: low velocity (LV) from -3 to +5 km s-1, high velocity (HV) from -13 to -3 km s-1, and extreme high velocity (EHV) from -23 to -13 km s-1.
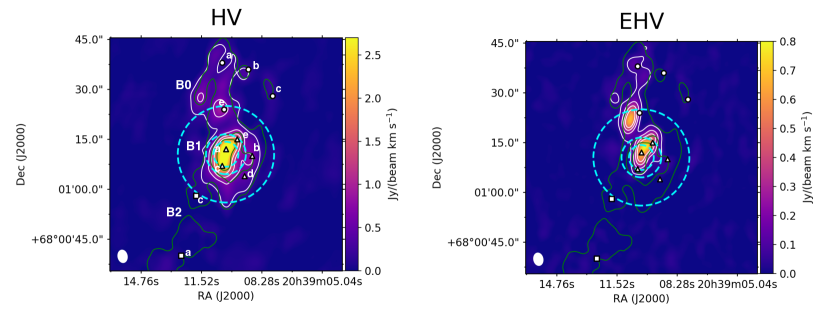
Figure 6 shows the emission maps of the HV and EHV gas, integrated in the corresponding velocity intervals, and Table 1 reports the integrated intensities in those velocity intervals for all the SiO lines detected with single-dish telescopes. The single dish spectra are taken within the area marked by the circles in Figure 6.
The HV emission peaks at the B1a position, and is intense over a roundish clump more than 15′′ in size. However, the HV emission is not limited to the B1a clump but originates also from the more extended B1 whole region as well as the B0 shock and walls. On the other hand, the EHV emission is more concentrated and presents two distinct peaks, at the B1a and B0e positions, of similar intensity and spatial extent, about 15′′ x 6′′. A faint, but definitively detected, EHV emission is also present along the north wall of B0, perhaps identifying the gas entrained by the jet impacting B0 and responsible for the SiO emission shocked-gas clump in that position (and discussed in Section 3.4). In the next Section, we will analyse the gas properties (temperature and density) of the HV and EHV gas.
4 LVG analysis
In this section we analyse the single-dish spectra of the SiO and its isotopologues 29SiO and 30SiO from the up to the transition ( from to K), shown in Fig. 2. The 12-11 spectrum has been excluded from the analysis because it is too noisy: note however that the fluxes reported in Table 1 are consistent with the solutions provided below. The line properties are summarised in Table 1, which also reports the integrated intensity in three velocity ranges: extreme high velocity (EHV: –23 to –13 km s-1), high velocity (HV: –13 to –3 km s-1), and low velocity (LV: –3 to +5 km s-1).
In order to derive the average physical properties of the gas emitting SiO, we carried out a non-LTE analysis using the Large Velocity Gradient (LVG) code described in Ceccarelli et al. (2003). We used the collisional coefficients of SiO with H2 computed between 10 and 300 K for the first 20 levels by Dayou & Balança (2006) and provided by the BASECOL database (Dubernet et al. 2013).
We run a large grid of models (7000) covering a SiO column density from to cm-2, a H2 density from to cm-3, and a temperature from 30 to 300 K. We then find the solution by simultaneously fitting the 28SiO, 29SiO and 30SiO lines, leaving as free parameters , and , while the emitting sizes and line widths are those measured. Note that we assumed the 28Si/29Si=19.7 and 28Si/30Si=29.8, as obtained by Anders & Grevesse (1989) and confirmed by our SOLIS observations for L1157-B1 (see Section 3.3), and we added the 20% of calibration uncertainty in the observed intensity error bars. We sampled the parameter space unevenly (with steps of 10 K until 100 K and 20 K for larger temperatures, steps of a factor of 2 for densities lower than cm-3 and 1.3 at larger ones, steps of a factor of 1.5 in column densities until cm-2 and 1.1-1.2 at larger ones to be sure to cover it better close to the minimum . The beam dilution is taken into account, assuming that the emitting gas has a circular gaussian shape and using the standard equation for beam dilution.
We carried out the non-LTE analysis for the HV and EHV components. The results are described in the two following subsections and summarised in Table ‡ ‣ 2.
| Component | size | XSiOa𝑎aa𝑎aSiO abundance with respect to molecular hydrogen. The H2 column density used to calculate the SiO abundance is derived from the CO column density in the ”g1” and ”g2” components of the gas in L1157-B1 described in Lefloch et al. (2012), see Section 5.3. | |||
|---|---|---|---|---|---|
| cm-2 | ′′ | K | cm-3 | 10-7 | |
| HV-B1a | 40(8) | 10(2) | 180(36) | 6(1) | 5(1) |
| HV-cold | 40(8) | 25(5) | 40(8) | 2.0(4) | 0.5(1) |
| EHV-B1a | 8(2) | 9(2) | 180(36) | 6(1) | 5(1) |
| EHV-cold | 8(2) | 20(4) | 30(6) | 2.0(4) | 0.5(1) |
Numbers in parentheses are one standard deviation in units of the least significant digit.
The errors on the sizes are derived from the observations.
4.1 High velocity component
As shown in Figure 6 and discussed in Section 3.5, the HV SiO emission extends over a size of 15′′ centred on B1a with a halo encompassing the whole B1 region and the B0 wall. We, therefore, started our non-LTE analysis considering that the emission originates in the roundish 15′′ B1a clump but could not find a good enough fit for all the J=2-1 to 8-7 28SiO, 29SiO and 30SiO lines. When observing shocked regions like L1157-B1, the presence of several gas components in the line of sight has to be taken into consideration Lefloch et al. (2012). We then proceeded with a two physical components model, as suggested in the HV emission map by the presence of both the B1 and part of the B0 regions, see Figure 6. To constrain the parameters of the gas around B1a, we used the three lines with a beam size approximately covering the B1a clump, namely those with J from 5-4 to 8-7.
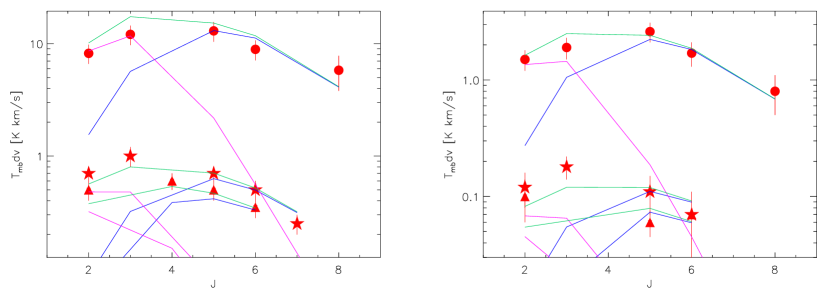
The comparison between the observed and the theoretical integrated intensities provides a very good solution, with well constrained parameters: 3–8 cm-2 for emitting size 10 (i.e. approximately the observed FWHM of the HV emitting gas around B1a, shown in Fig. 6), between 10 and 4 cm-3 and between 90 and 250 K, with the best fit – lying along a degenerate but very well constrained curve, where higher densities corresponds to lower temperatures. We then looked for a fit with two physical components, the first one from the previous fit of the J=5-4 to 8-7 lines and the second one found by best fitting the residuals of all lines. We obtain a final very good fit (reduced with 11 degrees of freedom) with: (i) a warm component associated with the B1a clump with K, cm-3, and cm-2; (ii) a colder component with K, cm-3, cm-2 and whose extent is about x. The theoretical and the observed fluxes are shown in Fig. 7. A similar good fit is also obtained considering for the warm B1a component =100 K and cm-3 (=1.45) or =250 K and cm-3 (=1.16).
4.2 Extremely high velocity component
The SiO J=2-1 map of Figure 6 shows that the EHV emission is split in two clumps about 15′′ x 6′′ in size, centred on B1a and B0. We started with a single component fit with the emitting size equal to 18′′, approximately the sum of the two clumps in the EHV map. We obtained a relatively good solution (=1.8 for 9 degree of freedom) with cm-2, between 1 and 7 cm-3 and between 80 and 300 K, with the best fit – lying along a degenerate but very well constrained curve, where higher densities corresponds to lower temperatures.
However, there is no reason that the gas temperature and density are the same in the two clumps, so we also considered a fit with the lines encompassing the B1a clump only to have a more constrained view of the parameters in B1a. The best-fit of the J=5-4 to 8-7 28SiO, 29SiO and 30SiO lines is obtained with =8 cm-2, cm-3 and K; within 1 , we obtain =4-40 cm-2, between 3 and 10 cm-3 and between 120 and 300 K, always along a degenerate curve as above. We then proceeded, as for the HV case, to fit the residuals to constrain the parameters of a second physical component probed by the EHV emission. However, since the three lines (J=5 to 8) do not cover the B0 region, we only use the J=2-1 and 3-2 to constraint the EHV component in B0. With this caveat, we obtain a best fit of the second component with cm-2, cm-3, K and whose extent is about 30′′x15′′, indicating that the J=2-1 and 3-2 line emission is still dominated by the large scale encompassed by the single-dish measurements rather than the B0 clump. The obtained solution is shown in Figure 7.
5 Discussion
5.1 Isotopic fractionation and Galactic chemical evolution
Isotopic fractionation is a key observable to understand the chemical evolution of the Universe. When studying the evolution of our Solar System, by observing the isotopic fractionation in some key elements we are able to distinguish among solar and pre-solar material, and hence derive information about the physical conditions of the pre-solar nebula, just before the formation of the Solar System (e.g. Hoppe et al. 2018). Moreover, isotopic fractionation can be used to get insights on star formation and evolution (Timmes & Clayton, 1996). Monson et al. (2017) show that secondary (29Si and 30Si) to primary (28Si) isotope ratios of silicon do not show any detectable variation along the Galactic radius. This is an interesting result because of the large (900%) variations observed in the secondary/primary oxygen isotope ratios, and Galactic chemical evolution (GCE) predicts that silicon and oxygen isotopic ratios should evolve in parallel with a nearly constant ratio in the secondary isotopes (29Si/30Si), and an increasing secondary to primary isotopic ratios (29Si/28Si and 30Si/28Si) with decreasing Galactocentric radius (Wilson, 1999). Furthermore, Monson et al. (2017) report a higher 30Si/29Si in the ISM than both Solar and pre-solar SiC grains, hinting at the possibility of a difference in the chemical evolution of the two secondary isotopes of Si within the Galaxy. This result could be explained if a mass-dependent isotopic fractionation would be in place, where the heavier isotopes evolve differently with respect to the main one. We do not see this behaviour within L1157-B1, whose 29SiO/30SiO corresponds within error bars to the Solar value across the whole source (see lower panel in Figure 3). If a mass-dependent isotopic fractionation happens within our Galaxy, as suggested in Monson et al. (2017), it does not occur in the timescales probed with L1157-B1 (1000 years), i.e. the time scale that the material sputtered from the dust grains has to react in the gas phase and chemically evolve.
5.2 The jet of L1157-mm
Jets are pivotal in the early stages of star-formation, as they allow the accretion of mass from the disk onto the star by extracting angular momentum. While towards L1157 we see the effect of the jet impacting the gas (Tafalla & Bachiller, 1995; Gueth et al., 1996; Benedettini et al., 2012), the only direct observational evidence of the jet associated with L1157-mm so far are the spectra of the SiO bullets (Tafalla et al., 2015) and the maps of the high velocity CO and SiO bullets (Podio et al., 2016), both detected close to the protostar. We present here for the first time a very high velocity bullet in SiO, showing the high-velocity jet at the position of the B0 shocked region working surface (at a distance of 68′′, i.e. 0.12 pc, from the protostar). This SiO bullet is barely recognisable in the channel maps presented in Figure 2 of Gueth et al. (1998) (lower panel to the right, at -18.3 km s-1). Moreover, the velocity found in the high-velocity SiO bullet B0 is compatible with the velocity of the high-velocity bullets detected close to L1157-mm in Podio et al. (2016) if we take into account the precession pattern. A high-velocity feature was already observed in CS (see red curve in Figure 9 of Benedettini et al. 2013) towards the same position. The spectrum extracted from the peak of the high velocity channel (blue solid line) in Figure 5 shows the signature of the jet impacting the gas and creating the shocked region B0. A similar spectral feature has been already observed towards L1448-B1 in Nisini et al. (2007), see their spectrum at the bottom left in Figure 2, and towards IRAS 04166+2706 in Tafalla et al. (2010), see top right spectrum in their Figure 3.
5.3 The B1a clump and its surrounding gas
The high spatial resolution of the new SOLIS SiO observations coupled with single-dish observations allow to provide stringent constraints on the gas shocked at the B1a position and its surrounding gas. The analysis and the derived gas parameters are discussed in Section 4 and summarised in Table ‡ ‣ 2.
The SiO emitting gas in B1a, both the HV and EHV components, is heated at about 180 K and its density is about cm-3: there is about five times more SiO column density associated with the HV than the EHV gas in B1a. Similarly, the gas surrounding B1a is much colder, at around 30–40 K, and more tenuous by about a factor 3. The SiO column density of this cooler gas is the same as that in B1a, which is a bit surprising as a coincidence. In the following, we will try to better understand the meaning of these findings and the implications.
A few years ago, Lefloch et al. (2012) carried out an analysis of the CO emission towards L1157-B1 using single-dish observations that covered the J=1-0 up to J=16-15 lines. They found that the spectra could be decomposed in three velocity components, defined by the slope of the intensity versus the velocity of each line spectrum. Although the velocity decomposition is different from that used in the present work, which is purely based on three different velocity intervals, it is interesting to note that Lefloch et al. also find a component, designed as ”g1”, which they associated with the shocked gas, whose sizes (), density (a few cm-3) and temperature ( K) is not very different from our component associated with B1a. Therefore, our new SOLIS observations suggest that the Lefloch et al. ”g1” is very likely dominated by the emission from the shocked gas at B1a, supporting the Lefloch et al. claim. Incidentally, this indicates that an accurate non-LTE analysis of single-dish data can provide fairly correct information even at scales much smaller than the used telescope beams.
In addition to the ”g1” component, Lefloch et al. also found two other components, called ”g2” and ”g3”, associated respectively with the walls of the B1 and B2 cavities. The ”g2” component has parameters not very different from those of the ”cold” component of our HV and EHV fit: sizes about 20′′ against our 20–25′′, temperature about 60 K against our 30–40 K, and density larger than a few cm-3 against our cm-3. Therefore, the ”g2” component is probably, at least in part, associated with the gas surrounding B1a and encompassing the whole B1 clump.
The association of our B1a and cold components with the ”g1” and ”g2” components of the Lefloch et al. CO analysis allow us to estimate the abundance of SiO in them. Specifically, Lefloch et al. found that the CO column density is and cm-2 in ”g1” and ”g2”, respectively: assuming a CO abundance of with respect to H2, this corresponds to a SiO abundance of about 5 and 0.5 in B1a and its surrounding, respectively. Although substantially increased with respect to the SiO in the quiescent gas of molecular clouds (10-12, Martin-Pintado et al. 1992), the silicon in the gas phase, released because of the sputtering and shattering of the grain mantles and refractory cores, is still just a small fraction of its elemental abundance (3.5, Wilson & Rood 1994). The remaining Si is likely still in the dust grains, as they are not expected to be completely destroyed by shocks. Assuming that atomic Si is efficiently converted into SiO as soon as it reaches the gas-phase (Neufeld & Dalgarno, 1989; Herbst et al., 1989), our results reach a good agreement with the models of Caselli et al. (1997) for a shock with with velocity between 30 and 35 km s-1.
We finally discuss the nature/origin of the ”cold” gas surrounding B1a. Based on its properties (temperature, density and SiO abundance), this gas can be either material entrained by the B1a shock or itself cooled gas from previous (namely older) shocks or both. The presence of multiple shocks in B1, that occurred within 1500 yr, was reported by Podio et al. (2016) and successfully used by Codella et al. (2017, 2019) to identify chemical formation routes of molecules more complex than SiO, so there is a high probability that the ”cold” component is cooled shocked gas. However, the HV map of the SiO J=2-1 line (Figure 6) suggests that a more extended, probably entrained gas also contributes to the emission.
6 Conclusions
We present here the first isotopic ratio maps of SiO towards a shocked region. From these interferometric maps we can infer that the (2-1) transition of the main isotopologue is optically thick within the whole region imaged, also at high velocities (up to -20 km s-1). The isotopic ratio map of the two rarer isotopologues, 29SiO and 30SiO, shows a uniform value consistent with the Solar value of [29Si/30Si]= 1.5.
Coupling the high spatial resolution of the new SOLIS data with the large single-dish dataset, we were able to put stringent constraints on the physical properties of the gas in L1157-B1. Our observations can be reproduced by a more compact, denser and warmer gas component ( = 6105 cm-3, T = 180 K and XSi = 510-7), and a more extended colder and less dense gas component ( = 2105 cm-3, T = 40 K and XSi = 0.510-7).
Furthermore, thanks to the high spectral resolution and sensitivity of the SOLIS dataset, we have identified a high-velocity bullet of SiO tracing the impact of the jet arising from the protostar L1157-mm on the B0 clump, opening a new laboratory for future studies to further unveil the complex physical and chemical structure of this source.
Acknowledgements.
We thank the anonymous referee for valuable comments and suggestions. This work is based on observations carried out under project number L15AA with the IRAM NOEMA Interferometer [30m telescope]. IRAM is supported by INSU/CNRS (France), MPG (Germany) and IGN (Spain). We are very grateful to all the IRAM staff, whose dedication allowed us to carry out the SOLIS project. This work was supported by (i) the PRIN-INAF 2016 ”The Cradle of Life - GENESIS-SKA (General Conditions in Early Planetary Systems for the rise of life with SKA)”, (ii) the program PRIN-MIUR 2015 STARS in the CAOS - Simulation Tools for Astrochemical Reactivity and Spectroscopy in the Cyberinfrastructure for Astrochemical Organic Species (2015F59J3R, MIUR Ministero dell’Istruzione, dell’Universitá della Ricerca e della Scuola Normale Superiore), (iii) the European Research Council (ERC) under the European Union’s Horizon 2020 research and innovation programme, for the Project ”The Dawn of Organic Chemistry” (DOC), grant agreement No 741002, and (iv) the European Marie Skłodowska-Curie actions under the European Union’s Horizon 2020 research and innovation programme, for the Project ”Astro-Chemistry Origins” (ACO), Grant No 811312.References
- Anders & Grevesse (1989) Anders, E., & Grevesse, N. 1989, Geochim. Cosmochim. Acta., 53, 197
- Arce et al. (2008) Arce, H. G., Santiago-García, J., Jørgensen, J. K., Tafalla, M., & Bachiller, R. 2008, ApJ, 681, L21
- Arce et al. (2008) Arce, H. G., Santiago-García, J., Jørgensen, J. K., et al. 2008, ApJ, 681, L21
- Bachiller et al. (2001) Bachiller, R., Pérez Gutiérrez, M., Kumar, M. S. N., & Tafalla, M. 2001, A&A, 372, 899
- Bachiller & Pérez Gutiérrez (1997) Bachiller, R., & Pérez Gutiérrez, M. 1997, ApJ, 487, L93
- Busquet et al. (2014) Busquet, G., Lefloch, B., Benedettini, M., et al. 2014, A&A, 561, A120
- Benedettini et al. (2007) Benedettini, M., Viti, S., Codella, C., et al. 2007, MNRAS, 381, 1127
- Benedettini et al. (2012) Benedettini, M., Busquet, G., Lefloch, B., et al. 2012, A&A, 539, L3
- Benedettini et al. (2013) Benedettini, M., Viti, S., Codella, C., et al. 2013, MNRAS, 436, 179
- Caselli et al. (1997) Caselli, P., Hartquist, T. W., & Havnes, O. 1997, A&A, 322, 296
- Caselli & Ceccarelli (2012) Caselli, P., & Ceccarelli, C. 2012, A&A Rev., 20, 56
- Ceccarelli et al. (2003) Ceccarelli, C., Maret, S., Tielens, A. G. G. M., et al. 2003, A&A, 410, 587
- Ceccarelli et al. (2010) Ceccarelli, C., Bacmann, A., Boogert, A., et al. 2010, A&A, 521, L22
- Cheng et al. (2019) Cheng, Y., Qiu, K., Zhang, Q., et al. 2019, ApJ, 877, 112
- Codella et al. (2009) Codella, C., Benedettini, M., Beltrán, M. T., et al. 2009, A&A, 507, L25
- Codella et al. (2015) Codella, C., Fontani, F., Ceccarelli, C., et al. 2015, MNRAS, 449, L11
- Codella et al. (2017) Codella, C., Ceccarelli, C., Caselli, P., et al. 2017, A&A, 605, L3
- Codella et al. (2020) Codella, C., Ceccarelli, C., Bianchi, E., et al. 2020, arXiv e-prints, arXiv:2001.00217
- Dayou & Balança (2006) Dayou, F., & Balança, C. 2006, A&A, 459, 297
- Dubernet et al. (2013) Dubernet, M.-L., Alexander, M. H., Ba, Y. A., et al. 2013, A&A, 553, A50
- Fontani et al. (2014) Fontani, F., Codella, C., Ceccarelli, C., et al. 2014, ApJ, 788, L43
- Frank et al. (2014) Frank, A., Ray, T. P., Cabrit, S., et al. 2014, Protostars and Planets VI, 451
- Gueth et al. (1996) Gueth, F., Guilloteau, S., & Bachiller, R. 1996, A&A, 307, 891
- Gueth et al. (1998) Gueth, F., Guilloteau, S., & Bachiller, R. 1998, A&A, 333, 287
- Guillet et al. (2011) Guillet, V., Pineau Des Forêts, G., & Jones, A. P. 2011, A&A, 527, A123
- Gusdorf et al. (2008a) Gusdorf, A., Cabrit, S., Flower, D. R., & Pineau Des Forêts, G. 2008a, A&A, 482, 809
- Gusdorf et al. (2008b) Gusdorf, A., Pineau Des Forêts, G., Cabrit, S., & Flower, D. R. 2008b, A&A, 490, 695
- Herbst et al. (1989) Herbst, E., Millar, T. J., Wlodek, S., et al. 1989, A&A, 222, 205
- Hoppe et al. (2018) Hoppe, P., Rubin, M., & Altwegg, K. 2018, Space Sci. Rev., 214, 106
- Kong et al. (2019) Kong, S., Arce, H. G., Maureira, M. J., et al. 2019, ApJ, 874, 104
- Lefloch et al. (2012) Lefloch, B., Cabrit, S., Busquet, G., et al. 2012, ApJ, 757, L25
- Lefloch et al. (2015) Lefloch, B., Gusdorf, A., Codella, C., et al. 2015, A&A, 581, A4
- Lefloch et al. (2017) Lefloch, B., Ceccarelli, C., Codella, C., et al. 2017, MNRAS, 469, L73
- Lefloch et al. (2018) Lefloch, B., Bachiller, R., Ceccarelli, C., et al. 2018, MNRAS, 477, 4792
- Mangum & Shirley (2015) Mangum, J. G., & Shirley, Y. L. 2015, PASP, 127, 266
- Martin-Pintado et al. (1992) Martin-Pintado, J., Bachiller, R., & Fuente, A. 1992, A&A, 254, 315
- Monson et al. (2017) Monson, N. N., Morris, M. R., & Young, E. D. 2017, ApJ, 839, 123
- Müller et al. (2013) Müller, H. S. P., Spezzano, S., Bizzocchi, L., et al. 2013, Journal of Physical Chemistry A, 117
- Neufeld & Dalgarno (1989) Neufeld, D. A., & Dalgarno, A. 1989, ApJ, 340, 869
- Nisini et al. (2007) Nisini, B., Codella, C., Giannini, T., et al. 2007, A&A, 462, 163
- Ospina-Zamudio et al. (2019) Ospina-Zamudio, J., Lefloch, B., Favre, C., et al. 2019, MNRAS, 490, 267
- Podio et al. (2016) Podio, L., Codella, C., Gueth, F., et al. 2016, A&A, 593, L4
- Podio et al. (2017) Podio, L., Codella, C., Lefloch, B., et al. 2017, MNRAS, 470, L16
- Roelfsema et al. (2012) Roelfsema, P. R., Helmich, F. P., Teyssier, D., et al. 2012, A&A, 537, A17
- Schilke et al. (1997) Schilke, P., Walmsley, C. M., Pineau des Forets, G., & Flower, D. R. 1997, A&A, 321, 293
- Tafalla & Bachiller (1995) Tafalla, M., & Bachiller, R. 1995, ApJ, 443, L37
- Tafalla et al. (2010) Tafalla, M., Santiago-García, J., Hacar, A., & Bachiller, R. 2010, A&A, 522, A91
- Tafalla et al. (2015) Tafalla, M., Bachiller, R., Lefloch, B., et al. 2015, A&A, 573, L2
- Timmes & Clayton (1996) Timmes, F. X., & Clayton, D. D. 1996, ApJ, 472, 723
- Tychoniec et al. (2019) Tychoniec, Ł., Hull, C. L. H., Kristensen, L. E., et al. 2019, A&A, 632, A101
- Zucker et al. (2019) Zucker, C., Speagle, J. S., Schlafly, E. F., et al. 2019, ApJ, 879, 125
- Wilson & Rood (1994) Wilson, T. L., & Rood, R. 1994, ARA&A, 32, 191
- Wilson (1999) Wilson, T. L. 1999, Reports on Progress in Physics, 62, 143
Appendix A Channel maps
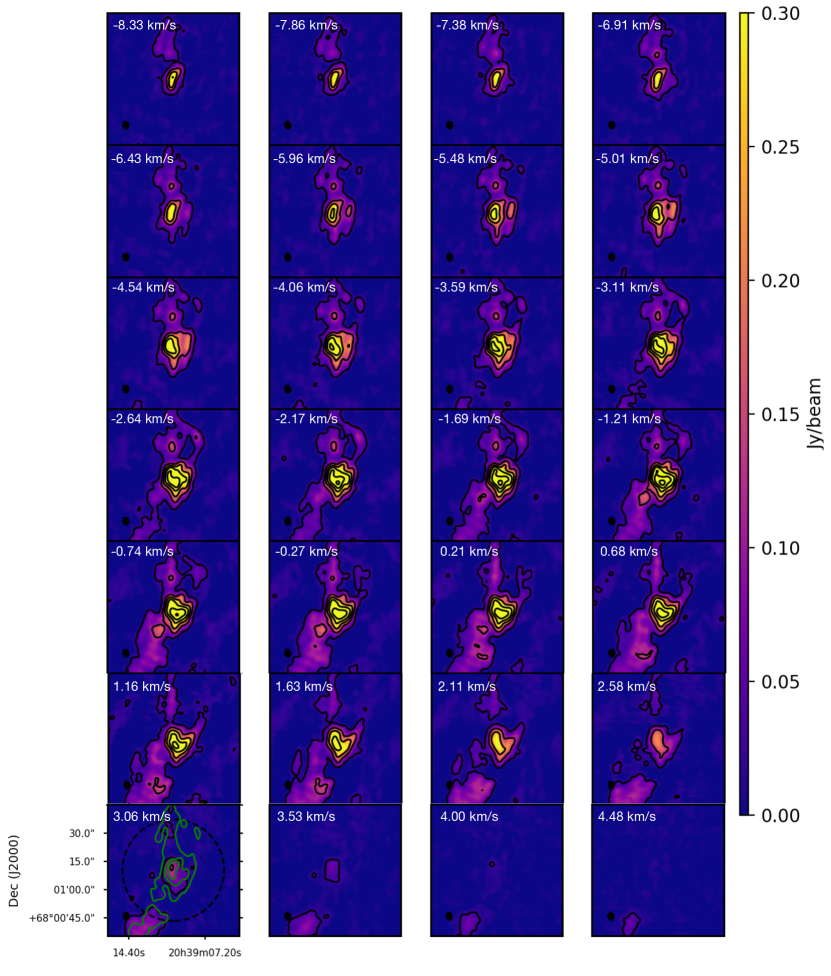
Figures A.1, A.2 and A.3 show the channel maps of the observed SiO isotopologues (see Table 1) with low velocity resolution (7.3 km s-1). Figures A.4 and A.5 show the channel maps of the main isotopologue observed with high velocity resolution (0.5 km s-1).
Appendix B Missing flux
The spectra of the main isotopologue 28SiO observed with NOEMA has been compared with the spectrum observed with the IRAM 30-m antenna, to evaluate the missing flux of the present NOEMA dataset. The comparison is shown in Figure B.1. About 80% of the flux is recovered.