Circumbinary Disks of the Protostellar Binary Systems in the L1551 Region
Abstract
We report ALMA Cycle 4 observations of the Class I binary protostellar system L1551 IRS 5 in the 0.9-mm continuum emission, C18O (=3–2), OCS (=28–27), and four other Band 7 lines. At 007 (= 10 au) resolution in the 0.9 mm emission, two circumstellar disks (CSDs) associated with the binary protostars are separated from the circumbinary disk (CBD). The CBD is resolved into two spiral arms, one connecting to the CSD around the northern binary source, Source N, and the other to Source S. As compared to the CBD in the neighboring protobinary system L1551 NE, the CBD in L1551 IRS 5 is more compact (150 au) and the =1 mode of the spirals found in L1551 NE is less obvious in L1551 IRS 5. Furthermore, the dust and molecular-line brightness temperatures of CSDs and CBD reach 260 K and 100 K, respectively, in L1551 IRS 5, much hotter than those in L1551 NE. The gas motions in the spiral arms are characterized by rotation and expansion. Furthermore, the transitions from the CBD to the CSD rotations at around the L2 and L3 Lagrangian points and gas motions around the L1 point are identified. Our numerical simulations reproduce the observed two spiral arms and expanding gas motion as a result of gravitational torques from the binary, transitions from the CBD to the CSD rotations, and the gas motion around the L1 point. The higher temperature in L1551 IRS 5 likely reflects the inferred FU-Ori event.
=1 \fullcollaborationNameThe Friends of AASTeX Collaboration
1 Introduction
Binary and multiple stellar systems are ubiquitous in solar-type stars Duquennoy & Mayor (1991); Raghavan et al. (2010). Recent millimeter interferometric survey observations show that binaries are more frequent among protostellar sources (50) than main-sequence binaries Murillo et al. (2013); Chen et al. (2013); Reipurth et al. (2014); Tobin et al. (2016). Protostellar binary systems have been identified as two closely located dust-continuum sources, which are considered as circumstellar disks (hereafter CSDs) surrounding each protostar Looney et al. (1997); Rodríguez et al. (1998); Looney et al. (2000); Lim & Takakuwa (2006); Maury et al. (2010); Tobin et al. (2015, 2016); Lim et al. 2016a ; Lim et al. 2016b . Other disks surrounding both of the CSDs, circumbinary disks (CBDs), have also been identified Takakuwa et al. (2004, 2012); Tobin et al. (2013); Chou et al. (2014); Tang et al. (2014, 2016); Dutrey et al. (2014, 2016), which are considered to be mass reservoirs to the CSDs and protostellar binaries. Observational studies of the structures and gas motions of those CBDs and their comparisons among different protobinary systems are crucial to understand how protostellar binaries grow and how their final masses and mass ratios are determined.
The L1551 region Lynds (1962) is a low-mass star-forming region located to the south of the Taurus molecular cloud complex. The distance to the L1551 region has been adopted to be 140 pc Elias (1978), and a recent estimate of the distance is 1475 pc Connelley & Reipurth (2018)111For direct comparison with our previous publications, throughout this paper we adopt the distance = 140 pc.. It contains a famous Class I-II source with planet formation, HL Tau ALMA Partnership et al. (2015), and two Class I protostellar binaries of L1551 IRS 5 and NE and a Class II binary XZ Tau Hayashi & Pyo (2009). The two Class I protostellar binaries of L1551 IRS 5 and NE are located closely at a projected distance of 25 (0.10 pc), and L1551 NE is located northeast of L1551 IRS 5. We have conducted ALMA Cycles 0 and 2 observations of L1551 NE ( = 91 K and = 4.2 ; Froebrich, 2005) Takakuwa et al. (2014, 2017). L1551 NE comprises the southeastern source named “Source A” and the northwestern source “Source B” Reipurth et al. (2000, 2002); Lim et al. 2016b , where their projected and de-projected separations are estimated to be 70 au and 145 au, respectively Takakuwa et al. (2014). The total binary mass and the mass ratio () have been estimated to be 0.8 and 0.2, respectively Takakuwa et al. (2012). Our ALMA observations in the 0.9-mm dust-continuum emission at 02 resolution have identified two arm-like features in the 300 au scale CBD, as well as the CSDs associated with the individual binary stars. The southern arm connects to the CSD around Source B, and furthermore, the distribution of the material in the arms are skewed to the west, suggesting the presence of the mode. The gas motions in the CBD as observed in the C18O (3–2) emission exhibit expansion in the arms and infall in the inter-arm regions. Our hydrodynamic simulation shows that the gravitational torques from the non-axisymmetric potential of the binary induce both infall and outward gas motions with slower and faster rotations than the Keplerian rotations, respectively, and create the spiral density patterns Matsumoto et al. (2019). The observed spiral features with the mode and the infall and expanding gas motions in the CBDs of L1551 NE are well reproduced with our hydrodynamic simulation.
A next important step is to study a protostellar binary system with different physical properties, such as the binary mass ratio, separation, and temperature. In this paper, we report ALMA Cycle 4 Band 7 observations of the protostellar binary system in the L1551 region, L1551 IRS 5. L1551 IRS 5 is the brightest Class I protostellar source in the entire Taurus star-forming region ( = 22 and = 92 K; Froebrich, 2005). The binary protostellar system L1551 IRS 5 consists of two compact sources in the centimeter and millimeter continuum emission along the north-south direction with the projected and de-projected separations of 50 au and 54 au, respectively. Both of the binary sources (Source N and Source S) drive 3.5 cm radio jets at similar intensities along the southwest to the northeast direction Rodríguez et al. 2003b , and HH objects and high-velocity (100 km s-1) wind-angle winds are also associated Pyo et al. (2005); Hayashi & Pyo (2009). Interferometric observations of L1551 IRS 5 in (sub)millimeter molecular lines have found a 2500 au scale, rotating and infalling protostellar envelope elongated along the northwest to southeast direction and a Keplerian rotating CBD with the radius of 70 au embedded in the infalling envelope Ohashi et al. (1996); Saito et al. (1996); Momose et al. (1998); Takakuwa et al. (2004); Chou et al. (2014). The total binary mass and the mass ratio have been estimated to be 0.5 and 1, respectively Rodríguez et al. 2003a ; Takakuwa et al. (2004); Lim & Takakuwa (2006); Chou et al. (2014); Lim et al. 2016a . The latest ALMA imaging of L1551 IRS 5 in the 1.3-mm dust-continuum emission at an angular resolution of 014 has clearly separated the two CSDs and CBD, and resolved the CBD into a 100 au ringlike feature Cruz-Sáenz de Miera et al. (2019). From the presence of the first overtone CO absorption bands at 2.3 and the association of the HH objects, L1551 IRS 5 has been classified as one of the FU Orionis objects Herbig (1977); Hartmann & Kenyon (1985); Reipurth & Aspin (1997); Vorobyov & Basu (2006); Quanz et al. (2007); Connelley & Reipurth (2018), suggesting a warm environment in the protobinary system.
The structure of this paper is as follows. In Section 2 we describe our ALMA observations, data reduction, and imaging. The results of the 0.9-mm dust-continuum and molecular-line emission are presented in Section 3, in comparison with our previous results of L1551 NE. In Section 4 we introduce our numerical model and present detailed physical interpretations of the observed features. Section 5 summarizes our main results and discussion.
2 ALMA Observations
ALMA Cycle 4 observations of L1551 IRS 5 at Band 7 were conducted on 2017 July 27. The 0.9-mm dust-continuum emission and six submillimeter molecular lines listed in Table 1 were observed simultaneously. The total on-source integration time was 36 minutes. Table 2 summarizes the observational parameters. The precipitable water in the atmosphere ranged from 0.40 mm to 0.46 mm, which was excellent for Band 7 observations. The C40-5/(7) configuration was adopted, and the projected baseline length on the source was from 15.4 m to 3.4 km. This minimum projected baseline length indicates that for a Gaussian emission distribution with an FWHM of 96 ( 1300 au), the peak flux density recovered is 10 of the peak flux density of the Gaussian Wilner & Welch (1994). In its Frequency Division Mode (FDM), the correlator was configured to cover four independent frequency ranges (basebands), and each baseband has one spectral window (spw). Each spw has a bandwidth of 468.75 MHz and 3840 spectral channels. Hanning smoothing was applied to the spectral channels, resulting in a frequency resolution of 244.14 kHz and thus a velocity resolution of 0.22 km s-1 for the C18O line. Spws 0, 1, and 3 cover the 13CO (3–2), C18O (3–2), and CS (7–6) emission, respectively. Spw 2 includes the OCS (28–27), HC18O+ (4–3), and SO (78–67) emission.
The raw visibility data was calibrated by the ALMA observatory through the pipeline using the CASA (Common Astronomy Software Applications) version 5.1.1. The flux, passband, and gain calibrators are quasars listed in Table 2 with their estimated flux densities. The accuracy of the absolute flux calibration of ALMA Band 7 observations is 10 222https://almascience.nao.ac.jp/documents-and-tools/cycle8/alma-proposers-guide. We also independently checked the calibrated visibility data and confirmed that the pipeline calibration was fine. Line-free channels in all the four spectral windows were used to create the continuum image, which has a central frequency of 336.11 GHz (= 0.892 mm) and a total bandwidth of 1.675 GHz. For the continuum imaging, uniform weighting of the visibility data and multi-scale clean with multiscale=[0,4,20] and cell=’0.02arcsec’ were adopted, and phase-only self-calibration was applied. The first iteration of the self-calibration with a solution interval of 120 seconds achieved a 20 reduction of the noise, and after the self-calibration the spiral features emerged clearly (Figure 1). The second iteration of the phase-only self-calibration with a solution interval of 30 seconds, or the phase and amplitude self-calibration with the same interval, did not improve the image quality and the noise, and thus we adopt the continuum image after the first self-calibration. The phase-only calibration table was applied to the line visibility data after the continuum subtraction. Natural weighting and multi-scale clean with multiscale=[0,5,25] and cell=’0.02arcsec’ were adopted to produce the line images. The resultant angular resolutions and rms noise levels in the images are summarized in Table 2.
Conversion from the observed intensity (Jy beam-1) to the brightness temperature (K) is expressed as
| (1) |
where is the frequency, speed of light, and the Boltzmann constant. The calculated conversion factors from to are also listed in Table 2. In this paper results are shown in the unit of , to discuss the observed physical conditions.
| Molecule | Transition | Frequency | a,ba,bfootnotemark: | b,cb,cfootnotemark: | b,db,dfootnotemark: |
|---|---|---|---|---|---|
| (GHz) | (K) | (s-1) | (cm-3) | ||
| C18O | =3–2 | 329.3305453 | 31.6 | 2.210-6 | 3.3104 |
| 13CO | =3–2 | 330.587965 | 31.7 | 2.210-6 | 3.3104 |
| OCS | =28–27 | 340.449273 | 237.0 | 1.210-4 | 1.6106 |
| HC18O+ | =4–3 | 340.630700 | 40.9 | 3.110-3 | 7.8106 |
| SO | =78–67 | 340.714160 | 81.2 | 5.010-4 | 7.3106 |
| CS | =7–6 | 342.882857 | 65.8 | 8.410-4 | 1.5107 |
| Parameter | Value |
|---|---|
| Observing date | 2017 Jul. 27 |
| Number of antennas | 40 |
| Field Center | (04h31m3414, 1808051) (J2000) |
| Primary beam HPBW | 18 |
| Central Frequency (Continuum) | 336.107 GHz (0.89 mm) |
| Bandwidth (Continuum) | 1.675 GHz |
| Frequency resolution (C18O) | 244.14 kHz 0.22 km s-1 |
| Synthesized beam HPBW (Continuum; Uniform) | 0078800652 (P.A. = 71.7) |
| Synthesized beam HPBW (C18O; Natural) | 01160114 (P.A. = 22.1) |
| Projected baseline coverage | 15.4 m - 3.4 km |
| Conversion Factor (Continuum) | 1 (Jy beam-1) = 2104.2 (K) |
| Conversion Factor (C18O) | 1 (Jy beam-1) = 852.8 (K) |
| System temperature | 100 - 350 K |
| rms noise level (Continuum) | 0.32 mJy beam-1 = 0.67 K |
| rms noise level (C18O) | 5.3 mJy beam-1 = 4.5 K |
| Flux calibrator | J0423-0120 (0.66 Jy) |
| Passband calibrator | J0510+180 (1.08 Jy) |
| Gain calibrator | J0440+1437 (0.19 Jy), J0431+1731 (0.09 Jy) |
3 Results
3.1 0.9-mm Dust-Continuum Emission
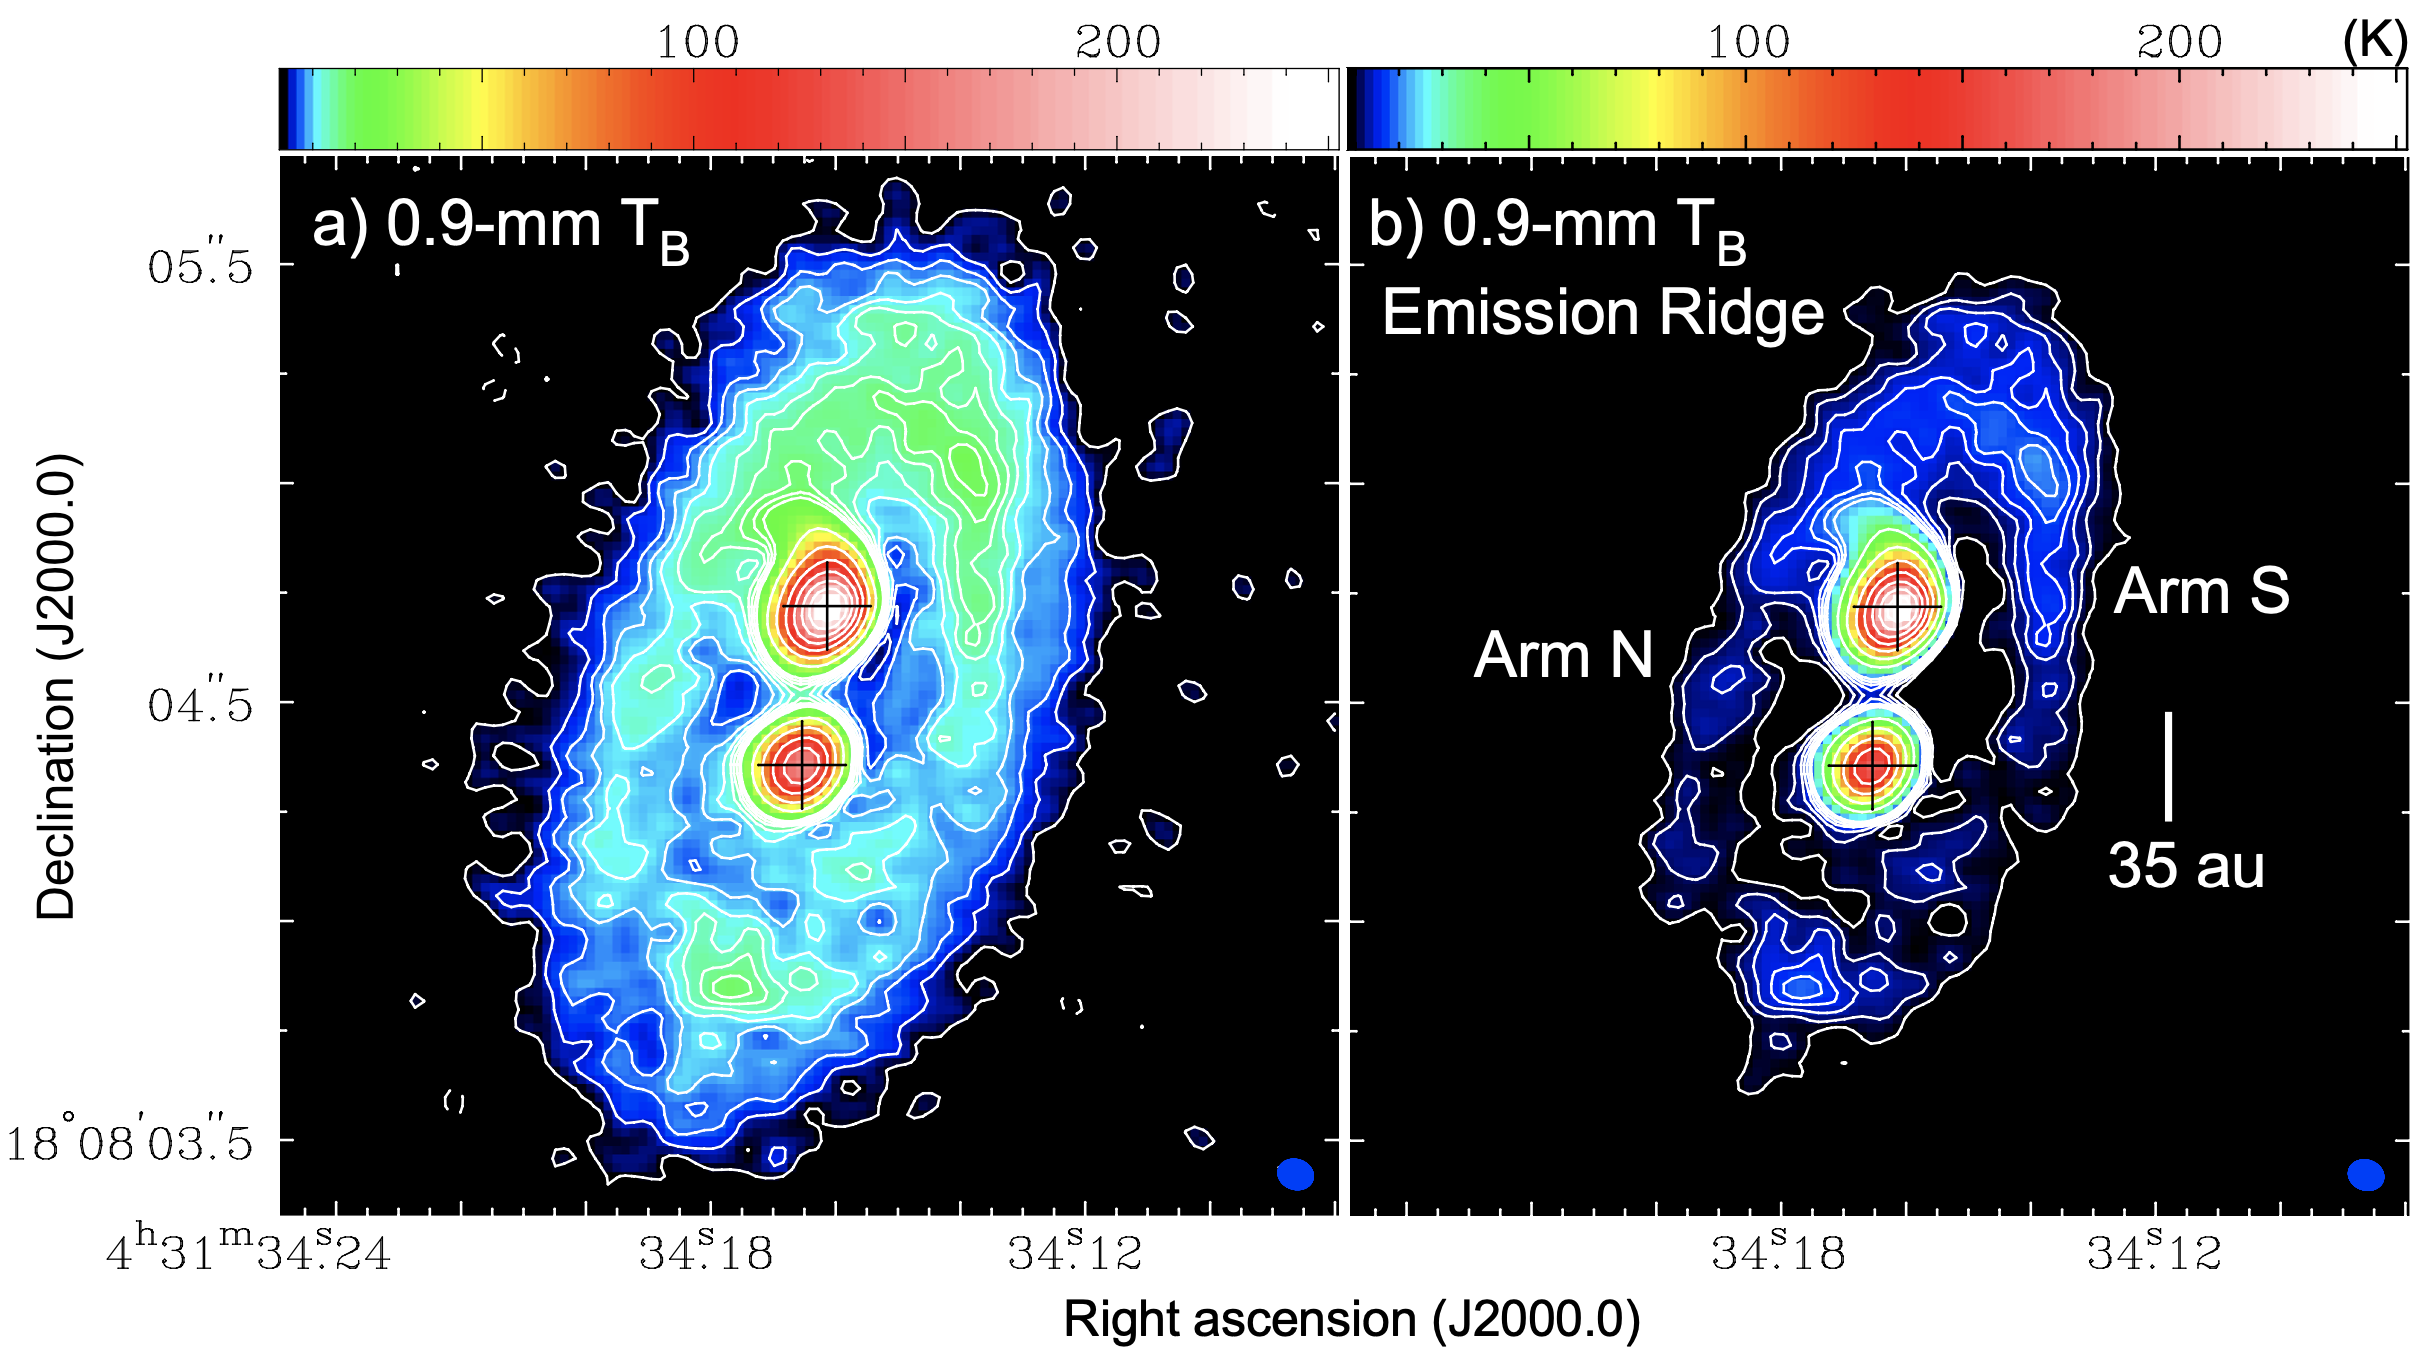
Figure 1 presents the ALMA Cycle 4 image of L1551 IRS 5 in the 0.9-mm dust-continuum emission with uniform weighting providing an angular resolution of 00790065 (P.A. = 72). In Figure 1a the overall extent of the continuum emission is shown with the lowest contour level of 3, while in Figure 1b the lowest contour level is raised to 12 to show the structure of the emission ridge more clearly. Two bright components located to the north and south are seen, which most likely trace CSDs around Source N and Source S, respectively. The peak brightness temperature toward Source N exceeds 260 K and that toward Source S 160 K. Previous 7-mm observations of L1551 IRS 5 with JVLA at a higher angular resolution (00560053; P.A. = -1.7) show even higher peak brightness temperatures, 320 K and 270 K toward Source N and Source S, respectively Lim & Takakuwa (2006); Lim et al. 2016a . These results indicate that the CSDs around the binary protostars, in particular Source N, are hot, and it is likely that the dust-continuum emission originated from those CSDs is optically thick. From the 2-dimensional Gaussian fittings, the centroid positions of the 0.9-mm dust-continuum emission are (04h31m34161, +180804722) toward Source N and (04h31m34165, +180804359) toward Source S, which are regarded as the positions of the relevant sources. The binary protostars in L1551 IRS 5 are known to exhibit a relative proper motion originated from the binary orbital motion Rodríguez et al. 2003a ; Lim & Takakuwa (2006); Lim et al. 2016a . To compare the locations of the binary as observed with ALMA in 2017 to those from the previous measurements without a possible uncertainty of the sky proper motion and the absolute astrometry, the relative position of Source S with respect to Source N (dRA, dDec) = (0057,-0363) is adopted. As compared to the relative position derived from the VLA 7-mm observations of L1551 IRS 5 made in 2012 Lim et al. 2016a , the shift from 2012 to 2017 is measured to be (0028,-0007). The 30 mas shift in RA over the five years is significant as compared to the ALMA and JVLA beam sizes over the S/N, and Source S has moved eastward over the five years. The relative position in 2017 is indeed consistent with the global trend of the orbital motion starting from 1983 (see Figure 6 of Lim et al. 2016a, ). In particular, in 1983 Source N is located more eastward than Source S Rodríguez et al. 2003a , in 1997 Source N and Source S are located perfectly north-south Rodríguez et al. (1998), and in 2012-2017 Source S is moving eastward with respect to Source N. These results demonstrate the presence of the clockwise orbital motion of the binary, which is consistent with the rotational direction of the CBD Takakuwa et al. (2004); Chou et al. (2014).
The beam-deconvolved sizes of the CSDs around Source N and Source S are measured to be 0175 0123 (25 au 17 au) (P.A.=1605) and 0143 0109 (20 au 15 au) (P.A.150; not well-constrained), respectively. The JVLA 7-mm observations of L1551 IRS 5 show that the size of the CSDs around Source N and Source S are 16 au 8 au (P.A.=1653) and 18 au 10 au (P.A.=1585), respectively Lim & Takakuwa (2006); Lim et al. 2016a . The sizes of the CSDs as seen in the 0.9-mm emission are slightly larger than those in the 7-mm emission, which could be attributed to the different dust emissivity at the different wavelengths. The measured CSD position angle of 160 is consistent with that of the large-scale (2500 au) protostellar envelope Momose et al. (1998), and that of the CBD derived from our previous SMA observations of L1551 IRS 5 Chou et al. (2014). The de-projected binary separation is estimated to be 54 au, and the truncation of the CSDs caused by the tidal interaction of the binary should limit the CSD diameter to be within one half of the separation Bate (2000). The measured CSD sizes are within this limit.
As well as the two bright CSD components at the center, there is an emission component surrounding these CSDs, the CBD. The outermost extent of the CBD is 150 au (Figure 1a). As a whole, the emission elongation of the CBD appears to be consistent with the position angle of 160 as described above, although it is not straightforward to measure the position angle of the CBD because of its internal structures. The aspect ratio of the major and minor axes at the 3 level is measured to be 2, suggesting an inclination angle of the CBD of 60. This inclination angle is also consistent with that of the protostellar envelope Momose et al. (1998) and the JVLA images. The aspect ratios of the CSDs as seen in the 0.9-mm continuum emission are, however, smaller, which could be due to the imperfect separation between the CSD and CBD components at 0.9-mm. Throughout this paper, disk position and inclination angles of 160 and 60, and the co-planar configuration of the CBD and CSDs, are assumed. In the CBD, there is an arm-like feature starting from a northeastern emission protrusion of the CSD toward Source N (see Figure 1b). This arm curls from east to south. Hereafter in this paper this arm is called as “Arm N”. Another arm-like feature starting from the southwest of Source S and extending to the north is seen (“Arm S”). While this arm appears to merge with the emission protrusion from the CSD toward Source N, we regard that the starting point of this arm is from Source S, and that the starting point of Arm N is from Source N. This interpretation is consistent with the clockwise rotation of the CBD Takakuwa et al. (2004); Chou et al. (2014) and the binary orbital motion described above. With our higher-resolution observations coupled with the self-calibration, the ringlike CBD previously identified by Cruz-Sáenz de Miera et al., 2019 has been resolved into two spiral arms.
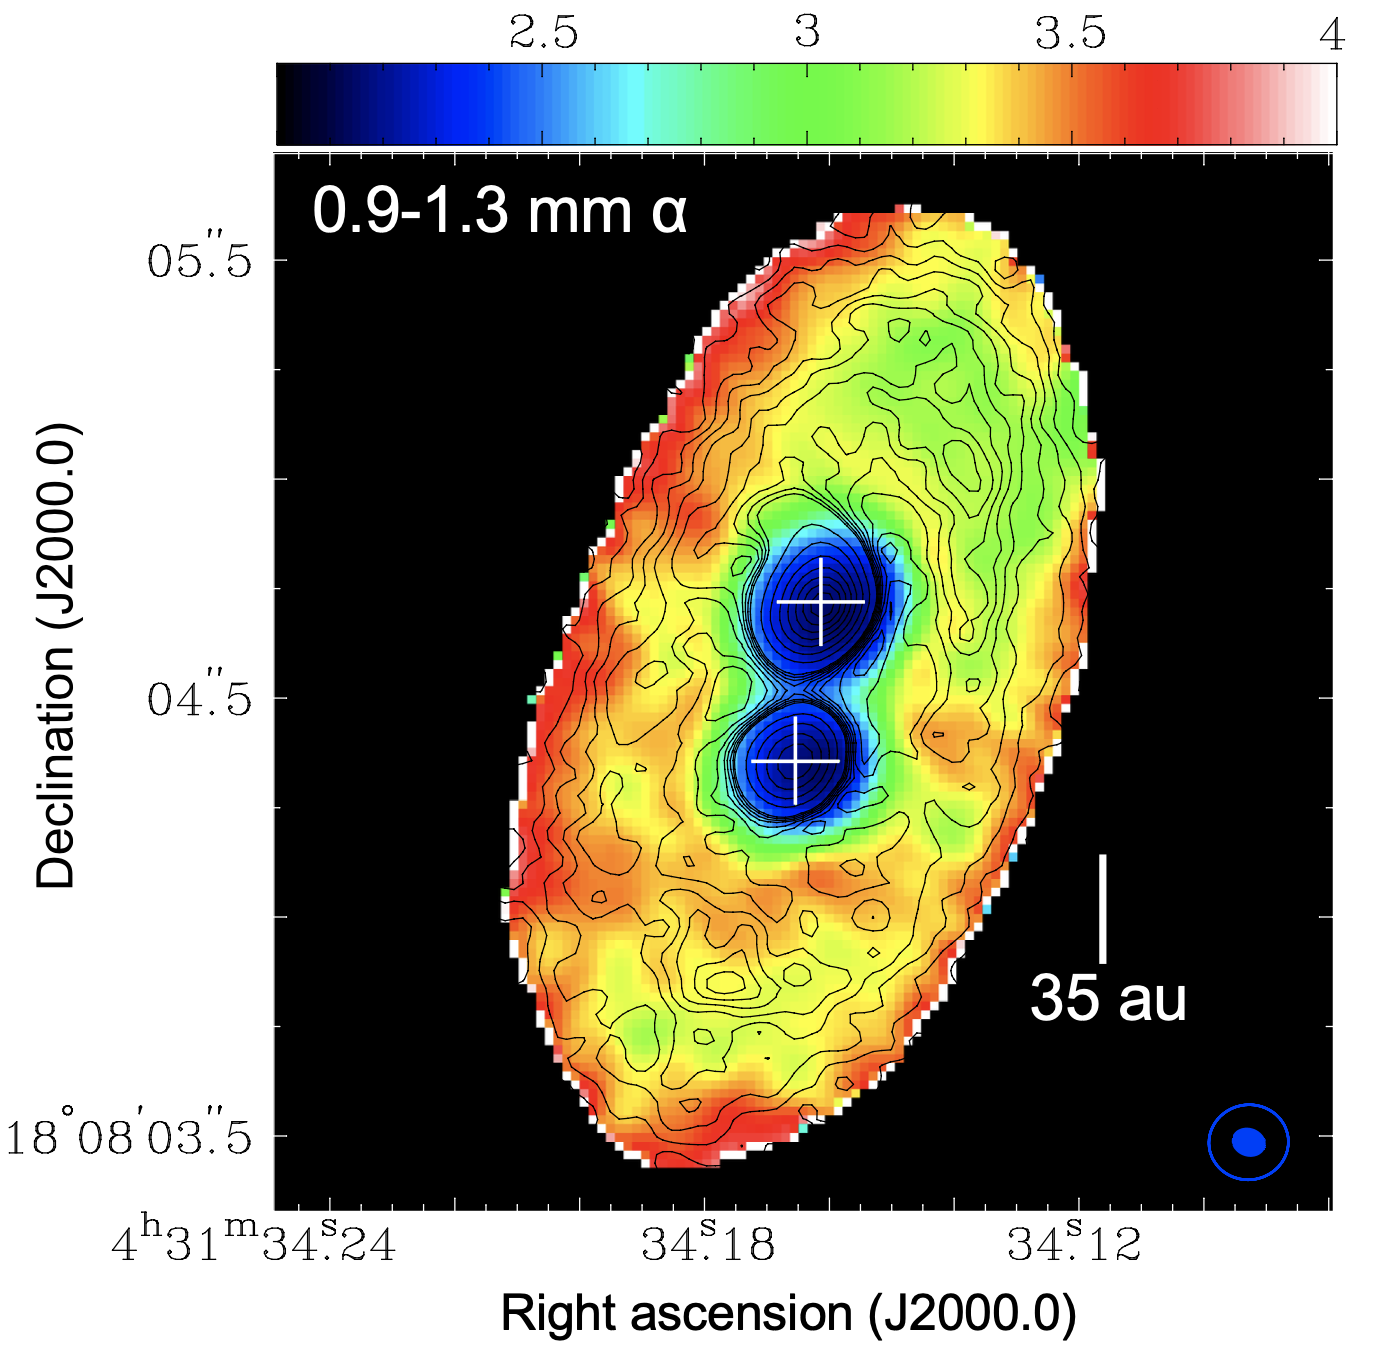
The peak brightness temperatures toward the northwestern and southern peaks in the CBD are 20 K and 18 K, respectively, and the typical brightness temperature in the CBD is 15 K. As will be discussed in the next subsection, the peak gas temperature of the CBD is likely as high as 100 K. The 0.9-mm dust-continuum emission in the CBD is thus likely optically thin. Figure 2 shows the map of the spectral index of the dust emission deduced from the present 0.9-mm and the published 1.3-mm data Cruz-Sáenz de Miera et al. (2019). To make this map the 1.3-mm map is corrected for the positional shift originated from the sky proper motion, and the 0.9-mm map is convolved to have the same beam size as that of the 1.3-mm map (018 017; P.A.=-83). The spectral-index map is made within the pixels where the image intensities at both wavelengths are above 10. On the assumption of the 10 absolute flux uncertainties at both wavelengths, the uncertainty of is dominated by the absolute flux uncertainties, and it is calculated to be 0.5. The value in the CBD is 3.0 - 3.7, while that in the CSDs is as low as 2. The difference of between the CBD and CSDs, and the difference between the higher value (3.8) in the outer part of the CBD and the lower value in the inner parts (3.2) are probably real. These results are consistent with our interpretation that the dust emission toward the CSDs and CBD are optically thick and thin, respectively.
The mass of the CBD () can be estimated from the 0.9-mm continuum flux density () with the conventional formula as
| (2) |
In the above expression denotes the distance, the Planck function for dust at a temperature , and the dust opacity per unit gas + dust mass on the assumption of a gas-to-dust mass ratio of 100. Assuming = (/)β, =0.1 cm2 g-1 Hildebrand (1983), and (= - 2) =1.0 (Figure 2), is calculated to be 0.028 cm2 g-1. With this mass opacity and = 30 – 100 K, the flux density originated from the CBD ( = 1.40 Jy) gives the disk mass of 0.015 – 0.060 . If the mass opacity by Ossenkopf & Henning, 1994 for grains with thin ice mantles coagulated at a density of 106 cm-3 ( = 0.018 cm2 g-1) is adopted, the mass estimate of the CBD becomes 60 higher. In either case, the CBD mass is likely much smaller than the inferred total binary mass of 0.5 Chou et al. (2014), and thus the self-gravity of the CBD can be ignored compared to the gravitational field of the binary protostars.
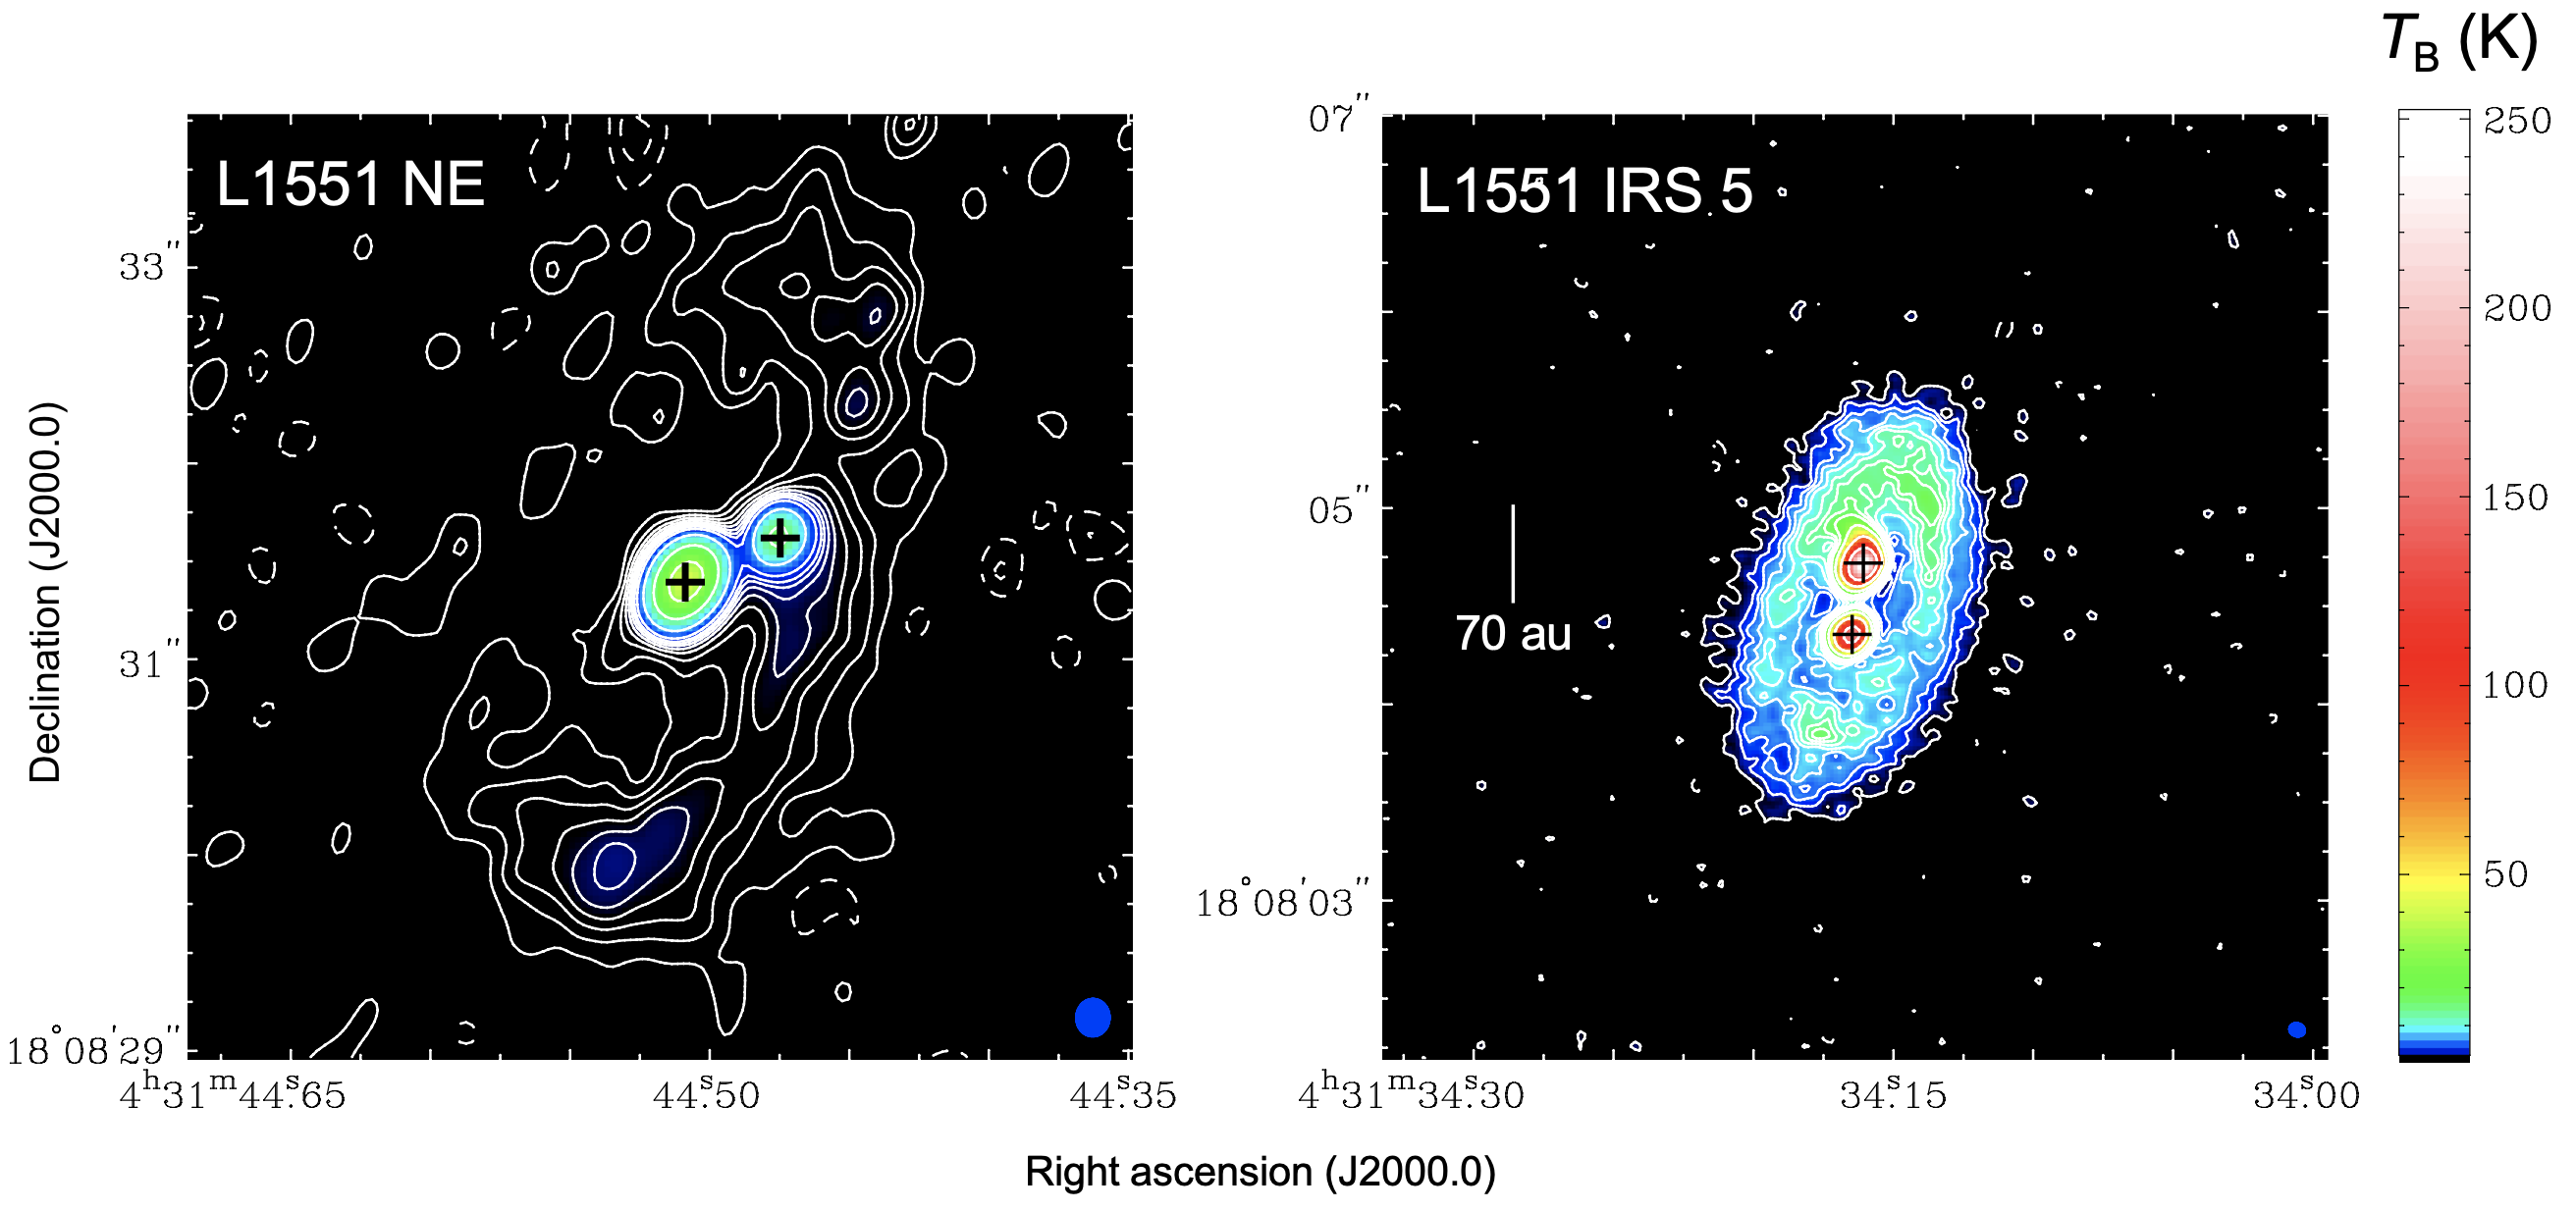
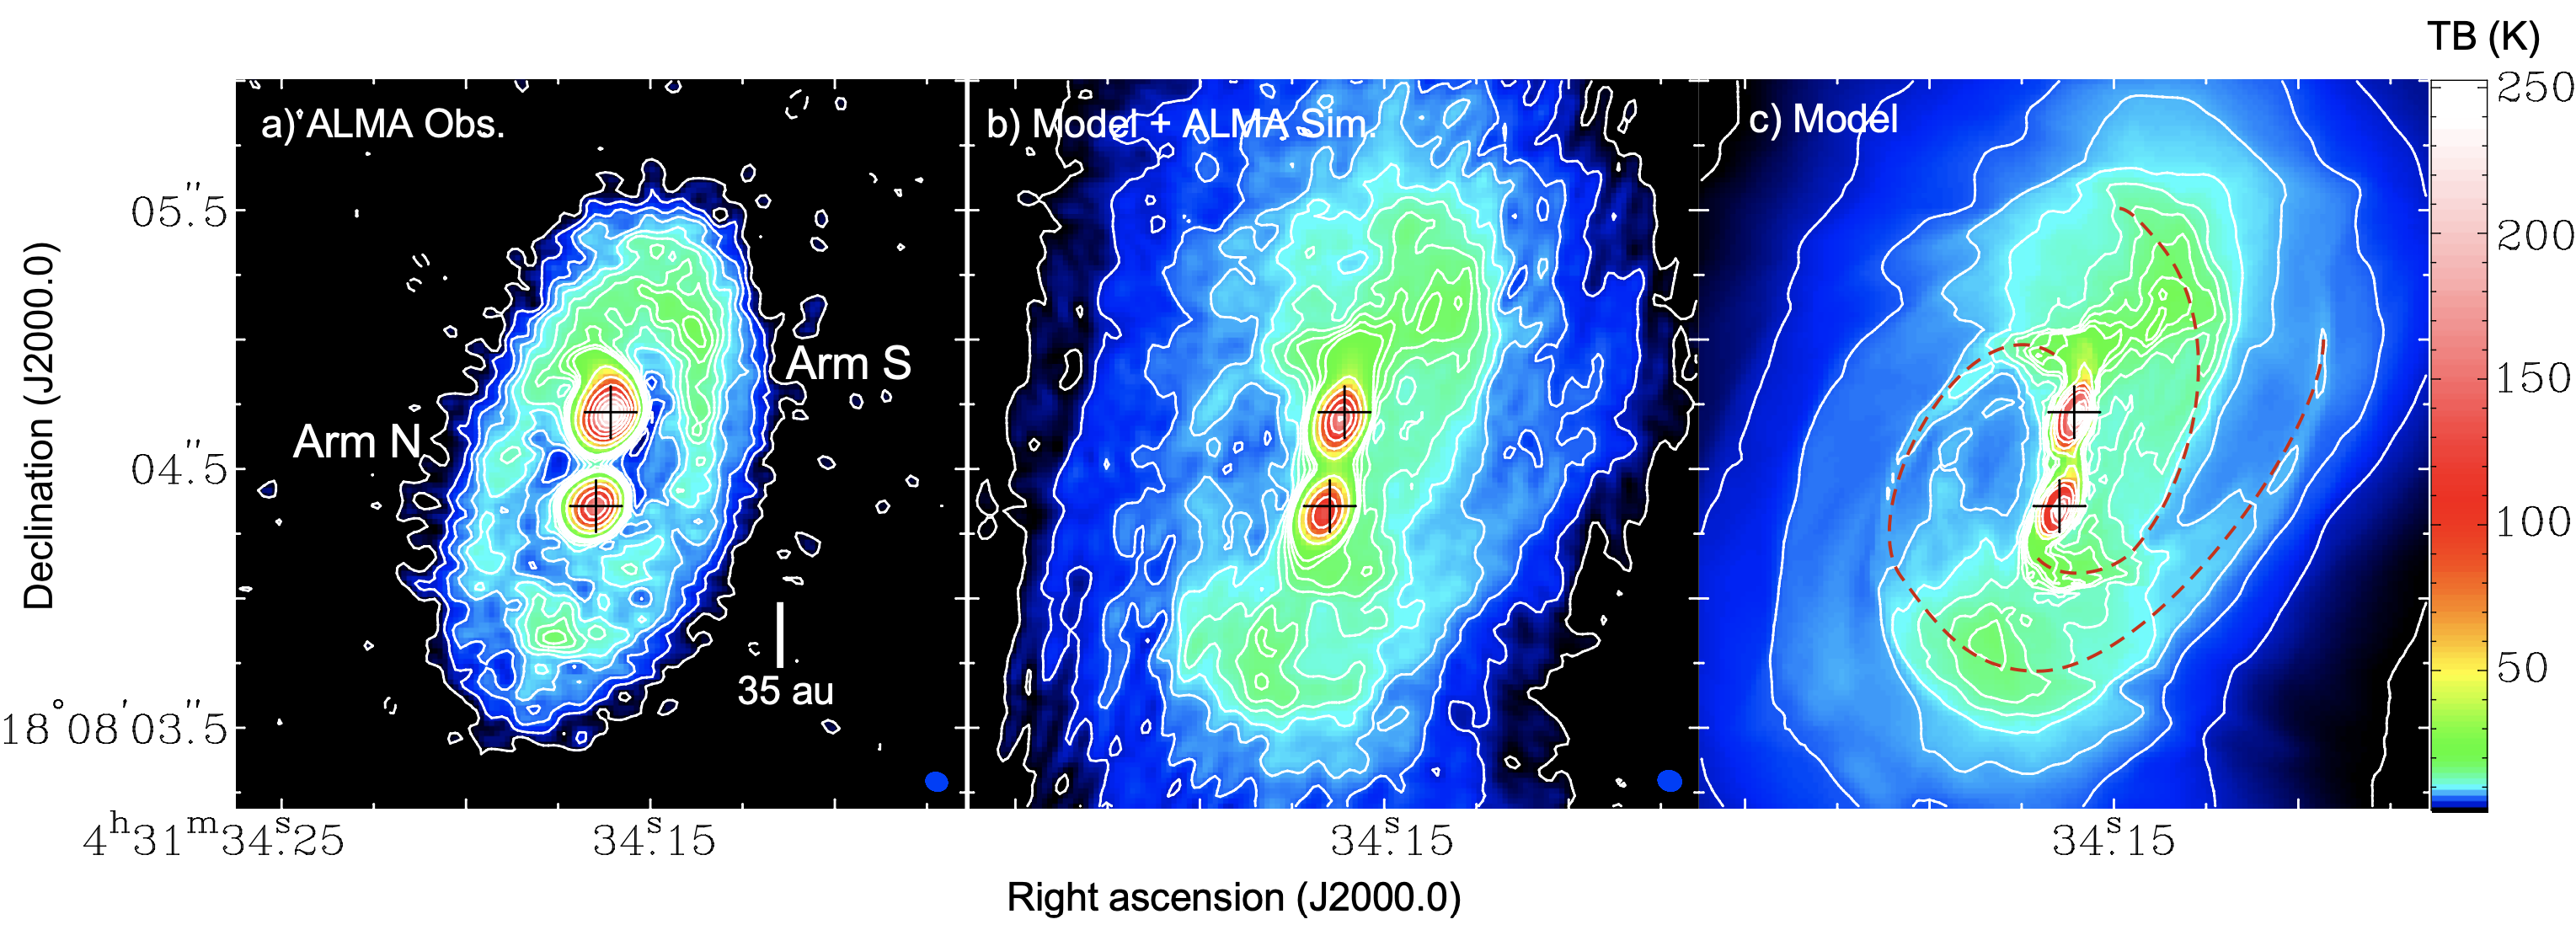
Figure 3 compares the ALMA 0.9-mm dust-continuum images of L1551 NE (left; Takakuwa et al., 2017) and L1551 IRS 5 (right). While both of the CBDs exhibit two spiral arms, there are three intriguing differences between the two CBDs: the size, structure, and the brightness. The outermost radius of the CBD in L1551 IRS 5 is half of that in L1551 NE. Our Cycle 4 observations of L1551 IRS 5 should be able to recover the emission components as large as 10 (see Section 2). The compact size of the CBD in L1551 IRS 5 (2) is thus not due to the interferometric filtering effect. The brightness temperatures of the CSDs and CBD in L1551 IRS 5 are much higher than those in L1551 NE. In L1551 NE, the peak brightness temperatures of the CSDs toward Source A and Source B are 42 K and 18 K, respectively, which are a factor of 6 lower than that toward Source N in L1551 IRS 5. The peak brightness temperature of the CBD in L1551 NE is 3 K, a factor of 6 lower than that in L1551 IRS 5. Furthermore, the emission distribution in the CBD around L1551 NE is skewed to the west and exhibits = 1 mode. Such a mode is much less clear in the CBD around L1551 IRS 5. These differences are likely to reflect differences of the physical conditions between the two protostellar binaries, which will be discussed in Section 4.
3.2 Molecular-Line Emission
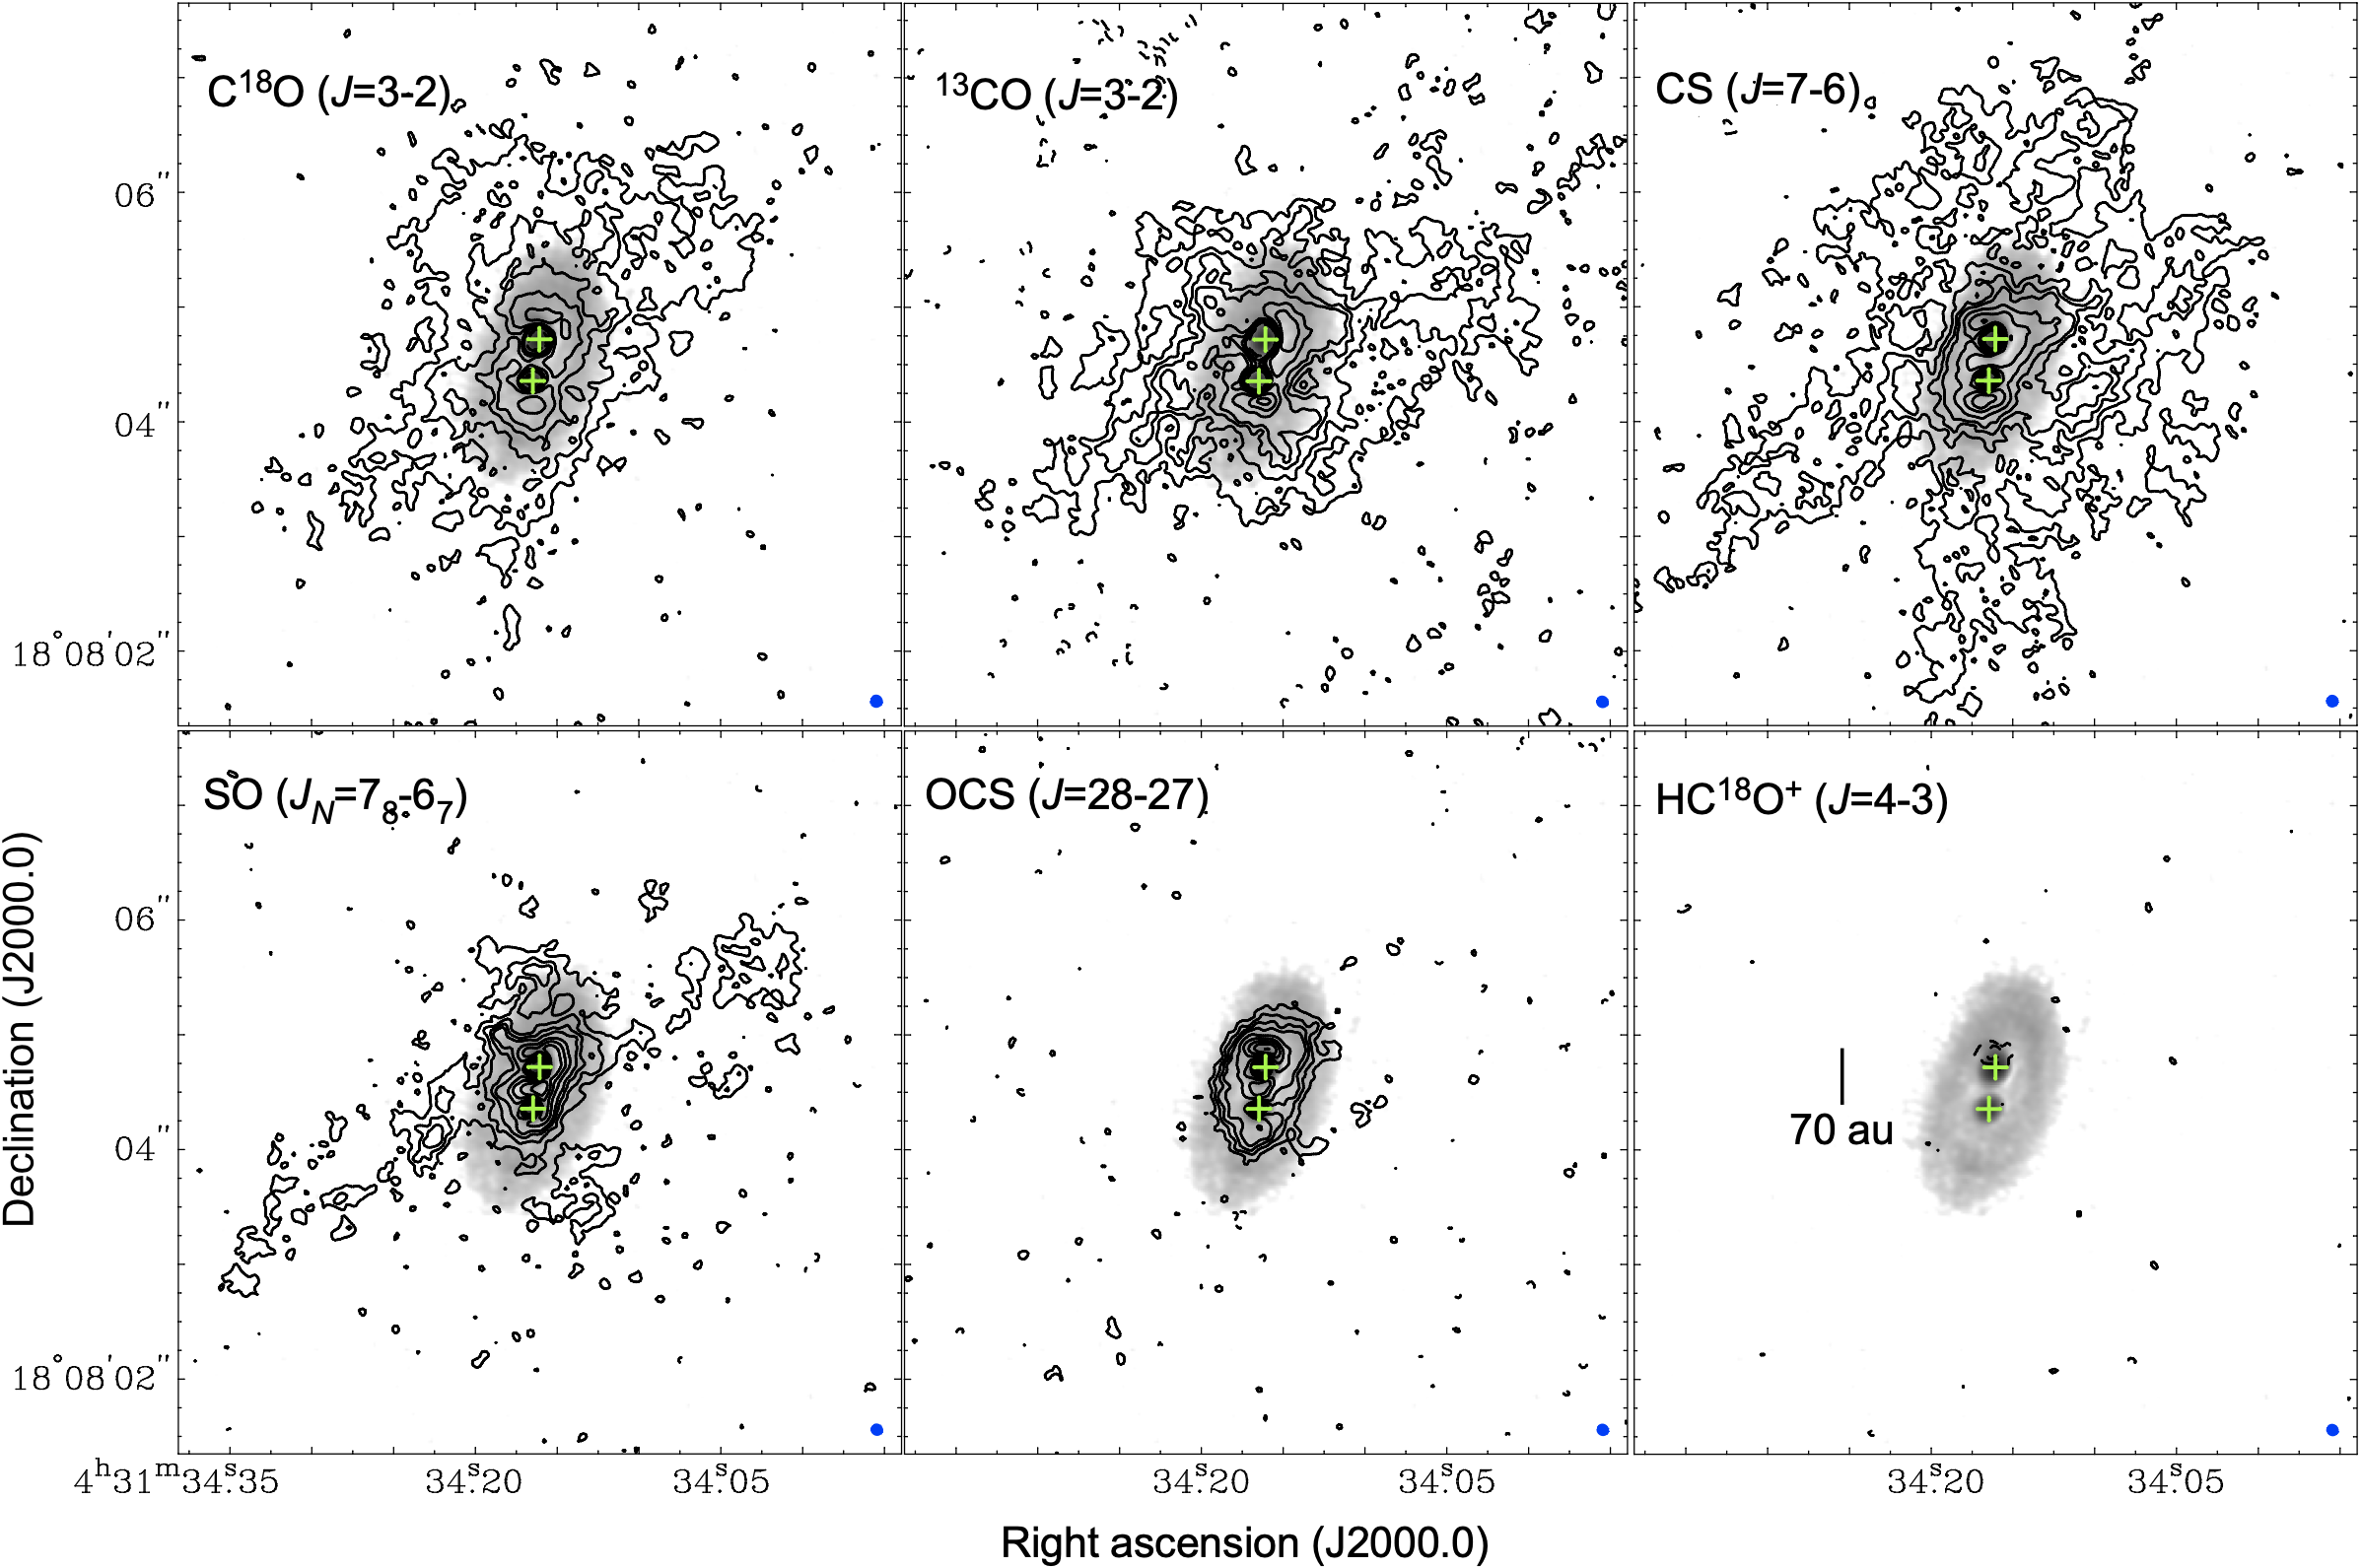
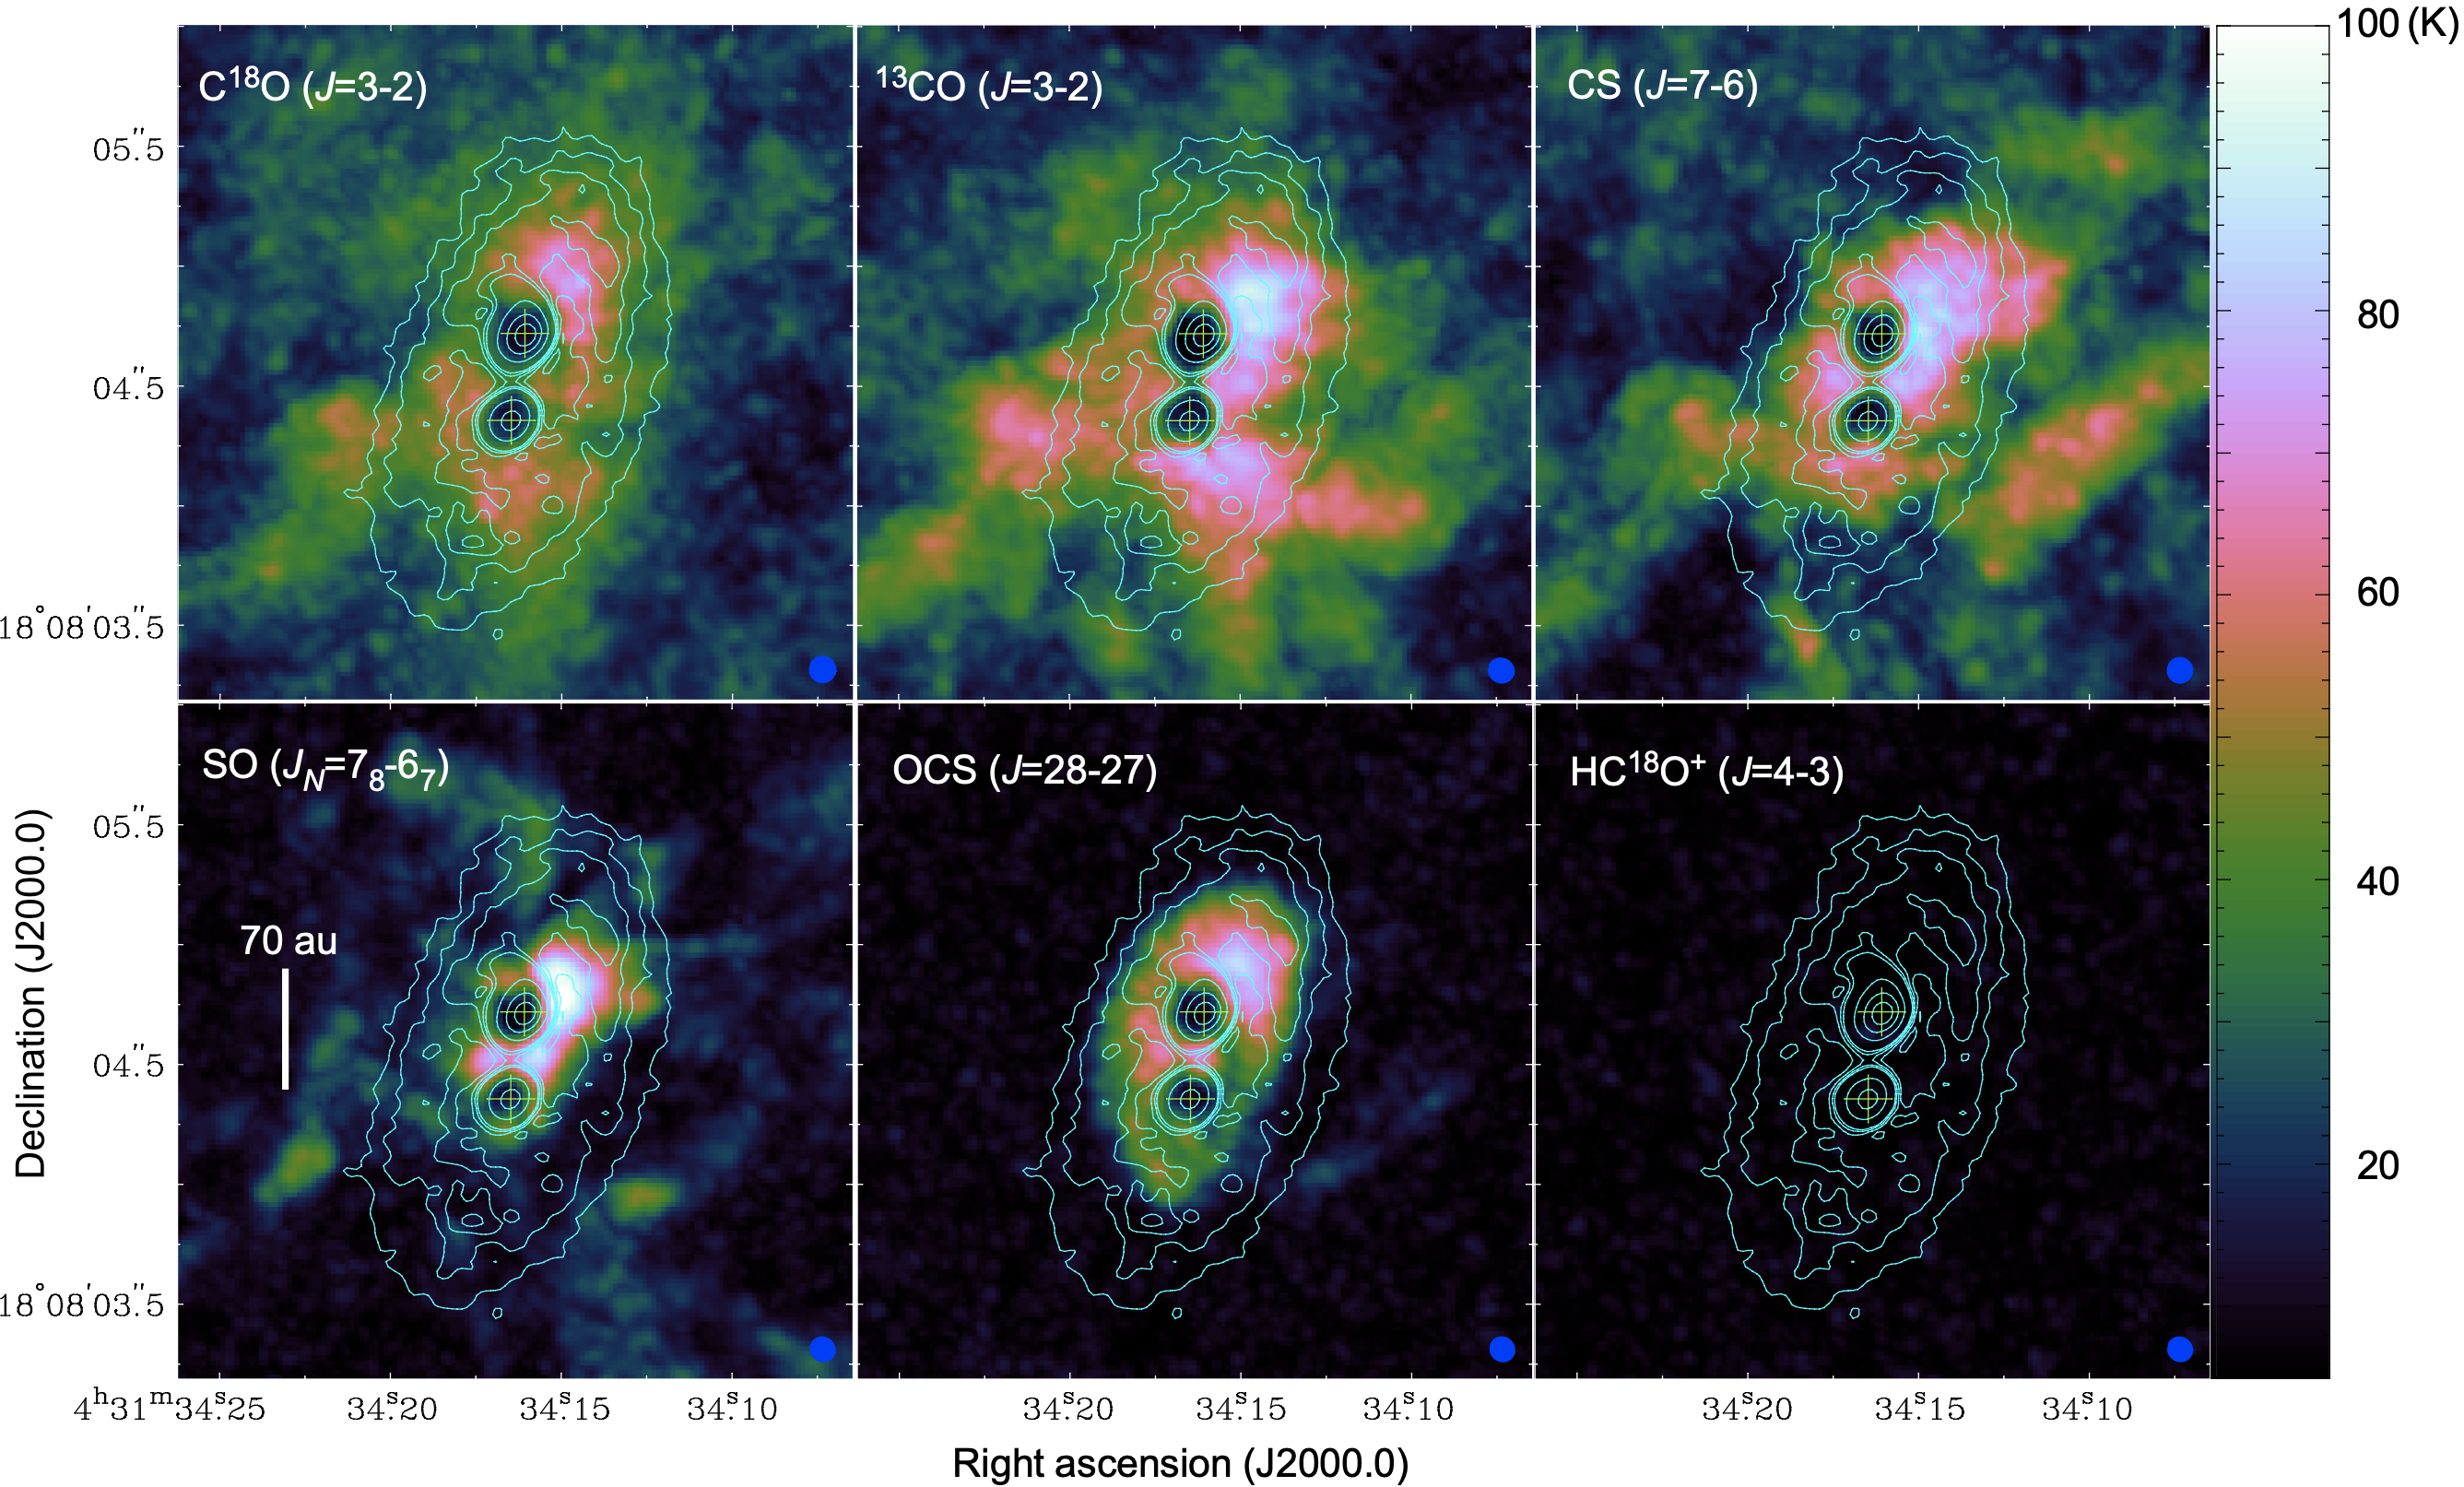
Figure 4 presents the moment 0 maps of the observed molecular lines summarized in Table 1 (contours), superimposed on the 0.9-mm dust-continuum image (gray scale), in L1551 IRS 5. The C18O (3–2) emission appears to trace the overall structure of the gas component originated from the CBD, as well as emission extensions toward the northwest and northeast. In the 13CO (3–2), CS (7–6), and SO (78–67) emission, there are elongated emission components to the northwest, northeast, southeast, and the southwest, as well as the molecular-gas component associated with the CBD. In L1551 IRS 5, molecular outflows with a wide opening angle have been observed, and the blueshifted outflow is located to the southwest and the redshifted outflow to the northeast Snell et al. (1980); Uchida et al. (1987); Stojimirović et al. (2006); Moriarty-Schieven et al. (2006). The identified emission extensions are likely to trace the cavity wall of the outflow or the interacting surface between the protostellar envelope and the outflow.
Figure 4 also shows that the OCS (28–27) emission, with the upper-state energy of the rotational level of 237 K, is strongly detected in L1551 IRS 5, which is not detected in L1551 NE. The emission extent of the OCS emission is more compact than that of the dust-continuum emission. These results suggest that the OCS emission traces the gas components in the inner, hotter part of the CBD around L1551 IRS 5. On the other hand, the HC18O+ (4–3) emission is not detected in L1551 IRS 5 or L1551 NE. Because of the intense 0.9-mm dust continuum emission toward the CSDs in L1551 IRS 5, all the molecular lines show negative intensities toward the CSDs.
Figure 5 presents maps of the peak brightness temperatures of the observed molecular spectra (moment -2 maps in Miriad or moment 8 maps in CASA) in L1551 IRS 5. The peak values in the C18O, 13CO, CS, SO, and OCS maps are 78, 92, 88, 106, and 86 K, respectively, located to the northwest of Source N. In the case of the thermal emission the observed brightness temperatures should be the lower limit of the gas kinetic temperature, and these results indicate that the gas kinetic temperature in the CBD exceeds 100 K. Overall, the western side of Source N in the CBD is brighter than the eastern part. As the blueshifted molecular outflow is located to the west, the western side corresponds to the surface of the CBD irradiated directly from the radiation from Source N. The brightness temperature of the 0.9-mm continuum emission in the CSD associated with Source N exceeds 260 K, higher than that in Source S (160 K). The bright molecular-line emission to the west of Source N likely reflects the warm surface of the CBD irradiated from the intense radiation from Source N.
Hereafter in this paper, the C18O (3–2) and OCS (28–27) emission will be adopted to investigate the gas motion in the CBD, as these molecular emission appear to be the least affected by the associated molecular outflows.
3.3 Velocity Structures Traced by the C18O and OCS Emission
In this subsection velocity structures of L1551 IRS 5 as traced by the C18O and OCS emission are presented. From the symmetric center of the velocity features identified in our Cycle 4 observations (see below), the systemic velocity of = 6.4 km s-1 is adopted, which is comparable to previous estimates Fridlund et al. (2002); Takakuwa & Kamazaki (2011).
3.3.1 Velocity Channel Maps
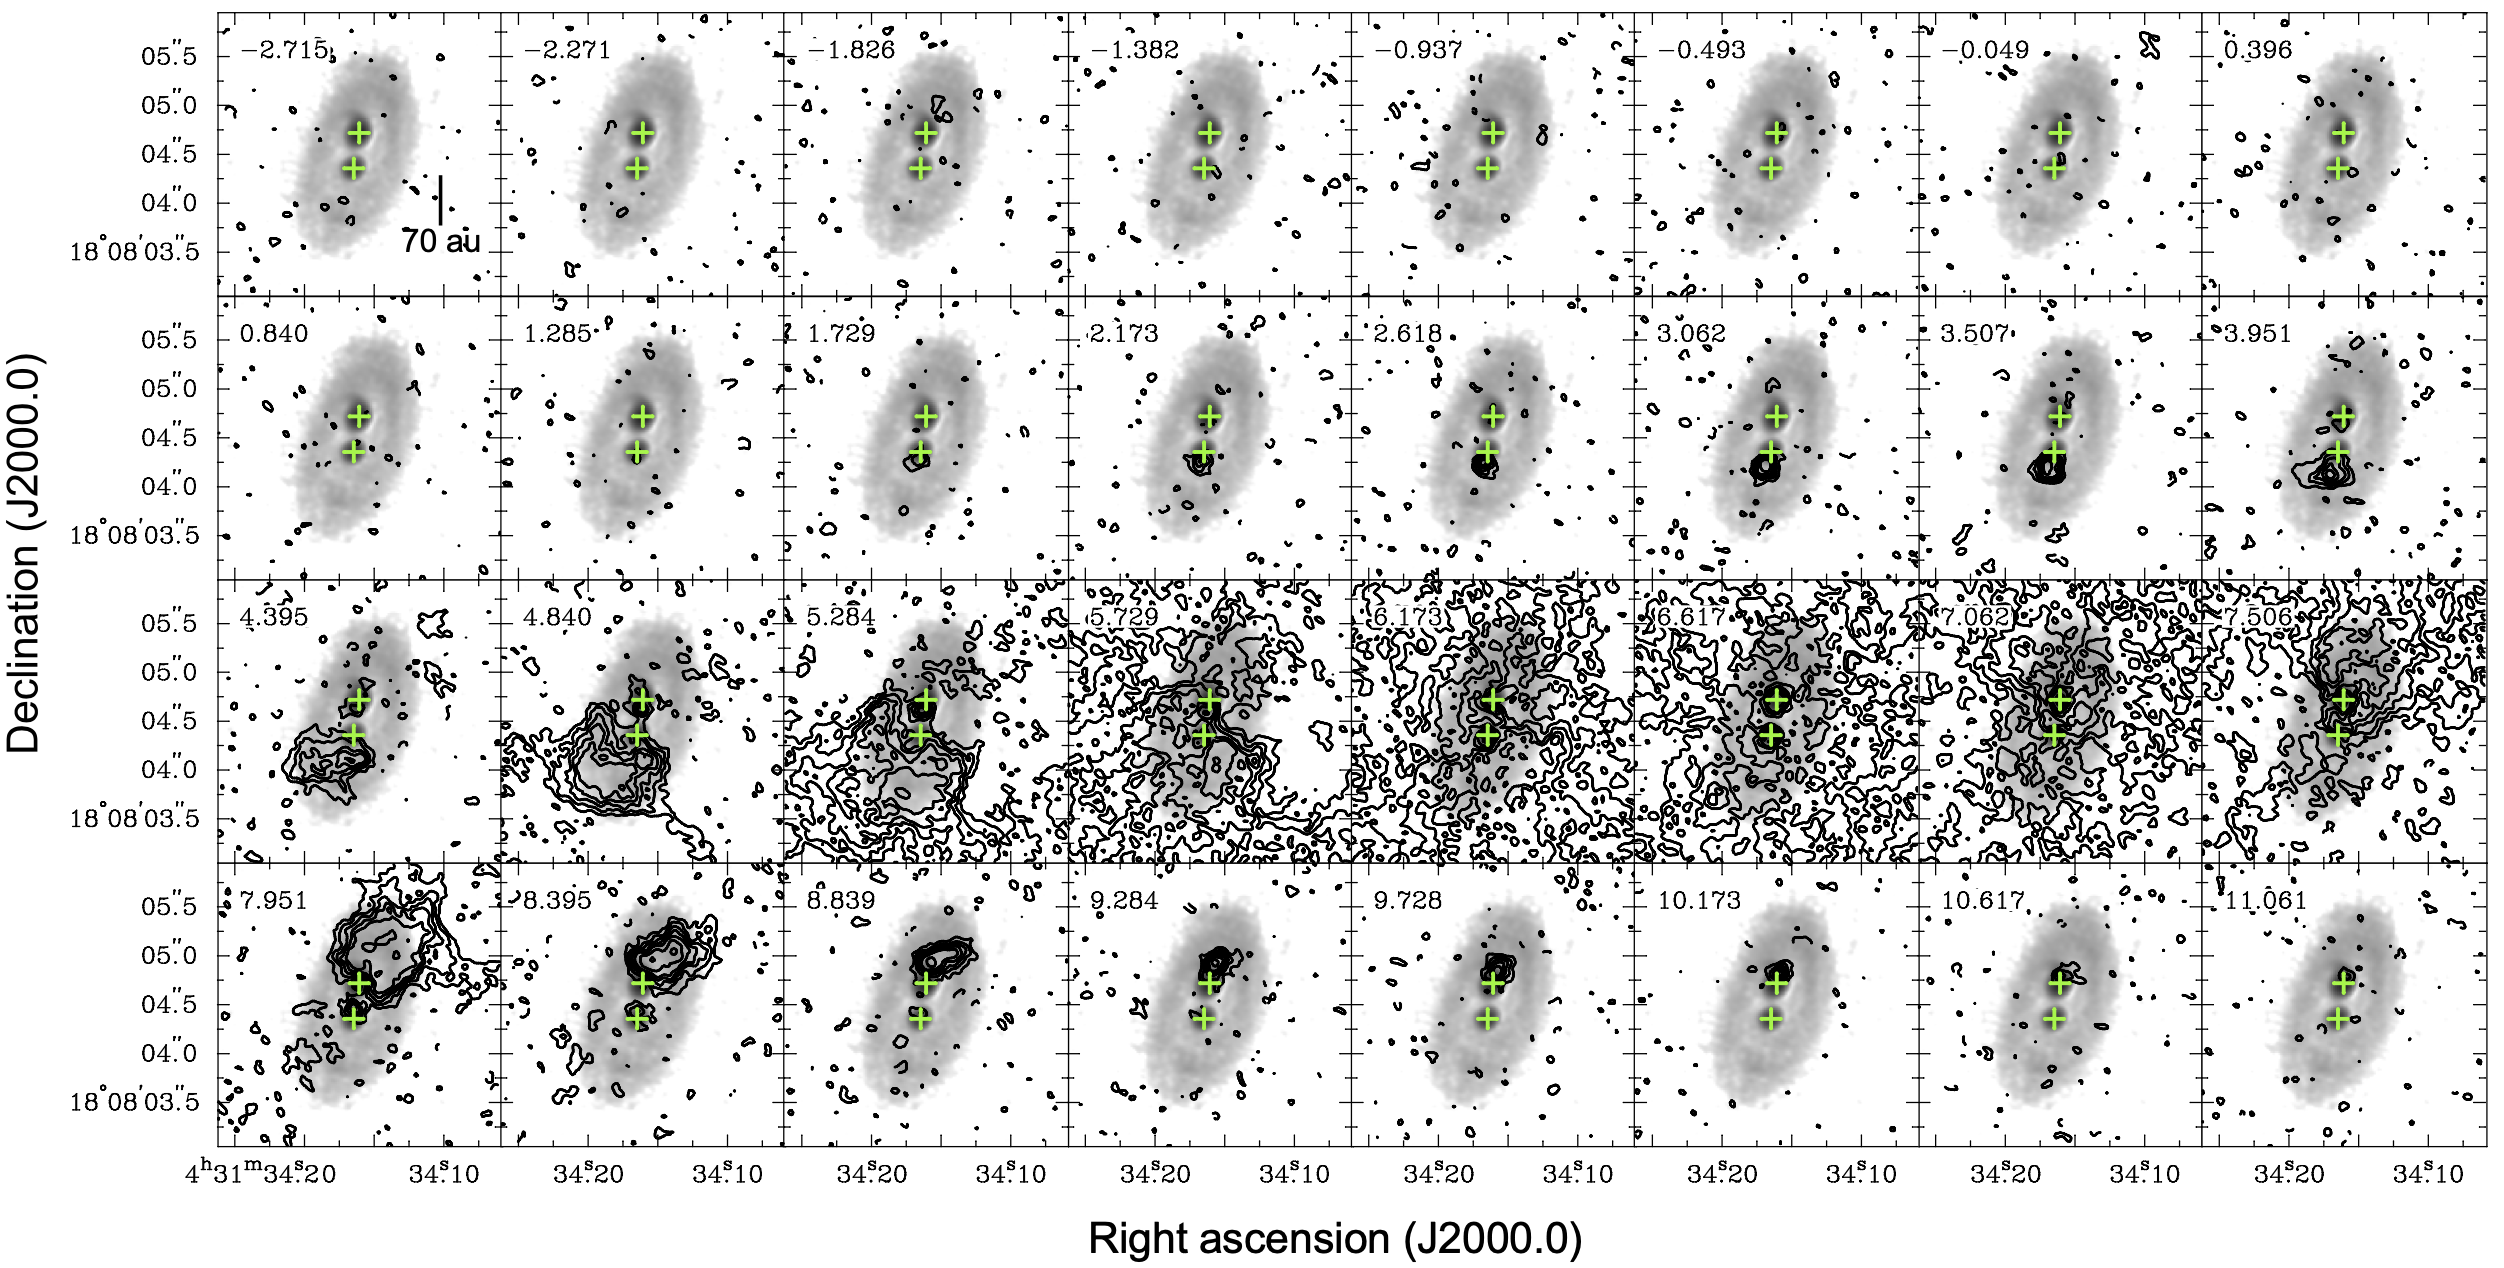
Figure 6 shows the velocity channel maps of the C18O (3–2) line in contours, superimposed on the 0.9-mm dust-continuum image of L1551 IRS 5 in gray scale. In the highest blueshifted velocities (-2.7 km s-1 – -1.4 km s-1), an emission component to the south of Source N is seen. This component disappears at = -0.9 km s-1, and from = 1.3 km s-1 to 2.6 km s-1 a gas component to the north of Source N becomes evident. Following this second blueshifted component a gas component to the south of Source S appears from = 2.2 km s-1. This southern component extends to the east and penetrates to the east of the protostellar binary in = 3.5 – 5.3 km s-1. Around the systemic velocity (5.7 – 7.1 km s-1), the emission distribution appears to be affected by the interferometric filtering effect, but a butterfly shape of the emission can be discerned. At the redshifted velocities of 7.1 – 8.8 km s-1 the C18O emission is located to the north, and the emission penetration to the west of the protobinary is also evident, in contrast to the eastern penetration at the blueshifted side. In the high redshifted velocities (9.3 – 10.6 km s-1) the C18O emission is seen to the north of Source N. The location of this high-velocity redshifted emission is very close to that of the high-velocity blueshifted (1.3 – 2.6 km s-1) emission. No clear C18O emission is seen beyond 11 km s-1.
Previous lower-resolution CS (7–6) observations of L1551 IRS 5 have revealed the rotation motion of the CBD, where the northern part is redshifted and the southern part blueshifted Takakuwa et al. (2004); Chou et al. (2014). The southern blueshifted (2.2 – 5.3 km s-1) and northern redshifted (7.1 – 10.6 km s-1) components as seen in the C18O (3–2) emission likely trace the same rotating gas motion in the CBD. Our higher-resolution and higher-sensitivity ALMA observations have also unveiled the presence of blueshifted eastern and redshifted western emission penetrations, as well as the two highest blueshifted emission components to the south and north of Source N.
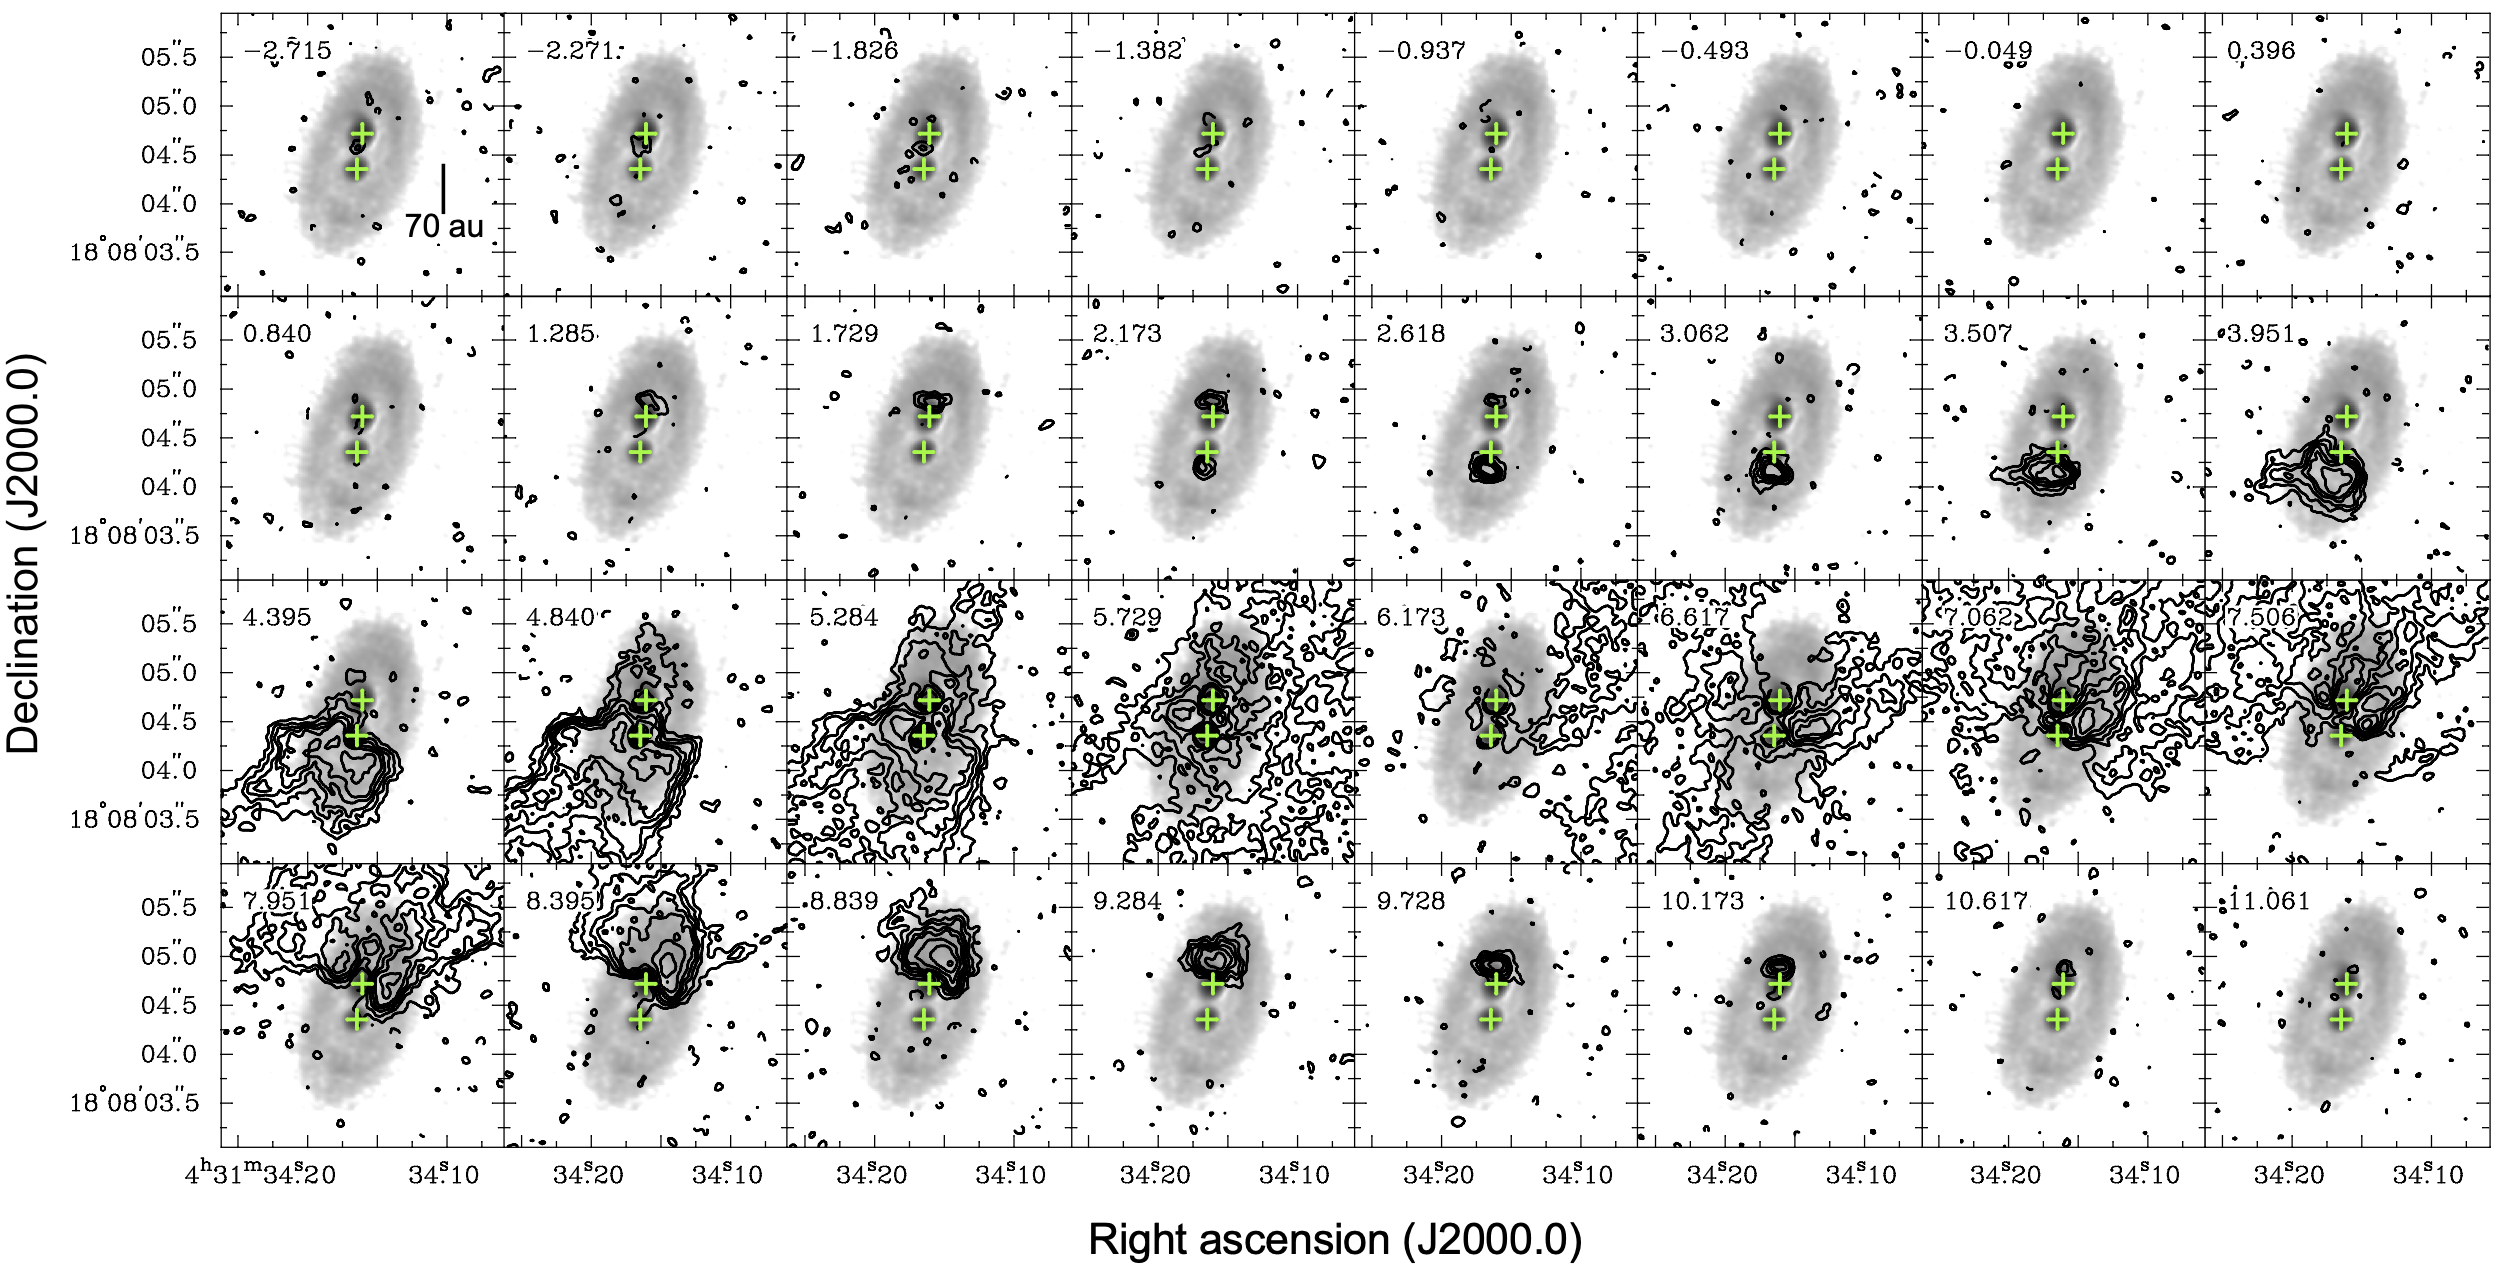
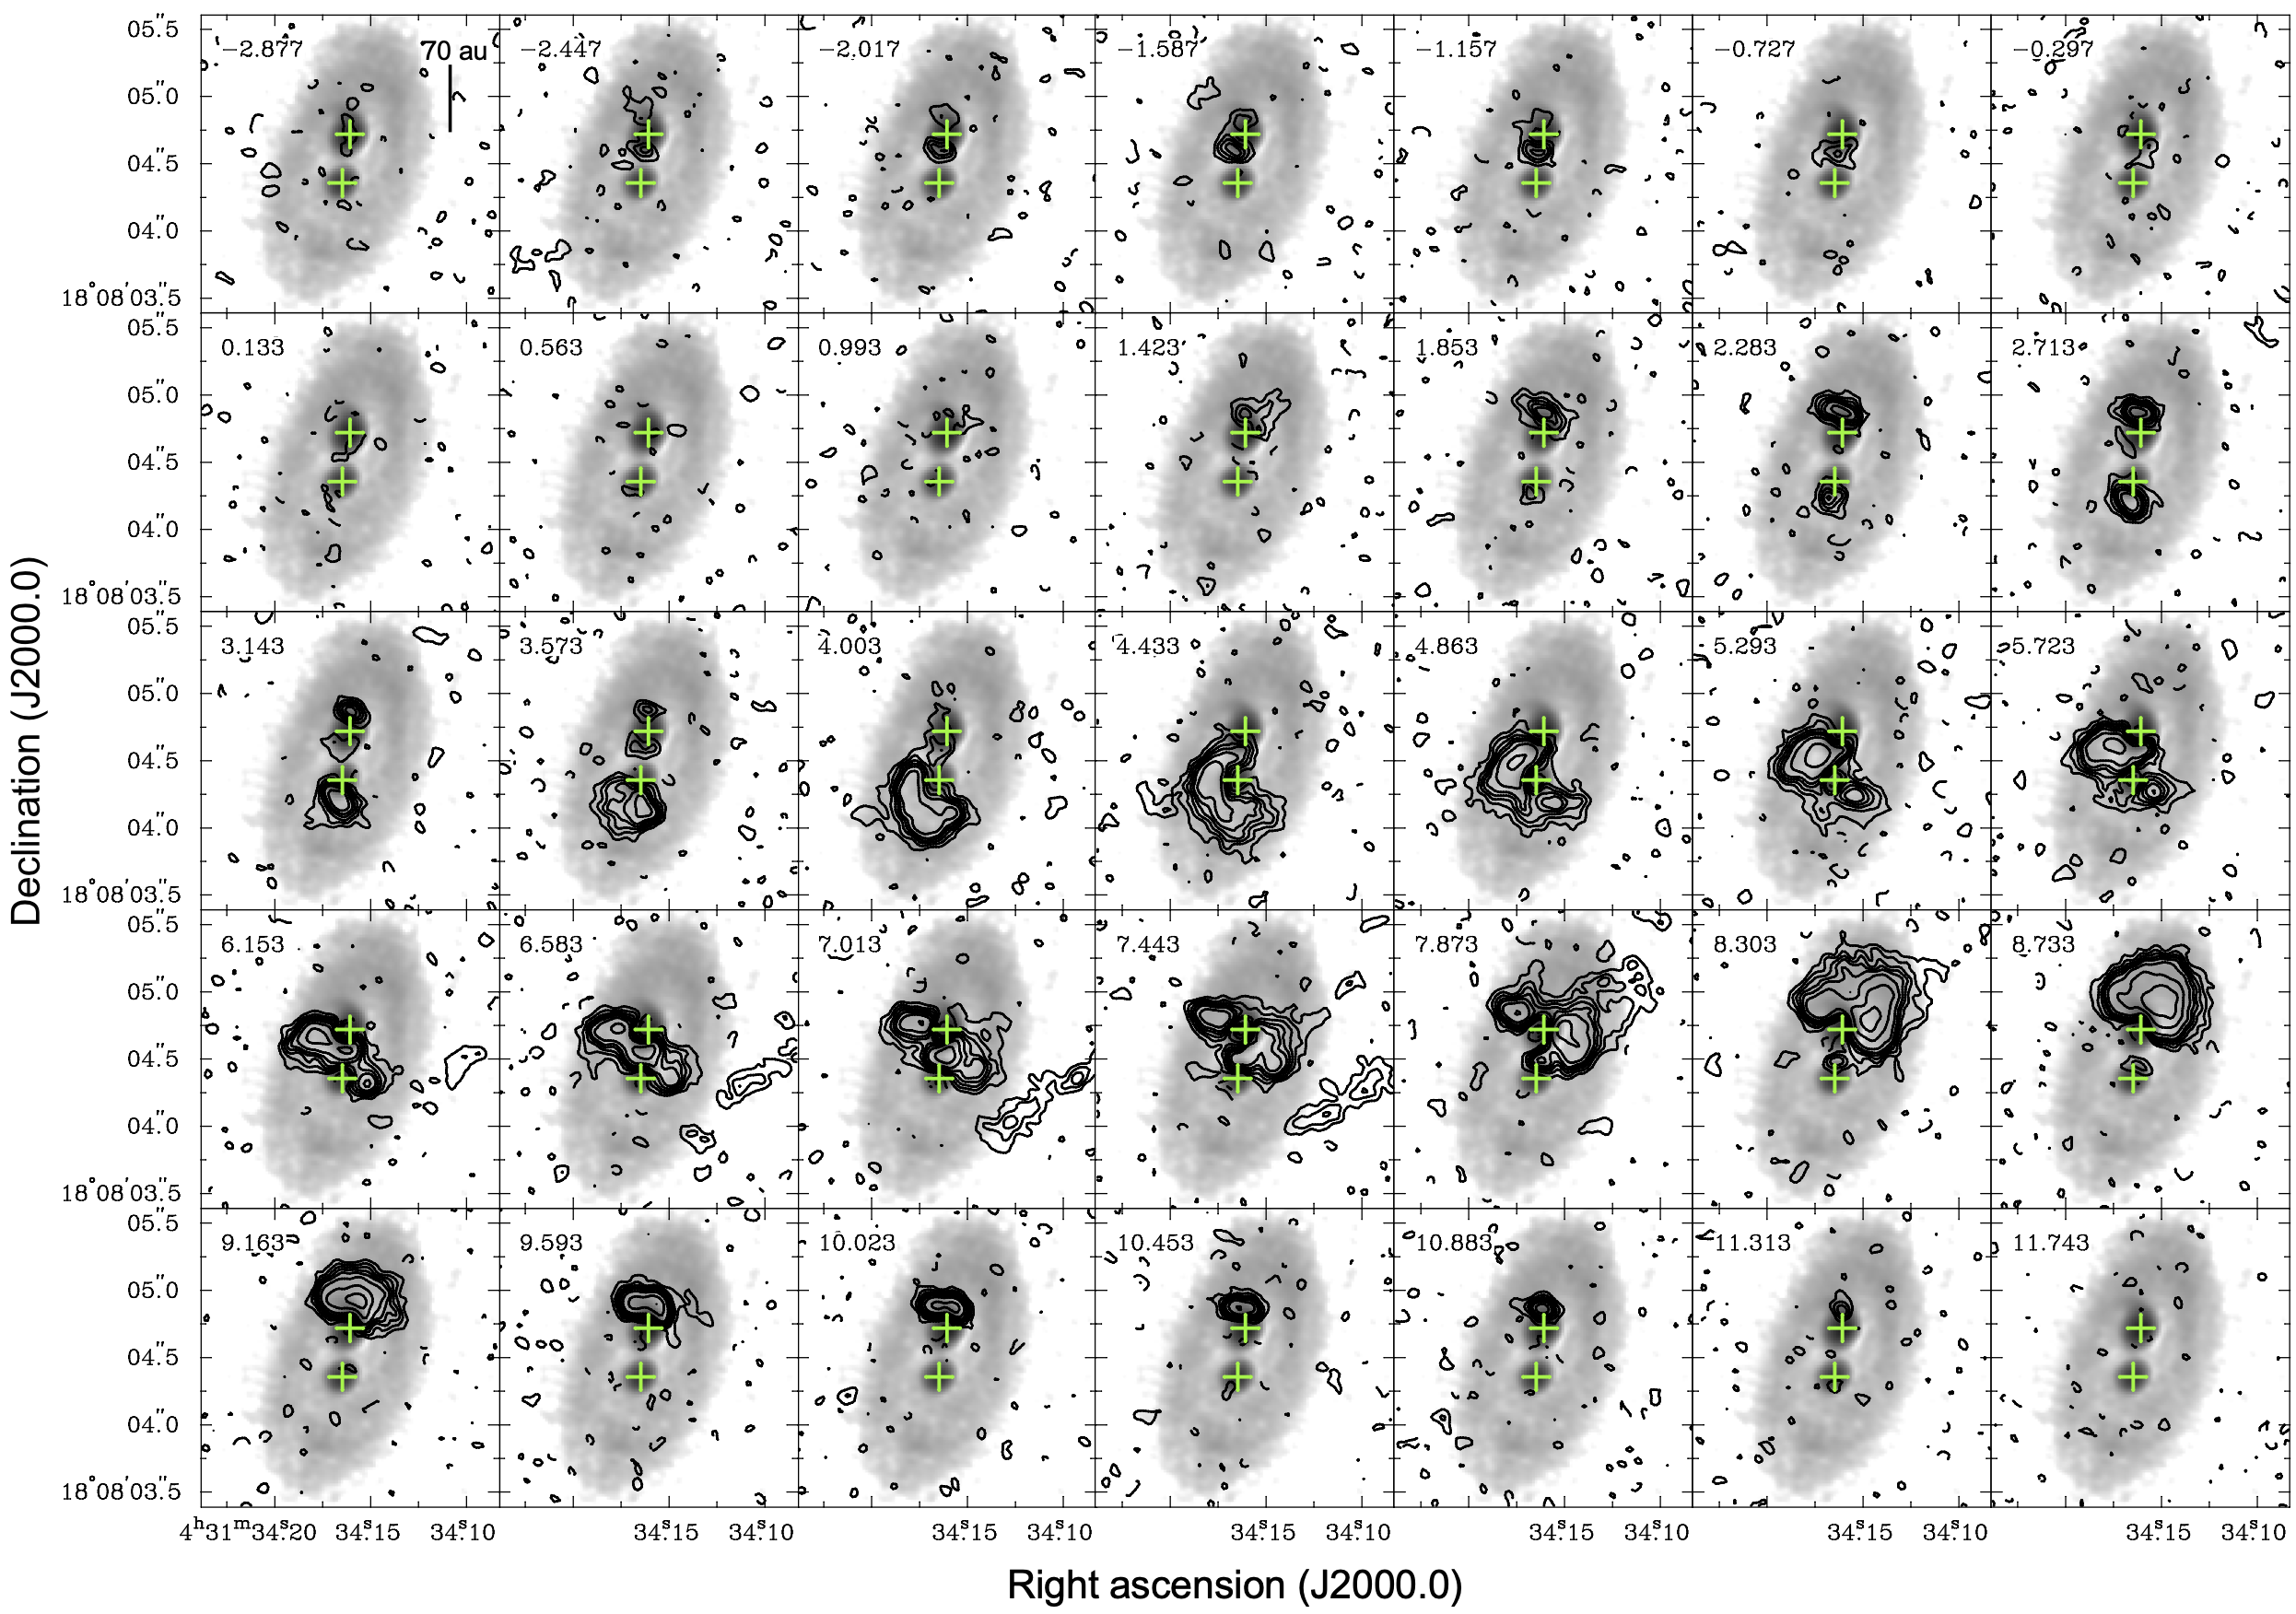
Figure 7 shows the velocity channel maps of the OCS (28–27) emission. As in the case of the C18O emission, the highest blueshifted emission to the south of Source N appears at = -2.4 – -0.3 km s-1. At = -2.4 – -1.2 km s-1 a weak OCS emission to the north of Source N is also seen. After these emission components disappear, from = 1.0 km s-1 the OCS emission to the north of Source N appears, and then from = 1.9 km s-1 another OCS emission to the south of Source S emerges. While the emission component to the north of Source N diminishes at = 4.0 km s-1, the emission component to the south of Source S gradually shifts to the eastern side of the protobinary from = 3.6 km s-1 to 6.2 km s-1. Another emission component located to the south of Source N emerges from 3.1 km s-1. The peak location of this component is systematically shifted to the south for the redder velocities, and at = 8.7 km s-1 the peak of this component is located just to the north of Source S. The C18O counterpart of this component can also be discerned in the C18O velocity channel maps (Figure 6). An emission component to the southwest of Source S also appears from = 4.9 km s-1, and in the redshifted velocities of 6.6 – 8.3 km s-1, this component is located to the west of the protostellar binary. In the highest redshifted velocities (8.7 – 11.3 km s-1) the OCS emission is located to the north of Source N. The overall velocity features as seen in the OCS emission are thus consistent with those in the C18O emission, but in the OCS the emission component located between Source N and Source S with a north (blueshifted) to south (redshifted) velocity gradient is identified more clearly.
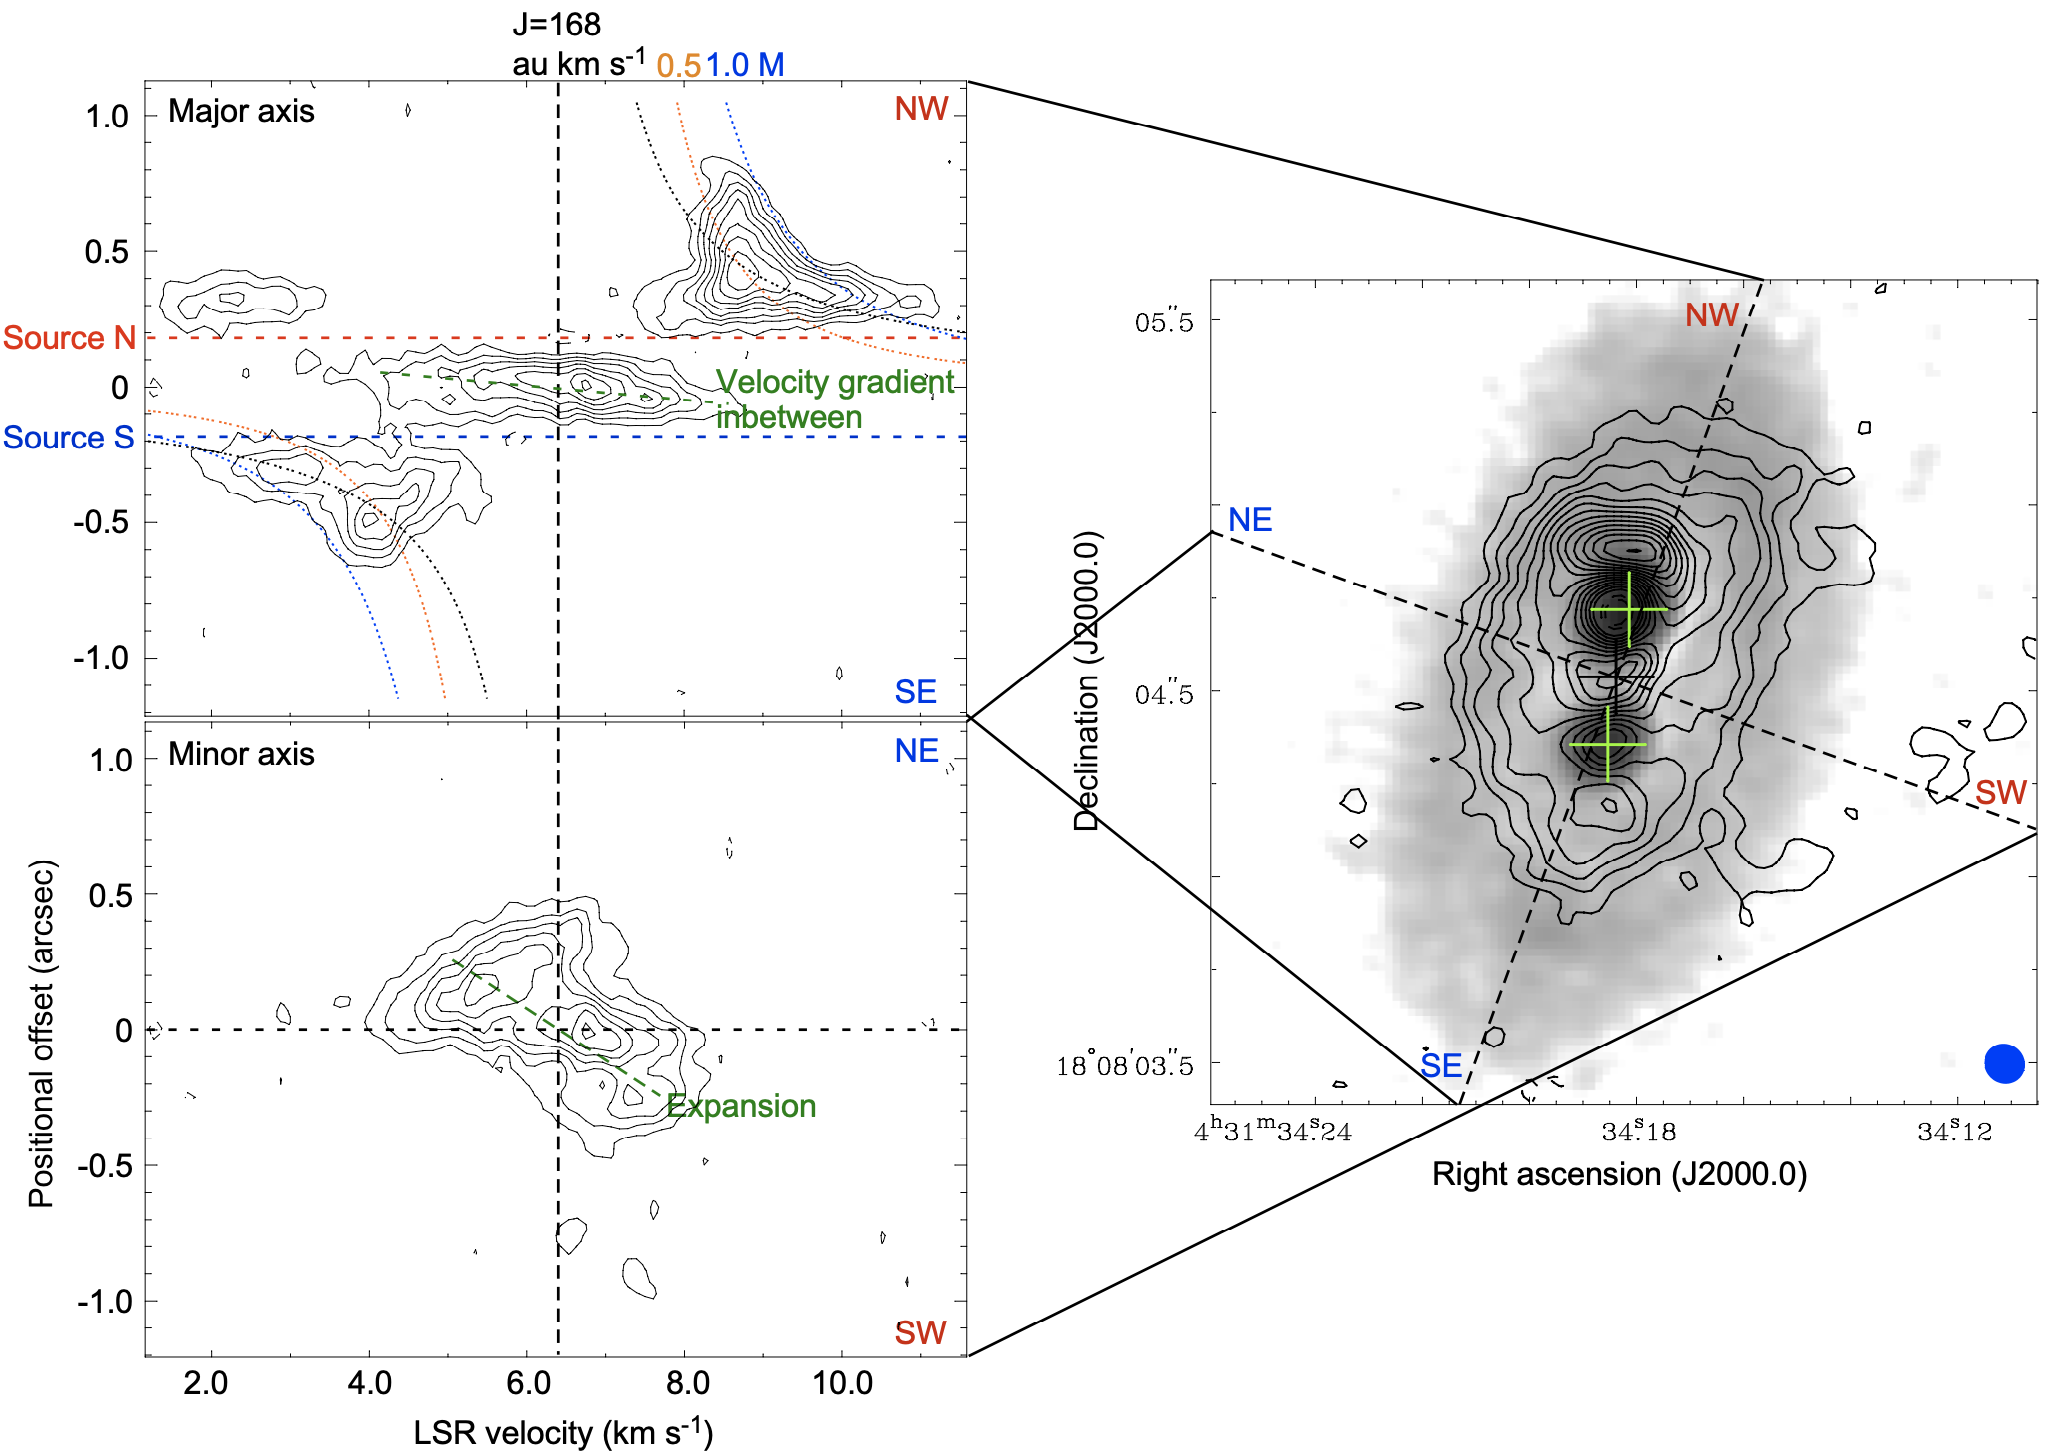
3.3.2 P-V Diagrams
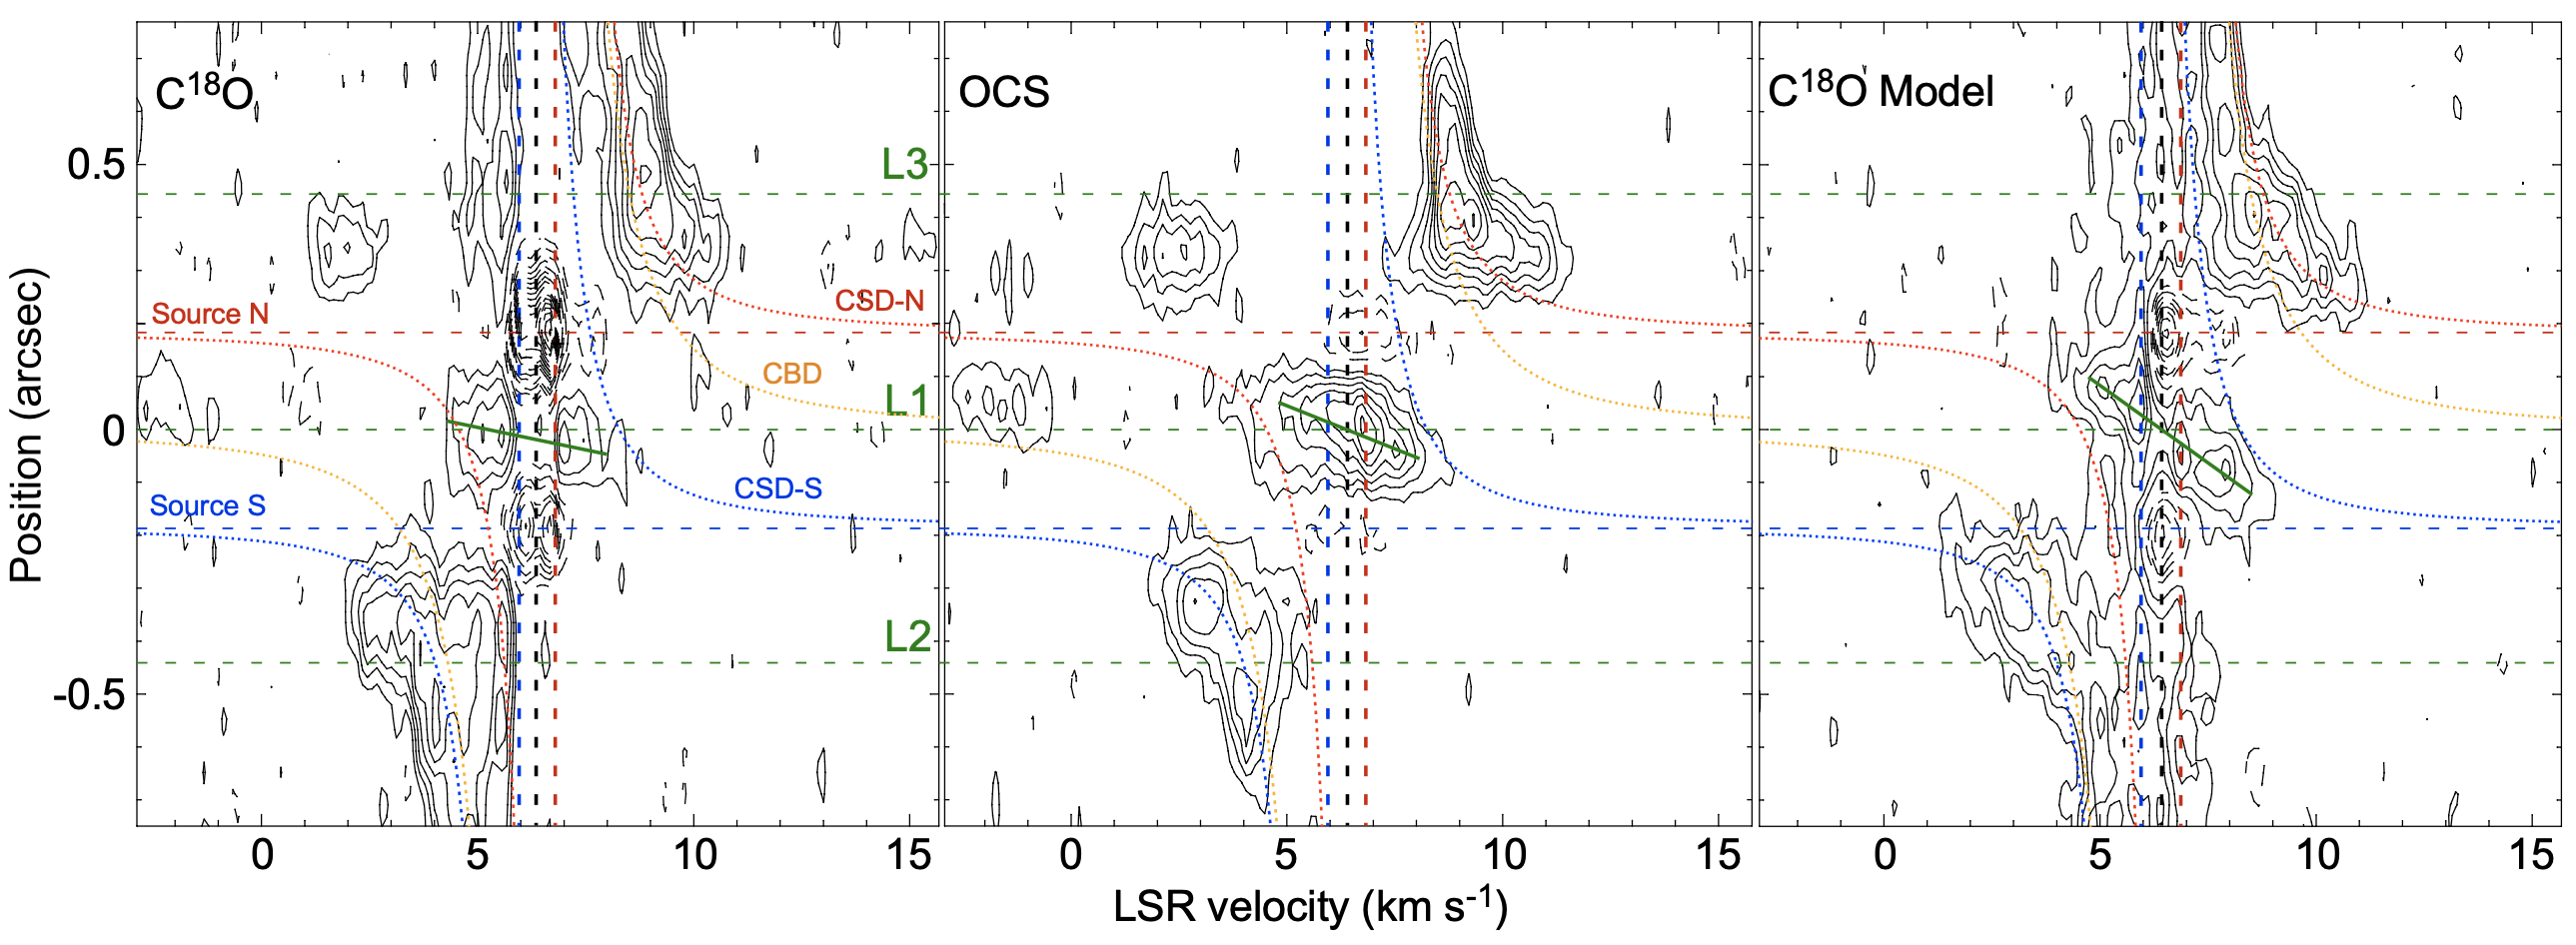
Figure 8 shows the Position-Velocity (P-V) diagrams of the C18O emission along the major (P.A. = 160) and minor axes (P.A. = 70) of the CBD in L1551 IRS 5 333For a clear presentation the velocity range in these P-V diagrams is adjusted and the highest blueshifted component to the south of Source N is not included. The P-V diagrams including the highest blueshifted component are shown in Figure 13.. In these P-V diagrams the zero position is set to be the middle position between Source N and Source S, which is considered to be the dynamical center of the CBD on the assumption of equal protostellar masses. Along the major axis, the primary emission components are northwestern redshifted and southeastern blueshifted components. The northwestern redshifted component exhibits higher velocities at the position closer to Source N, and the southeastern blueshifted component closer to Source S, suggesting the presence of spin-up rotation. The middle position between Source N and Source S (zero position in the P-V diagram) appears to be consistent with the dynamical center of rotation.
Previous interferometric observations of L1551 IRS 5 have claimed that the CBD shows Keplerian rotation with the central stellar mass (total binary mass) of 0.5 and the outermost radius of 70 au Takakuwa et al. (2004); Chou et al. (2014), and that outside the Keplerian CBD there is a 2500 au scale, infalling and rotating protostellar envelope with the rotational specific angular momentum of 168 au km s-1 Momose et al. (1998). To discuss the velocity structures observed with the new ALMA observations, the Keplerian rotation curves with the central stellar masses of 0.5 and 1.0 and the rotation curve with the conserved specific angular momentum of 168 au km s-1 are drawn on the P-V diagram along the major axis. At a radius of 70 au (=05), the emission ridges appear to be consistent with the Keplerian rotation curve from a central stellar mass of 0.5 . As the positions are closer to the locations of Source N or Source S, the velocity increase of the observed emission is even more than that of the Keplerian rotation curve of 0.5 . The gas component between Source N and Source S as identified in the OCS velocity channel maps (Figure 7) is also seen in the C18O P-V diagram along the major axis.
In the P-V diagram along the minor axis, there are northeastern blueshifted and southwestern redshifted components. The positions of these two components are within the spiral arms as seen in the 0.9-mm dust-continuum emission (see Figure 8 right). As the near and far sides of the CBD are to the northeast and southwest, respectively, the northeastern blueshifted and southwestern redshifted velocities correspond to the blueshifted velocity on the near side and the redshifted velocity on the far side. Such a velocity feature can be interpreted as the radial expanding gas motion in the CBD (green dashed line in Figure 8). There is another emission component to the northeast, which exhibits higher redshifted velocities further from the center (orange dashed line in Figure 8). This emission component corresponds to an extended gas component located to the northeast outside the CBD at = 6.6 – 8.0 km s-1 (see Figure 6). One interpretation of this component is an outflow contamination, perpendicular to the CBD plane.
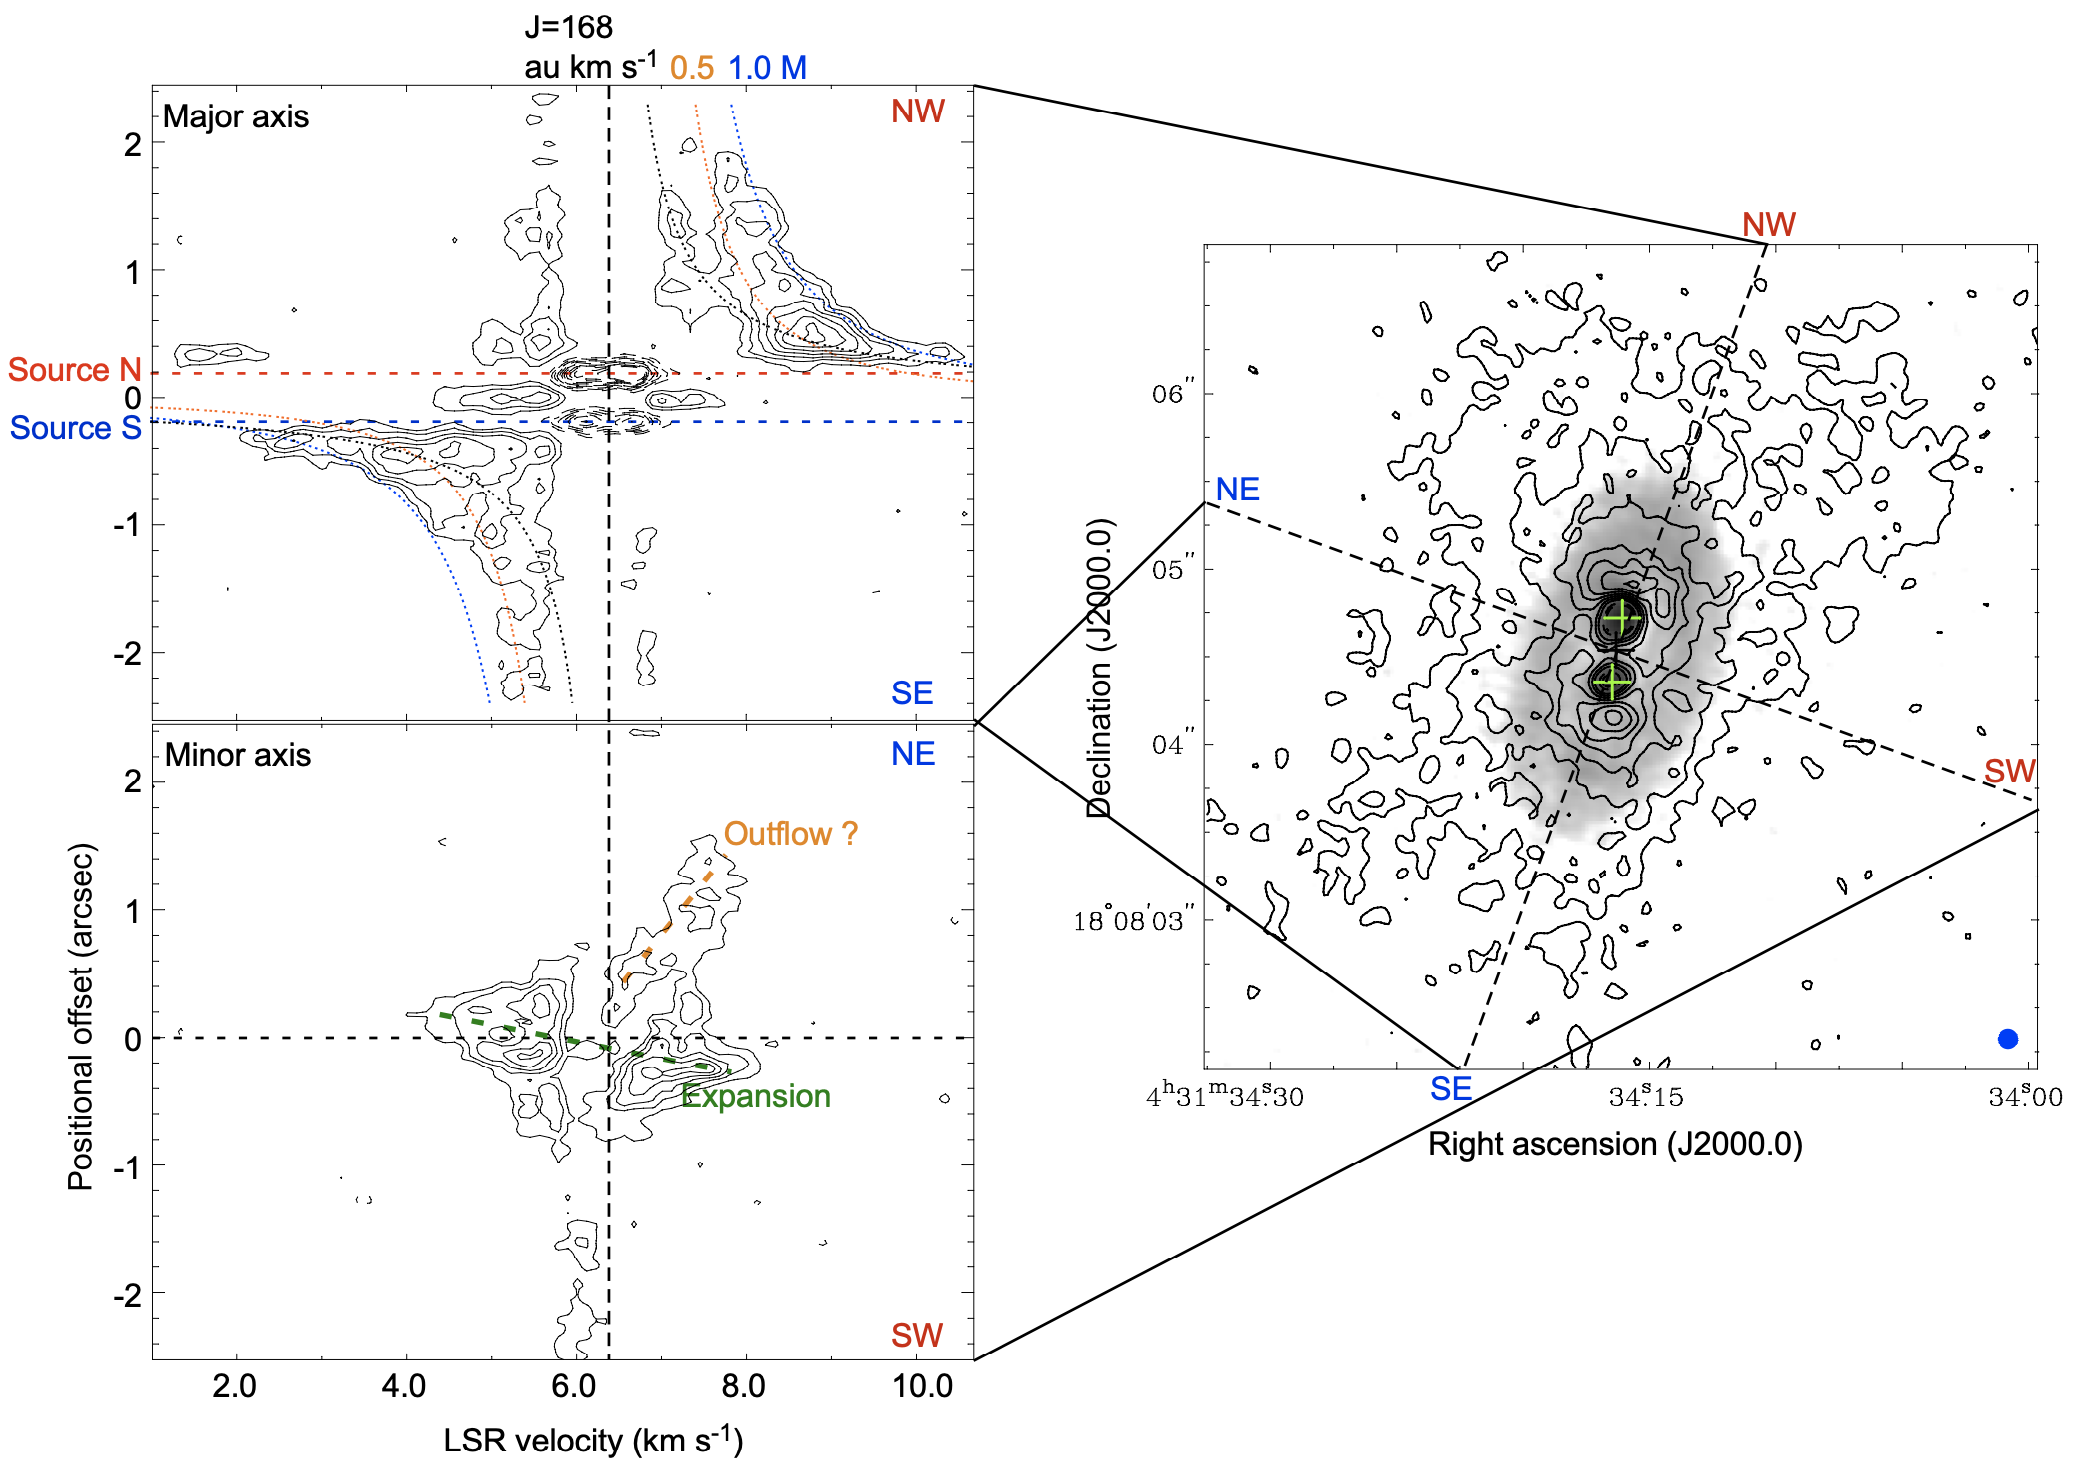
Figure 9 shows the same as that of Figure 8 but for the OCS (28–27) emission. As the extent of the OCS emission is much smaller than that of the C18O emission and even smaller than that of the 0.9-mm dust-continuum emission, the OCS emission should selectively trace the gas motions in the innermost part of the CBD. In the P-V diagram along the major axis, the northwestern redshifted and southeastern blueshifted components with the spin-up rotating signatures are identified. As in the case of the C18O emission, the velocity increase of the observed emission is even more than that of the Keplerian rotation curve of 0.5 closer to the locations of the protobinary. The high-velocity blueshifted component to the north of Source N is also clearly identified in the P-V diagram. A gas component located between Source N and Source S with a blueshifted (north) to redshifted (south) velocity gradient, which is seen in the velocity channel maps (Figure 7), is also identified. In the P-V diagram along the minor axis, the blueshifted emission is located predominantly to the northeast and the redshifted emission to the southwest, consistent with the radial expanding motion in the CBD.
4 Discussion
4.1 Nature of the Observed Structures and Gas Motions in L1551 IRS 5
Our ALMA Cycle 4 observations of L1551 IRS 5 have unveiled a two spiral-arm structure of the CBD in the 0.9-mm dust-continuum emission, and rotating and expanding gas motions of the CBD in the C18O (3–2) and OCS (28–27) emission. There are also other gas components, , the gas component with the north (blueshifted) - south (redshifted) velocity gradient located between Source N and Source S and the high-velocity blueshifted emission components to the north and south of Source N. To discuss the nature of these observed features, we performed hydrodynamical numerical simulations using the adaptive mesh refinement (AMR) code SFUMATO Matsumoto (2007). Details of our numerical simulations are described in Matsumoto et al., 2019. Our simulations have been adopted to interpret the structure and gas motion of the CBD in L1551 NE, and have successfully reproduced the observed two-arm spirals, = 1 mode, and the expanding gas motion Takakuwa et al. (2014, 2017). To discuss the observational results of L1551 IRS 5, physical parameters of the simulations are tailored to match with those of L1551 IRS 5 (Table 3). In particular, the gas kinetic temperature in our isothermal simulation is set to be = 100 K, to account for the inferred high temperature (see Figure 5). We chose the simulation result at the 58.7 orbital period of the binary (3.3 104 yr) after the start of the simulation, where one orbital period is 565 yr. The simulation result at the 58.7 orbital period appears to resemble the observed 0.9 mm dust-continuum image. The output from the numerical simulation was transferred to the radiative transfer calculation, and the theoretically predicted 0.9-mm dust-continuum and C18O (3–2) images were constructed on the assumption of the LTE condition. Details of the radiative transfer calculation are described by Takakuwa et al., 2014. We measured the radial profile of the sum of the observed 0.9-mm brightness temperature and the peak brightness temperature of the C18O spectra ( sum of Figures 1a and 5), and found that the temperature profile can be approximated as , where and indicate the distance from Source N and Source S, respectively. This temperature profile was adopted in the radiative transfer calculation. Note that in the numerical simulation the gas kinetic temperature is assumed to be uniform, but at the stage of the radiative transfer the temperature profile is incorporated. The C18O abundance was adjusted to approximately match the observed and model C18O (3–2) intensities, and the adopted value is (C18O) = 5.1 10-7, which is a factor of 3 higher than the canonical value of 1.7 10-7 Crapsi et al. (2004). Parameters of these modelings are summarized in Table 3. Then CASA observing simulations were performed to create the simulated visibility data for the model images with the same antenna configuration, hour angle coverage, bandwidth and frequency resolution, and integration time as those of the real observations. In the CASA simulations the weather parameters were also adjusted to approximately give similar noise levels to those of the real data. The simulated theoretical images with the same imaging methods as those of the real data were then made.
| Parameter | Value |
|---|---|
| Computer | ATERUI II in NAOJ CfCA |
| Simulation Code | 3D AMR Code (SFUMARTO; Matsumoto, 2007; Matsumoto et al., 2019) |
| Simulation Box | (1296 au)2 648 au |
| Highest Resolution | 0.32 au |
| Radius of Sink Particles | 1.3 au |
| Image Pixel Size | 2 au |
| Binary Separation | 54 au |
| Centrifugal Radius of the Injected GasaaUpper-state energy of the rotational level. | 64 au |
| Disk Position AngleaaChou et al., 2014; This work. | 160∘ |
| Disk Inclination AngleaaChou et al., 2014; This work. | 60∘ |
| Systemic VelocityaaChou et al., 2014; This work. | 6.4 km s-1 |
| Total Binary MassaaChou et al., 2014; This work. | 0.5 |
| Binary Mass RatiobbFrom LAMDA database Schöier et al. (2005). | 1.0 |
| Temperature ProfileccEinstein A Coefficient. | |
| C18O Abundance |
4.1.1 Structures and Gas Motions in the Spiral Arms
Figures 10 (a), (b), (c) show the observed 0.9-mm continuum image, and the theoretical continuum images after and before the CASA observing simulation, respectively. Two spiral arms can be discerned in the theoretical images (dashed curves in Figure 10c). One arm starts from the north of Source N, points toward the east, and then curls through the south to the west. The other arm starts from the south of Source S, points to the west, and then curls toward the northwest. Such features in the model appear to be consistent with the observed spiral arms; , the arm starting from the north of Source N corresponds to Arm N and the arm from the south of Source S to Arm S. On the other hand, the extent of the model CBD as a whole is larger than that of the observed image, and the observed CBD as seen in the 0.9-mm dust-continuum emission is rather confined. The extension of the CBD in the numerical simulations is due to the high temperature of the gas and angular momentum transport by the gravitational torque of the binary stars. A possible reason for the observed confinement of the CBD is the magnetic field, which is not included in the numerical simulation.
Figure 11 shows the simulated theoretical velocity channel maps of the C18O (3-2) line (contours) superimposed on the observed 0.9-mm dust-continuum image (grey scale), the model counterpart of Figure 6. In contrast to the observed C18O and OCS velocity channel maps, the high-velocity blueshifted components to the south of Source N (-2.7 km s-1 – -1.4 km s-1) and to the north of Source N (1.3 km s-1 – 2.6 km s-1) are not seen in the model velocity channel maps. This result implies that the origin of these observed highly blueshifted emission components should be distinct from the CBD model. On the other hand, the model counterpart of the observed blueshifted emission to the south of Source S is seen from = 1.7 km s-1. From = 3.5 km s-1 this component extends eastward, and the C18O emission penetrates to the east of the protobinary until = 5.3 km s-1. Such a velocity feature is also consistent with the observation as described in section 3.3.1. On the redshifted side a similar velocity feature is also seen both in the observed and model velocity channel maps. At the highly redshifted velocities of 9.7 – 10.6 km s-1 compact C18O emission located to the north of Source N is present, and at = 7.5 – 9.3 km s-1 this component extends westward and penetrates to the west of the protobinary.
Figure 12 compares the observed (left panels) and model (right) P-V diagrams of the C18O (3–2) emission along the cuts parallel to the minor axis of the CBD (P.A. = 70) passing through +075 (top panel), 0 (midddle), and -075 offsets (bottom) from the middle position between the protobinary. The P-V diagrams at the 075 offsets are across the spiral arms as seen in the 0.9-mm dust continuum emission, while that at the 0 offset is along the minor axis of the CBD (same as that in Figure 8). As already discussed the P-V diagram along the minor axis of the CBD shows the northeast (blueshifted) to southwest (redshifted) velocity gradient (green dashed line in Figure 12), which can be interpreted as the expanding gas motion of the CBD. The model P-V diagram along the minor axis reproduces such an expanding gas motion. If the gas motion in the CBD is azimuthal only, the pattern of the line-of-sight (LOS) velocity should be symmetric with respect to the disk major axis, and the P-V diagrams across the arms parallel to the minor axis should show symmetric patterns with respect to the major axis Takakuwa et al. (2014). The P-V diagrams across the arms show, however, rather skewed emission distributions, and northeast (blueshifted) to southwest (redshifted) velocity gradients (green dashed lines), which are also reproduced with the model P-V diagrams. These velocity features reflect the eastern blueshifted and western redshifted emission penetrations seen in the observed (Figures 6, 7) and the model velocity channel maps (Figure 11). These results indicate that the spiral arms have expanding motions, as well as rotation as seen in the P-V diagrams along the major axis (Figures 8 and 9).
Our numerical simulations, as well as previous theoretical models Bate (2000); Günther & Kley (2002); Ochi et al. (2005); Hanawa et al. (2010); Shi et al. (2012); Demidova & Shevchenko (2015); Young et al. (2015); Price et al. (2018), predict a two-arm spiral pattern in CBDs. The arms extend from the binaries through the L2 and L3 Lagrangian points in the Roche potential. Our simulations show that the spirals co-rotate with the binary system, and thus the spiral pattern rotates faster than the material in the CBD. Outside the L2 and L3 Lagrangian points, the spirals in the CBD are the regions where the nonaxisymmetric gravitational torques from the binary impart angular momenta and drive faster rotation than the local Keplerian velocity. Material in the spirals thus expands outward. After the spiral pattern passes through the location of the material, it loses angular momenta and falls inward. The net effect is gas infall from the CBD to the CSDs.
The observed radial expansion in the CBD of L1551 IRS 5 can thus be interpreted as a result of the non-axisymmetric gravitational torques of the binary. In the neighboring protostellar binary L1551 NE, a similar expanding gas motion in the arms has also been identified Takakuwa et al. (2014, 2017). In the case of L1551 NE infalling gas components in the inter-arm regions of the CBD are also identified Takakuwa et al. (2014, 2017), which are not clearly identified in the CBD of L1551 IRS 5. The apparent absence of infall in the CBD of L1551 IRS 5 should not be regarded, however, as the real absence of the infall in the CBD. Our numerical simulation indeed shows presence of the infalling motion. To observationally identify infall, sufficiently large area of the infalling region must reside along the minor axis of the CBD. In the case of L1551 IRS 5 the projected locations of the protobinary are closely aligned along the major axis of the CBD. As shown in Figure 5 of Matsumoto et al., 2019, in such a configuration most of the infalling regions resides along the major axis. On the other hand, in L1551 NE the locations of the protobinary are well tilted from the major axis of the CBD, and the large infalling area can pass through the minor axis of the CBD. Furthermore, in the case of L1551 NE the size of the CBD itself is larger and the minor axis can pass through the sufficiently large inter-arm regions (see Figure 3). These observational biases cause the apparent absence of infall in L1551 IRS 5 in spite of the presence of infall in L1551 NE.
4.1.2 Gas Motion inside the Hill Radii
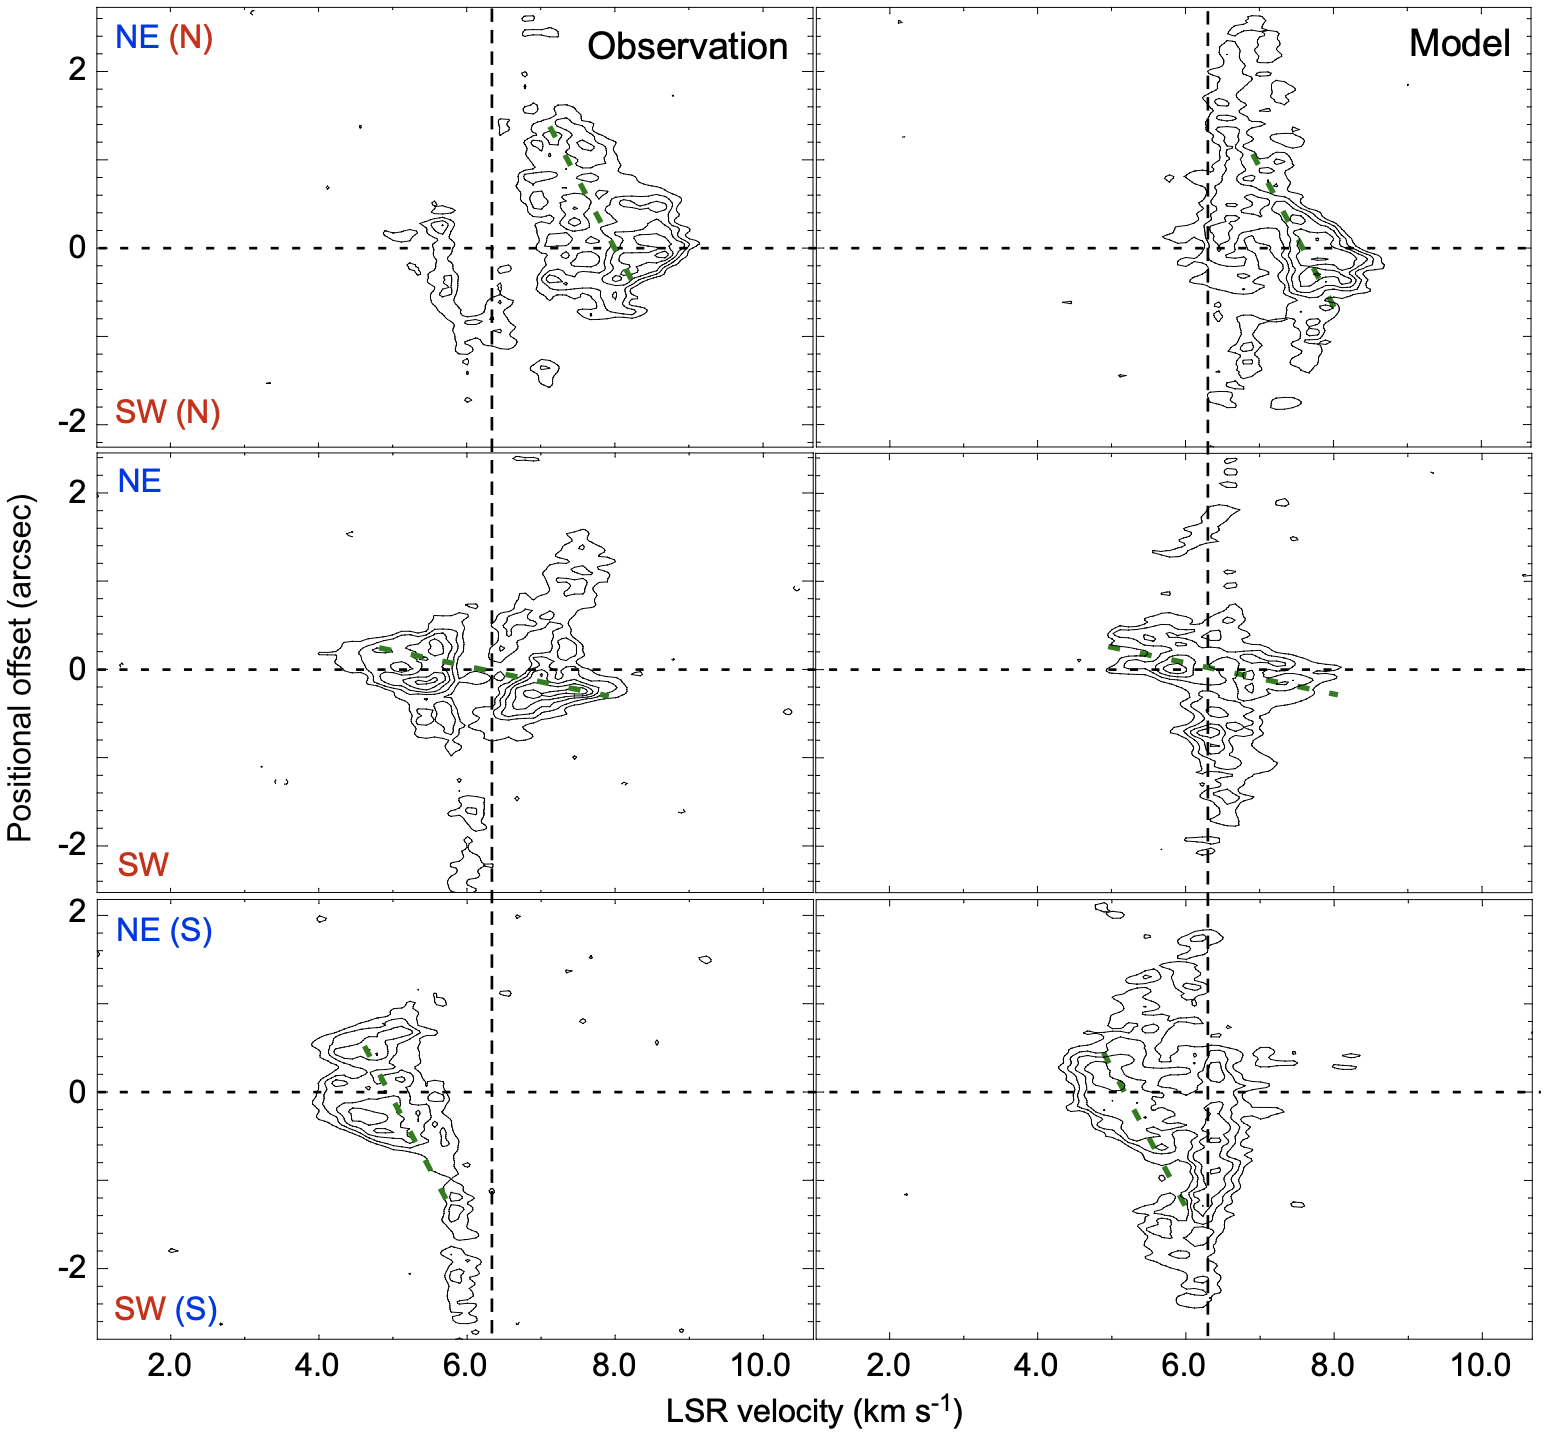
Figure 13 shows the observed P-V diagrams of the C18O (left panel) and OCS emission (middle), and the model C18O P-V diagram (right) in the close vicinity of Source N and Source S passing through them. The position angle of the P-V cut (P.A. = 171) is close to that of the major axis of the CBD, and from these zoomed P-V diagrams the azimuthal gas motions near the individual protostellar sources can be investigated. On the assumption of a circular Keplerian orbit of the binary system co-planar to the CBD with the inclination angle of = 60 and position angle of = 160, and a total binary mass of 0.5 with mass ratio of unity Lim & Takakuwa (2006); Lim et al. 2016a ; Chou et al. (2014), the line-of-sight velocities of Source N and Source S are calculated to be = 6.85 km s-1 and 5.95 km s-1, respectively. These velocities, as well as the positions of the protobinary, must be the centers of the CSD rotations. On these positional and velocity centers the anticipated Keplerian rotation curves of the CSDs around Source N (red curves) and Source S (blue curves) are drawn in Figure 13, as well as the Keplerian rotation curves of the CBD (orange). As already described in Figures 8 and 9, at the outer radii the northwestern redshifted and southeastern blueshifted components originate from the rotating CBD. In the closer vicinities of Source N and Source S these emission components extend to even redder and bluer velocities (3 km s-1), respectively, seen in both the observed and model P-V diagrams. The degree of the velocity increase in the high redshifted and blueshifted velocities seems to better match with the Keplerian rotation of the CSDs around Source N and Source S, respectively, than that of the CBD. This result implies the transition from the outer CBD to the inner CSDs. In the close vicinity of the individual binary protostars the gravitational field from the individual single star should be dominant and control the rotational gas motions in the individual CSDs. Such transitions should take place around the L2 and L3 Lagrangian points, and the outermost radius of the gravitational field from the single star is called as Hill radius. On the assumption of the equal masses of the individual stars, the distance between the L1 and L2, L3 Lagrangian points should be 1.2, where denotes the binary separation. The observed transitions from the CBD to the CSDs indeed appear to occur around the inferred L2 and L3 Lagrangian points (green horizontal dashed lines in Figure 13).
In the observed velocity channel maps of the OCS emission (Figure 7), there is a gas component with the north (blueshifted) - south (redshifted) velocity gradient located between the protobinary. The observed C18O counterpart can also be identified, and these observed components are clearly seen in Figure 13. In the model velocity channel maps of Figure 11, a gas component to the south of Source N emerges from = 4.4 km s-1. This component appears to be distinct until = 5.3 km s-1, while it become merged in the extended component at = 5.7 – 7.5 km s-1. At = 8.0 – 8.8 km s-1 a gas component to the north of Source S appears as a distinct gas component. These blueshifted and redshifted model emission corresponds to the observed component located between Source N and Source S, and is also present in Figure 13, while the amount of the velocity gradient in the model appears to be smaller than that of the observed components (green lines in Figure 13). The blueshifted part of this component could be interpreted as the blueshifted counterpart of the CSD around Source N, and the redshifted part the redshifted counterpart of the CSD around Source S. Compared to the inferred Keplerian rotation profiles of the individual CSDs (red and blue curves), the velocities of the observed and model components between the protobinary are slower, suggesting slower azimuthal velocities. Our model shows that a bridge gas structure connects the two CSDs, crossing the L1 Lagrangian point (see Figures 2 and 4 in Matsumoto et al., 2019). The gas flow has a stagnation point around the L1 Lagrangian point, and it exhibits a linear velocity gradient in the P-V diagrams, which are consistent with the observed velocity gradient as seen in the C18O and OCS emission. In particular, the velocity of the observed and model emission components located between Source N and Source S at the L1 stagnation point is consistent with the systemic velocity (crossing point between the vertical black dashed lines and the L1 green dashed line).
In Figure 13, the observed high-velocity blueshifted gas components to the south and north of Source N in the C18O and OCS emission are also seen. The model counterparts of these emission components are, however, not present. The velocity of the highest blueshifted component to the south of Source N is too high as compared to the inferred Keplerian velocity of the CSD around Source N. On the other hand, the projected location of the highly blueshifted component to the north of Source N is almost identical to that of the redshifted emission originated from the CSD rotation around Source N. The high-velocity blueshifted components to the south and north of Source N may thus be distinct gas components whose locations are above or below the disk plane.
4.2 Comparison between L1551 IRS 5 and NE; FU Ori CBD in L1551 IRS 5 ?
As well as the apparent absence of the infall motion in the CBD of L1551 IRS 5, there are several intriguing differences between L1551 IRS 5 and NE, both of which are Class I binary protostars located within 25 (0.10 pc) in the L1551 region. First, the outermost radius of the CBD in L1551 IRS 5 is half that of L1551 NE as seen in the 0.9-mm dust-continuum emission (Figure 3). Our numerical models for both L1551 IRS 5 and NE take the different binary masses, mass ratios, separations, and the centrifugal radii of the outer infalling envelopes into account (see Table 3). The model of L1551 NE approximately reproduces the observed extent of the CBD Takakuwa et al. (2014, 2017). On the other hand, the extent of the model CBD in L1551 IRS 5 seems larger than that of the observed CBD. In the model of L1551 IRS 5 the high temperature of the gas and angular momentum transport by the gravitational torque of the binary stars expands the CBD. Thus, in the case of L1551 IRS 5 an additional mechanism to confine the CBD is likely required, and a possible cause is the magnetic field. A second difference is the spiral morphology. In L1551 NE the western part of the CBD is much brighter than the eastern part, suggesting the presence of the mode of the material distribution. Such an mode in the spiral arms is less obvious in L1551 IRS 5. Our model of L1551 IRS 5 adopts the high gas kinetic temperature of 100 K, which suppresses the mode. On the other hand, we found that our models with lower temperatures show the mode, even if the binary mass ratio is unity. Thus, the difference of the mode between L1551 IRS 5 and NE could be due to the difference of the gas kinetic temperature.
Another unique difference between L1551 IRS 5 and NE is the difference of the brightness temperatures in the protobinary systems. In L1551 IRS 5, the peak brightness temperature of the 0.9-mm dust-continuum emission in the CSD toward Source N exceeds 260 K, and that toward Source S 160 K. By contrast, in L1551 NE the peak brightness temperatures toward Source A and Source B are 42 K and 18 K, respectively (Figure 3). In L1551 IRS 5, the peak brightness temperature of the molecular lines in the CBD exceeds 100 K (Figure 5), while that in L1551 NE is 54 K. These results imply that the kinetic temperature of the protobinary system L1551 IRS 5 is likely much higher than that of L1551 NE, as discussed above regarding the mode. The bolometric luminosity of L1551 IRS 5 is 22 , much brighter than that of L1551 NE (4.2 ) Froebrich (2005). On the other hand, the total masses of the protostellar binaries as inferred from the CBD rotations are 0.5 and 0.8 in L1551 IRS 5 and NE, respectively. Thus, the central protostellar mass of the hotter system is lower. These dynamical masses are below a solar mass, and the bolometric luminosities are much higher than the stellar luminosities. Thus, specific mass accretion burst in L1551 IRS 5 is likely required to account for the luminosity and temperature differences.
L1551 IRS 5 has been classified as an embedded FU Orionis object. FU Orionis events are a brightening of the optical luminosities by 5–6 orders of magnitude in months to years time scales, followed by the decay of the luminosity over several decades to a century Herbig (1977); Hartmann & Kenyon (1985); Vorobyov & Basu (2006). The physical mechanism of the FU Orionis eruption is understood as a sudden increase of the mass accretion in the disk onto the central stellar object. Whereas the optical brightening of L1551 IRS 5 has not been witnessed presumably because of the obscuration from the surrounding protostellar envelope, the presence of the first overtone CO absorption bands at 2.3 is considered as a piece of evidence of an FU Orionis event because the CO absorption arises from the cooler surface layer of the hot accretion disk Reipurth & Aspin (1997). It is interesting to note that the CSD toward Source N is hotter than that toward Source S by 100 K, even though the protostellar masses of Source N and Source S are similar, and that the western side of Source N is the hottest region in the CBD as seen in the observed molecular lines (Figure 5). From these results, we consider that Source N has experienced a more energetic accretion burst than Source S, or that the accretion burst in Source N is the latest one following that in Source S. The brighter central protostar Source N irradiates the surrounding CSD, and through the cavity excavated by the blueshifted jet and outflow, the escaped radiation heats the surface of the CBD on the western side directly. Because the western side is the far-side, there is less, cold obscuring material along the line of sight, which makes the skewed temperature distribution (Figure 5). The detected highly blueshifted components to the north and south of Source N, whose origins are not understood with our numerical simulation, could be attributed to the FU Orionis event.
Statistics of solar-type main-sequence binaries shows preference to the equal mass ratio (, =1), while the distribution of the non-equal mass binaries is almost flat between 0.1 and Raghavan et al. (2010); Moe & Di Stefano (2017); El-Badry et al. (2019). The binary mass ratio in L1551 IRS 5 is close to unity but that in L1551 NE is 0.2. Our simulations predict that the secondary accretes more than the primary in L1551 NE Takakuwa et al. (2014, 2017); Matsumoto et al. (2019). The mass ratio of L1551 NE may thus approach to 1. On the other hand, our simulations with an equal binary mass predict the equal mass accretion rate, which implies that the binary mass ratio of L1551 IRS 5 will remain the same. It is desirable to observationally measure the mass accretion rates onto the primary and secondary of L1551 IRS 5 and NE, as well as the other protobinary sources, to understand the origin of the distribution of the binary mass ratio. One of the key points is to resolve well the structures and gas motions inside the Hill radii, and to compare the observational results to those of the numerical simulations. These should be the subject to our next researches.
5 Summary
We have conducted ALMA Cycle 4 observations of the protostellar binary system L1551 IRS 5 in the 0.9-mm dust-continuum emission, and the C18O (3–2), 13CO (3–2), CS (7–6), OCS (28–27), SO (78–67), and HC18O+ (4–3) lines at an angular resolution of 01. We have also performed hydrodynamical simulations, radiative transfer calculations, and ALMA observing simulations to make theoretically-predicted 0.9-mm and C18O images of L1551 IRS 5 and to interpret the observed features. The results of L1551 IRS 5 are compared to our ALMA Cycle 2 results of L1551 NE, other Class I protostellar binary located just 25 (0.10 pc) northeast of L1551 IRS 5. The main results are summarized below.
-
1.
The 0.9-mm image resolves two circumstellar disks (CSDs) around the individual binary protostars (Source N and Source S) and the circumbinary disk (CBD) in L1551 IRS 5. The relative location of the binary protostars as observed in 2017 is consistent with the identified clockwise orbital motion starting from 1983. The beam-deconvolved size of the CSDs is 20 au, and the outermost radius of the CBD 150 au. The ringlike CBD feature that previous ALMA observations found has been resolved into two spiral arms with the present observations, one arm connecting to the CSD in Source N and the other to Source S. The 0.9-mm peak brightness temperatures of the CSDs toward Source N and Source S reach 260 K and 160 K, respectively, and the spectral index between 0.9 mm and 1.3 mm in the CSDs is as low as 2. These results imply that the 0.9-mm continuum emission from the CSDs is optically thick and traces the dust temperature. The peak brightness temperature of the 0.9-mm dust-continuum emission toward the CBD is 20 K and the value 3 – 3.7, suggesting that the 0.9-mm emission from the CBD is optically thin. The mass of the CBD is estimated to be 0.015–0.060 for = 30–100 K. As compared to the CBD image at 0.9-mm in L1551 NE, the CBD in L1551 IRS 5 is half the size but the brightness temperature is much higher. Furthermore, the = 1 mode of the two-arm spirals found in L1551 NE is less obvious in L1551 IRS 5.
-
2.
All the observed molecular lines except for the HC18O+ (4–3) line have been strongly detected toward the CBD. In particular, the OCS (28–27) emission with the upper-state energy of the rotational level of 237 K has been detected. The peak brightness temperatures of the detected molecular lines are as high as 100 K. These results imply the high gas kinetic temperature of the CBD. The western side of Source N in the CBD, which corresponds to the far-side, is the brightest, where the intense radiation from Source N as inferred from the high brightness temperature of the CSD in the 0.9-mm continuum emission is reflected. Because of the intense background continuum emission, the molecular lines show negative intensities toward the CSDs.
-
3.
The velocity channel maps of the C18O and OCS emission show distinct, multiple velocity components. Primary emission components are a blueshifted (3.5 – 5.3 km s-1) component to the southeast and a redshifted (7.1 – 9.3 km s-1) component to the northwest of the protobinary, which originates from the rotation of the CBD. Both of these blueshifted and redshifted components also exhibit velocity gradients along the northeast (blueshifted) - southwest (redshifted) orientation. These results can be interpreted as the expanding motion of the rotating CBD. In the highly blueshifted ( = 1.9 - 3.1 km s-1) and redshifted (9.7 - 11.3 km s-1) velocities, compact molecular emission are located to the south of Source S and north of Source N, respectively. These components are likely originated from the rotating motions of the individual CSDs, and exhibit transitions from the CBD to the CSD rotations at around the L2 and L3 Lagrangian points. A gas component located between Source N and Source S with a north (blueshifted) to south (redshifted) velocity gradient is also observed at = 3.1 - 8.7 km s-1. This component should reflect the gas motion around the L1 point. There are another, highly blueshifted components (-2.7 – -0.3 km s-1 and 1.3 – 3.6 km s-1) to the south and north of Source N, respectively.
-
4.
Our numerical model reproduces the observed two spiral-arm structure as seen in the 0.9-mm dust-continuum image, whereas the extent of the model CBD is larger than that observed. The observed confinement of the CBD may be attributed to the effect of the magnetic field, which is not included in our numerical model. Our model velocity channel maps of the C18O emission reproduce the observed expanding gas motion, due to the faster rotation than the Keplerian rotation caused by the non-axisymmetric gravitational torque of the binary in the spiral regions. Infall in the inter-arm regions predicted in our numerical model is not observationally identified, because the projected locations of the binary are closely aligned to the major axis of the CBD and the infall regions reside along the major axis. The transitions from the CBD to the CSDs at the L2 and L3 Lagrangian points are also reproduced with our model. Furthermore, our numerical model demonstrates that the observed gas component located between the protobinary with the north (blueshifted) - south (redshifted) velocity gradient can be interpreted as the gas flow around the stagnation point, which is located at the L1 Lagrangian point. On the other hand, the model velocity channel maps do not reproduce the observed highly blueshifted components to the north and south of Source N.
-
5.
The brightness temperatures of the 0.9-mm + molecular emission in the CSDs and CBD and the bolometric luminosity are much higher in L1551 IRS 5 than those in L1551 NE, whereas the inferred protobinary mass of L1551 IRS 5 (0.5 ) is lower than that of L1551 NE (0.8 ). These results support the previous claim that L1551 IRS 5 is in the state of an FU Orionis event. The absence of the =1 mode of the spirals in L1551 IRS 5, in contrast to that in L1551 NE, can be attributed to the high gas temperature in the CBD. The observed highly blueshifted components around Source N, which exhibits a higher brightness temperature in the CSD than Source S, may be related to the FU Orionis event.
References
- ALMA Partnership et al. (2015) ALMA Partnership, Brogan, C. L., Pérez, L. M., et al. 2015, ApJ, 808, L3
- Bate (2000) Bate, M. R. 2000, MNRAS, 314, 33
- Chen et al. (2013) Chen, X., Arce, H. G., Zhang, Q. et al. 2013, ApJ, 768, 110
- Chou et al. (2014) Chou, T.-L., Takakuwa, S., Yen, H.-W., Ohashi, N., & Ho, P. T. P. 2014, ApJ, 796, 70
- Connelley & Reipurth (2018) Connelley, M. S., & Reipurth, B. 2018, ApJ, 861, 145
- Crapsi et al. (2004) Crapsi, A., Caselli, P., Walmsley, C. M., et al. 2004, A&A, 420, 957
- Cruz-Sáenz de Miera et al. (2019) Cruz-Sáenz de Miera, F., Kóspál, Á., Ábrahám, P., Liu, H. B., & Takami, M. 2019, ApJ, 882, L4
- Demidova & Shevchenko (2015) Demidova, T. V., & Shevchenko, I. I. 2015, ApJ, 805, 38
- Duquennoy & Mayor (1991) Duquennoy, A., & Mayor, M. 1991, A&A, 248, 485
- Dutrey et al. (2014) Dutrey, A., Di Folco, E., Guilloteau, S., et al. 2014, Nature, 514, 600
- Dutrey et al. (2016) Dutrey, A., Di Folco, E., Beck, T., & Guilloteau, S. 2016, A&A Rev., 24, 5
- El-Badry et al. (2019) El-Badry, K., Rix, H.-W., Tian, H., Duchêne, G., Moe, M. 2019, MNRAS, 489, 5822
- Elias (1978) Elias, J. H. 1978, ApJ, 224, 857
- Fridlund et al. (2002) Fridlund, C. V. M., Bergman, P., White, G. J., Pilbratt, G. L., & Tauber, J. A. 2002, A&A, 382, 573
- Froebrich (2005) Froebrich, D. 2005, ApJS, 156, 169
- Günther & Kley (2002) Günther, R., & Kley, W. 2002, A&A, 387, 550
- Hanawa et al. (2010) Hanawa, T., Ochi, Y., & Ando, K. 2010, ApJ, 708, 485
- Hartmann & Kenyon (1985) Hartmann, L., & Kenyon, S. J. 1985, ApJ, 299, 462
- Hayashi & Pyo (2009) Hayashi, M. & Pyo, T.-S. 2009, ApJ, 694, 582
- Herbig (1977) Herbig, G. H. 1977, ApJ, 217, 693
- Hildebrand (1983) Hildebrand, R. H. 1983, QJRAS, 24, 267
- Lim & Takakuwa (2006) Lim. J., & Takakuwa, S. 2006, ApJ, 653, 425
- (23) Lim. J., Yeung, P. K. H., Hanawa, T., et al. 2016a, ApJ, 826, 153
- (24) Lim. J., Hanawa, T., Yeung, P. K. H., et al. 2016b, ApJ, 831, 90
- Looney et al. (1997) Looney, L. W., Mundy, L. G., & Welch, W. J. 1997, ApJ, 484, L157
- Looney et al. (2000) Looney, L. W., Mundy, L. G., & Welch, W. J. 2000, ApJ, 529, 477
- Lynds (1962) Lynds, B. T. 1962, ApJS, 7, 1
- Matsumoto (2007) Matsumoto, T. 2007, PASJ, 59, 905
- Matsumoto et al. (2019) Matsumoto, T., Saigo, K., & Takakuwa, S. 2019, ApJ, 871, 36
- Maury et al. (2010) Maury, A. J., André, P., Hennebelle, P., et al. 2010, A&A, 512, 40
- McMullin et al. (2007) McMullin, J. P., Waters, B., Schiebel, D., Young, W., & Golap, K. 2007, Astronomical Data Analysis Software and Systems XVI (ASP Conf. Ser. 376), ed. R. A. Shaw, F. Hill, & D. J. Bell (San Francisco, CA: ASP), 127
- Moe & Di Stefano (2017) Moe, M., & Di Stefano, R. 2017, ApJS, 230, 15
- Momose et al. (1998) Momose, M., Ohashi, N., Kawabe, R., Nakano, T., & Hayashi, M. 1998, ApJ, 504, 314
- Moriarty-Schieven et al. (2006) Moriarty-Schieven, G. H., Johnstone, D., Bally, J., & Jenness, T. 2006, ApJ, 645, 357
- Murillo et al. (2013) Murillo, N. M., Lai, S.-P., Bruderer, S., Harsono, D., & van Dishoeck, E. F. 2013, A&A, 560, 103
- Ochi et al. (2005) Ochi, Y., Sugimoto, K., & Hanawa, T. 2005, ApJ, 623, 922
- Ohashi et al. (1996) Ohashi, N., Hayashi, M., Ho, P. T. P., Momose, M., & Hirano, N. 1996, ApJ, 466, 957
- Ossenkopf & Henning (1994) Ossenkopf, V., & Henning, T. 1994, A&A, 291, 943
- Price et al. (2018) Price, D. J., Cuello, N., Pinte, C., et al. 2018, MNRAS, 481, 3169
- Pyo et al. (2005) Pyo, T.-S., Hayashi, M., Kobayashi, N., Tokunaga, A. T., Terada, H., et al. 2005, ApJ, 618, 817
- Quanz et al. (2007) Quanz, S. P., Henning, Th., Bouwman, J., et al. 2007, ApJ, 668, 359
- Raghavan et al. (2010) Raghavan, D., McAlister, H. A., Henry, T. J., et al. 2010, ApJS, 190, 1
- Reipurth & Aspin (1997) Reipurth, B., & Aspin, C. 1997, AJ, 114, 2700
- Reipurth et al. (2000) Reipurth, B., Yu, K. C., Heathcote, S., Bally, J., & Rodríguez, L. F. 2000, AJ, 120, 1449
- Reipurth et al. (2002) Reipurth, B., Rodríguez, L. F., Anglada, G., & Bally, J. 2002, AJ, 124, 1045
- Reipurth et al. (2014) Reipurth, B., Clarke, C. J., Boss, A. P., et al. 2014, Protostars and Planets VI, 267
- Rodríguez et al. (1998) Rodríguez, L. F., D’Alessio, P., Wilner, D. J., et al. 1998, Nature, 395, 355
- (48) Rodríguez, L. F., Curiel, S., Cantó, J., et al. 2003a, ApJ, 583, 330
- (49) Rodríguez, L. F., Porras, A., Claussen, M. J., et al. 2003b, ApJ, 586, 137
- Saito et al. (1996) Saito, M., Kawabe, R., Kitamura, Y., & Sunada, K. 1996, ApJ, 473, 464
- Sault et al. (1995) Sault, R. J., Teuben, P. J., & Wright, M. C. H. 1995, Astronomical Data Analysis Software and Systems IV, ASP Conference Series, Vol. 77, R. A. Shaw, H. E. Payne, & J. J. E. Hayes, eds., p.433
- Schöier et al. (2005) Schöier, F. L., van der Tak, F. F. S., van Dishoeck E. F., & Black, J. H. 2005, A&A, 432, 369
- Shi et al. (2012) Shi, J. M., Krolik, J. H., Lubow, S. H., & Hawley, J. F. 2012, ApJ, 749, 118
- Snell et al. (1980) Snell, R. L., Loren, R. B., & Plambeck, R. L. 1980, ApJ, 239, L17
- Stojimirović et al. (2006) Stojimirović, I., Narayanan, G., Snell, R. L., & Bally, J. 2006, ApJ, 649, 280
- Takakuwa et al. (2004) Takakuwa, S., Ohashi, N., Ho, P. T. P., et al. 2004, ApJ, 616, L15
- Takakuwa & Kamazaki (2011) Takakuwa, S., & Kamazaki, T. 2011, PASJ, 63, 921
- Takakuwa et al. (2012) Takakuwa, S., Saito, M., Lim, J., et al. 2012, ApJ, 754, 52
- Takakuwa et al. (2014) Takakuwa, S., Saito, M., Saigo, K., et al. 2014, ApJ, 796, 1
- Takakuwa et al. (2017) Takakuwa, S., Saigo, K., Matsumoto, T., et al. 2017, ApJ, 837, 86
- Tang et al. (2014) Tang, Y.-W., Dutrey, A., Guilloteau, S., et al. 2014, ApJ, 793, 10
- Tang et al. (2016) Tang, Y.-W., Dutrey, A., Guilloteau, S., et al. 2016, ApJ, 820, 19
- Tobin et al. (2013) Tobin, J. J., Chandler, C. J., Wilner, D. J., et al. 2013, ApJ, 779, 93
- Tobin et al. (2015) Tobin, J. J., Dunham, M. M., Looney, L. W., et al. 2015, ApJ, 798, 61
- Tobin et al. (2016) Tobin, J. J., Looney, L. W., Li, Z.-Y., et al. 2016, ApJ, 818, 73
- Uchida et al. (1987) Uchida, Y., Kaifu, N., Shibata, K., et al. 1987, PASJ, 39, 907
- Wilner & Welch (1994) Wilner, D. J., & Welch, W. J. 1994, ApJ, 427, 898
- Vorobyov & Basu (2006) Vorobyov, E. I., & Basu, S. 2006, ApJ, 650, 956
- Young et al. (2015) Young, M. D., Baird, J. T., & Clarke, C. J. 2015, MNRAS, 447, 2907