D-VPnet: A Network for Real-time Dominant Vanishing Point Detection in Natural Scenes
Abstract
As an important part of linear perspective, vanishing points (VPs) provide useful clues for mapping objects from 2D photos to 3D space. Existing methods are mainly focused on extracting structural features such as lines or contours and then clustering these features to detect VPs. However, these techniques suffer from ambiguous information due to the large number of line segments and contours detected in outdoor environments. In this paper, we present a new convolutional neural network (CNN) to detect dominant VPs in natural scenes, i.e., the Dominant Vanishing Point detection Network (D-VPnet). The key component of our method is the feature line-segment proposal unit (FLPU), which can be directly utilized to predict the location of the dominant VP. Moreover, the model also uses the two main parallel lines as an assistant to determine the position of the dominant VP. The proposed method was tested using a public dataset and a Parallel Line based Vanishing Point (PLVP) dataset. The experimental results suggest that the detection accuracy of our approach outperforms those of state-of-the-art methods under various conditions in real-time, achieving rates of 115fps.
keywords:
dominant vanishing point , feature line-segment proposal unit (FLPU) , natural scenes , MobileNet v2 , YOLO1 Introduction
The vanishing point (VP) is the intersection of two parallel lines on an image from the viewpoint of linear perspective. VP detection has attracted great attention in various research fields, such as camera calibration [1], 3D reconstruction [2], pose estimation [3], depth estimation [4], lane departure warning (LDW) [5] and simultaneous localization and mapping (SLAM) [6]. Also, it can be used to enhance the composition of photographers’ work through image re-targeting [7], as well as provide feedback to photographers during the photographic creation [8].
Traditional VP detection methods mainly focus on man-made or indoor environments , where the line segments detected from the images are either orthogonal or parallel to the direction of gravity. In these techniques, a large number of lines or contours are firstly detected, and then the constructed features are clustered to estimate the VPs [9]. However, when applied to more complex natural scenes, traditional methods may suffer from ambiguous information generated by irregular line directions. Besides, the determination of the dominant VP in natural scenes is also a difficult problem.
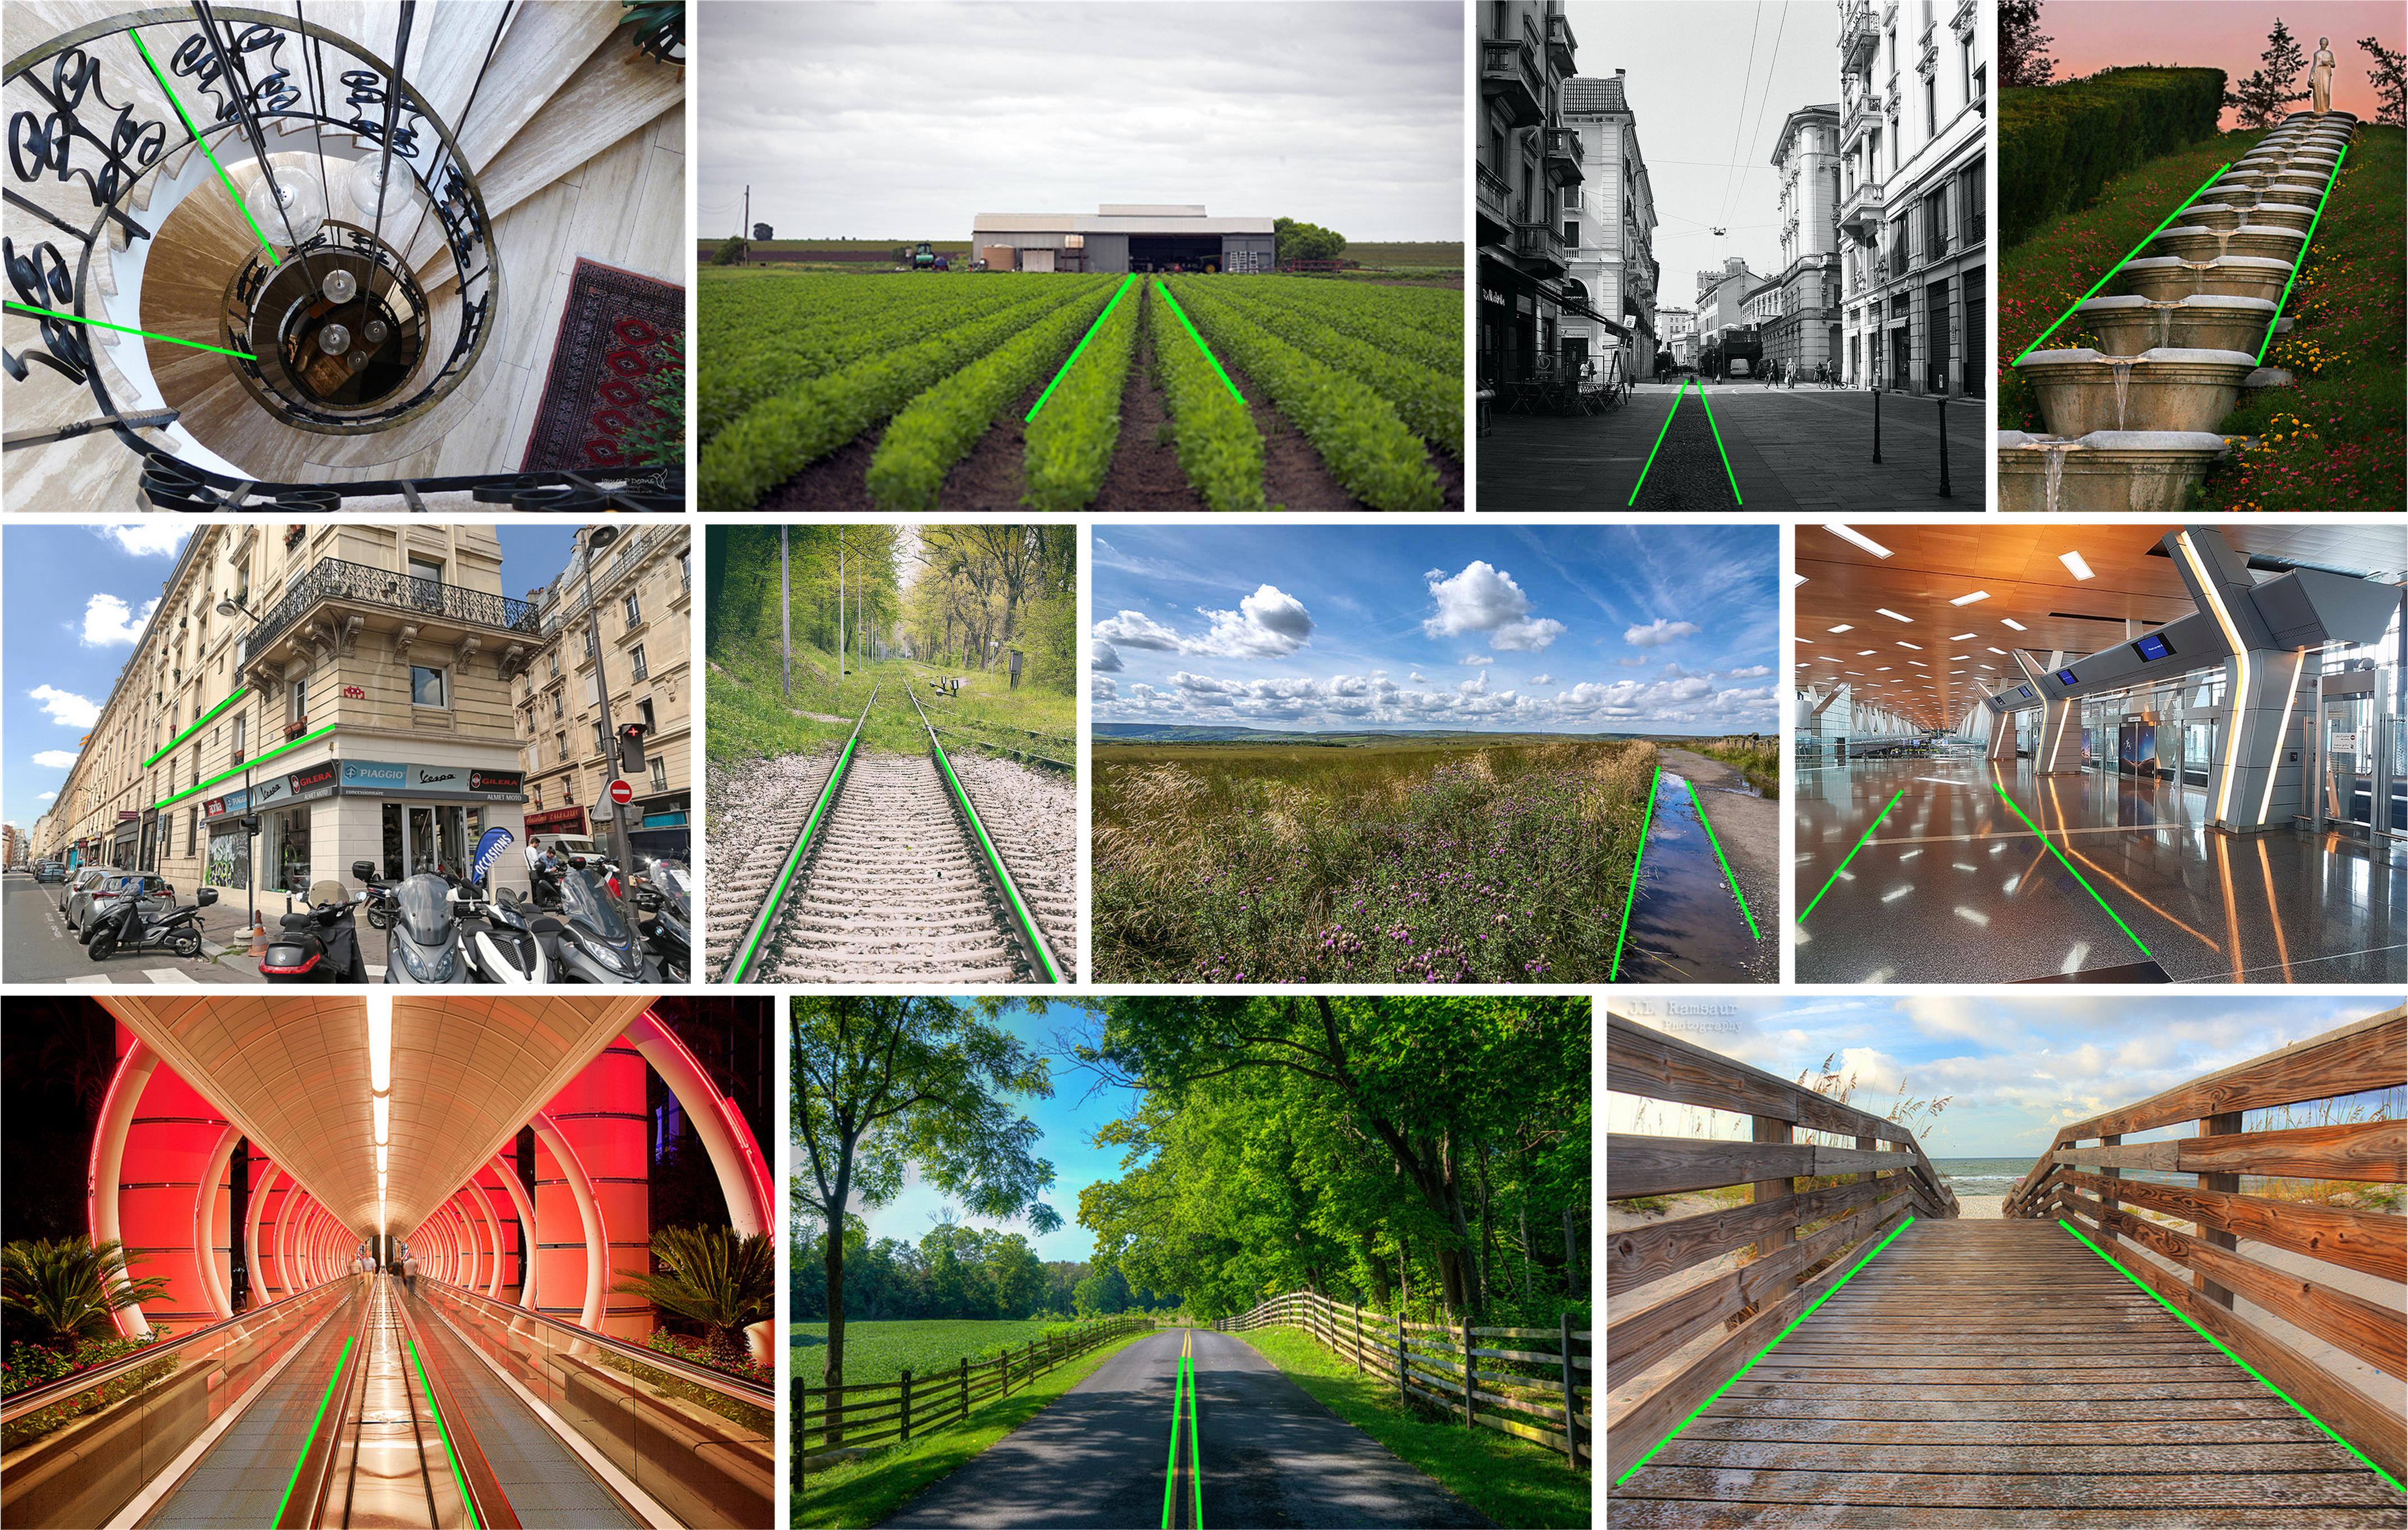
Specifically, a dominant VP is defined if it (i) is associated with the major geometric structures of the scene, and (ii) conveys a strong impression of 3D space or depth to the viewers [10]. As illustrated in Fig. 1, the location of dominant VP provides important clues about the overall composition of the scene. These are utilized by photographers to optimize artistic creation and can be applied to lane detection in Advanced Driver Assistance Systems (ADAS) [11]. Furthermore, there is a strong demand for real-time photo composition creation for many general mobile phone users. Recently, Zhou et al. proposed a novel method for dominant VP detection by combining a contour-based edge detector with J-Linkage [10]. Zhang et al. derived a semantic-texture fusion network to detect the dominant VP in wild scenes [12]. Unfortunately, the above methods cannot achieve real-time processing because edge detection and clustering procedure are time consuming.
In this paper, a real-time D-VPnet model for detecting the dominant VP in natural scenes is proposed. In particular, we use feature line-segment proposal unit (FLPU)-based CNN to directly predict the location of the dominant VP and utilize the information of the two main parallel lines to further improve the accuracy of dominant VP detection. The main steps are as follows. Firstly, we employ the MobileNet v2 to extract the structural features from the input image. Secondly, a three-sized grid cell detection network is developed to quantitatively estimate the probability of a dominant VP being present for each cell. Finally, we determine the location of the final dominant VP through the largest confidence score. In the experimental analysis, we investigate the method’s effectiveness systematically on a public dataset and our constructed PLVP dataset.
The main contributions are as follows:
-
1.
We propose a single-shot deep CNN with FLPU to locate the dominant VP in natural scenes. By combining the dominant VP features and main parallel lines features, the proposed method significantly outperforms the traditional methods in accuracy.
-
2.
Our approach can process 115 fps on an RTX 2080 Ti GPU, which is several times faster than state-of-the-art methods.
-
3.
In order to evaluate the performance of different algorithms more accurately, we have created a manually labeled dataset including 5,776 natural scene images.
2 Related work
We firstly introduce some traditional algorithms about VPs detection. Secondly, in consideration of using a single-shot deep CNN architecture, some state-of-the-art one-stage object detection methods are presented.
2.1 VPs Detection
Existing VP detection methods can be divided into two categories: line-based algorithms and CNN-based algorithms. In traditional line-based algorithms, all the line segments extracted from the image are clustered into one or three main directions for VP detection. Zhang et al. [13] used the RANdom SAmple Consensus (RANSAC) to cluster edges into three orthogonal line directions and find VPs based on the Manhattan world assumption. Moon et al. [14] applied a harmony search (HS) algorithm to detect VPs for autonomous driving, while Lezama et al. [9] utilized statistical significance to find the triplet of VPs. Antunes et al. [15] focused on the radial distortion of images and detected VPs from a single Manhattan image.
More recently, optimal techniques were introduced into VP detection. Xu et al. [16] weighted the contribution of each line segment pair in the cluster towards the VP estimation and proposed a closed-form VP. Yang et al. [17] firstly obtained the salient texture information of the image and then used a voting approach to determine the VP. In addition, Mirzaei et al. [18] developed an analytical approach for computing the globally optimal estimates of orthogonal VPs . However, all the above line-based algorithms are focused on man-made environments, which consist of numerous line segments. In contrast, we focus on the dominant VP detection in natural scenes, in which the number of line segments related to the dominant VP may be very small compared to irrelevant edges. Note that little attention has been paid to natural scene dominant VPs, which provide important clues to the scene’s geometry composition. Although Zhou et al. [10] addressed this problem by exploiting global structures in natural scenes via contour detection, their algorithm still suffers from ambiguous information due to numerous irrelevant edges and image noise.
In addition, there is an increasing interest in using Convolutional Neural Networks (CNN) for VP detection. Kluger et al. [19] used a CNN to optimize line segment extraction, which is the key step of VP detection. Zhai et al. [20] exploited a CNN to propose candidate horizon lines and then scored them for VP detection. More recently, Zhang et al. [12] developed a semantic-texture fusion network to detect the dominant VP in natural landscape images. This network includes two branches, which can be used to extract textural features and semantic features. Furthermore, the Squeeze-and-Excitation block was adopted to boost the representational power of the network. Similar to the line-based algorithms, these methods are time-consuming due to the large number of line-segment or contour extraction processing. Besides, numerous irrelevant lines or contours also affect the accuracy of VP detection.
2.2 CNN-based one-stage Object Detection
In recent years, one-stage detectors have been widely studied and used for 2D object localization. One-stage approaches for object detection can directly classify and regress the candidate anchor boxes. Single shot architectures, such as the Single Shot multibox Detector (SSD) [21] and You Only Look Once (YOLO) [22, 23, 24] spurred research interest in this field. Although YOLO v3 [24] has already achieved real-time performance on GPUs, it is still hard to run on mobile devices. Recently efficient neural networks were proposed to allow the detection of objects on mobile devices. An SSD with MobileNet v2 [25] as its backbone already achieved better accuracy than YOLO v2 but with 10 times fewer parameters. ShuffleNet v2 [26] and Pelee [27] are also among the best of such solutions. Based on the accuracy and fast speed of these methods, in [28] the SSD was extended to predict the object’s identity, while in [29] YOLO was extended to predict a 6D object pose, and in [30] the RPN was extended to detect traffic lines. Previous research shows that the backbone selection has great influence on the performance of deep-learning based object detection algorithms. VGG [31] and ResNet [32] are widely used as backbones for generic object detection. For specific applications, we can also try some other feature extraction networks, such as stacked hourglass network [33], unsupervised local deep-feature alignment (LDFA) [34] and hierarchical deep word embedding (HDWE) [35].
3 Methodology
Before designing the dominant VP detection algorithm, we consider the question: “How do humans judge the position of the dominant VP?” The common practice of humans is to first find the two main parallel lines on the image, and then determine the intersection of the two lines to determine the position of the dominant VP. Inspired by human experience in determining the dominant VP, the algorithm also introduces the main parallel line detection link to help determine the position of the dominant VP and improve the accuracy of detection. We now describe our network architecture and explain various aspects of our approach in detail.
The main challenge of the algorithm is to design a CNN that can directly estimate the coordinates of the dominant VP. As mentioned above, the dominant VP is highly dependent on the main parallel lines. Therefore, the CNN network designed in this paper comprehensively utilizes the dominant VP estimation information and the information of main parallel lines to obtain more accurate estimation results. For specific applications, the modification of the loss function is a commonly used technique for optimization of deep learning algorithms [36]. The earlier version of our algorithm designed a loss function only concerning about the offsets between predicted dominant VP coordinates and manually labeled ground-truth coordinates, and then used this loss function to train the dominant VP detection network. But we have found that two main parallel lines related to the dominant VP is also a very valuable clue for detecting dominant VP. Two related main parallel lines are estimated based on the information of the predicted dominant VP. The loss function was modified by adding deviation information between estimated main parallel lines and manually labeled ground-truth parallel lines. Therefore, the prediction accuracy of the dominant VP has been improved. The main difference between the proposed algorithm and other algorithms is that there is no explicit edge or contour extraction process. The algorithm only uses edge or contour information implicitly to estimate the dominant VP and main parallel lines through end-to-end learning.
3.1 Network architecture
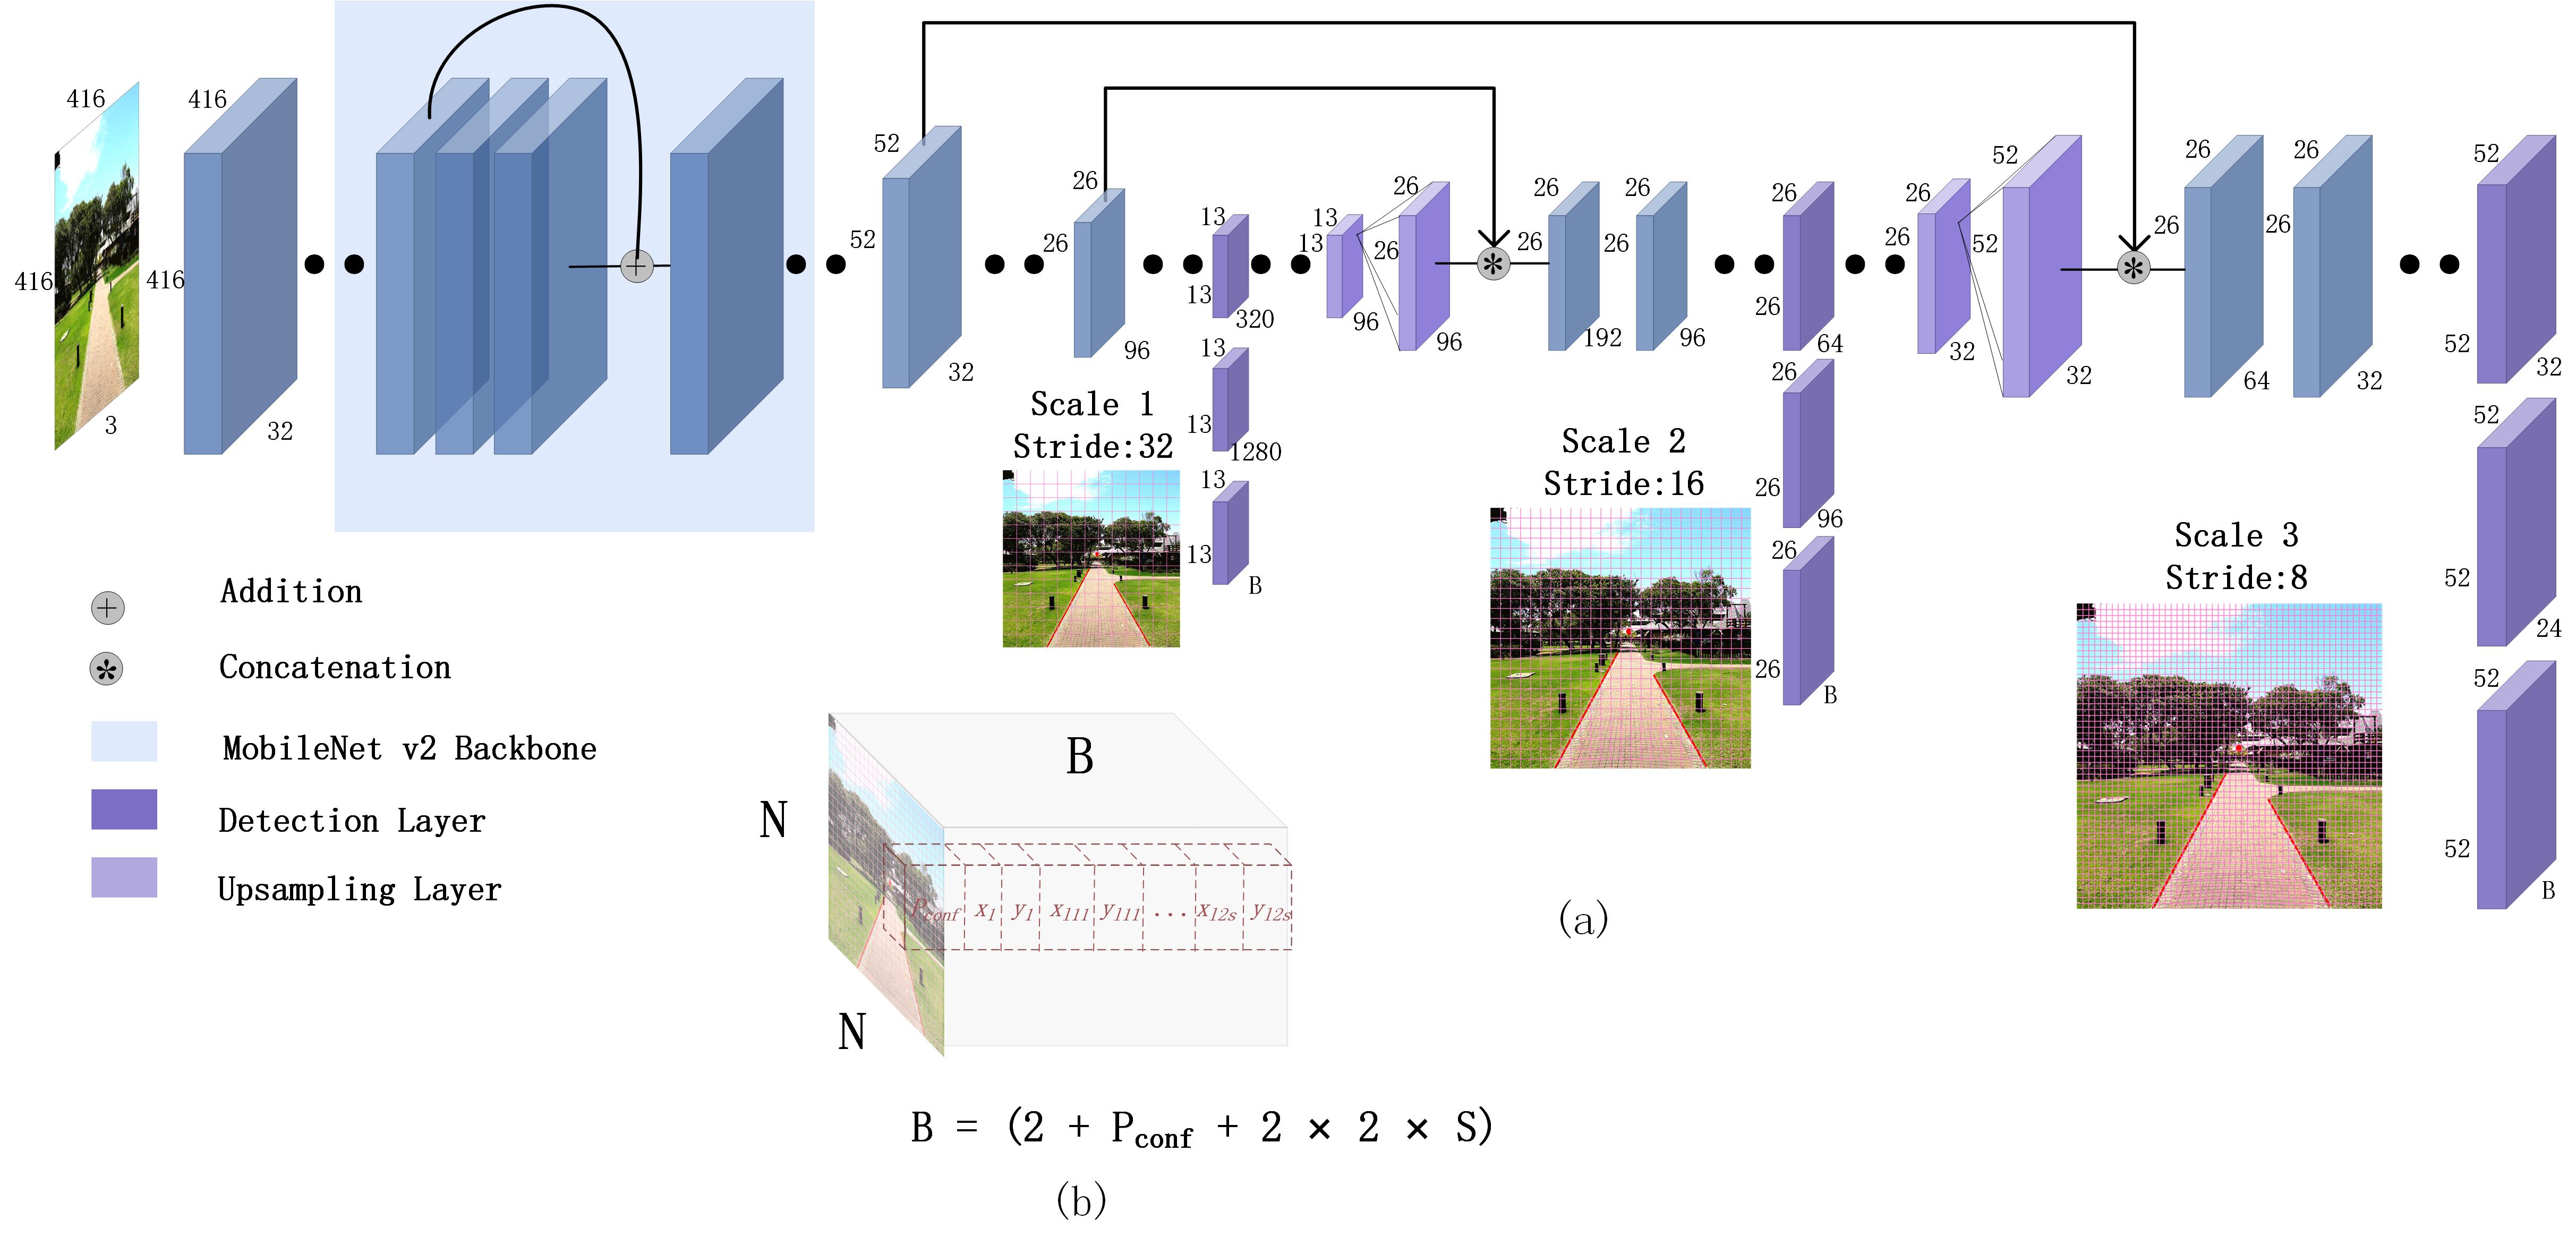
Inspired by single-shot object recognition networks (such as SSD and YOLO), our method divides the input image into grid cells. Each grid cell predicts whether there is a dominant VP, and the prediction’s values include the coordinates of the dominant VP, the predicted confidence score and the coordinates of the main parallel lines predicted by FLPU. Previous literature shows that multi-scale processing is an important technique in various image processing and computer vision applications, such as image quality assessment [37, 38, 39], deep learning based object detection [24] and semantic segmentation [40]. In view of the excellent performance of multi-scale processing, our network predicts VP at three different scales, which are obtained by downsampling the dimensions of the input image by 32, 16 and 8 respectively. Finally, we use the non-maximum suppression method to obtain the optimal coordinates of the dominant VP. In order to achieve a balance between accuracy and speed, our D-VPnet uses a pre-trained MobileNet v2 [25] as the backbone, the details which are shown in Table 1. Overall, the output of our network at each scale is a tensor of , where , represents the number of points discretized by the main parallel line, and is the confidence score that the grid contains the dominant VP. The details are shown in Fig. 2.
| Input | Operator | t | c | n | s |
|---|---|---|---|---|---|
| conv2d | - | 32 | 1 | 2 | |
| bottleneck | 1 | 16 | 1 | 1 | |
| bottleneck | 6 | 24 | 2 | 2 | |
| bottleneck | 6 | 32 | 3 | 2 | |
| bottleneck | 6 | 64 | 4 | 2 | |
| bottleneck | 6 | 96 | 3 | 1 | |
| bottleneck | 6 | 160 | 3 | 2 | |
| bottleneck | 6 | 320 | 1 | 1 | |
| bottleneck | 6 | 1280 | 1 | 1 | |
| yolo | - | 320 | 3 | - | |
| detection | - | B | 1 | - | |
| yolo | - | 64 | 3 | - | |
| detection | - | B | 1 | - | |
| yolo | - | 24 | 3 | - | |
| detection | - | B | 1 | - |
3.2 Feature Line-segment Proposal Unit
As mentioned above, if all edges and contours in the image are extracted explicitly, irregular edges and contours may contain a large amount of ambiguous information, which will pose challenges in estimating the dominant VP. Therefore, the FLPU is proposed to solve the above problems. In general, there may be many parallel lines in a graph that can be used to detect the dominant VP, but it is not necessary to find all the main parallel lines, as only one representative set is needed.
In the estimation of the main parallel line segment, we use multi-discrete point prediction instead of direct line segment estimation. When the number of discrete points is sufficient, the estimated parallel line is more reliable than the method of estimating the parallel line using the starting and end points. As illustrated in Fig. 2, we divide the pair of parallel lines into segments; therefore, each parallel line can be expressed as a sequence of 2D coordinates, namely ,where denotes the coordinate of the start-index for parallel line , and represents its end-index coordinate. Similarly, a line proposal (i.e. straight line) can be written as .
As proven in YOLO v2 and v3, prediction of the offset to the cell is a stabilized and accurate way in 2D coordinate regression, so we used the method of coordinate prediction of YOLO v3. Thus, the predicted point is defined as
| (1) | |||
| (2) |
where is a sigmoid function in the case of dominant VP and an identity function in the case of parallel line segment. is the coordinate of the top-left corner of the associated grid cell.
3.3 Loss Function
To train our complete network, we minimize the following loss function.
| (3) |
| (4) |
where and denote the coordinate losses of the dominant VP, the left line, the right line, the confidence loss and line’s coordinate error, respectively. We use the mean-squared error for the VP coordinate loss and line loss, while as suggested in YOLO v3 [24], confidence, is predicted through logistic regression. For the cells that do not contain VP, we set to 0.5, and for the cell that contains VP we set to 1. and are used for balancing the training between the accuracy and coverage of the VP. Here, we set to , where is the slice number of the line.
3.4 Implementation Details
We implemented our method in Python using Pytorch 0.4 and CUDA 10 and ran it on an i7-8700K@3.7GHz with dual NVIDIA RTX 2080 Ti. We used our PLVP training dataset, which contains 4,382 images, and both the PLVP test portion of the dataset as well as Flickr in [10] as the test datasets. All input images were reshaped to 416 416 for both training and testing. We initialized the parameters of our backbone network with a pre-trained MobileNet v2, which was pre-trained on ImageNet classification. We used stochastic gradient descent (SGD) for optimization and started with a learning rate of 0.001 for the backbone and 0.01 for the rest of the network. We divided the learning rate by 10 every 20 epochs, with a momentum of 0.9. We also used dataset augmentation with random flip and image rotations. Our code will be made publicly available for the sake of reproducibility.
4 Experiments
In this section, we first introduce the construction of our own PLVP dataset, and then illustrate a comprehensive performance study of our proposed method and compare it to state-of-the-art algorithms using Zhou’s public dataset and our own PLVP dataset. Subsequently, we quantitatively analyze the influence of each part of the model on performance through an ablation study.
4.1 Dataset construction
In order to evaluate the performance of dominant VP detection algorithms, we need to test the proposed approach and state-of-the-art methods on public datasets. At present, there are three kinds of public datasets, i.e., the York Urban Dataset (YUD) [41], the Eurasian Cities Dataset (ECD) [42] and Zhou’s dataset [10], which can be used to evaluate VP detection algorithms. We found that these public datasets have certain problems. The purpose of this paper is to evaluate the performance of the algorithm for dominant VP detection, but the YUD and ECD datasets are only suitable for evaluation of multiple VPs in urban scenes. Although Zhou’s dataset can be used to evaluate dominant VP detection algorithms, the number of images in the dataset is small, making it difficult to obtain objective evaluation results. In view of the abovementioned problems with the public datasets, we have utilized Flickr and Aesthetic Visual Analysis (AVA) [43] tools to construct a new dataset that can be used to evaluate different algorithms comprehensively and objectively.
Without using the information of two main parallel lines, the location of the dominant VP cannot be labeled accurately. Therefore, we first label the main parallel lines on the image, which are a set of parallel lines representing the main structure in the scene, denoted as and . Then, the location of the dominant VP can be calculated as . To label the main parallel lines, we follow three principles: First, because we adopt the CNN object detection architecture in our model, and this architecture cannot detect dominant VPs outside the images, we remove the pictures where the dominant VP lies outside the image. Second, since our goal is to establish a dataset for the evaluation of dominant VP detection, we remove images with multiple vanishing points. Finally, the labeled starting and ending points must be in the main part of the image structure. In the image content retrieval, we obtained more than 20,000 images using keywords, such as vanishing point, landscape, road, urban, from Flickr, and more than 5,000 images from the AVA dataset. Based on the above principles, we obtained our PLVP dataset, which includes 5,776 labeled images, from which 4,382 images were used as the training set and 1,394 images were used as the test set. Some samples of our dataset are shown in Fig. 1.
4.2 Metrics
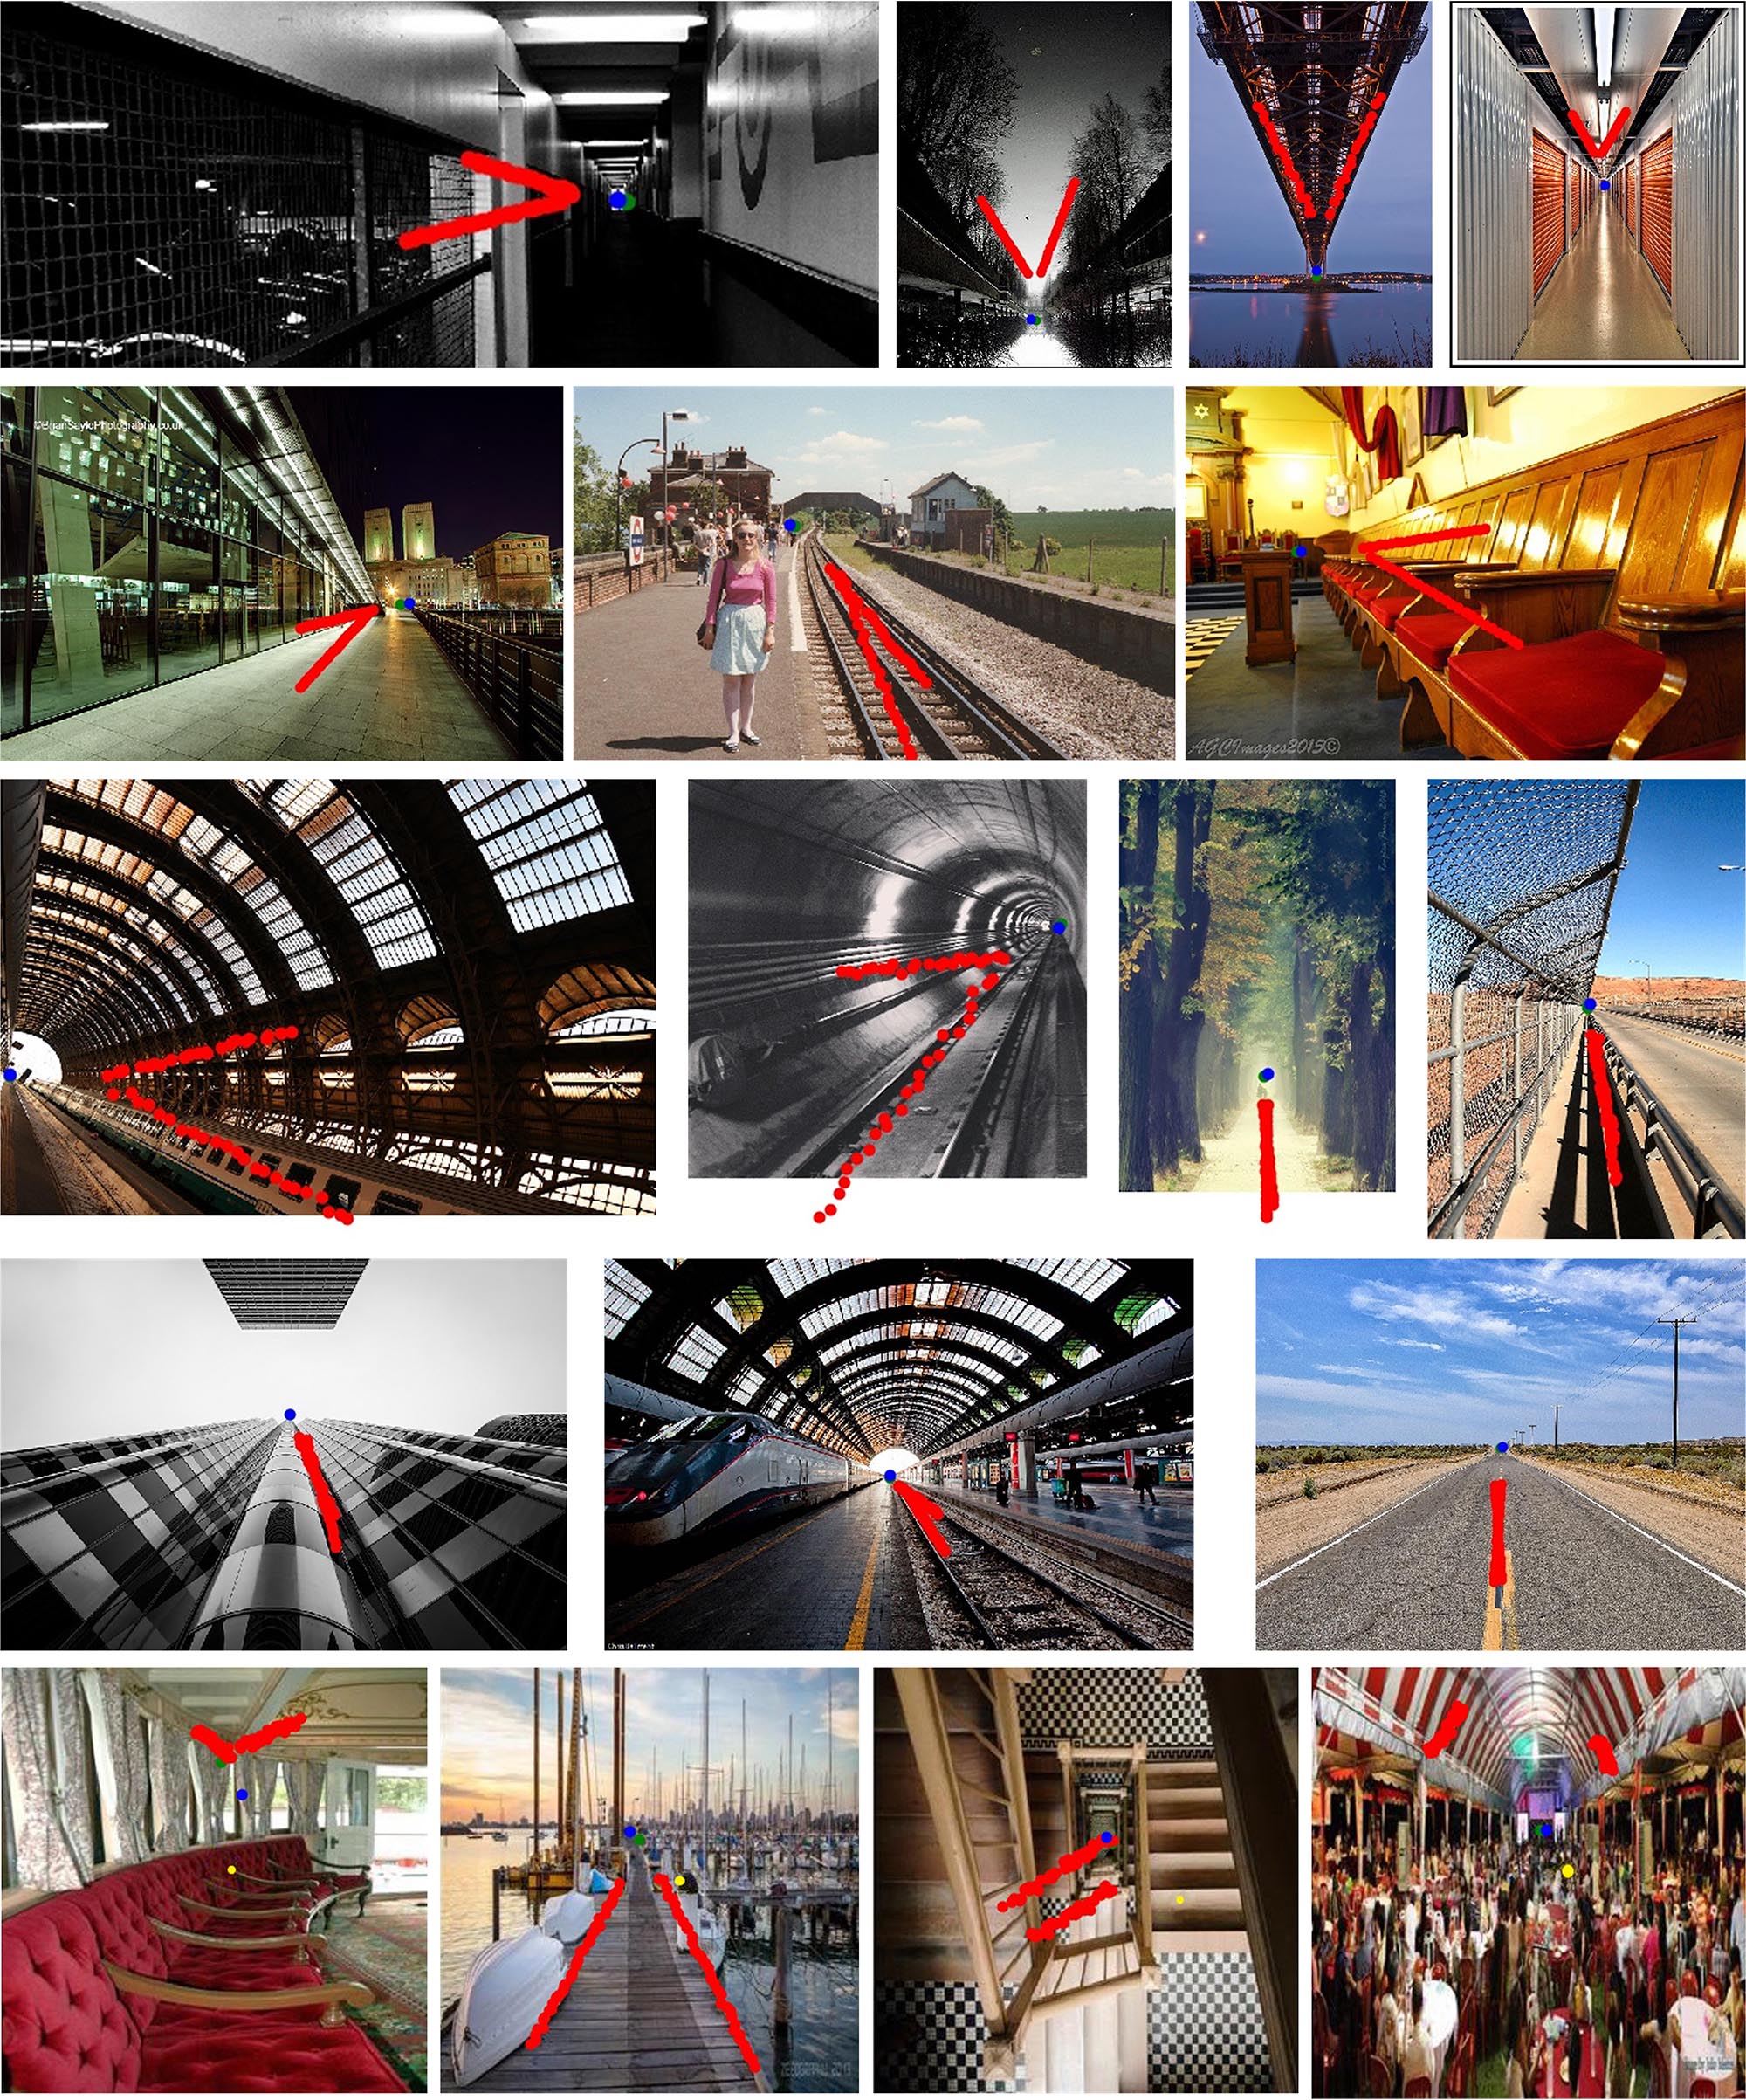
As mentioned earlier, only Zhou’s and our dataset can be used to evaluate the performance of the dominant VP algorithm. However, these two datasets partially overlap, so we only chose the Flickr part of Zhou’s dataset for testing. In addition, we deleted some of the vanishing points outside of the images in Zhou’s dataset, finally obtaining 840 images that met the requirements. Some dominant VP detection results are illustrated in Fig. 3.
The metric of consistency error is often utilized to evaluate the performance of VPs detectors, and is defined as follows:
| (5) | |||
| (6) |
where is a measure of consistency between edge and VP hypothesis , is the root mean square (RMS) distance from all points on to a line l, such that l passes through v and minimizes the distance. is the number of points on , while is the perpendicular distance from a point p to a line l. Let be the set of ground truth edges, and be the consistency error of a detection .
4.3 Comparisons
4.3.1 Comparisons with State-of-the-art
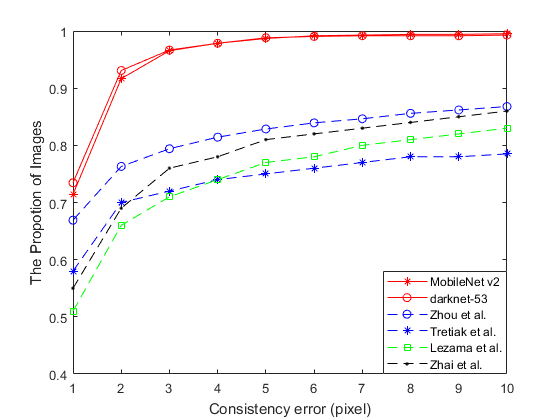
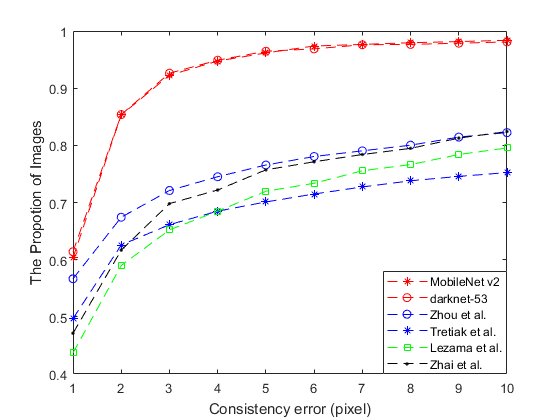
Using Zhou’s dataset, we compare the effectiveness of our method with four competitive approaches. The test results indicate that the accuracy of our method exceeds the best results obtained using Zhou’s method, as shown in Fig. 4(a). In particular, with the proposed method, the consistency error of 71.43% of the test dateset was less than or equal to 1, and the consistency error of 91.67% of the images was less than or equal to 2. Our method achieved a consistency error of less than or equal to 5, in 98.69% of the images. In contrast, using Zhou’s method, which provided the best results, only 64% of the images had a consistency error of less than or equal to 1, and 77% image had a consistency error of less than or equal to 2. The image coverage for a consistency error of less than or equal to 5 was 84%.
The comparison of the proposed method and four state-of-the-art methods on our PLVP dataset are shown in Fig. 4(b). When the consistency error is less than or equal to 1, our algorithm has a 4% higher image coverage than Zhou’s method, which gave the best results of the other methods. For a consistency error less than or equal to 5, the image coverage of our technique was 21% higher than that of the best Zhou’s method. The results of the comparison analysis of the two databases show that the proposed method is significantly better than the existing state-of-the-art methods.
| backbones | CE | CE | CE | GPU-Fps | CPU-Runtime |
|---|---|---|---|---|---|
| ResNet-50 | 69.17% | 90.6% | 95.36% | 20.3fps | 300ms |
| DarkNet-53 | 73.45% | 93.1% | 96.67% | 79.8fps | 229ms |
| MobileNet v1 | 43.81% | 73.93% | 89.05% | 106.3fps | 119ms |
| Pelee | 63.6% | 88.4% | 93.2% | 110.6fps | 80.1ms |
| Sharp-Pelee | 71.5% | 91.7% | 95.9% | 102.4fps | 82.5ms |
| MobileNet v2 | 71.43% | 91.67% | 96.55% | 115.2fps | 79.2ms |
4.3.2 Comparisons with different backbones
We experimented using different backbones to increase the precision and efficiency of our model. As can be seen from Table 2, when the consistency error is less than or equal to 1, the model accuracy using darknet-53 as the backbone is the highest, but only 2.02% higher than the accuracy of when using MobileNet v2 as the backbone. However, the latter runs 2.5 times faster than the former. The test results in our PLVP data set show that the former is only 1.06% higher than the latter, as shown in Fig. 4(b). When balancing accuracy and speed, we finally decided to use MobileNet v2 as the backbone of the network.
4.4 Ablation Study
The FLPU and the 3-scale detector are two important branches in our D-VPnet model. Therefore, we will quantitatively analyze the impact of these brancdiffhes on the performance of the detection network.
4.4.1 FLPU
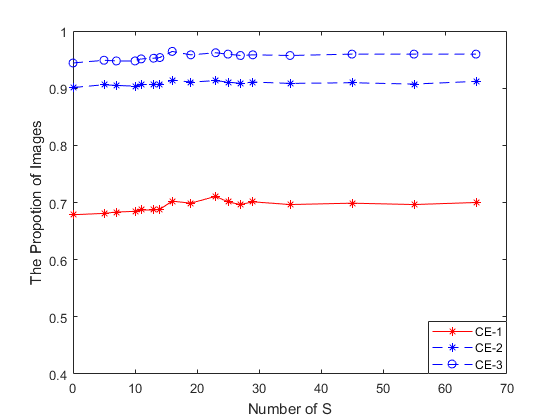
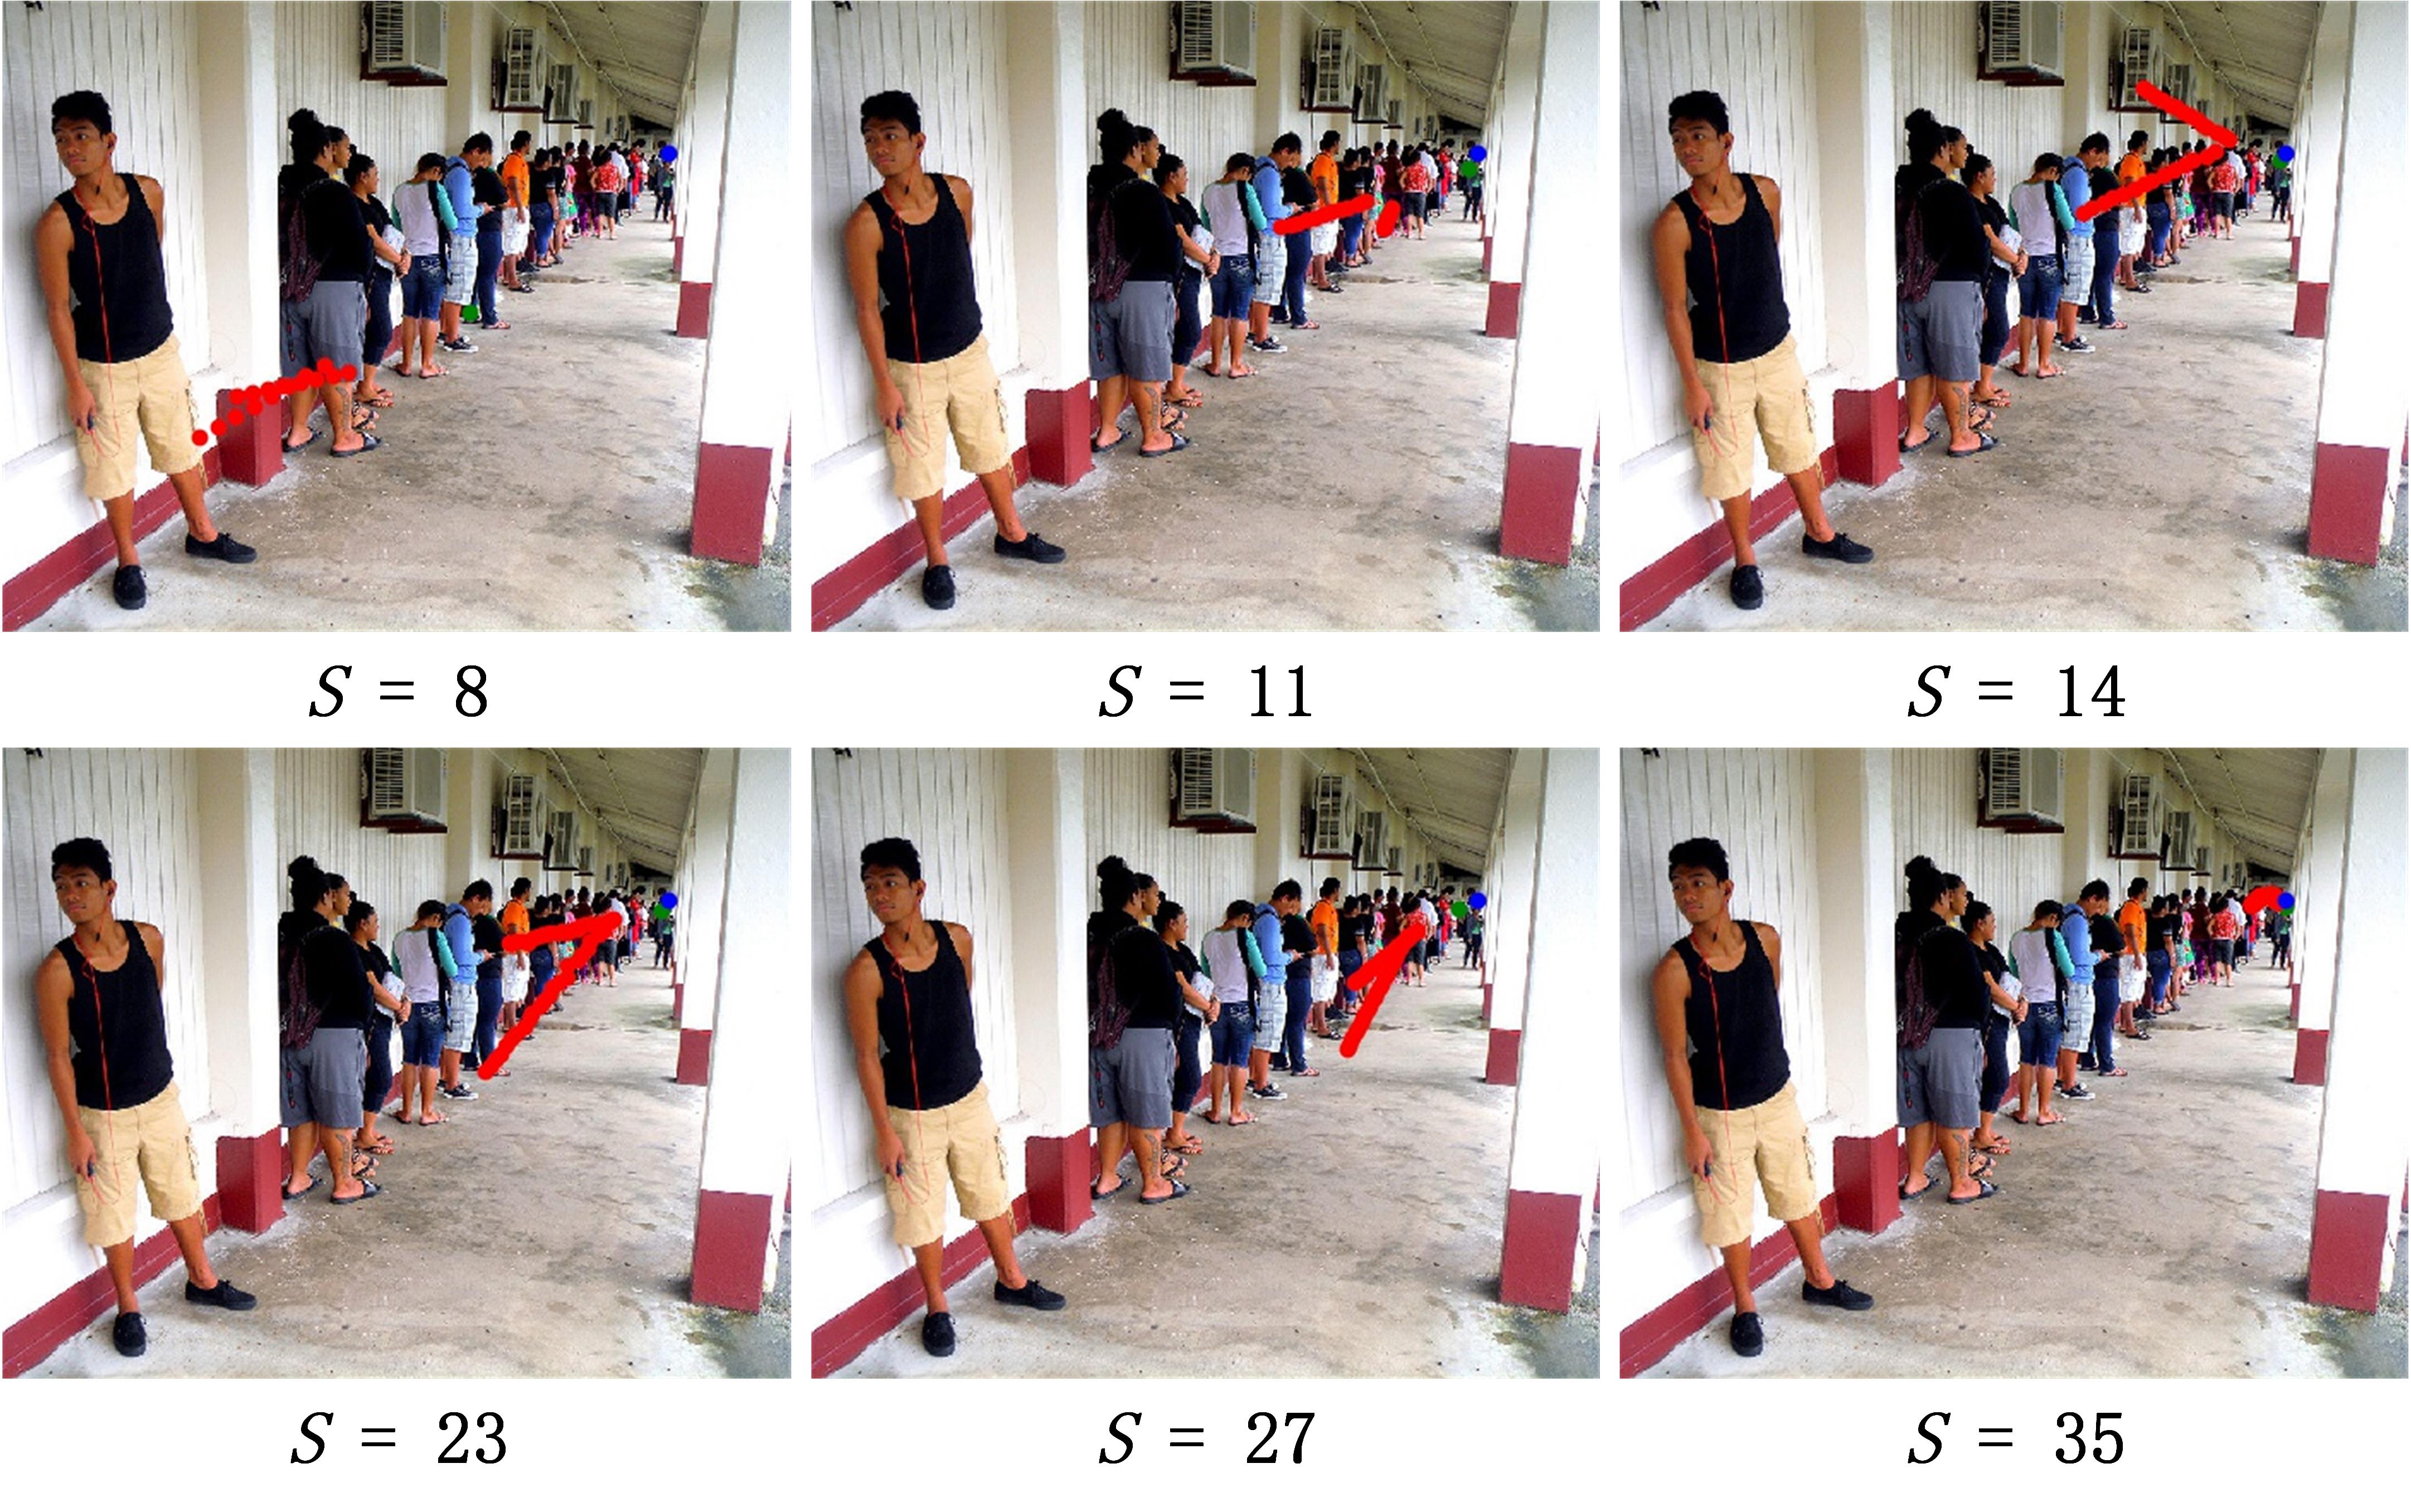
In the FLPU, the optimal selection of line segment number is crucial. The influence of the different values of on the performance of the model is shown in Fig. 5 When the consistency error (CE), the image coverage is close to 100%, and the contribution of the FLPU is of little significance. Therefore, we only present the results of CE, CE and CE. It can be seen from Fig. 5 that the accuracy gradually increases with the increase of S, but when exceeds a certain value, the accuracy no longer rises and instead falls. The effect on the actual detection is shown in Fig. 6. When is small (), the correlation between the dominant VP predicted by the network and the main parallel lines predicted by the FLPU is unstable. When the value of is too large (), the main parallel lines may not be detected, so corresponding information cannot be effectively utilized to assist in predicting the position of the dominant VP. Through a large number of tests, it was found that the model yields better detection results when .
| Scales | CE | CE | CE |
|---|---|---|---|
| Scale-1 | 65.83% | 90.0% | 95.71% |
| Scale-2 | 63.5% | 88.3% | 93.4% |
| Scale-1,2 | 68.45% | 90.95% | 95.6% |
| Scale-3 | 57.26% | 84.76% | 92.62% |
| Scale-1,2,3 | 71.07% | 91.30% | 96.19% |
4.4.2 3-Scale detector
In order to verify the effectiveness of the multiscale processing, we conducted several comparative experiments. Firstly, three single-scale object detection experiments were implemented, and the results showed that the model using scale-1 features was better. Subsequently, the experiments on the combination of scale-1and scale-2 were performed, and the results demonstrated that the model using two-scale features slightly outperformed the best single-scale model. Finally, three-scale combination experiments were conducted, and it was found that the detection results of the three-scale combination model were significantly better than those models with single-scale and two-scale combination. The performance of the 3-scale detector on the dominant VP detection is presented in Table 3.
5 Conclusions
Dominant VP detection is a challenging problem of significant importance, especially for the photographic creation and lane detection. In this paper, we present a D-VPnet model for dominant VP detection in natural scenes. Experimental results show that the proposed method achieves high accuracy and robustness under various conditions. In addition, our approach achieves 115 fps on an RTX 2080 Ti GPU which is several times faster than that of traditional methods. Therefore, it is suitable for many real-time applications, such as autonomous navigation in unstructured road scenes. In the future, we plan to apply the proposed algorithm to real time pose estimation and SLAM. Moreover, we will make our PLVP dataset publicly available. Whether the proposed method can be applied to other types of images (e.g., computer graphic images [44]) is an interesting topic and we plan to construct several special datasets to test the extension performance of our proposed method. Note that our model is based on an object detection CNN architecture. Therefore, one limitation of our approach is that it cannot be used to detect dominant VPs outside the images.
Acknowledgment
This work is supported by the National Natural Science Foundation of China (No. 61573253), and National Key R&D Program of China under Grant No. 2017YFC0306200.
References
- [1] B. Caprile, V. Torre, Using vanishing points for camera calibration, International journal of computer vision 4 (2) (1990) 127–139.
- [2] E. Guillou, D. Meneveaux, E. Maisel, K. Bouatouch, Using vanishing points for camera calibration and coarse 3d reconstruction from a single image, The Visual Computer 16 (7) (2000) 396–410.
- [3] J.-G. Wang, E. Sung, Pose determination of human faces by using vanishing points, Pattern Recognition 34 (12) (2001) 2427–2445.
- [4] S. Battiato, S. Curti, M. La Cascia, M. Tortora, E. Scordato, Depth map generation by image classification, in: Three-Dimensional Image Capture and Applications VI, Vol. 5302, International Society for Optics and Photonics, 2004, pp. 95–105.
- [5] J. H. Yoo, S.-W. Lee, S.-K. Park, D. H. Kim, A robust lane detection method based on vanishing point estimation using the relevance of line segments, IEEE Transactions on Intelligent Transportation Systems 18 (12) (2017) 3254–3266.
- [6] Y. Ji, A. Yamashita, H. Asama, Rgb-d slam using vanishing point and door plate information in corridor environment, Intelligent Service Robotics 8 (2) (2015) 105–114.
- [7] S. Bhattacharya, R. Sukthankar, M. Shah, A framework for photo-quality assessment and enhancement based on visual aesthetics, in: Proceedings of the 18th ACM international conference on Multimedia, ACM, 2010, pp. 271–280.
- [8] L. Yao, P. Suryanarayan, M. Qiao, J. Z. Wang, J. Li, Oscar: On-site composition and aesthetics feedback through exemplars for photographers, International Journal of Computer Vision 96 (3) (2012) 353–383.
- [9] J. Lezama, R. Grompone von Gioi, G. Randall, J.-M. Morel, Finding vanishing points via point alignments in image primal and dual domains, in: Proceedings of the IEEE Conference on Computer Vision and Pattern Recognition, 2014, pp. 509–515.
- [10] Z. Zhou, F. Farhat, J. Z. Wang, Detecting dominant vanishing points in natural scenes with application to composition-sensitive image retrieval, IEEE Transactions on Multimedia 19 (12) (2017) 2651–2665.
- [11] U. Ozgunalp, R. Fan, X. Ai, N. Dahnoun, Multiple lane detection algorithm based on novel dense vanishing point estimation, IEEE Transactions on Intelligent Transportation Systems 18 (3) (2016) 621–632.
- [12] X. Zhang, X. Gao, W. Lu, L. He, Q. Liu, Dominant vanishing point detection in the wild with application in composition analysis, Neurocomputing 311 (2018) 260–269.
- [13] L. Zhang, H. Lu, X. Hu, R. Koch, Vanishing point estimation and line classification in a manhattan world with a unifying camera model, International Journal of Computer Vision 117 (2) (2016) 111–130.
- [14] Y. Y. Moon, Z. W. Geem, G.-T. Han, Vanishing point detection for self-driving car using harmony search algorithm, Swarm and evolutionary computation 41 (2018) 111–119.
- [15] M. Antunes, J. P. Barreto, D. Aouada, B. Ottersten, Unsupervised vanishing point detection and camera calibration from a single manhattan image with radial distortion, in: Proceedings of the IEEE Conference on Computer Vision and Pattern Recognition, 2017, pp. 4288–4296.
- [16] Y. Xu, S. Oh, A. Hoogs, A minimum error vanishing point detection approach for uncalibrated monocular images of man-made environments, in: Proceedings of the IEEE Conference on Computer Vision and Pattern Recognition, 2013, pp. 1376–1383.
- [17] W. Yang, B. Fang, Y. Y. Tang, Fast and accurate vanishing point detection and its application in inverse perspective mapping of structured road, IEEE Transactions on Systems, Man, and Cybernetics: Systems 48 (5) (2018) 755–766.
- [18] F. M. Mirzaei, S. I. Roumeliotis, Optimal estimation of vanishing points in a manhattan world, in: 2011 International Conference on Computer Vision, IEEE, 2011, pp. 2454–2461.
- [19] F. Kluger, H. Ackermann, M. Y. Yang, B. Rosenhahn, Deep learning for vanishing point detection using an inverse gnomonic projection, in: German Conference on Pattern Recognition, Springer, 2017, pp. 17–28.
- [20] M. Zhai, S. Workman, N. Jacobs, Detecting vanishing points using global image context in a non-manhattan world, in: Proceedings of the IEEE Conference on Computer Vision and Pattern Recognition, 2016, pp. 5657–5665.
- [21] W. Liu, D. Anguelov, D. Erhan, C. Szegedy, S. Reed, C.-Y. Fu, A. C. Berg, Ssd: Single shot multibox detector, in: European conference on computer vision, Springer, 2016, pp. 21–37.
- [22] J. Redmon, S. Divvala, R. Girshick, A. Farhadi, You only look once: Unified, real-time object detection, in: Proceedings of the IEEE conference on computer vision and pattern recognition, 2016, pp. 779–788.
- [23] J. Redmon, A. Farhadi, Yolo9000: better, faster, stronger, in: Proceedings of the IEEE conference on computer vision and pattern recognition, 2017, pp. 7263–7271.
- [24] J. Redmon, A. Farhadi, Yolov3: An incremental improvement, arXiv preprint arXiv:1804.02767.
- [25] M. Sandler, A. Howard, M. Zhu, A. Zhmoginov, L.-C. Chen, Mobilenetv2: Inverted residuals and linear bottlenecks, in: Proceedings of the IEEE Conference on Computer Vision and Pattern Recognition, 2018, pp. 4510–4520.
- [26] N. Ma, X. Zhang, H.-T. Zheng, J. Sun, Shufflenet v2: Practical guidelines for efficient cnn architecture design, in: Proceedings of the European Conference on Computer Vision (ECCV), 2018, pp. 116–131.
- [27] R. J. Wang, X. Li, C. X. Ling, Pelee: A real-time object detection system on mobile devices, in: Advances in Neural Information Processing Systems, 2018, pp. 1963–1972.
- [28] W. Kehl, F. Manhardt, F. Tombari, S. Ilic, N. Navab, Ssd-6d: Making rgb-based 3d detection and 6d pose estimation great again, in: Proceedings of the IEEE International Conference on Computer Vision, 2017, pp. 1521–1529.
- [29] B. Tekin, S. N. Sinha, P. Fua, Real-time seamless single shot 6d object pose prediction, in: Proceedings of the IEEE Conference on Computer Vision and Pattern Recognition, 2018, pp. 292–301.
- [30] X. Li, J. Li, X. Hu, J. Yang, Line-cnn: End-to-end traffic line detection with line proposal unit, IEEE Transactions on Intelligent Transportation Systems.
- [31] K. Simonyan, A. Zisserman, Very deep convolutional networks for large-scale image recognition, arXiv preprint arXiv:1409.1556.
- [32] K. He, X. Zhang, S. Ren, J. Sun, Deep residual learning for image recognition, in: Proceedings of the IEEE conference on computer vision and pattern recognition, 2016, pp. 770–778.
- [33] A. Newell, K. Yang, J. Deng, Stacked hourglass networks for human pose estimation, in: European conference on computer vision, Springer, 2016, pp. 483–499.
- [34] J. Zhang, J. Yu, D. Tao, Local deep-feature alignment for unsupervised dimension reduction, IEEE transactions on image processing 27 (5) (2018) 2420–2432.
- [35] J. Yu, M. Tan, H. Zhang, D. Tao, Y. Rui, Hierarchical deep click feature prediction for fine-grained image recognition, IEEE transactions on pattern analysis and machine intelligence.
- [36] J. Yu, C. Zhu, J. Zhang, Q. Huang, D. Tao, Spatial pyramid-enhanced netvlad with weighted triplet loss for place recognition, IEEE transactions on neural networks and learning systems.
- [37] X. Min, K. Gu, G. Zhai, J. Liu, X. Yang, C. W. Chen, Blind quality assessment based on pseudo-reference image, IEEE Transactions on Multimedia 20 (8) (2017) 2049–2062.
- [38] X. Min, G. Zhai, K. Gu, Y. Liu, X. Yang, Blind image quality estimation via distortion aggravation, IEEE Transactions on Broadcasting 64 (2) (2018) 508–517.
- [39] X. Min, G. Zhai, K. Gu, X. Yang, X. Guan, Objective quality evaluation of dehazed images, IEEE Transactions on Intelligent Transportation Systems.
- [40] B. Zhao, X. Zhang, Z. Li, X. Hu, A multi-scale strategy for deep semantic segmentation with convolutional neural networks, Neurocomputing 365 (2019) 273–284.
- [41] P. Denis, J. H. Elder, F. J. Estrada, Efficient edge-based methods for estimating manhattan frames in urban imagery, in: European conference on computer vision, Springer, 2008, pp. 197–210.
- [42] E. Tretyak, O. Barinova, P. Kohli, V. Lempitsky, Geometric image parsing in man-made environments, International Journal of Computer Vision 97 (3) (2012) 305–321.
- [43] N. Murray, L. Marchesotti, F. Perronnin, Ava: A large-scale database for aesthetic visual analysis, in: 2012 IEEE Conference on Computer Vision and Pattern Recognition, IEEE, 2012, pp. 2408–2415.
- [44] X. Min, K. Ma, K. Gu, G. Zhai, Z. Wang, W. Lin, Unified blind quality assessment of compressed natural, graphic, and screen content images, IEEE Transactions on Image Processing 26 (11) (2017) 5462–5474.