The slow heartbeats of an ultra-luminous X-ray source in NGC 3621
Abstract
We report on the results of X-ray observations of 4XMM J111816.0–324910, a transient ultra-luminous X-ray source located in the galaxy NGC 3621. This system is characterised by a transient nature and marked variability with characteristic time-scale of 3500 s, differently from other ULXs, which in the vast majority show limited intra-observation variability. Such a behaviour is very reminiscent of the so-called heartbeats sometimes observed in the Galactic black hole binary GRS 1915+105, where the variability time-scale is 10–1000 s. We study the spectral and timing properties of this object and find that overall, once the differences in the variability time-scales are taken into account, they match quite closely those of both GRS 1915+105, and of a number of objects showing heartbeats in their light-curves, including a confirmed neutron star and a super-massive black hole powering an active galactic nucleus. We investigate the nature of the compact object in 4XMM J111816.0–324910 by searching for typical neutron star signatures and by attempting a mass estimate based on different methods and assumptions. Based on the current available data, we are not able to unambiguously determine the nature of the accreting compact object responsible for the observed phenomenology.
… \reportnumAccepted on 9/6/2020
1 Introduction
The detection and characterization of X-ray variability play a role of paramount importance in the process of identifying the nature of a source and studying the mechanisms powering the observed emission. In accreting sources, it offers unique insights into the condition of disks, accretion flows, winds and jets in the extreme environments surrounding a compact object. In this work, we investigate a peculiar X-ray source in the galaxy NGC 3621, listed in the 4XMM catalogue (Webb et al., submitted) as 4XMM J111816.0–324910 (hereafter 4X J1118). This source was singled out due to its marked variability during a large study of the soft X-ray sky in the temporal domain, carried out via tools developed as part of the EXTraS project111Exploring the X-ray Transient and variable Sky (De Luca et al., 2016) was a project aimed at mining the XMM–Newton archival data for periodic and aperiodic variability in the time domain at all time scales (limited to the 3XMM-DR5 catalog observations; Rosen et al. 2016). See http://www.extras-fp7.eu, which were applied to all the XMM-Newton observations performed up to the end of 2018.
NGC 3621 is a spiral galaxy located at a cepheid distance of 6.7 Mpc (Tully et al., 2013). Despite the bulgeless morphology of NGC 3621, Satyapal et al. (2007) discovered a faint active galactic nucleus (AGN) in its nuclear cluster from mid-infrared observations and, based on estimates of its bolometric luminosity, set a lower limit on the mass of the central black hole (BH) of . Barth et al. (2009) classified NGC 3621 as a Seyfert 2 galaxy based on its optical spectrum, and from stellar-dynamical modeling of the nuclear cluster set an upper limit to the BH mass of . Using a Chandra observation perfomed in March 2008, Gliozzi et al. (2009) found further evidence for an AGN in NGC 3621 with the detection of a weak X-ray point source coincident with the nucleus.
In the same observation, they also detected two bright off-nucleus sources [one in the ultra-luminous X-ray source (ULX; Kaaret et al. 2017) regime] but did not focus on 4X J1118, which at the time was at the inconspicuous luminosity of erg s-1 (see Sec. 4), yielding only a handful of photons. In a more recent XMM–Newton observation (taken in December 2017), we detected 4X J1118 at more than erg s-1, which qualifies it as a new (transient) ULX.222We note that also the fainter non-nuclear source studied by Gliozzi et al. (2009), their ‘source C’, was above the ULX threshold in the same XMM–Newton observation. Even more surprisingly, the inspection of its light-curve revealed an unusual quasi-periodic modulation of the flux, very reminiscent of that seen at times in the Galactic BH X-ray binary GRS 1915+105, the so-called heartbeat oscillations (formally known as -class variability, according to the classification proposed by Belloni et al. 2000).
In the following, we report on the timing and spectral characteristics of 4X J1118, based on the XMM–Newton observation, and discuss the nature of this very peculiar source, also using data from Chandra, the Swift Neil Gehrels Observatory, NuSTAR, and HST.
2 XMM-Newton observation, data reduction and analysis
The XMM–Newton observation that showed 4X J1118 as a ULX (see Table 1) comprises data from both EPIC-pn and the EPIC-MOS1 and MOS2 CCD cameras. Because of the low flux and complicated field, the RGS did not provide useful data. All cameras were operated in Full-Frame mode, which yields data with a time resolution of 73.4 ms for the EPIC-pn, 2.7 s for the MOS1, and 2.6 s for the MOS2. The data reduction was performed following standard procedures using SAS v.16.1. We selected events with PATTERN4 and PATTERN12 for the pn and the MOS, respectively. Photons for both the timing and spectral analysis were extracted in a circular regions with radius of 15′′ centered on 4X J1118 (this small radius, 70% enclosed energy fraction, is due to the presence of nearby sources), while the background was evaluated from a larger source-free region in the same chip as 4X J1118. In the following, we only considered events collected when the EPIC-pn and MOS cameras were observing the target at the same time (approximately 35 ks).
2.1 Timing
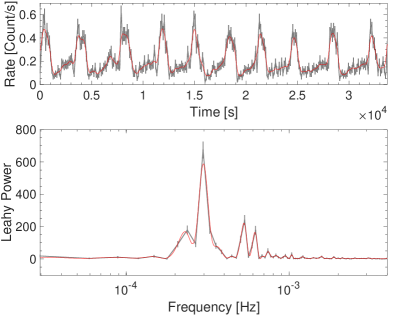
We created three light-curves of 4X J1118 by combining events collected with EPIC-pn, EPIC-MOS1 and EPIC-MOS2 in the energy bands 0.3–10 keV, 0.3–2 keV, and 2–10 keV. We then binned the data in three light-curves with a 120 s time bin (Nyquist frequency Hz), which corresponds to our final time resolution. In order to obtain the best possible frequency resolution ( Hz), we calculated one single power density spectrum (PDS) from the entire light-curve extracted in the 0.3–10 keV energy band (duration ks). The resulting light-curve and PDS are shown in Fig. 1 (top and bottom panel, respectively).
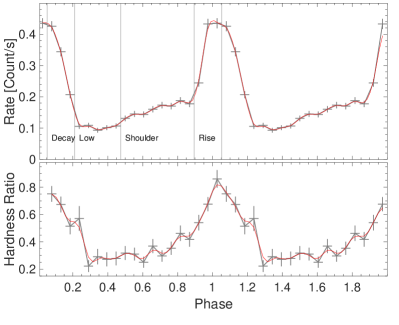
The EPIC light-curve from 4X J1118 clearly shows a repeating pattern, although not strictly periodic. Therefore, a simple folding of the light-curve would not return an accurate representation of the variability that we observe. On the other hand, the relatively low flux of this source requires some sort of averaging to allow a more accurate data analysis to be performed. We created a folded light-curve profile following the approach of Neilsen et al. (2011), who applied it to GRS 1915+105. We first constructed a first-guess template model defining a representative single light-curve cycle. We then cross-correlated the template with the entire light-curve, which comprises of 9 peaks. The resulting cross-correlation returns 9 maxima that correspond to the peak in the light-curve, and are assigned phase zero () in the construction of the folded profile. We then split the cross correlation function in 20 phase bins, over which we phase-average the original light-curve. We then use the resulting profile as a new template, which we cross-correlate with the original light-curve. The process is then iterated for 10 times so to minimise the bias introduced with the choice of our first-guess template. We applied the above method to the three light-curves we extracted, and we used the light-curves in the 0.3–2.0 keV and 3.0–10 keV bands to calculate a hardness ratio. The final phase-folded light-curve extracted for the 0.3–10 keV band and the hardness ratio as a function of phase are shown in Fig. 2 (top and bottom panel, respectively). The profiles shown correspond to an average period of approximately 3500 s.
In the following, uncertainties will be given at 1, with the exception of the spectral results, where uncertainties are quoted at a 90% confidence level.
2.2 Spectral analysis
We first extracted the three (one EPIC-pn and two EPIC-MOS) average spectra in the 0.3–10 keV energy range from the entire observation. The appropriate ancillary and response files were created with the SAS package. Then, in order to probe the fast variability of the target along the repeated pattern that characterises the light-curve, we extracted 4 spectra in the 0.3–10 keV energy range at different phases of said pattern, following the folded profile obtained as described above. We extracted 4 spectra, labelled low, shoulder, rise and decay, in the phase ranges shown in Fig. 2 (top panel).
3 Results
3.1 Timing results
The PDS from 4X J1118 shows a prominent main peak at () Hz, clearly corresponding to the obvious high-amplitude 3500 s modulation visible in the light-curve. Such a peak is detected with high statistical significance (15.3) and has a quality factor .333The quality factor quantifies the coherence of a given signal, and is defined as , where and are the centroid frequency and the FWHM of the peak, respectively. The PDS shows two additional secondary peaks, at () Hz and () Hz (9.2 and 7.6, respectively), although they are both unresolved (i.e., their FWHM is significantly lower than our frequency resolution of s). A relatively low amplitude peak at () Hz (7.2) is also detected. While the peak at 6 Hz is consistent with being harmonically related to the prominent main peak, both the peaks at 5.2 and 2.22 Hz do not appear to be in any obvious harmonic relation with the main peak, and cannot be obviously associated with a particular feature in the light-curve. Further in-depth analysis of the above features is beyond the scope of this work.
For the sake of comparison, we analysed a representative RXTE observation of GRS 1915+105 (Obs. ID 60405-01-02-00) during which the heartbeats were clearly observed. The flare modulation occurs on an average period of 50 s, and—similarly to 4X J1118—is clearly visible as a prominent peak in the PDS. The PDS shows also two secondary peaks, qualitatively similar to those observed in the PDS from 4X J1118. In this case, however, both peaks are consistent with being harmonically related to the main peak, forming a 1-2-3 harmonic series.444Note that while third harmonics are not unheard of in accreting BHs binaries (see e.g. Motta et al. 2017), they remain puzzling and their origin widely debated. We note that this is only a representative case, and that GRS 1915+105 shows similar modulations at a variable period, which can be as long as 1000 s (Belloni et al., 2000; Altamirano et al., 2011; Weng et al., 2018). Hence, the properties of the PDS change in time, and the harmonic relation highlighted above is not always observed nor consistently respected.
The 4X J1118 profile that emerges in its folded light-curve has a clear structure, formed by: a main peak, consistent with being symmetrical and best-described by a Gaussian function; a left shoulder, preceding the peak; a low flux phase, corresponding to the minimum flux level reached during the duty cycle, following the main peak. Based on the above, we can estimate a number of time-scales that characterise the variability in 4X J1118. We stress that the repeated pattern in the light-curve is not strictly periodic, and therefore the timescales in the following have to be intended as average quantities. The average recurrence time of the flaring observed in the light-curve is s. The flares are consistent with being almost symmetric, and have a duration of s, which is defined as the FWHM of the Gaussian that best fits the main peak of the folded light-curve. The average flare rise and decay are equal to s and s, respectively. We defined as the interval between the intersection of the Gaussian that best-fits the flare and the shoulder preceding the flare itself, and the Gaussian peak. The decay is defined as the interval between the peak of said Gaussian profile and the first point of the plateau following the flare (around =0.2). We note that the and time-scales do not exactly coincide with the phase ranges we defined to perform the phase-resolved spectroscopy (where the limited signal-to-noise ratio imposed a less accurate event selection with respect to that adopted for the timing analysis).
3.2 Spectral results
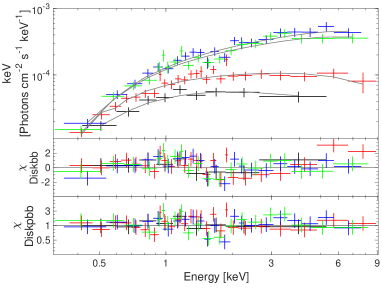
The EPIC average energy spectra are well-fit by a number of models, which include a blackbody (bbody), a disk-blackbody (diskbb), and a power law or a bremsstrahlung profile (bremss), all modified by a component accounting for the absorption by the inter-stellar medium (tbabs, using the abundances by Wilms et al. 2000). Unsurprisingly, combinations of the above models or similar ones (such as diskpbb or Comptonization models, e.g., nthcomp; Zdziarski et al. 1996) also provide acceptable fits. For example, an absorbed diskbb yields a for 267 degrees of freedom (dof), with the following parameters: cm-2, keV, and an observed 0.3–10 keV flux of erg cm-2 s-1. For an absorbed diskpbb () we obtained cm-2, keV, and , providing an absorbed flux of erg cm-2 s-1. For a distance of 6.7 Mpc, the inferred average luminosity is and erg s-1 for the diskbb and diskpbb model, respectively. Also an absorbed cut-off powerlaw () provides an acceptable fit, with cm-2, photon-index , high-energy cut-off , and an observed 0.3–10 keV flux of erg cm-2 s-1. However, since the disc models appear to provide slightly better results, in the following we will only consider fits based on diskbb and diskpbb models.
The hardness ratio in Fig. 2 (bottom panel) clearly shows that the variability in 4X J1118 is associated with marked spectral variations, with spectra becoming harder any time the flux peaks. Therefore, the above values have to be intended only as rough estimates that reflect the general (and approximate) spectral properties of 4X J1118. Phase-resolved spectroscopy doubtlessly constitutes a more suitable approach to probe the spectral properties of our target. Hence we analysed the EPIC-pn and MOS spectra of 4X J1118 in four phase ranges, labelled as low, shoulder, rise and decay (see Fig. 2, top panel).
As for the average spectrum, phenomenological models such as an absorbed powerlaw, a diskbb, or a diskpbb, all provide adequate fits to the individual phase intervals spectra, and return significantly varying flux and parameters. Fitting simultaneously the spectra with a diskbb, leaving free to vary both the disc temperature and its normalization for each phase range while keeping a common column density, provides an acceptable fit (; Table 3), which however retains some structured residuals to the data (see Fig. 3, middle panel). According to this model, the disc unabsorbed bolometric luminosity correlates with the inner disc temperature, following a relation (see Fig. 3, right panel). Interestingly, a relation of the form is expected for a slim disc. The deviations of a slim disc from a standard disk-blackbody might thus be at the origin of the structured residuals that we observe.
Based on the above consideration, we substituted the diskbb with a diskpbb model, where the radial dependence of the disc temperature has a powerlaw profile of the form , with for a standard disc and for a slim disc. When fitting this model to the data, we linked the parameter across the two spectra at higher flux, and across the two spectra at lower flux, respectively. This configuration returns a good description of the spectra, slightly preferred by the data with respect to the previous model (, see Table 3 and Fig. 3, top panel for the best-fit and bottom panel for the model residuals), with a -parameter of and for the high and the low flux spectra, respectively. The disc temperature for the four phase range lies between 1 and 4 keV, although the values are less constrained than in the previous fits. Using this model, we obtain a luminosity-temperature relation of the form , which is fully consistent with the relation expected in the presence of a slim disc. A rough estimate of the range of the inner radii from the diskpbb model normalisation lies at 15–40 km, adopting an inclination angle of 60° and with no colour correction applied. These values must be taken as merely indicative, as they clearly do not reflect the actual disc truncation radii, but rather suggest that the truncation radius may change with varying flux. The simplified models we adopted may not fully describe the complex spectral variations observed in 4X J1118, but the limited signal-to-noise ratio and the lack of data at high energies of our spectra does not allow us to test more sophisticated models.
Finally, we considered the typical spectral modelling employed to explain the ULX phenomenology, which explicitly assumes super-Eddington accretion around a stellar mass compact object (either a BH or a neutron star, NS). In such a scenario, at least two main spectral thermal components are identified: a cold one that is usually associated with extended and optically thick winds (launched by the super-Eddington disc), and a hot one ascribed to an advection-dominated disc (e.g. Middleton et al., 2015a). We attempted to model the spectra of 4X J1118 with a cold blackbody plus a hot diskbb component555A diskpbb component would be more adequate for such a scenario; however, the data quality does not allow to put firm constraints on the parameters of this model.. Since limited variability is expected from the wind due to its large radial extension (Middleton et al., 2015a), we linked both the column density and the blackbody parameters across the four phases, while we left the diskbb parameters free to vary. This model provides a good fit of the data (), which gives a column density of cm-2 and cold blackbody temperature of keV, with an emitting radius of km. The hot diskbb components gives a common temperature of keV for the low and shoulder spectra, while for the rise and decay we obtained a temperature of keV and keV, respectively. Based on the diskbb fits, assuming no color correction factor and a disk inclination of 60°, the inner radii are km, km, km, and km, for the low, shoulder, rise and decay spectra, respectively.
4 Other X-ray observations
The field of 4X J1118 was observed with Chandra, Swift, and NuSTAR (largely overlapping with the XMM–Newton observation; see Table 1).
In 2008, Chandra caught the source at a rather low luminosity. Since the Chandra observation does not provide enough counts for a meaningful spectral analysis, in order to estimate the luminosity from the count rate we arbitrarily assumed that the spectrum is described by a blackbody with temperature of 0.4 keV, which is the temperature we obtain by fitting a blackbody model to the spectrum. We obtain a luminosity of erg s-1 (consistent values are obtained with other plausible models, for example erg s-1 adopting a power-law model with slope ).
4X J1118 was never convincingly detected in the Swift exposures, due to the presence of contaminating sources very close to the target’s fiducial position in the Swift images, as well as of diffuse X-ray emission from NGC 3261. The deepest Swift upper limits are of the order of erg s-1 ( XRT counts s-1 correspond to erg s-1).
In the NuSTAR data 4X J1118 is detected with a significance exceeding 5 up to 15–20 keV. We extracted the background-subtracted 3–15 keV light-curve, combining the data from the NuSTAR/FMPA and NuSTAR/FMPB instruments. The light curve shows flares similar to those observed in the XMM–Newton data, which appear to occur at the same time when NuSTAR and XMM–Newton were observing at the same time. However, due to the low signal-to-noise ratio of the data, the contamination from a nearby (30′′) bright source, and the orbit gaps, we refrained from using the NuSTAR data for the spectral or timing analysis.

5 Discussion
The high Galactic latitude of this source and the faint optical counterparts (see Appendix B) make an association of 4X J1118 with a foreground X-ray source (such as a CV or a polar) quite unlikely. We thus approach 4X J1118 as a new ULX, which enriches the still small population of known transients within this class.
The most striking feature of 4X J1118 is the similarity of its light-curve with that of the Galactic BH binary GRS 1915+105 in one of its many variability states: the class variability (Belloni et al., 2000), sometimes affectionately referred to as the heartbeats, which is characterised by a quasi-periodic modulation in the flux. Such marked short time-scale variability is clearly at odds with most of the ULXs, where only a small sample of sources is highly variable on time-scales shorter than a few hours (e.g. Earnshaw & Roberts, 2017; Pintore et al., 2020). 4X J1118 can be classified as broadened-disc or hard-ultraluminous source (Sutton et al., 2013a), and, by showing both relatively hard spectra and obvious variability, may depart from the common variable-when-softer connection observed in other ULXs (Sutton et al. 2013b; Middleton et al. 2015b).
Aside form GRS 1915+105, a few more objects at times show a -like variability: IGR J17091–3624, MXB 1730–335, and the AGN in GSN 069. IGR J17091–3624 is thought to be powered by a stellar mass BH, and is considered a fainter relative of GRS 1915+105, with which it shares many characteristic variability patterns (Altamirano et al. 2011). MXB 1730–335, also known as the Rapid Burster, has been recently shown to display—among many other variability patterns—two of the many characteristic variability classes observed in GRS 1915+105 (the and class, see Bagnoli & in’t Zand 2015), despite hosting a confirmed NS (Hoffman et al. 1978). GSN 069, which is powered by a super-massive BH with a mass of the order of , recently started to show a flux modulation reminiscent of the heartbeats (Miniutti et al., 2019). Such a modulation, unsurprisingly, occurs with a much longer periodicity than in GRS 1915+105 (approximately 9 hours), ascribed to the large mass of this object.
When compared in some detail, the light-curves of 4X J1118, GRS 1915+105, IGR J17091–3624 and the Rapid Burster, all show the same structure, constituted by a low-flux plateau, a shoulder, and a main peak, the latter typically asymmetric, with a slower rise to the peak (in our case equivalent to the sum of the time interval covering the shoulder and ) and a fast decay. In this matter, GSN 069 represents an exception, with its very symmetric peaks and non-detectable pre-peak shoulder. What clearly differentiates these qualitatively similar light-curves is the recurrence time of the main peaks. From fastest to slowest, the recurrence times are 5–100 s (IGR J17091–3624), 40–1000 s (GRS 1915+105), 350–450 s (Rapid Burster), 3200–3700 s (4X J1118), and 32.5 ks (GSN 069).
The soft X-rays spectrum (below 10 keV) at the time of the heartbeat in 4X J1118 appears to be thermal, with the emission well-modelled by a disk-like component, and relatively hard. Our best fits to the phase-resolved spectra of 4X J1118 indicate that both the disk temperature and the inner disc truncation radius vary across different phases, but while the former clearly increases with flux, our data do not allow us to make a conclusive statement on the evolution of the inner disc radius. Similar properties have been observed in all the aforementioned sources (which—we remind the reader—include a NS and a BH Galactic X-ray binary, as well as a super-massive BH), with the addition that in all these sources the inner disc radius consistently increases with flux during the heartbeats. In particular, in GRS 1915+105—the first source to have shown this particular variability state—the above spectral behavior has been interpreted as the result of a limit-cycle instability driven by the Lightman–-Eardley radiation pressure instability (Lightman & Eardley 1974, Belloni et al. 2000). An excess density wave propagates in the innermost portion of the accretion disc, eventually inducing local Eddington accretion that causes the flux to peak, while the accretion disc reacts by increasing its truncation radius at an almost constant temperature. Our results are consistent with this picture, although the limited statistical quality of our data does not allow us to make any stronger statement. The radiation pressure limit-cycle instability has been invoked to explain the heartbeats also in IGR J17091–3624 (Altamirano et al. 2011), GSN 069 (Miniutti et al. 2019), and even in the Rapid Burster, where the instability might develop in a portion of the accretion flow unaffected by type-I X-ray bursts eventually emitted from the neutron star surface (see Maselli et al. 2018).
The fits to the phase-resolved spectral return a relation between bolometric luminosity versus disc temperature of the form , where 2, which indicates that the accretion disc around 4X J1118 is likely a slim disk. A similar powerlaw relation has been found by Miniutti et al. 2019 for GSN 069, who found a luminosity-temperature relation with index . For what concerns GRS 1915+105 and IGR J17091–3624, a comparison with 4X J1118 is much more difficult: possibly due to the much better signal-to-noise ratio of the data from these sources, and/or a much larger amount of data available, it appears that in either sources there is no interval longer than a few seconds over which (or any other power-law relation with constant index). Rather, both sources trace hysteresis cycles in the luminosity versus temperature plane with p varying in the 2 to 4 range (but in opposite directions), reflecting a complicated accretion scenario (Altamirano et al., 2011; Court et al., 2017; Maselli et al., 2018). In the case of the Rapid Burster, it is unclear whether a correlation between disc temperature and luminosity exists in the first place, as the disc temperature during the heartbeats seems to remain roughly constant in time (Bagnoli & in’t Zand 2015).
Among the sources showing heartbeats considered here, both a mass and a distance estimate are available for GRS 1915+105 (, kpc; Reid et al. 2014), for the Rapid Burster (, kpc; Lewin et al. 1976), and for GSN 069 (, ; Miniutti et al. 2019). This made it possible to establish that the heartbeats occur at 80–90% of the source Eddington luminosity () in GRS 1915+105, between 40 and 90% in GSN 069, and only at 20% in the Rapid Burster (Neilsen et al., 2011; Miniutti et al., 2019; Bagnoli & in’t Zand, 2015). On the one hand, this suggests that about Eddington accretion rates might not be a necessary condition for the heartbeats to occur, a fact already noted by many authors and also supported by hydrodynamical simulations (see e.g. Janiuk et al. 2015). On the other hand, the above observation implies that we cannot easily assume that 4X J1118 is accreting at close-to-Eddington rates by comparison with, e.g., GRS 1915+105. This fact becomes even more striking when we consider that while GRS 1915+105, IGR J17091–3624, the Rapid Burster, and GSN 069 undoubtedly show similar heartbeats light-curves and spectral properties, all these sources (and especially the three stellar-mass systems) also show a large variety of widely unexplained additional variability states. Therefore, without more observations, better signal-to-noise, and more in-depth studies, we are not in a position to exclude that all the similarities that we have identified among the above sources are purely coincidental.
We are now left with the daunting task of discussing the possible nature of the compact object hosted in 4X J1118. Having excluded the obvious presence of type-I X-ray bursts in our X-ray data by visual inspection of the data, we performed an accelerated search for coherent signals in the XMM–Newton observation, which did not reveal any significant feature (see Appendix A for details on the analysis). Therefore we have no direct proof of the presence of a surface, which would unquestionably indicate the presence of a NS. Our spectral analysis does not offer any insight into this matter either, as no clear similarity or difference between 4X J1118 and either the Rapid Burster (hosting a confirmed NS) or any of the other systems we considered (all hosting confirmed or candidate BHs) has emerged. Our only option is to attempt a mass estimate of the compact object based on the information we have on 4X J1118, aware of the fact that the mass of the accreting object might not the dominant factor that determines its variability time-scale (see, e.g., Massaro et al. 2020a, b, for a case study on GRS 1915+105). We identified three different ways to do this, all depending on fairly strong assumptions, and thus limited by important caveats.
Firstly, by assuming that the maximum luminosity reached by 4X J1118 equals its Eddington limit (which is not necessarily a sensible assumption, as discussed above) based on our spectral analysis we obtain a mass of approximately 75 . By assuming that 4X J1118 is accreting at 10 times the Eddington accretion rate instead—which is not unusual in NS powered ULXs (see, e.g., Israel et al. 2017)—this mass moves down to 7.5 , a value comfortably consistent with the average expected mass of BHs in Galactic binaries systems (Özel et al. 2010). Secondly, we observe that all the most relevant timescales in accreting systems (e.g., the viscous, thermal, and perturbation propagation time-scales) are proportional to the dynamical time scale, , where is expressed in units of the gravitational radius . If we make the (strong) assumptions that the heartbeats arise from the same portion of the accretion flow in two sources, and that the two accretion flows have the same characteristics (e.g. same disc scale height and viscosity parameter ), we obtain that any characteristic time scale simply scales linearly with the mass of the object.666This is because both the radius and the accretion flow parameters and can be eliminated from the equations when comparing timescales, because they are assumed to be constant across the sources considered. Taking for GRS 1915+105, and a recurrence time of 100 s and 3500 s, respectively, for GRS 1915+105 and 4X J1118, it follows that 4X J1118 should have a mass of the order . It is immediately clear, however, that such a rough estimate is strongly sensitive to the choice of (i) the characteristic time-scale used, which can vary significantly even for one single object (up to 3 orders of magnitude for, e.g., IGR J17091–3624 and GRS 1915+105); and (ii) the object used for the comparison (e.g., GRS 1915+105 as opposed to the Rapid Burster or GSN 069). This indicates that our assumptions are most likely too simplistic, and the above mass estimate can easily vary by orders of magnitude depending on our relatively arbitrary choices. Finally, we can attempt a mass estimate by assuming that the heartbeats recurrence times are governed by the radiation-pressure limit-cycle instability. We followed the approach adopted by Miniutti et al. (2019) and we used an empirical relation derived from numerical simulations of AGN that links the BH mass, the instability recurrence time, and the ratio between the minimum and maximum luminosity sampled during the instability duty-cycle—that is, (Janiuk et al. 2004)—to compare once more 4X J1118 and GRS 1915+105. By making the same assumptions as above on the accretion flow, and taking for GRS 1915+105 (based on Neilsen et al. 2011), and from this work for 4X J1118, we find that the latter should have a mass of the order . As mentioned above, it is unlikely that , , and the size of the portion of the accretion flow generating the heartbeats are the same for 4X J1118 and GRS 1915+105 (or any other system that might be used for comparison). It follows that, once more, the above mass estimate is not really constraining, as it strongly depends on our assumptions.
Based on all the above considerations, we cannot make a strong statement on the nature of the compact object in 4X J1118, which might very well be a stellar-mass BH as well as a NS, or even a more exotic intermediate-mass BH. We believe the latter possibility less likely, as the existence of an intermediate-mass BH would be difficult to explain in terms of galactic evolution and dynamics in a galaxy powered by a relatively light super-massive BH, and lacking any clear sign of interaction with other galaxies.
Clearly, the marked variability observed in 4X J1118 may be due to a number of processes different from the radiation-pressure limit-cycle instability, and not necessarily instability-driven (see, e.g., Middleton et al. 2018 for a number of possibilities involving precession, and Bagnoli et al. 2015 for a list of magnetic models). However, the fact that we are currently unable to constrain the mass of the accreting object in this source prevents us from making any meaningful comparison between its observed variability and that predicted by essentially any existing model. New observations and more data are needed in order to clarify what physical processes might underlie the observed properties of 4X J1118.
| Instrument | Obs.ID | Date | Exposure | Count rate |
|---|---|---|---|---|
| (ks) | (Counts s-1) | |||
| Chandra/ACIS-S | 9278 | 2008-03-06 | 21.2 | |
| Swift/XRT | 00045607001 | 2011-08-01 | 0.9 | |
| Swift/XRT | 00045607002 | 2011-08-02 | 3.8 | |
| Swift/XRT | 00045607003 | 2011-08-04 | 2.0 | |
| Swift/XRT | 00045607004 | 2011-08-05 | 2.5 | |
| Swift/XRT | 00045607005 | 2011-08-08 | 0.3 | |
| Swift/XRT | 00045607006 | 2011-08-10 | 0.4 | |
| Swift/XRT | 00045607007 | 2011-08-14 | 3.9 | |
| Swift/XRT | 00045607008 | 2012-08-12 | 4.6 | |
| Swift/XRT | 00045607009 | 2012-08-14 | 6.0 | |
| Swift/XRT | 00045607010 | 2012-08-15 | 3.3 | |
| Swift/XRT | 00045607011 | 2012-08-17 | 2.9 | |
| Swift/XRT | 07006864001 | 2017-02-28 | 0.1 | 0.28 |
| Swift/XRT | 07006862001 | 2017-03-10 | 0.1 | 0.27 |
| Swift/XRT | 07006864002 | 2017-03-15 | 0.5 | |
| Swift/XRT | 00088212001 | 2017-12-15 | 1.1 | |
| NuSTAR/FPM A+B | 60371002002 | 2017-12-15 | 30.8 | |
| XMM–Newton/pn | 0795660101 | 2017-12-16 | 33.7 | |
| XMM–Newton/MOS1 | 0795660101 | 2017-12-16 | 34.9 | |
| XMM–Newton/MOS2 | 0795660101 | 2017-12-16 | 34.9 | |
| Swift/XRT | 00088212002 | 2017-12-20 | 0.9 |
| Instrument | Component | Frequency [Hz] | factor | Significance [] |
|---|---|---|---|---|
| Main peak | (3.022 0.003) | 17.9 | 11.9 | |
| EPIC-pn | Left shoulder | (2.22) | unresolved | 5.4 |
| Secondary peak 1 | (5.2 0.1) | unresolved | 6.8 | |
| Secondary peak 2 | (7 2) | unresolved | 5.9 |
| Model | Parameter | low | shoulder | rise | decay | |
| diskbb | NH [ cm-2] | 1.11/221 | ||||
| kT [keV] | ||||||
| Norm. [] | ||||||
| L []a | ||||||
| diskpbb | NH [ cm-2] | 0.96/219 | ||||
| kT [keV] | ||||||
| Norm. [] | ||||||
| L []a | ||||||
| bbody+diskbb | NH [ cm-2] | 0.93/220 | ||||
| kT [keV] | ||||||
| Norm. [] | ||||||
| L []a | ||||||
| kT [keV] | ||||||
| Norm. [] | ||||||
| L []a | ||||||
a Unabsorbed 0.3–10 keV luminosity.
References
- Altamirano et al. (2011) Altamirano, D., Belloni, T., Linares, M., et al. 2011, ApJ, 742, L17, doi: 10.1088/2041-8205/742/2/L17
- Arnaud (1996) Arnaud, K. A. 1996, in Astronomical Society of the Pacific Conference Series, Vol. 101, Astronomical Data Analysis Software and Systems V, ed. G. H. Jacoby & J. Barnes, 17–+
- Bagnoli & in’t Zand (2015) Bagnoli, T., & in’t Zand, J. J. M. 2015, MNRAS, 450, L52, doi: 10.1093/mnrasl/slv045
- Bagnoli et al. (2015) Bagnoli, T., in’t Zand, J. J. M., D’Angelo, C. R., & Galloway, D. K. 2015, MNRAS, 449, 268, doi: 10.1093/mnras/stv330
- Barth et al. (2009) Barth, A. J., Strigari, L. E., Bentz, M. C., Greene, J. E., & Ho, L. C. 2009, ApJ, 690, 1031, doi: 10.1088/0004-637X/690/1/1031
- Belloni et al. (2000) Belloni, T., Klein-Wolt, M., Méndez, M., van der Klis, M., & van Paradijs, J. 2000, A&A, 355, 271
- Blackburn (1995) Blackburn, J. K. 1995, in Astronomical Data Analysis Software and Systems IV., Vol. 77, FTOOLS: A FITS Data Processing and Analysis Software Package, ed. R. A. Shaw, H. E. Payne, & J. J. E. Hayes (ASP Conf. Ser., San Francisco, CA), 367
- Court et al. (2017) Court, J. M. C., Altamirano, D., Pereyra, M., et al. 2017, MNRAS, 468, 4748, doi: 10.1093/mnras/stx773
- De Luca et al. (2016) De Luca, A., Salvaterra, R., Tiengo, A., et al. 2016, in Astrophysics and Space Science Proceedings: The Universe of Digital Sky Surveys, Vol. 42, Science with the EXTraS Project: Exploring the X-Ray Transient and Variable Sky, ed. N. Napolitano, G. Longo, M. Marconi, M. Paolillo, & E. Iodice (Springer International Publishing, Cham), 291
- Earnshaw & Roberts (2017) Earnshaw, H. M., & Roberts, T. P. 2017, MNRAS, 467, 2690, doi: 10.1093/mnras/stx308
- Fruscione et al. (2006) Fruscione, A., McDowell, J. C., Allen, G. E., et al. 2006, in SPIE Conference Series, Vol. 6270, Observatory Operations: Strategies, Processes, and Systems, ed. D. R. Silva & R. E. Doxsey (SPIE, Bellingham), 62701V
- Gabriel et al. (2004) Gabriel, C., Denby, M., Fyfe, D. J., et al. 2004, in Astronomical Data Analysis Software and Systems (ADASS) XIII, Vol. 314, The XMM-Newton SAS - Distributed Development and Maintenance of a Large Science Analysis System: A Critical Analysis, ed. F. Ochsenbein, M. G. Allen, & D. Egret (San Francisco, CA: ASP), 759
- Gliozzi et al. (2009) Gliozzi, M., Satyapal, S., Eracleous, M., Titarchuk, L., & Cheung, C. C. 2009, ApJ, 700, 1759, doi: 10.1088/0004-637X/700/2/1759
- Hoffman et al. (1978) Hoffman, J. A., Marshall, H. L., & Lewin, W. H. G. 1978, Nature, 271, 630, doi: 10.1038/271630a0
- Israel & Stella (1996) Israel, G. L., & Stella, L. 1996, ApJ, 468, 369
- Israel et al. (2017) Israel, G. L., Belfiore, A., Stella, L., et al. 2017, Science, 355, 817
- Janiuk et al. (2004) Janiuk, A., Czerny, B., Siemiginowska, A., & Szczerba, R. 2004, ApJ, 602, 595, doi: 10.1086/381159
- Janiuk et al. (2015) Janiuk, A., Grzedzielski, M., Capitanio, F., & Bianchi, S. 2015, A&A, 574, A92, doi: 10.1051/0004-6361/201425003
- Kaaret et al. (2017) Kaaret, P., Feng, H., & Roberts, T. P. 2017, ARA&A, 55, 303
- Lewin et al. (1976) Lewin, W. H. G., Doty, J., Clark, G. W., et al. 1976, ApJ, 207, L95, doi: 10.1086/182188
- Lightman & Eardley (1974) Lightman, A. P., & Eardley, D. M. 1974, ApJ, 187, L1, doi: 10.1086/181377
- Maselli et al. (2018) Maselli, A., Capitanio, F., Feroci, M., et al. 2018, A&A, 612, A33, doi: 10.1051/0004-6361/201732097
- Massaro et al. (2020a) Massaro, E., Capitanio, F., Feroci, M., et al. 2020a, MNRAS, 495, 1110, doi: 10.1093/mnras/staa1124
- Massaro et al. (2020b) —. 2020b, MNRAS, doi: 10.1093/mnras/staa1125
- Middleton et al. (2015a) Middleton, M. J., Heil, L., Pintore, F., Walton, D. J., & Roberts, T. P. 2015a, MNRAS, 447, 3243
- Middleton et al. (2015b) —. 2015b, MNRAS, 447, 3243, doi: 10.1093/mnras/stu2644
- Middleton et al. (2018) Middleton, M. J., Fragile, P. C., Bachetti, M., et al. 2018, MNRAS, 475, 154
- Miniutti et al. (2019) Miniutti, G., Saxton, R. D., Giustini, M., et al. 2019, Nature, 573, 381, doi: 10.1038/s41586-019-1556-x
- Motta et al. (2017) Motta, S. E., Rouco-Escorial, A., Kuulkers, E., Muñoz-Darias, T., & Sanna, A. 2017, ArXiv e-prints. https://arxiv.org/abs/1703.01263
- Neilsen et al. (2011) Neilsen, J., Remillard, R. A., & Lee, J. C. 2011, ApJ, 737, 69, doi: 10.1088/0004-637X/737/2/69
- Özel et al. (2010) Özel, F., Psaltis, D., Narayan, R., & McClintock, J. E. 2010, ApJ, 725, 1918, doi: 10.1088/0004-637X/725/2/1918
- Pintore et al. (2020) Pintore, F., Marelli, M., Salvaterra, R., et al. 2020, ApJ, 890, 166, doi: 10.3847/1538-4357/ab6ffd
- Reid et al. (2014) Reid, M. J., McClintock, J. E., Steiner, J. F., et al. 2014, ApJ, 796, 2, doi: 10.1088/0004-637X/796/1/2
- Rosen et al. (2016) Rosen, S. R., Webb, N. A., Watson, M. G., et al. 2016, A&A, 590, A1
- Satyapal et al. (2007) Satyapal, S., Vega, D., Heckman, T., O’Halloran, B., & Dudik, R. 2007, ApJ, 663, L9, doi: 10.1086/519995
- Sutton et al. (2013a) Sutton, A. D., Roberts, T. P., & Middleton, M. J. 2013a, MNRAS, 435, 1758
- Sutton et al. (2013b) —. 2013b, MNRAS, 435, 1758, doi: 10.1093/mnras/stt1419
- Tully et al. (2013) Tully, R. B., Courtois, H. M., Dolphin, A. E., et al. 2013, AJ, 146, 86, doi: 10.1088/0004-6256/146/4/86
- Weng et al. (2018) Weng, S.-S., Wang, T.-T., Cai, J.-P., Yuan, Q.-R., & Gu, W.-M. 2018, ApJ, 865, 19, doi: 10.3847/1538-4357/aad9a6
- Wilms et al. (2000) Wilms, J., Allen, A., & McCray, R. 2000, ApJ, 542, 914
- Zdziarski et al. (1996) Zdziarski, A. A., Johnson, W. N., & Magdziarz, P. 1996, MNRAS, 283, 193, doi: 10.1093/mnras/283.1.193
Appendix A Search for rapid pulsations
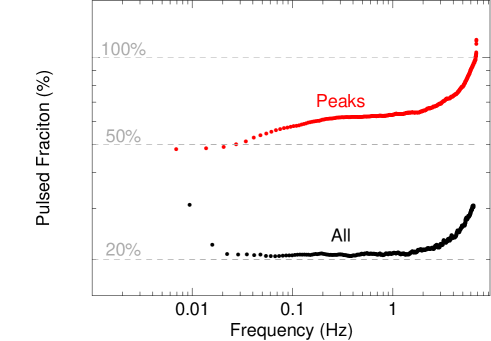
We considered the possibility of a fast-spinning pulsar in the system (see, e.g., Israel et al., 2017). For the XMM–Newton data set, after correcting the times to the Solar system barycenter, we performed an accelerated search for signals by correcting the time of arrivals (ToA) of each photon in order to account for time shifts corresponding to those originated by a first period derivative component in the range Hz, and then by looking for peaks above a 3.5 local detection threshold in the corresponding power spectral density (PSD) and taking onto account for the possible presence of non-Poissonian noise components (Israel & Stella, 1996). We performed the search both over the whole sample of available ToA and only for those around the quasi-periodic peaks. The search gave negative results in both cases. No candidate signal was found in the 150 ms to 100 s period range, with 3 upper limits in the 20–30% and 50–90% range for “all” the ToA and for the QPOs “peaks”, respectively (see Fig. 4).
Appendix B Hubble Space Telescope observations
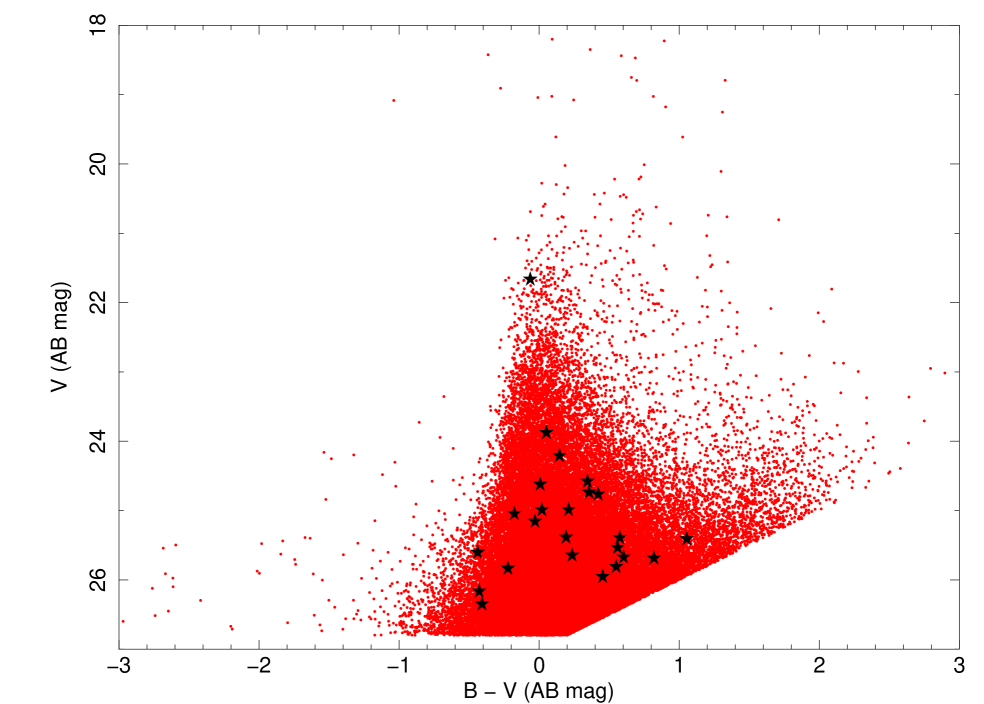
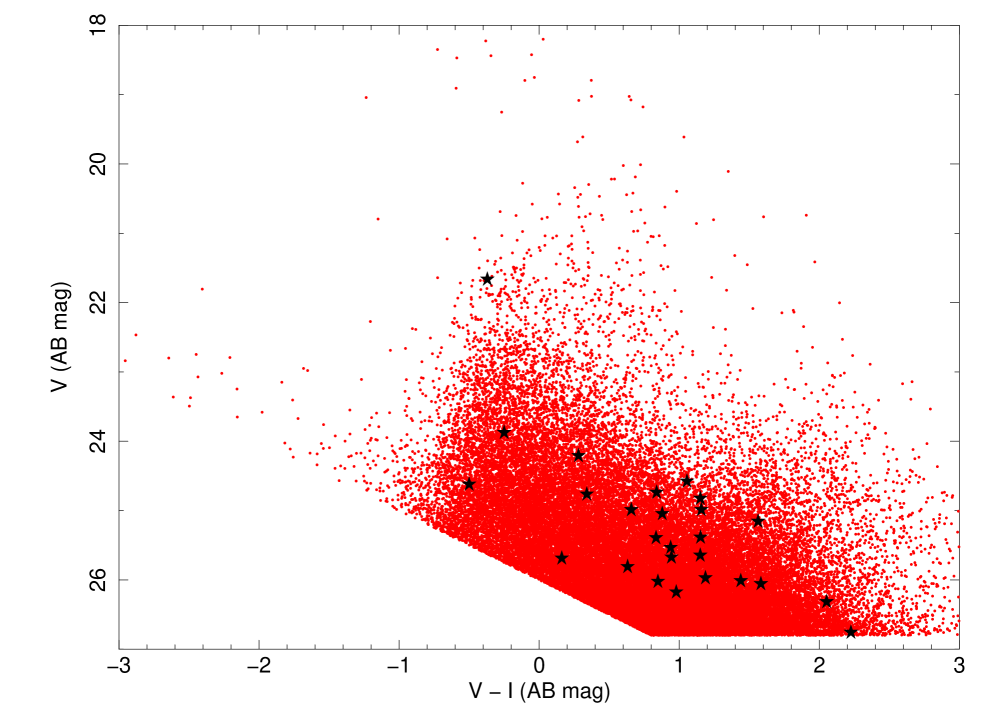
NGC3621 was observed with the HST/ACS instrument in the F435W (B) filter, F555W (V) filter and F814W (I) filter. We retrieved calibrated, geometrically-corrected images from the Hubble Legacy Archive (HLA2). We refined astrometry using a set of sources from the 2MASS survey, with a resulting r.m.s. accuracy better than 50 mas per coordinate. We run a source detection using the SExtractor software and we converted count rates to magnitudes using the photometric calibration provided by the HLA pipeline.
The brightest source consistent with the Chandra error circle is extended, and it is very likely a star cluster in NGC3621.