Design and implementation of the new scintillation light detection system of ICARUS T600
Abstract
ICARUS T600 is the far detector of the Short Baseline Neutrino program at Fermilab (USA), which foresees three Liquid Argon Time Projection Chambers along the Booster Neutrino Beam line to search for LSND-like sterile neutrino signal. The T600 detector underwent a significant overhauling process at CERN, introducing new technological developments while maintaining the already achieved performances. The realization of a new liquid argon scintillation light detection system is a primary task of the detector overhaul. As the detector will be subject to a huge flux of cosmic rays, the light detection system should allow the 3D reconstruction of events contributing to the identification of neutrino interactions in the beam spill gate. The design and implementation of the new scintillation light detection system of ICARUS T600 is described.
1 Introduction
The ICARUS T600 detector is the largest Liquid Argon Time Projection Chamber (LAr-TPC) ever operated on a neutrino beam for oscillation studies. It took data from 2010 to 2013 in the INFN Gran Sasso Laboratory (Italy), both with atmospheric neutrinos and with the CERN Neutrinos to Gran Sasso (CNGS) beam. After an intense refurbishing operation, carried out at CERN in the framework of the Neutrino Platform activities (WA104/NP01), the entire apparatus was moved to Fermilab (IL, USA), where it will operate as far detector of the Short Baseline Neutrino (SBN) program [1]: three liquid argon detectors, placed along the Booster Neutrino Beam (BNB) line and operating at shallow depth, will investigate the possible presence of sterile neutrino states.
The realization of a new light detection system, sensitive to the photons produced by the LAr scintillation, is a fundamental feature for the T600 operation at shallow depth. A threshold of 100 MeV of deposited energy, a time resolution of the order of ns and a high granularity are required to effectively identify the events associated to the neutrino beam and handle the expected huge cosmic background. The T600 scintillation light detection system was significantly upgraded at CERN from summer 2015 to summer 2017, after preliminary studies based on simulations and laboratory tests, devoted to optimizing the performance of the apparatus.
This paper presents the main characteristics and the realization of the new scintillation light detection system of ICARUS T600. Section 2 describes the ICARUS T600 detector. The design and optimization of the new light detection system is presented in Section 3. Section 4 reports the characteristics of the various components and their implementation. Finally some preliminary system tests, carried out after the transportation to Fermilab followed by the installation of the apparatus in the far detector building, are presented in Section 5.
2 The ICARUS T600 detector
The ICARUS T600 detector is made of two identical cryostats, filled with about 760 t of ultra-pure liquid argon [2]. Each cryostat houses two TPCs with 1.5 m maximum drift path, sharing a common central cathode made of punched stainless-steel panels. The cathode plane and field cage electrodes, composed by stainless-steel tubes, generate an ideally uniform electric field V/cm.
Charged particles interacting in liquid argon produce both scintillation light and ionization electrons. Electrons are drifted by the electric field to the anode, made of three parallel wire planes. A total of 53248 wires are deployed, with 3 mm pitch, oriented on each plane at a different angle (, ) with respect to the horizontal direction. By appropriate voltage biasing, the first two wire planes record signals in a non-destructive way, while the ionization charge is collected and measured on the last plane. The electronics was designed to allow continuous read-out, digitization and independent waveform recording of signals from each wire of the TPC, with 400 ns sampling time and 12-bit dynamic range [3]. The information of the ionization track occurrence time, combined with the electron drift velocity ( mm/s at V/cm) provides the event coordinate in the drift direction. The composition of the three views from the TPC wires yields the track projection on the anode plane. This information allows obtaining a full 3D reconstruction of the tracks, with a spatial resolution of about 1 mm3 [4].
The precise information of the event occurrence time is given by the LAr scintillation light which permits the generation of a light-based trigger signal and a preliminary identification of event topology for fast selection purposes [5]. The light information is a fundamental feature for the identification of signals related to the neutrino beam induced events. This requires a high performance light detection system as described in the following sections.
3 Design and optimization of the scintillation light detection system
3.1 Scintillation light emission in liquid argon
Scintillation light emission in LAr is due to the radiative decay of excimer molecules Ar produced by ionizing particles, releasing monochromatic VUV photons ( nm) in transitions from the lowest excited molecular state to the dissociative ground state. The emitted light is characterized by a fast ( ns) and a slow ( s) decay components. Their relative intensity depends on , ranging from 1:3 for minimum ionizing particles, up to 3:1 for alpha particles. This isotropic light signal propagates with negligible attenuation throughout each TPC volume. Indeed, LAr is fully transparent to its own scintillation light, with measured attenuation length in excess of several tens of meters and Rayleigh-scattering length of about 1 m [6]. Because of their short wavelength the scintillation photons are absorbed by all detector materials without reflection, leaving time and amplitude information unaffected during the photon path to the light detectors.
3.2 Scintillation light detection in ICARUS T600
A scintillation light detection system based on 74 ETL9357FLA ( diameter) PMTs mounted behind the wire chambers was adopted in the T600 detector for the LNGS run [7]. The sand-blasted glass window of each device was coated with about 200 g/cm2 of Tetraphenyl Butadiene (TPB), to convert the VUV photons to visible light. ICARUS at Fermilab will take data at shallow depth, facing more challenging experimental conditions than at LNGS. The light detection system will complement the 3D track reconstruction performed with the use of the TPC wires, thus contributing to identify neutrino interactions occurring in the BNB spill gate structure and rejecting the expected kHz cosmic background. This new environment requires a number of improvements, namely the adoption of a PMT model with better performances, an improvement of the sensitivity down to 100 MeV, a time resolution (1 ns) and an increase of the light detection granularity. This last requirement is needed to localize the track associated with every light pulse along the m of the longitudinal detection direction, with accuracy better than 1 m, namely shorter than the expected average spacing between cosmic muons in each TPC image. In this way, the light detection system would be able to unambiguously provide the absolute timing for each track, and to identify, among the several tracks in the LAr TPC image, the event in coincidence with the neutrino beam spill.
The adoption of large area PMTs coated with TPB was considered the best solution for the light detection system upgrade. The use of alternative devices, such as SiPM detectors, was considered not mature enough for applications in large volume LAr-TPC because of their small sensitive surface.
3.3 Optimization by Monte Carlo simulation
Dedicated Monte Carlo simulations were realized to design and optimize the light detection system for the refurbishing of the T600 detector.
Initially, the focus was put on the geometrical properties of the propagation of the VUV scintillation light in ICARUS, with some simplifications on the features of the topology of the considered class of events [8]:
-
1.
electromagnetic (e.m.) showers, mimicking Neutral Current (NC) and Charged Current (CC) interactions from BNB;
-
2.
single crossing cosmic muons, which represent the most abundant source of background;
-
3.
muons generated from CC interactions.
Fine details of physical events, such as e.m. showers shape or particle multiple scattering, were found to be less important than the spatial resolution achieved with diameter devices spaced by (1 m). Muons were schematized as straight lines, while e.m events as clusters of points with 1 MeV deposited energy each. Showers energy spanned from 100 MeV to 1 GeV, to cover all the expected energy range in the SBN configuration. Muons generated from CC interactions were a superposition of the other two event topologies. From each point along the simulated track, the proper number of photons was generated isotropically; due to the short wavelength, LAr scintillation light is absorbed by all the detector material, so no reflection was assumed. A Rayleigh scattering length of 90 cm was considered. A 5% overall Quantum Efficiency (QE) was conservatively assumed for the PMTs, which includes wavelength shifting conversion efficiency and geometrical factor: about 50% of the light is loss during conversion. This QE value was adopted following the working hypothesis of using ETL9357FLA PMTs coated with TPB by means of a spraying technique, as realized for the LNGS run [7]. An error of ns on the arrival time and a 10% uncertainty on the number of collected photons were assumed, to take into account the PMT response uncertainties according to experimental measurements results [8, 9].
Different PMT positioning layouts with and diameter PMTs were considered to study the performance both for cosmic muons and for e.m. showers in the T600 detector. Configurations with different numbers of PMTs were also considered, starting from 27 devices ( PMTs) up to 210 devices ( PMTs) per TPC. The pattern of each layout was constrained by the existing mechanical structure of the T600: the requirement was not to change it, exploiting the free space already available in this structure.
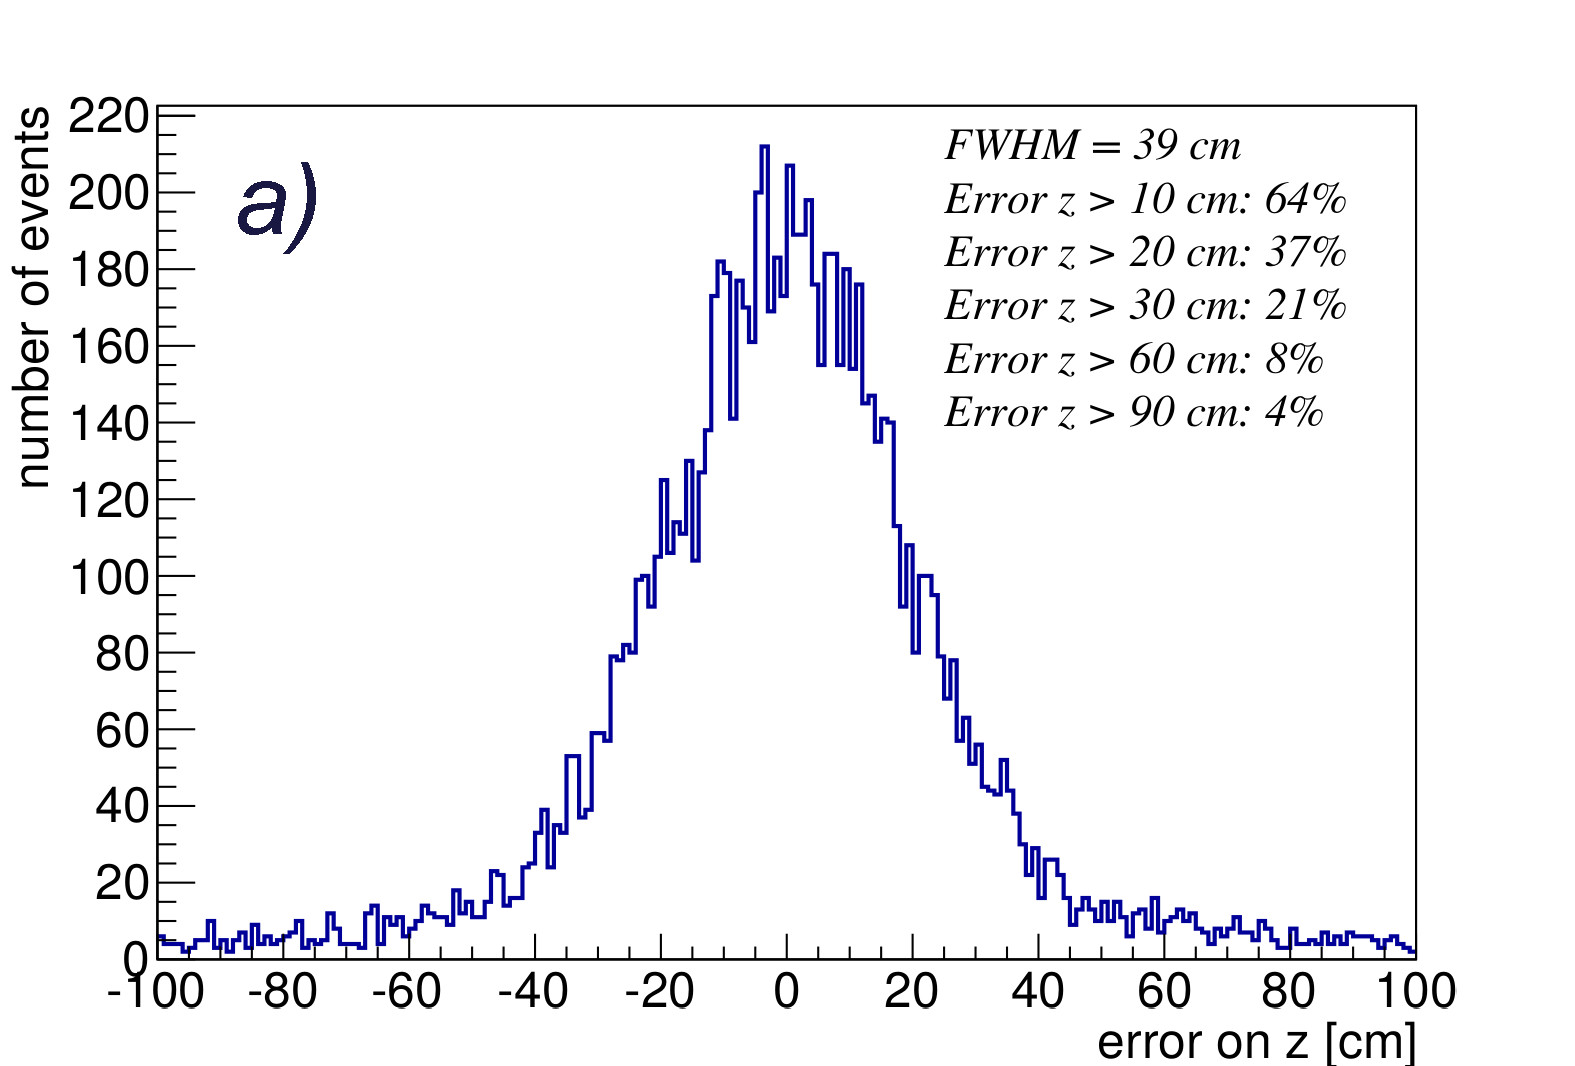
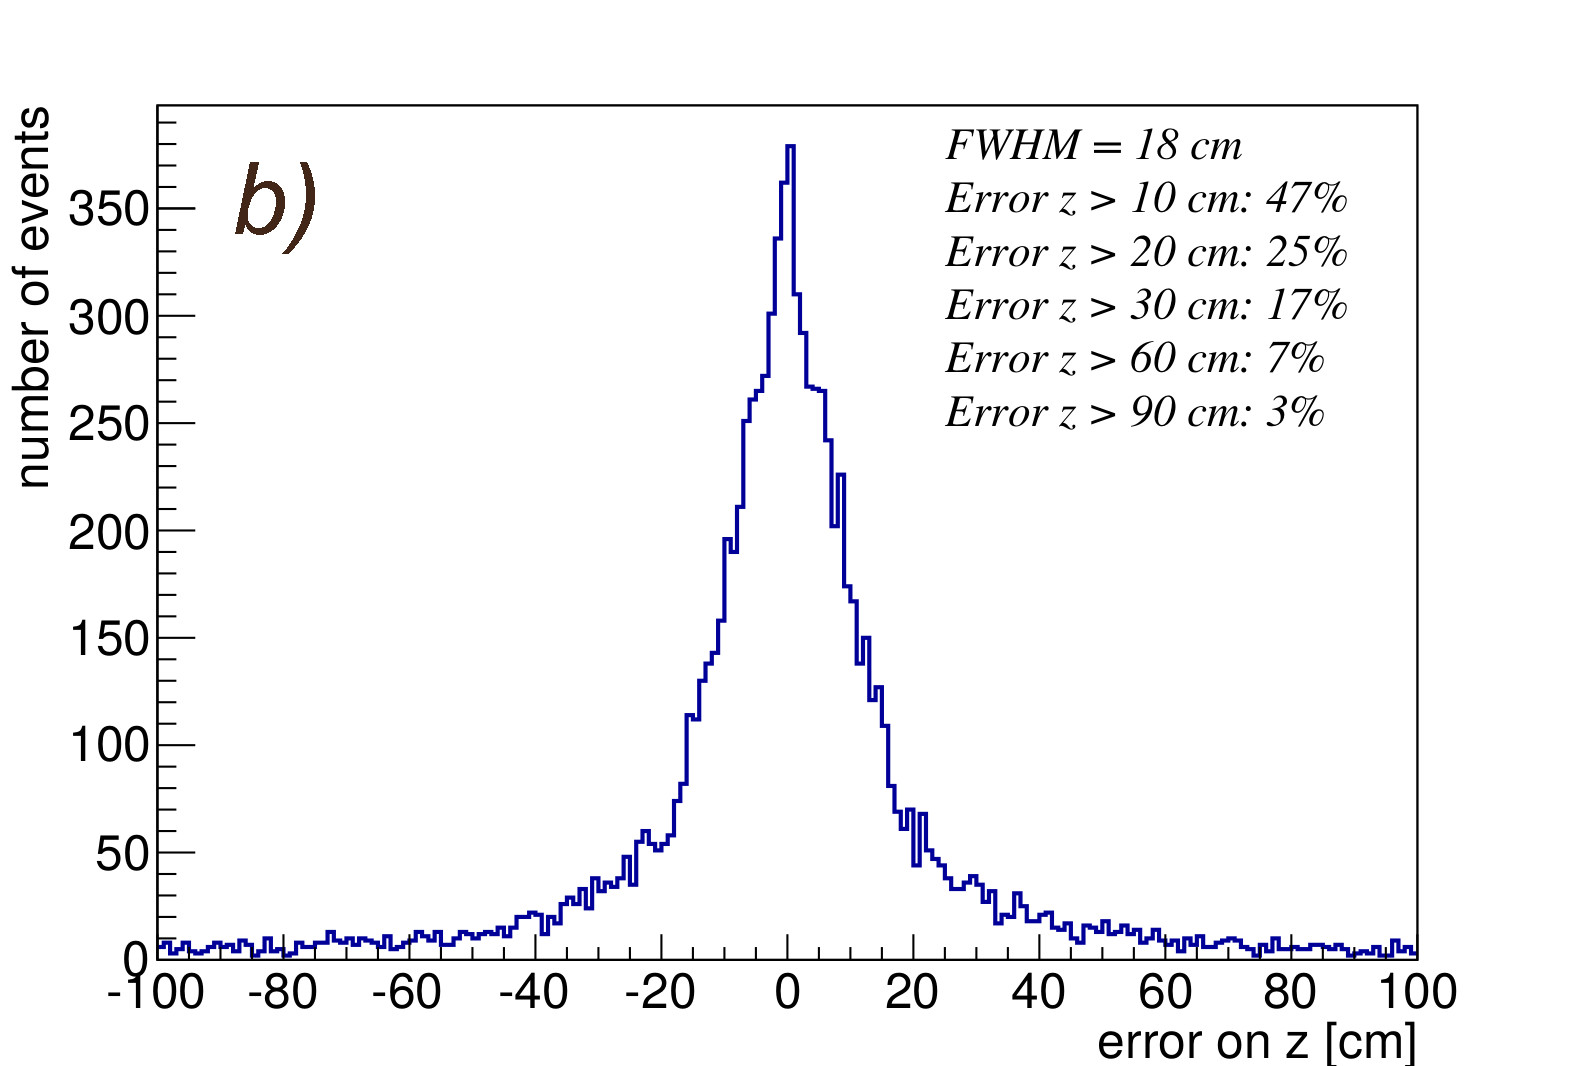
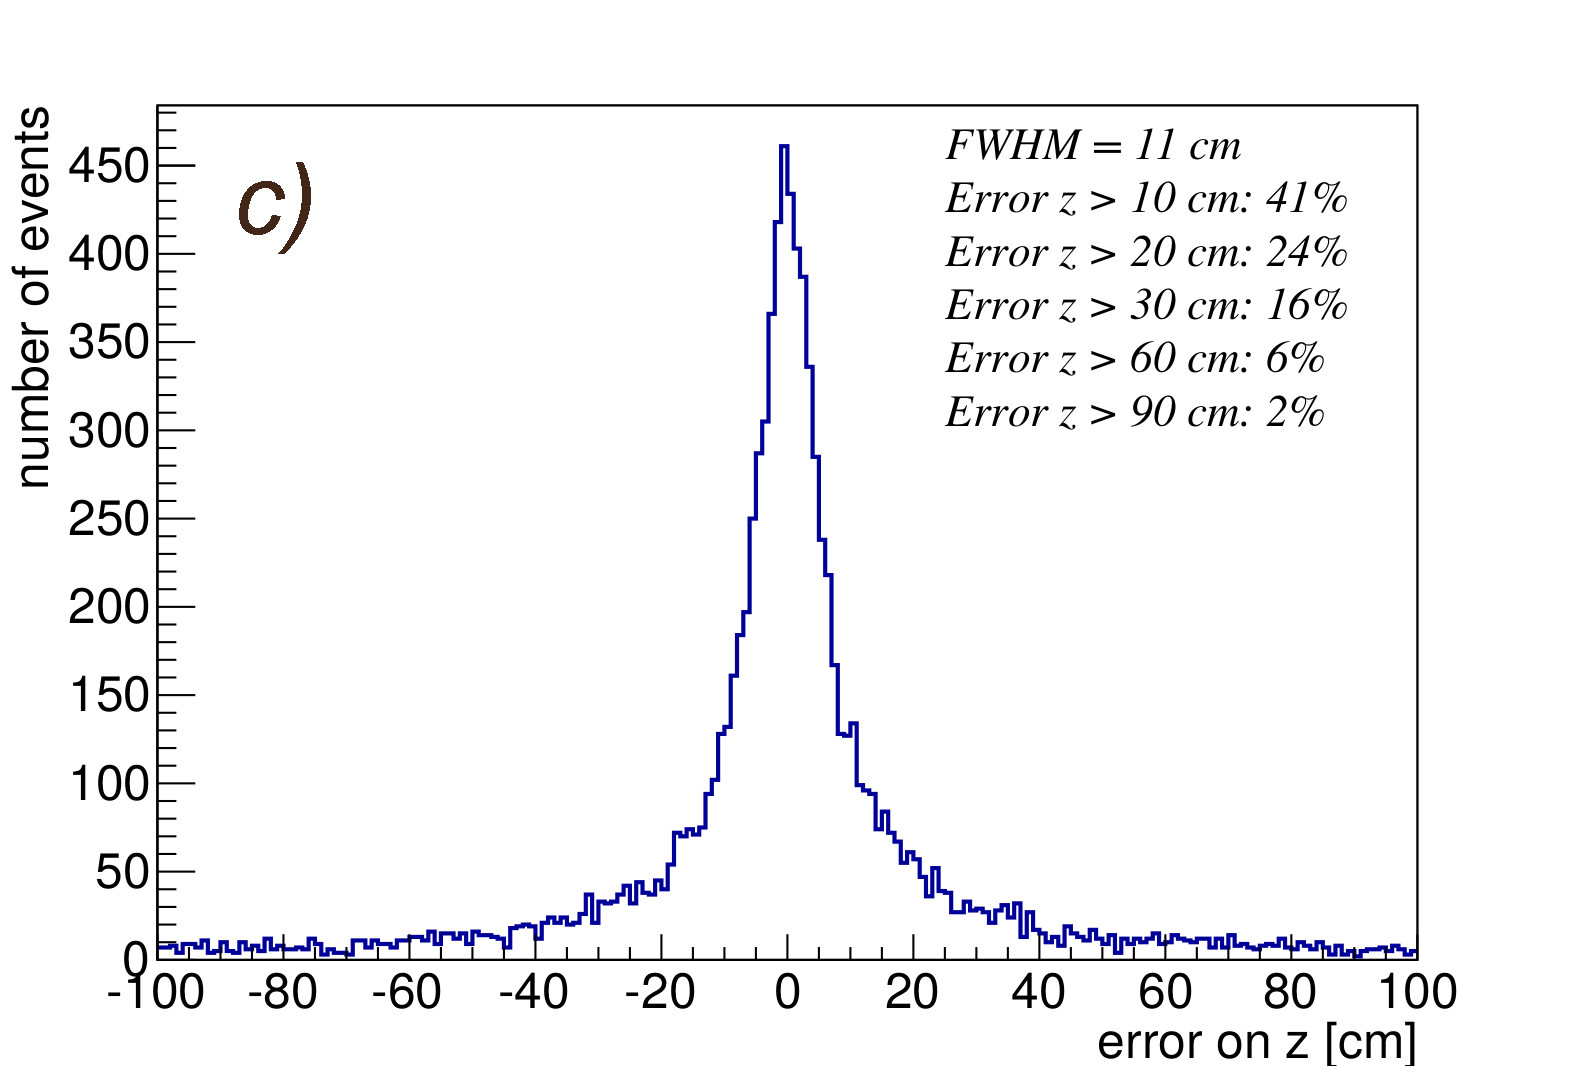
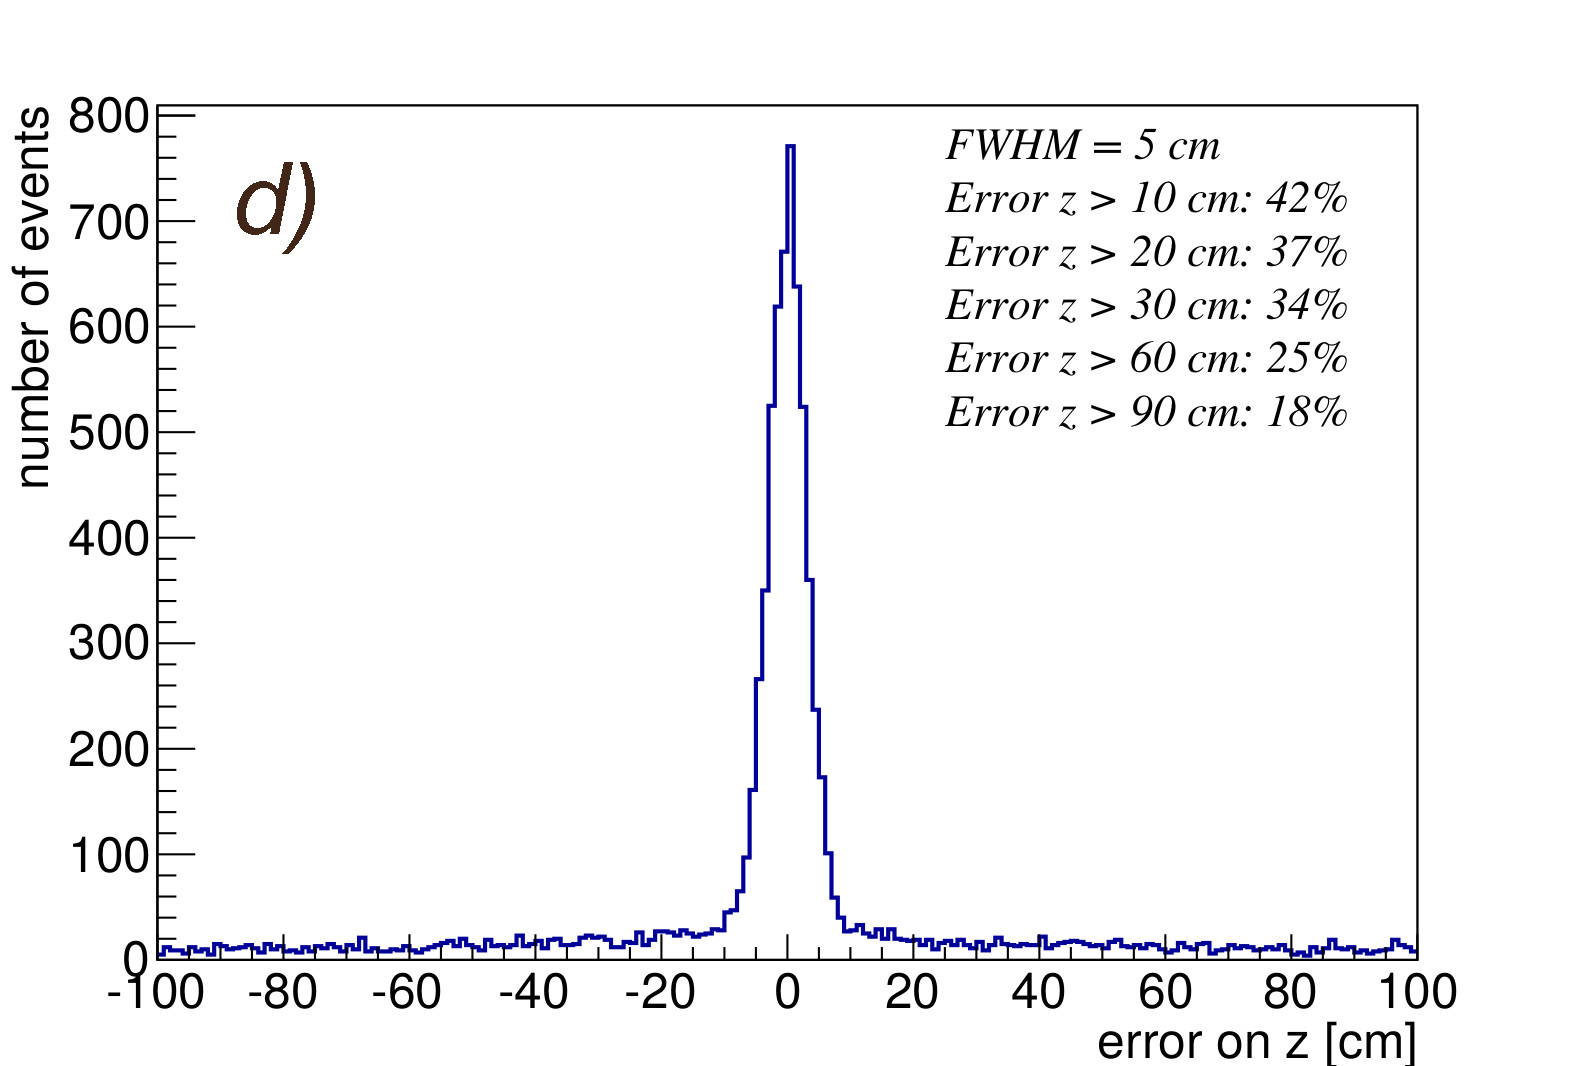
For what concerns the event position reconstruction, simulations were carried out to evaluate the capabilities of the different configurations to localize the e.m. showers, mainly along the 18 m length on the beam direction (z axis). The error on the event position reconstruction was calculated as the difference between the actual geometrical center of the event and the one derived from the average on the PMT coordinates, weighted on the light collected by each PMT. The best results were obtained by the set of geometries with the highest numbers of PMTs, as shown in figure 1 for a) 27 () PMTs, b) 90 () PMTs, and c) 210 () PMTs. Anyway the difference among them is not significant and performance improvements can be obtained just by refining the reconstruction algorithm. For example, just considering in the average on the PMT position only those devices with a signal above a threshold of 10 phe, as shown in figure 1 , the 90 () PMTs configuration shows a localization capability which is better than the one obtained with the 210 () PMTs configuration.
A more detailed study of the PMT system performance was then carried out within LArsoft, which is a framework supporting a shared base of physics software across LAr-TPC experiments. In particular, the ICARUS T600 detector description and the particle generation and propagation in the ICARUS volume are determined within Geant4 software which is implemented in LArsoft. The ICARUS T600 inner detectors main components (wires, PMTs, cathode, field cage) are faithfully reproduced. Both single BNB and interactions and cosmic ray samples were generated inside the active volume of one of the two modules of ICARUS. LArsoft framework covers basic components of the real scintillation detector system and includes all relevant physical processes. With the complete simulation, individual physical factors that can affect the performance of the detector system, such as detector geometry, surface finishing, decay time and scintillation yield of scintillator as well as the actual response of PMTs, presented in Sections 4.1 and 4.2, and front-end electronics, are taken into account [10].
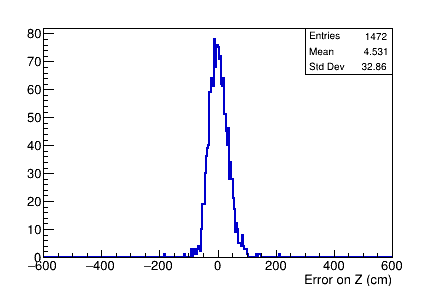
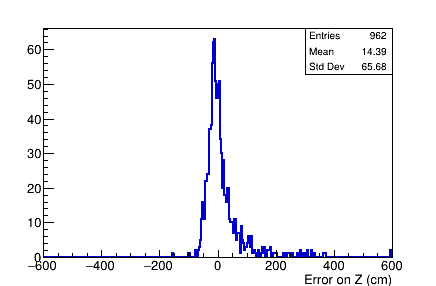
The impact of the layout with 90 () PMTs for each TPC in terms of neutrino vertex localization, as obtained from LArsoft simulation of BNB CC and CC events, is illustrated in figure 2: provided the timing information from all PMTs is available, an accuracy of less than 15 cm and a precision of about 30 cm (70 cm) for CC (CC) was obtained by estimating the neutrino vertex position from the light barycenter of the first three hit PMTs.
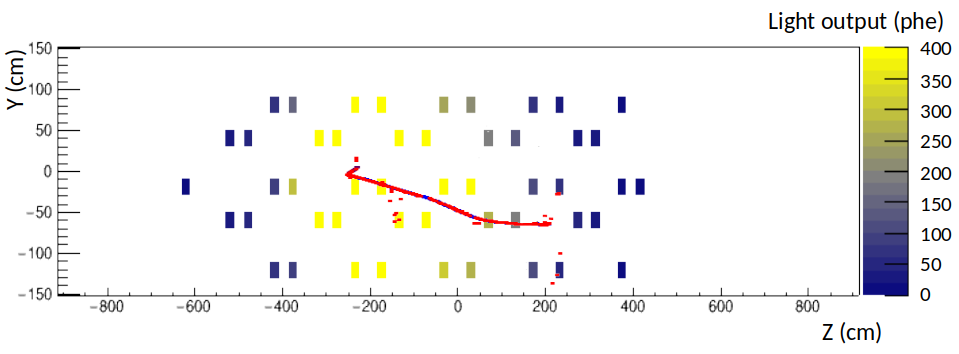
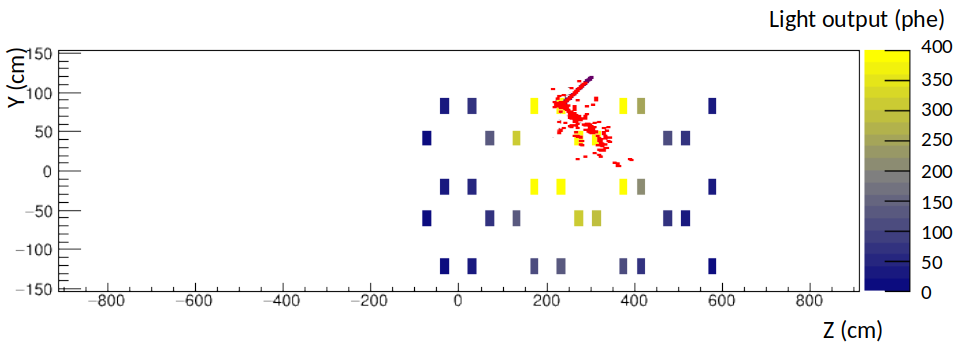
Finally, this analysis opens the possibility to directly match the event position as determined by the analysis of the charge with light information coming from PMTs. This could help in developing a quick first level event tagging using the light signals. As an example of the localization capability, two neutrino events reconstructed from the TPC wires are shown superimposed with the map of PMTs in in figure 3.
The described MC simulations led to select the 90 () PMTs layout for installation on the ICARUS T600 TPCs. This layout implies the use of 360 PMTs with diameter, corresponding to a coverage of 5% of the wire plane surface. The estimation of the number of photo-electrons collected per MeV of deposited energy in a single TPC gives an average of about 15 phe/MeV (9 phe/MeV for events close to the cathode). The possibility to adopt the scintillation light for triggering and timing purposes with events down to 100 MeV is then assured in the whole TPC volume.
4 Hardware implementation
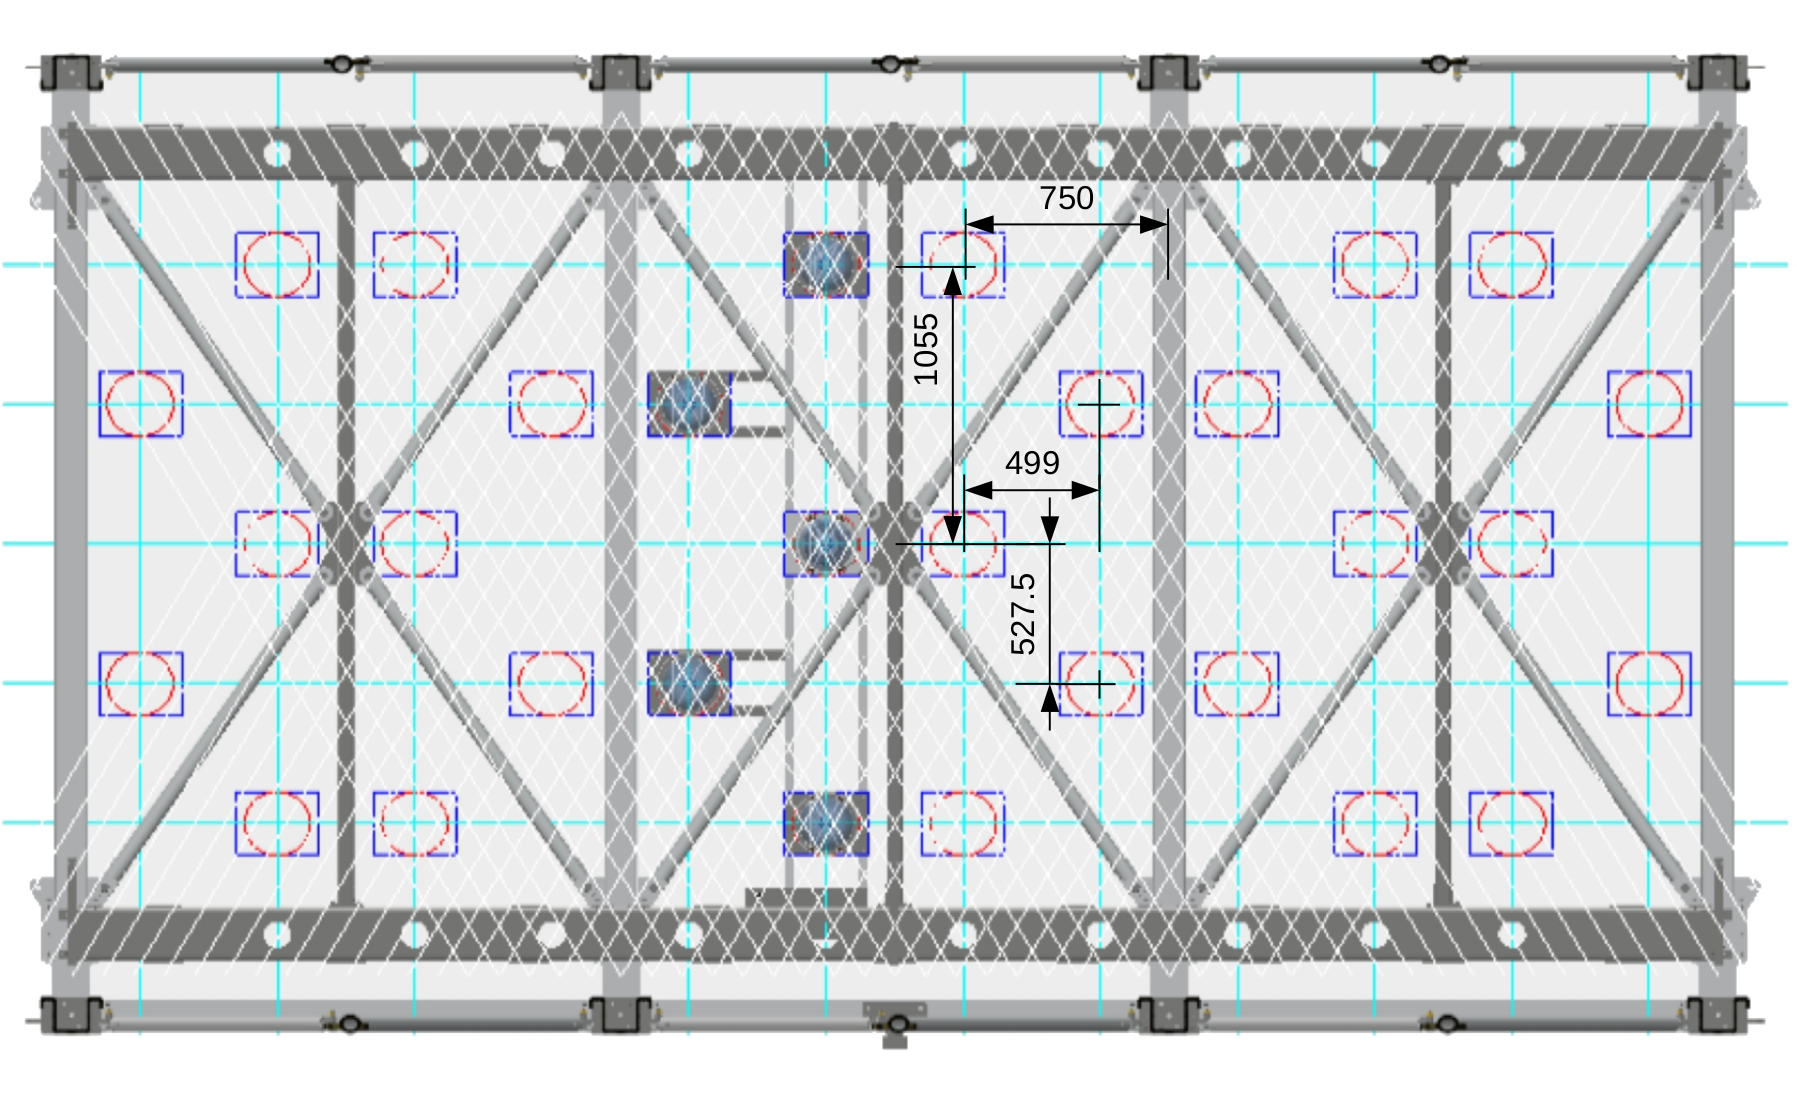
The realized PMT layout, shown in figure 4, features 360 total Hamamatsu R5912-MOD PMTs deployed in groups of 90 devices behind each wire chambers. Since the PMT glass windows is not transparent to the scintillation light produced in liquid argon, each unit was coated with a proper wavelength shifter re-emitting in the visible. The PMTs were installed using dedicated mechanical supports. A laser calibration system permits the timing calibration of the single units.
In this section the ICARUS T600 scintillation light detection system is described, presenting the main characteristics of its different components.
4.1 Photomultiplier tubes
In order to identify the most suitable model to the requirements of the light detection system of ICARUS T600, a test campaign was carried out on different PMT samples manufactured by different producers, such as Hamamatsu and ETL [11, 12, 13, 14]. All the PMTs taken into consideration feature an hemispherical glass window with bialkali photocathode on platinum undercoating, to guarantee high performance at cryogenic temperatures. The evaluation of their conformity was based on the following considerations:
-
-
The scintillation light detection system should guarantee a good sensitivity to ionizing interactions in LAr down to an energy deposition of 100 MeV. To this end the quantum efficiency and its uniformity over the sensitive surface of PMTs have a strong impact on the global efficiency of the system. The effective values of these parameters resulting from actual measurements on PMT prototypes are considered distinguishing features for the model selection.
-
-
The dynamics of the scintillation light detection system should permit the recording of the scintillation light fast component pulses and, at the same time, of single photons arriving from the slow component de-excitation. In addition it has to cope with the expected wide variation of light intensity which depends on the deposited energy and on the geometry of interactions inside the LAr volume. Taking into account a standard electronics for PMT signal recording without pulse amplification, a gain at cryogenic temperature is necessary to detect single photons. In addition the PMT dynamics should permit the generation of anode pulses without remarkable saturation up to hundreds of photoelectrons.
-
-
The light collection system should be able to provide unambiguously the absolute timing of each interaction and identify, among the several tracks in the LAr-TPC image, the event in coincidence with the neutrino beam spill. In order to achieve (ns) timing resolution, fast PMT pulses are needed. Moreover good stability of the transit time as a function of temperature and applied voltage, low time spread and a good uniformity over the PMT sensitive windows surface are required.
-
-
Since a large number of PMTs is used, the presence of a high dark count rate can affect the detector performance inducing stochastic coincidences at trigger level. From each PMT a single-photo-electron physical background rate of tens of kHz is expected in LAr. This rate consists of residual photons produced from the decay of 39Ar or other radioactive contaminates. Therefore an intrinsic dark count rate of a few kHz at cryogenic temperatures is judged acceptable. On the other hand the absence of bursts, sparkling, lightening effects or other noise generating pulses above the single photon level is considered mandatory.
-
-
ICARUS T600 will operate in absence of external magnetic fields, except for the earth’s intrinsic field. Therefore the main PMT performances should not be degraded by external magnetic fields of the order of gauss at different axial orientations.
-
-
The adopted devices should withstand low temperatures and the relative high pressure as expected in LAr immersion. All the considered PMT models were subjected to a series of thermal shocks to highlight possible mechanical or cracking problems.
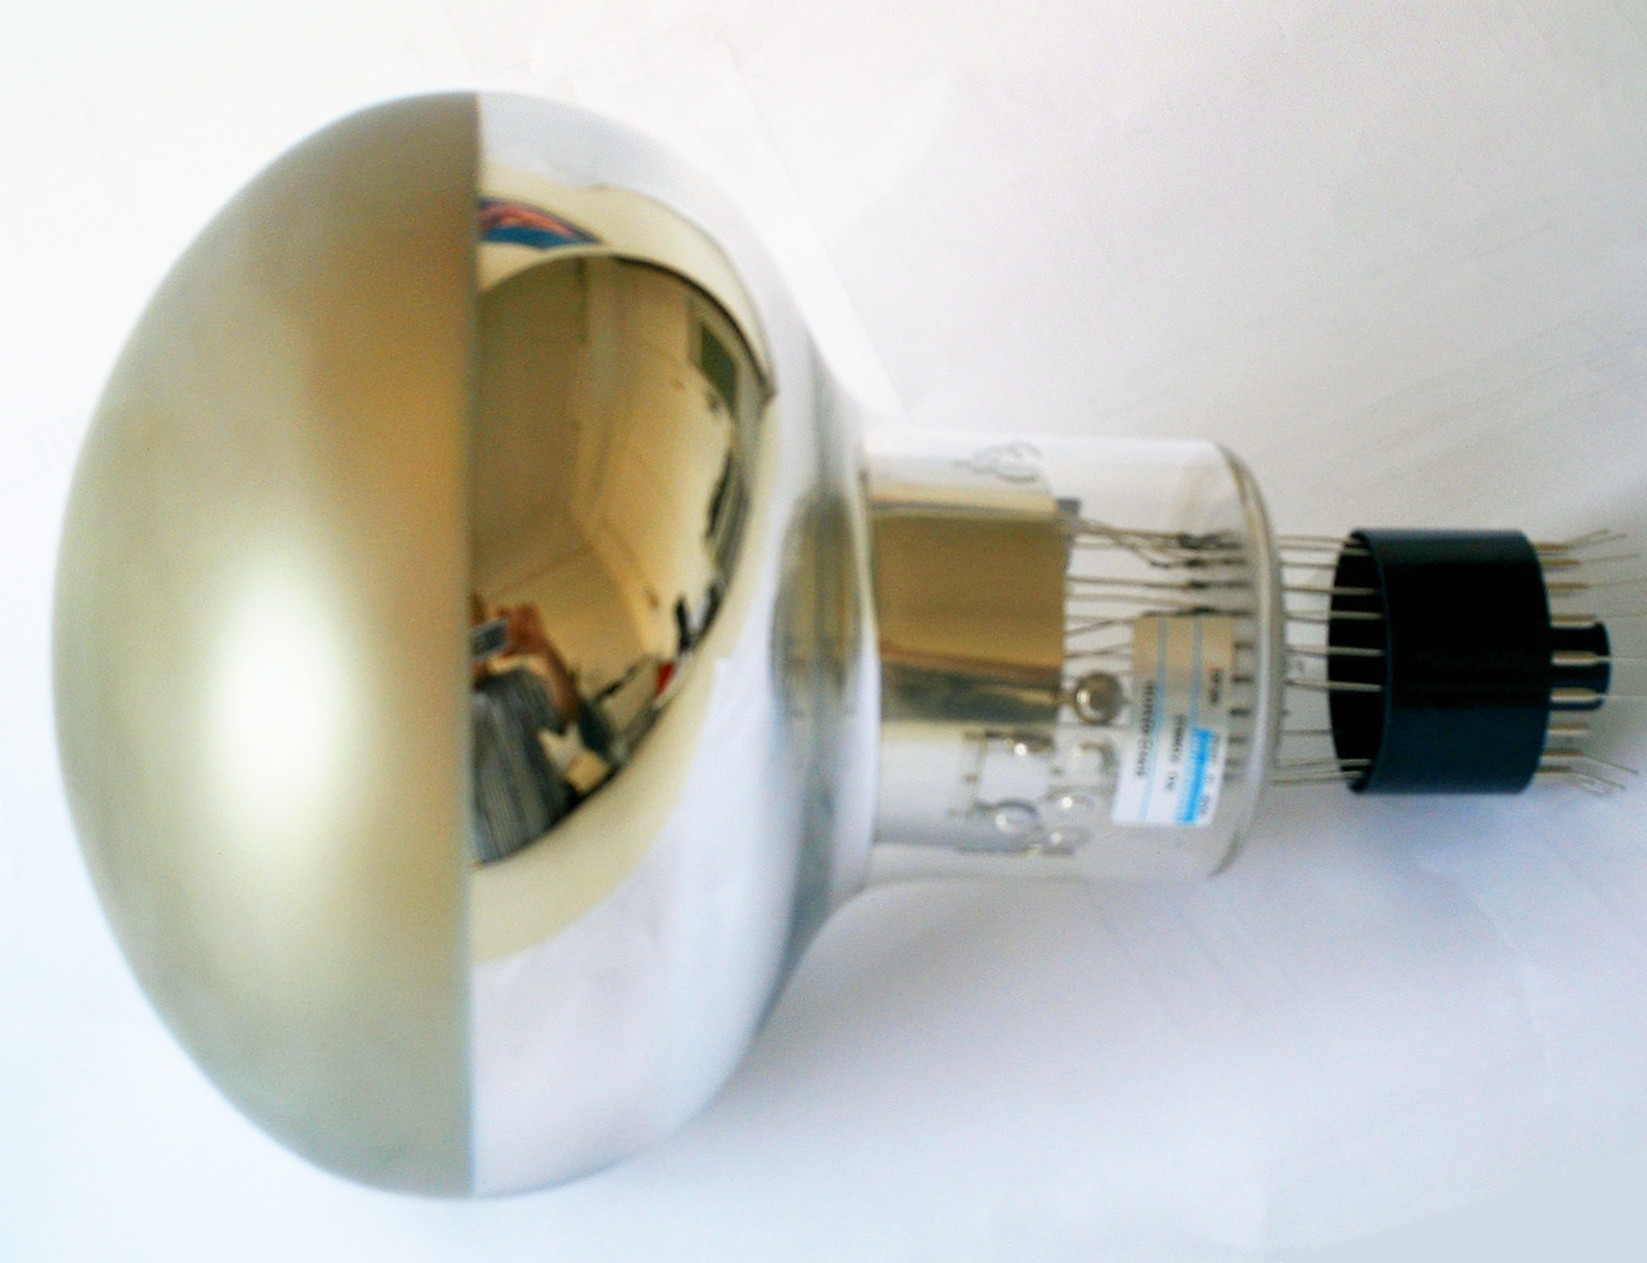
Best results were obtained with the Hamamatsu R5912-MOD device (see figure 5) which was therefore selected for installation. The main features and the characteristics resulting from the tests are summarized in table 1.
| Spectral Response | nm |
|---|---|
| Window Material | Borosilicate glass (sand blasted) |
| Photocathode | Bialkali with Pt under-layer |
| Max suppy voltage (anode-cathode) | 2000 V |
| Photocathode Q.E. at 420nm | % |
| Photocathode Q.E. surface uniformity at 420nm | within % of mean value |
| Number of dynodes | 10 |
| Typical Gain | at 1500 V |
| Nominal anode pulse rise time∗ | ns |
| Nominal P/V ratio∗ | 2.5 |
| Max. dark count rate∗ | 5000 s-1 |
| Max. transit time variation | 2.5 ns (center-border) |
| Transit time spread (RMS) | 0.7 ns |
| Pulse linearity variation∗∗ | % up to 150 phe |
| % up to 300 phe | |
| ∗ Values for | |
| ∗∗ Values for at 87 K [14] |
For the upgrade of the ICARUS T600 scintillation light detection system, 400 Hamamatsu R5912-MOD PMTs were procured in 2016. All the samples were tested at room temperature and 60 of them were also characterized at cryogenic temperatures, in liquid argon bath during a test campaign carried out at CERN in 2016 and 2017 [15]. All the 400 PMTs were rated compliant with the requirements for installation in the T600.
Each device was equipped with a proper base voltage divider directly welded on the PMT flying leads. The base circuits, entirely passive, were manufactured with SMD resistors and capacitors able to withstand the LAr temperature. The reference voltage distribution ratio is the standard recommend by Hamamatsu. A particular care was devoted to the choice of damping resistors to improve the PMT time response. Detailed design and specifications are presented in reference [15].
4.2 Wavelength shifter deposition
The glass window of this PMT model is not transparent to the scintillation light produced by liquid argon. The sensitivity to vacuum-ultra-violet (VUV) photons was achieved by depositing a layer of a proper wavelength shifter on the PMT windows.
1,1,4,4-Tetraphenyl-1,3-butadiene, or TPB, is an organic fluorescent chemical compound generally used as wavelength shifter, thanks to its extremely high efficiency to convert ultra-violet photons into visible light. To obtain effective TPB layers on a large number of PMTs, ensuring at the same time a high repeatability and reliability of the operation, a dedicated thermal evaporator was instrumented and a specific evaporation procedure was defined [16].
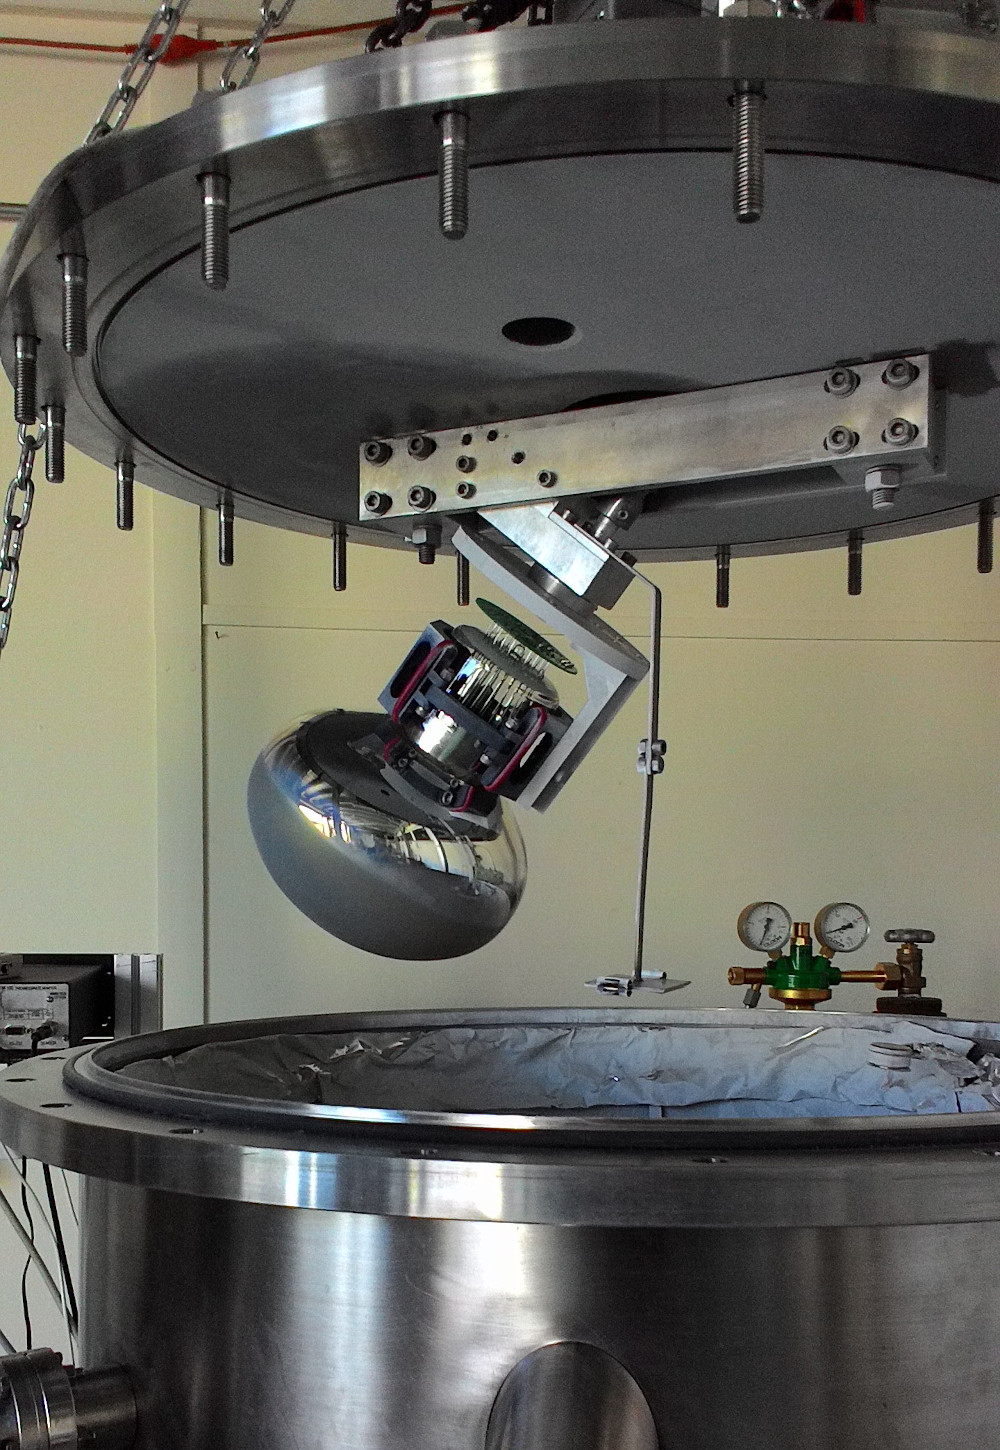
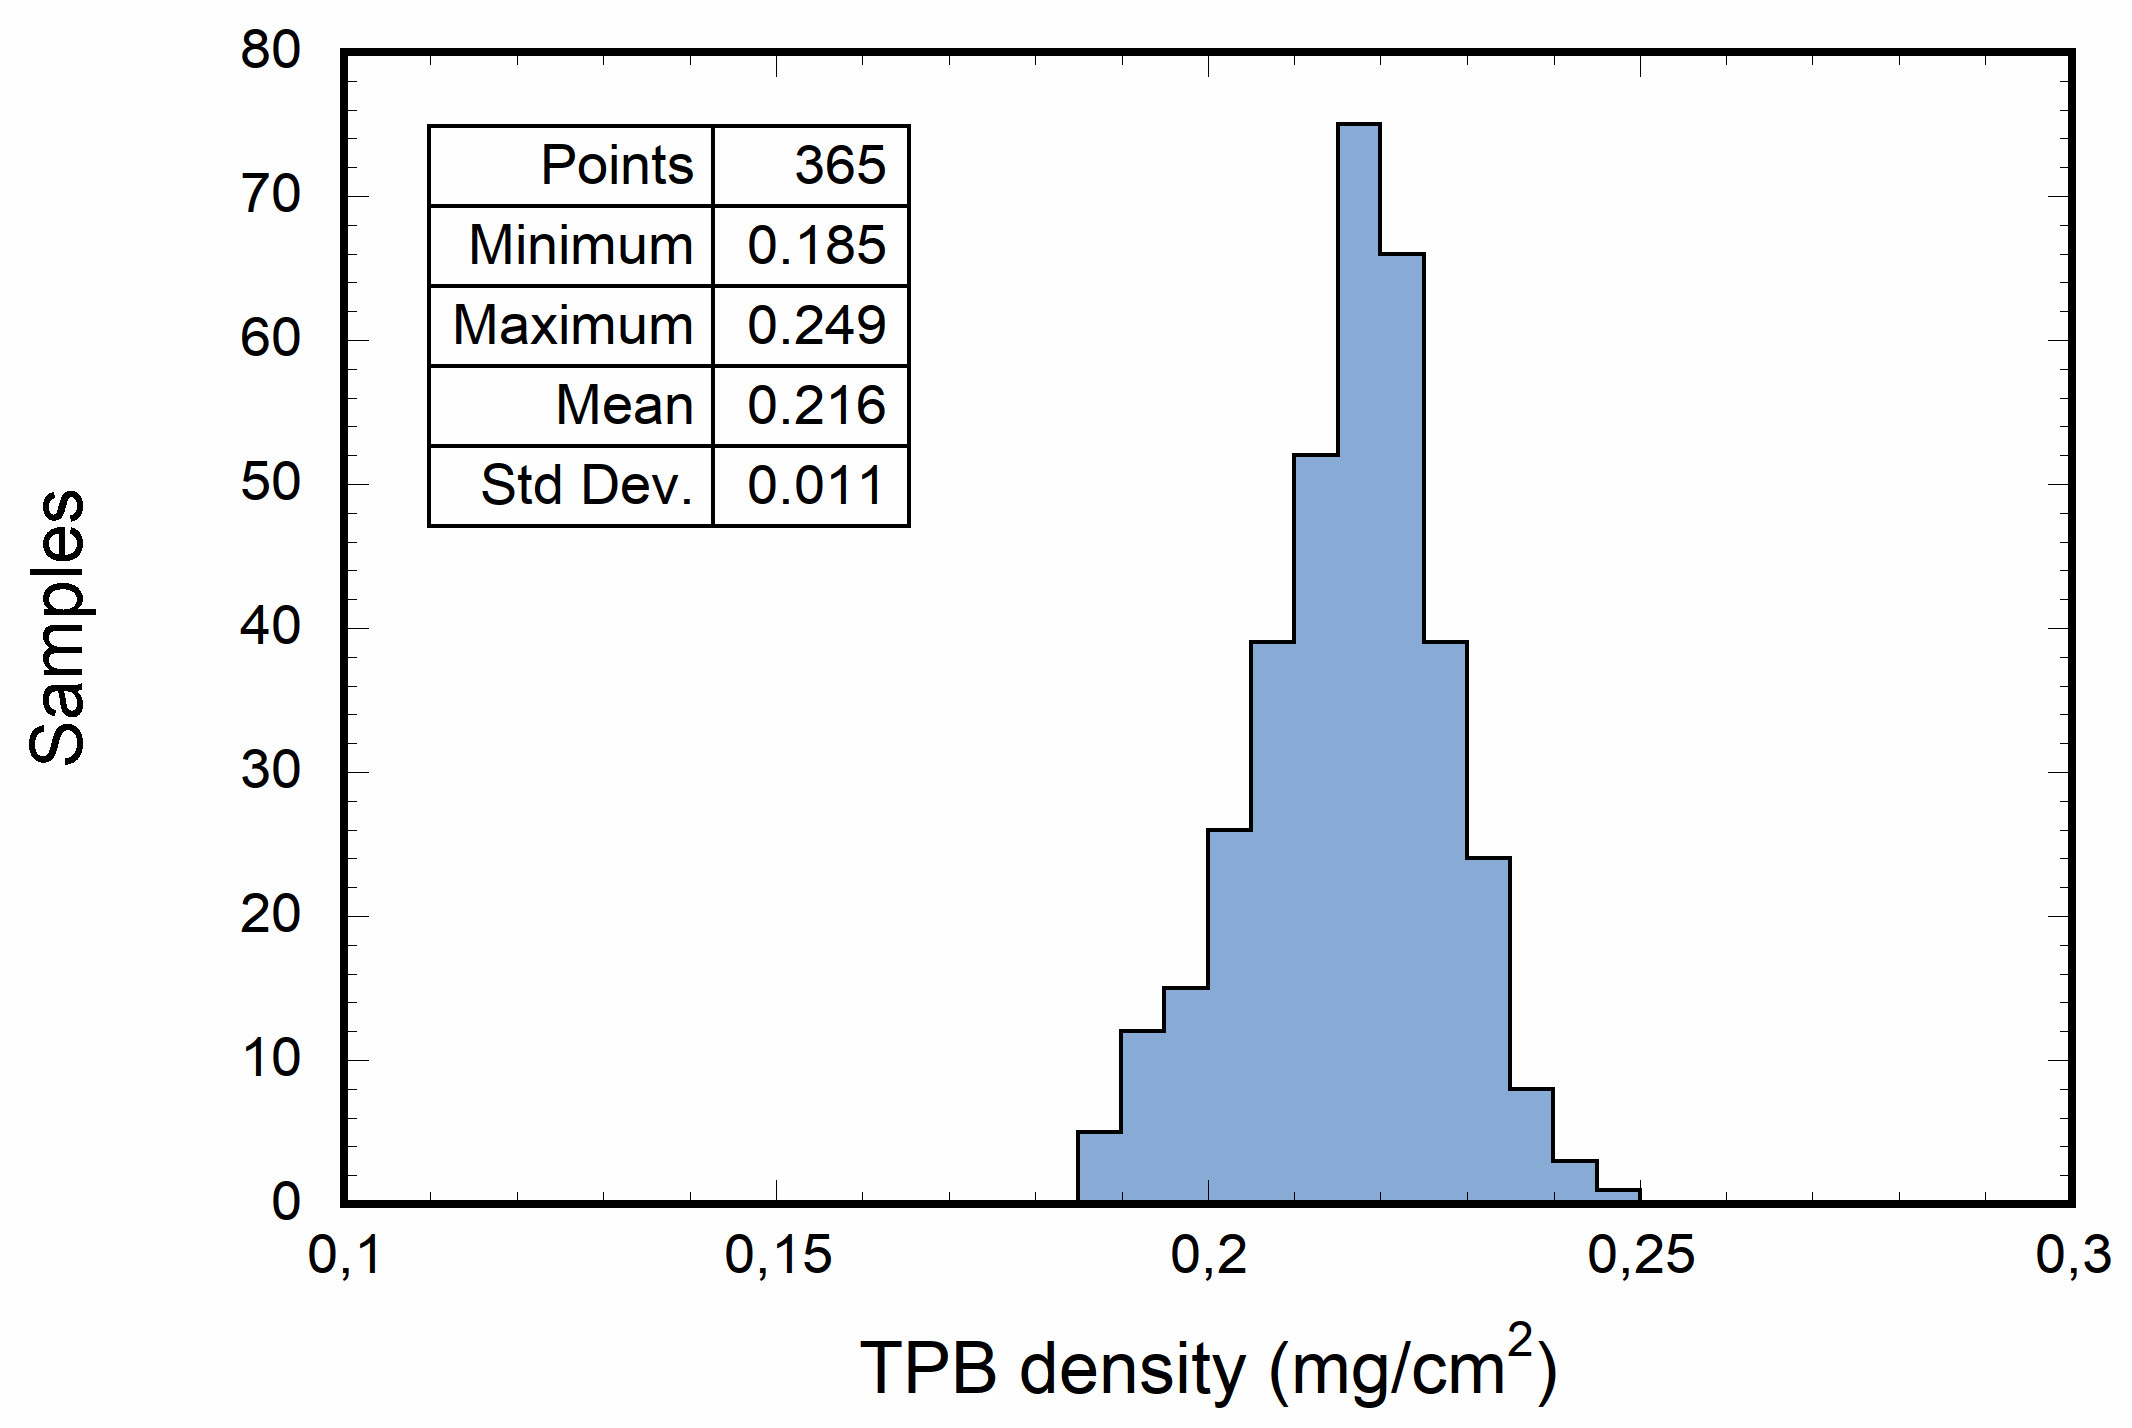
The thermal evaporator consists of a vacuum chamber, 68 cm high and 64 cm diameter, closed at both sides by means of two large flanged plates444The thermal evaporator and the optical test system cited in this paper were funded by the italian INFN (“Istituto Nazionale di Fisica Nucleare”) and MIUR (“Ministero dell’Istruzione, dell’Università e della Ricerca”) within the PRIN (“Progetto di Rilevante Interesse Nazionale”) program.. The PMT to be coated is fastened to a specific rotating support looking downwards and inclined of angle with respect to the vertical direction, as shown in figure 6. The rotating structure, fixed below the chamber top plate, is connected to an external motor by a ferrofluid-based feedthrough allowing a rotation speeds of 10 turns/min. The vacuum chamber houses a temperature controlled Knudsen cell, placed on the bottom plate at a distance of about 14 cm below the PMT surface. For each deposition the cell crucible was filled with about 0.8 g of TPB and left to evaporate at a temperature of for about 10 min, yielding a uniform TPB coating of about 220 g/cm2 on the PMT sensitive surface. This density value was proven to guarantee a high conversion efficiency and the absence of adhesion instabilities on sand-blasted glass at cryogenic temperatures after immersion in LAr [17].
The effectiveness of this technique from the point of view of deposition uniformity and light conversion efficiency was validated by simulations and experimental tests before being accepted for the TPB coating of the 360 Hamamatsu R5912 of ICARUS T600 light detection system. The treatment of a total of 365 PMTs was carried out at CERN Technology Department in around 120 working days. The distribution of the resulting TPB coatings is shown in figure 7.
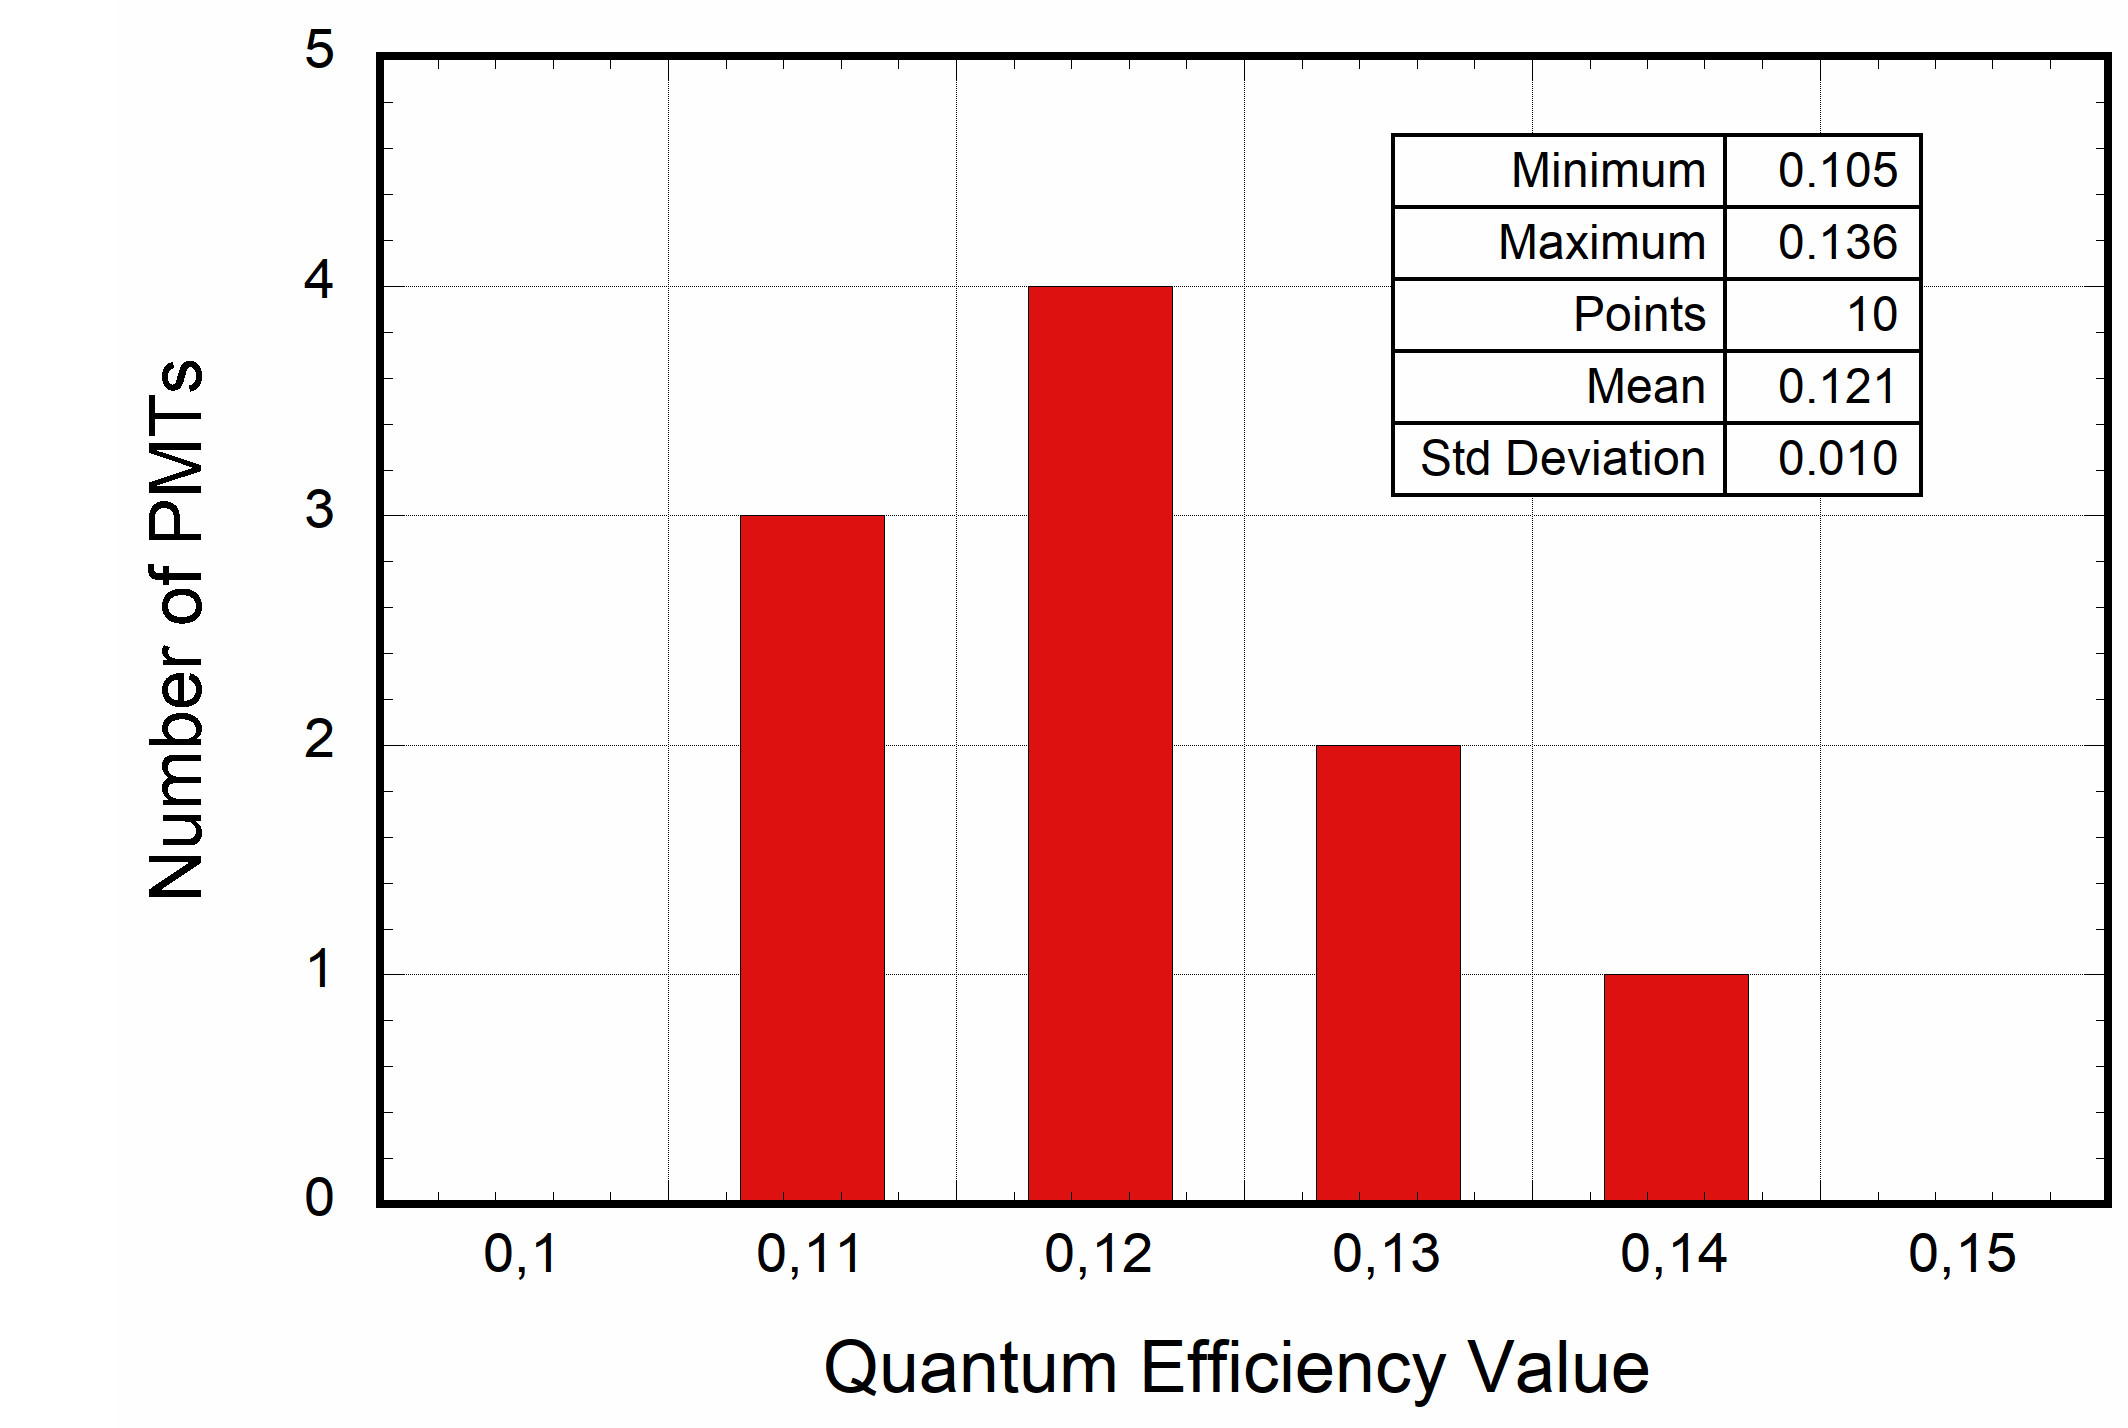
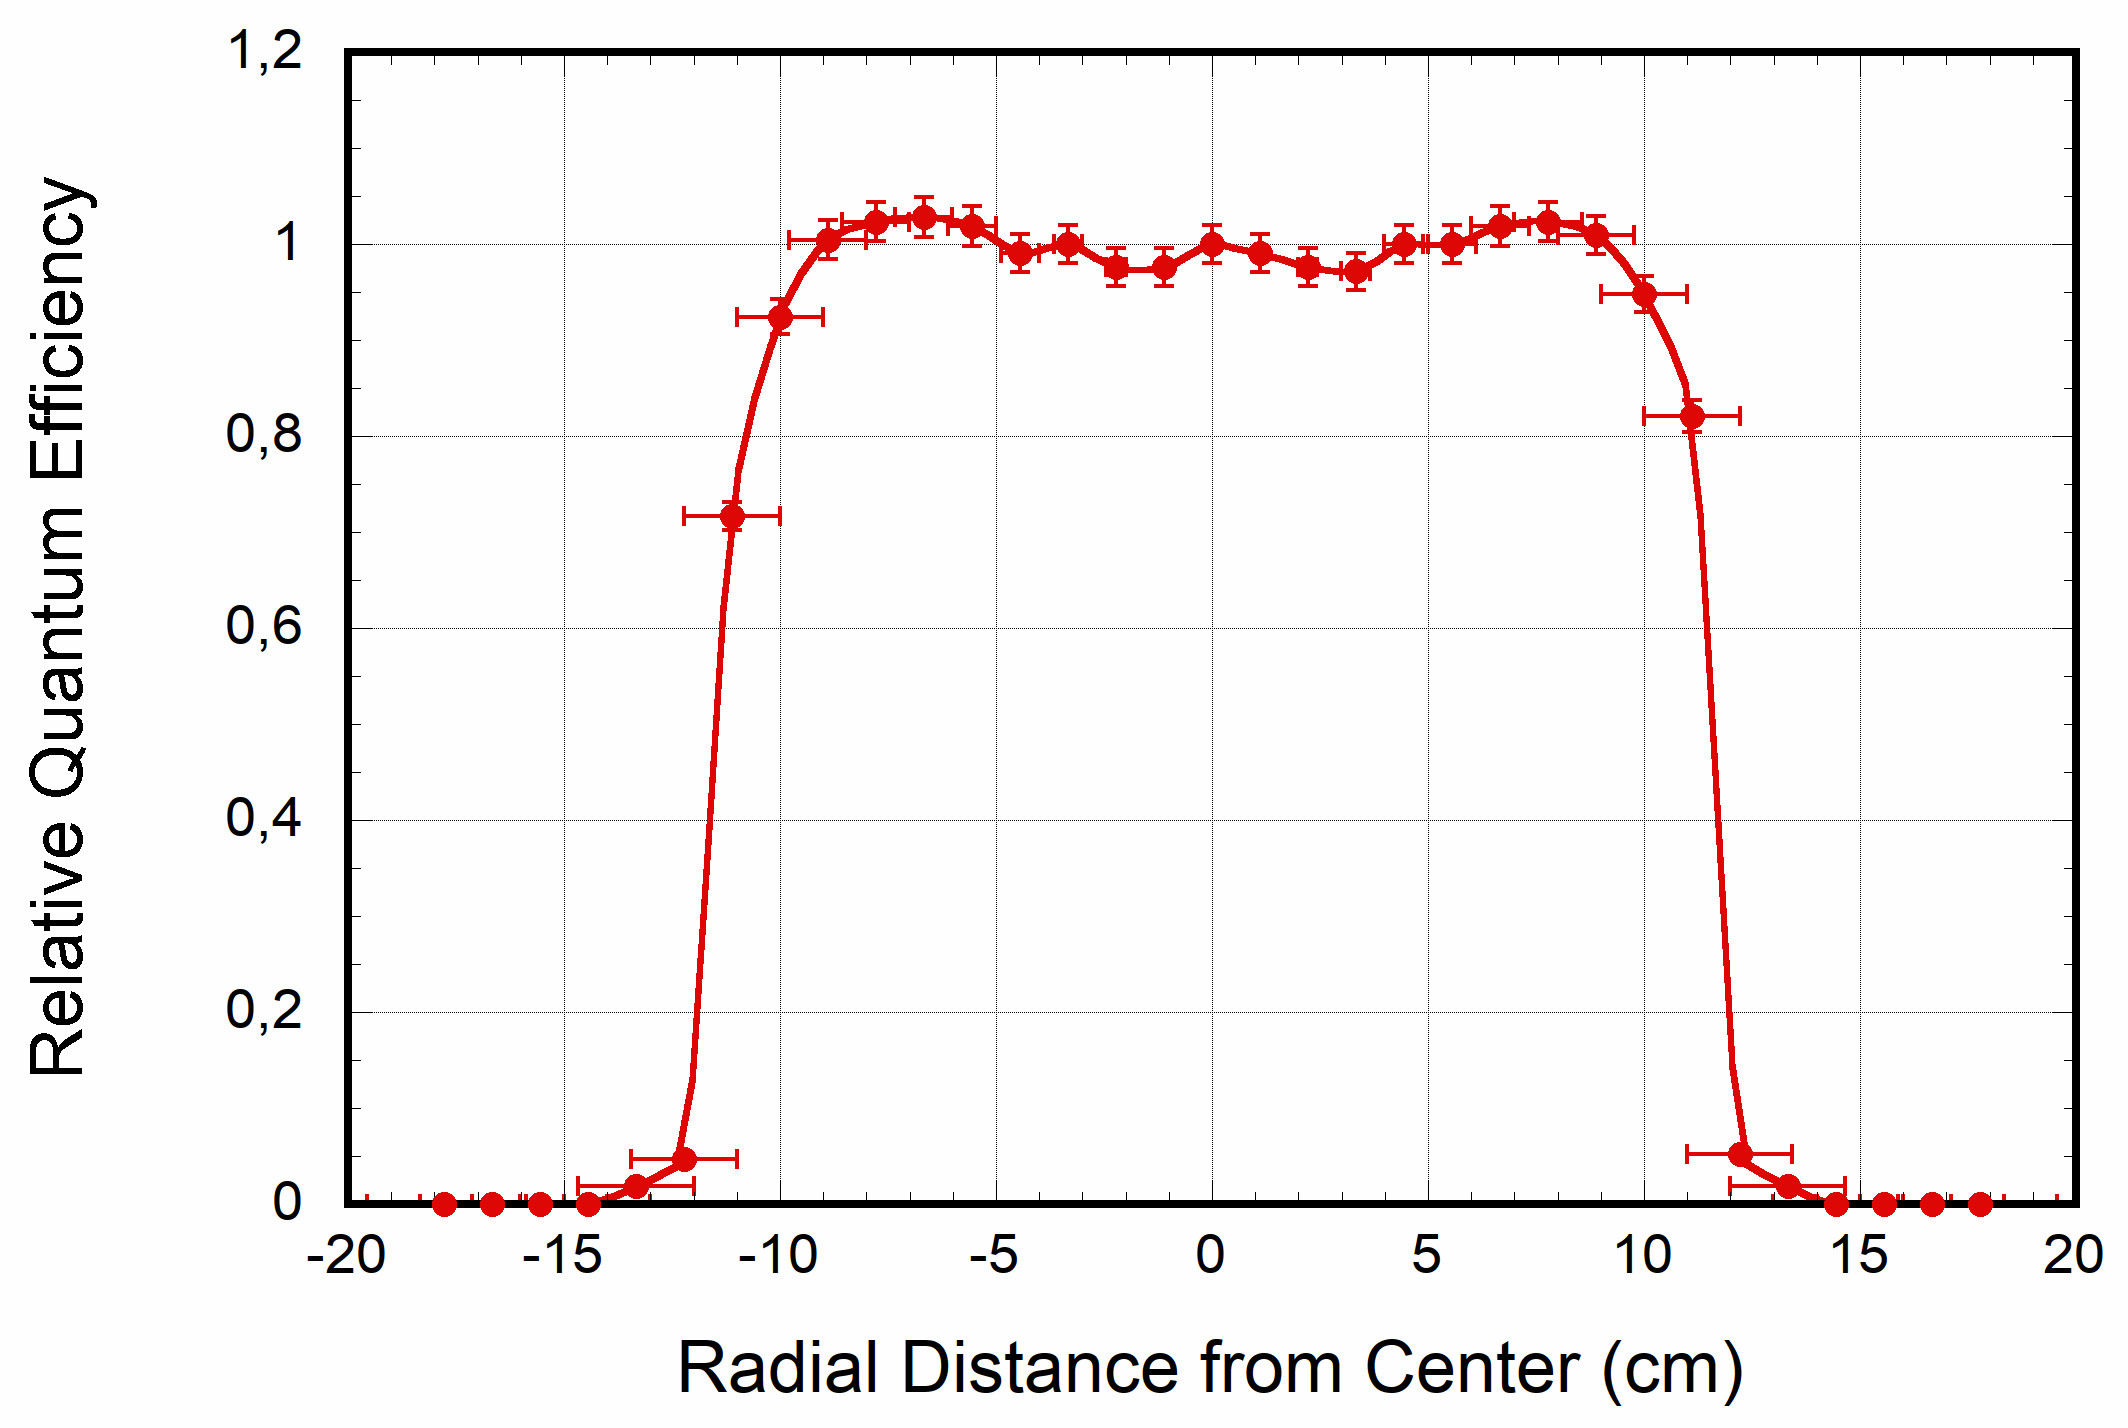
The effective value of the quantum efficiency at nm and its uniformity as a function of the position on the photocathode window was measured by means of an optical test system on 10 PMT samples. The quantum efficiency was evaluated by comparing the currents given by the PMT under VUV illumination and by a reference calibrated photodiode555 Light at nm is generated by a 30 W deuterium lamp (McPherson 632) and selected by a monochromator (McPherson 234/302). The reference is a NIST calibrated photodiode.. Values are distributed in the range, with an average value of 0.12, while for each PMT the uniformity results to be within % around the mean value, as shown in figure 8, in agreement with the nominal surface uniformity at 420 nm without TPB.
4.3 Deployment and installation of the PMTs
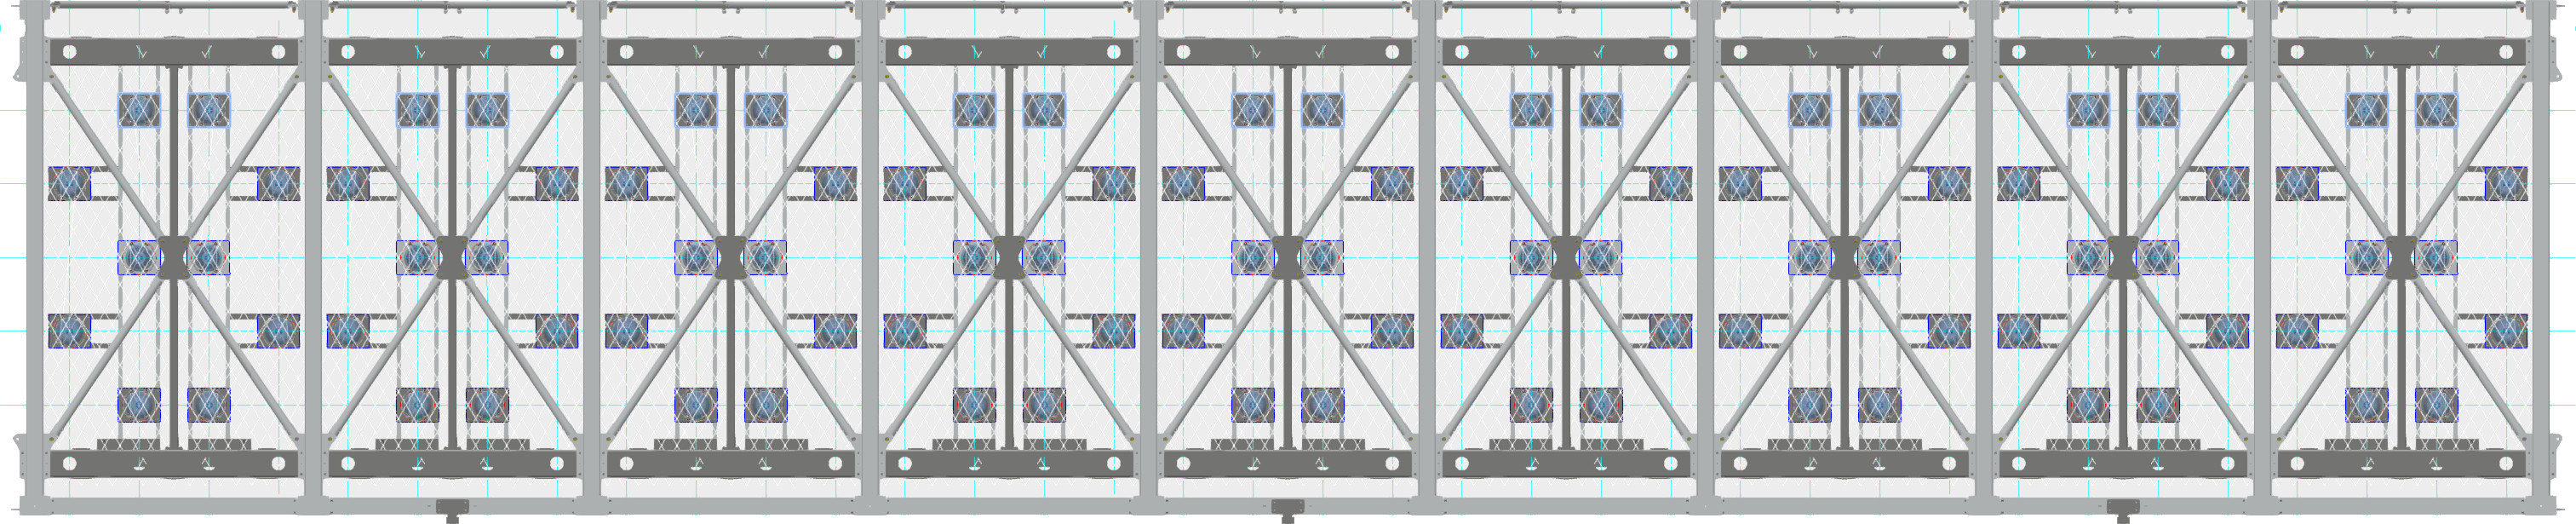
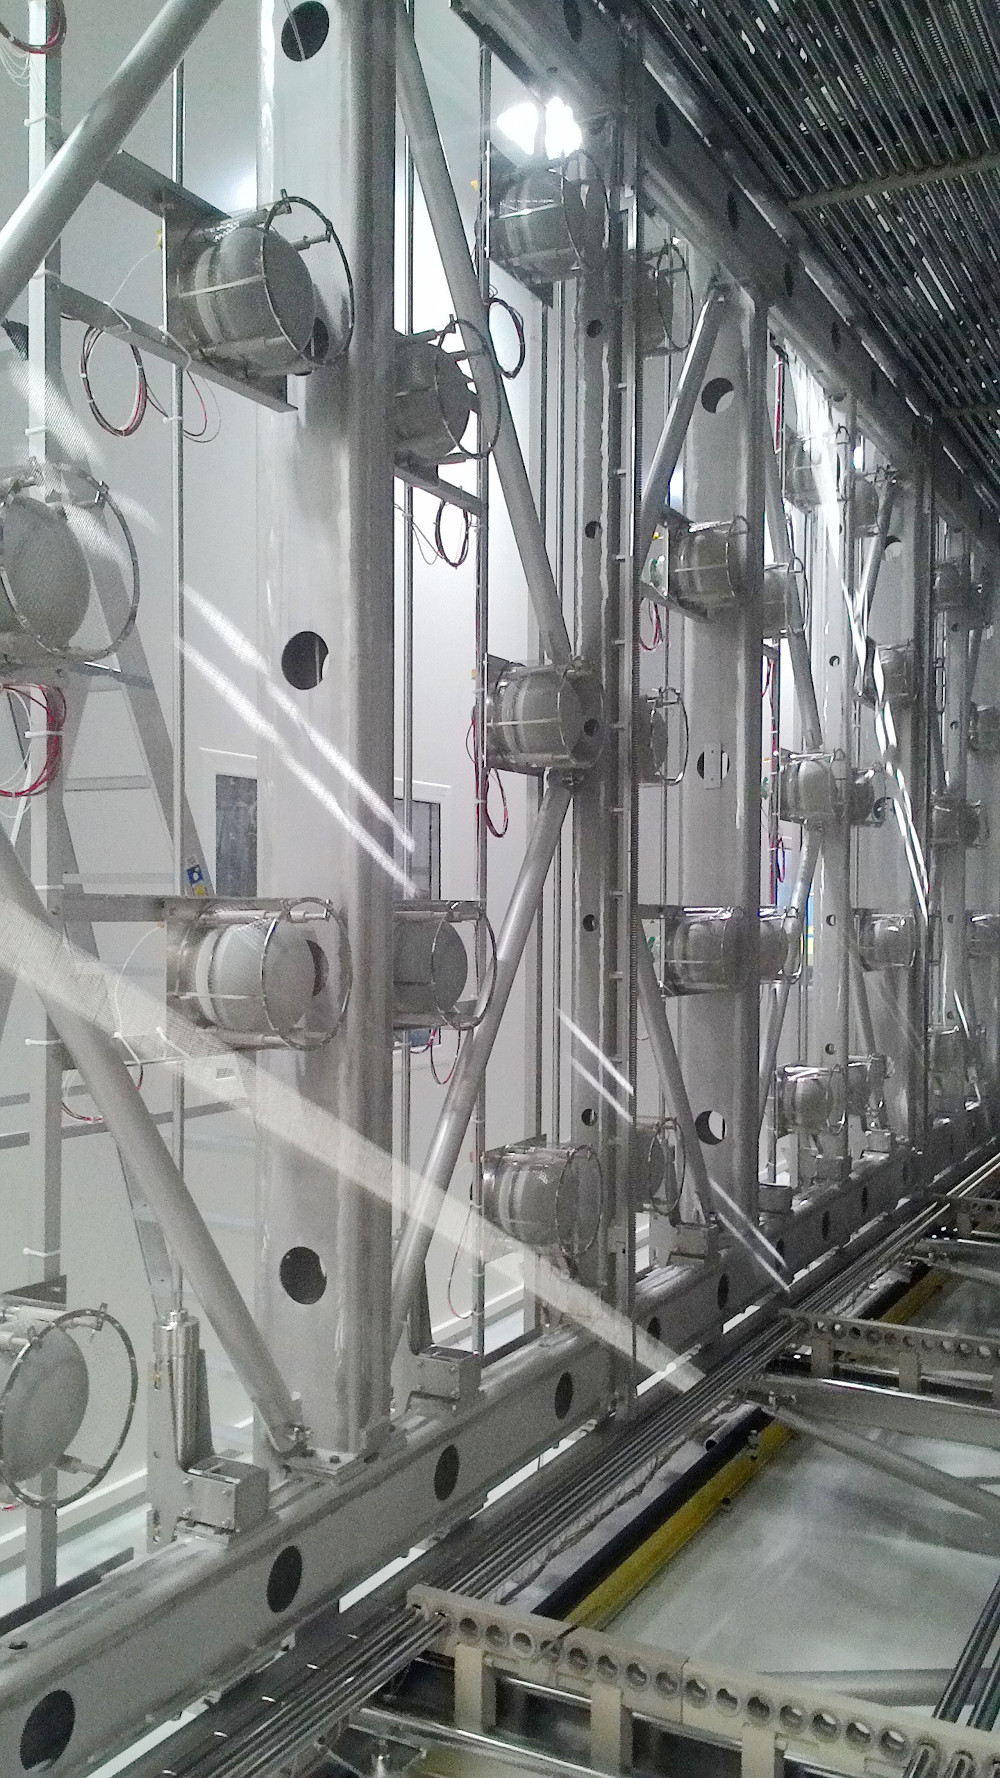
Each of the two T600 LAr cryostats features a mechanical structure that sustains the different internal detector subsystems and the control instrumentation. The three wire-planes of each TPC are held by a sustaining/tensioning frame positioned onto the longitudinal side walls of the cryostat. The stainless-steel supporting structure has dimensions of 19.6 m in length, 3.6 m in width and 3.9 m in height, subdivided in 9 sectors, 2 m long each. PMTs are located in the 30 cm space behind the wire planes, 10 unit for each frame sector, as shown in figure 9.
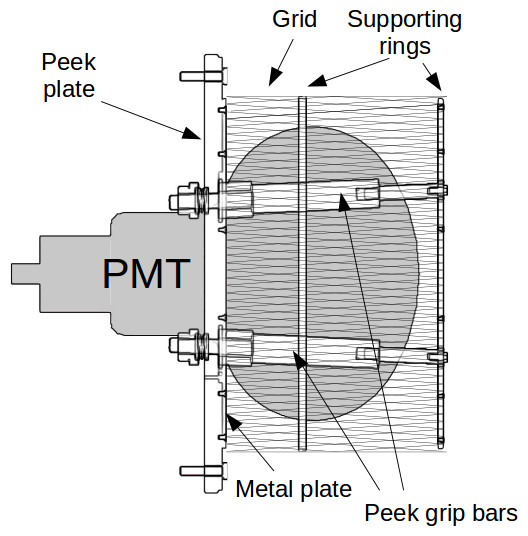
The PMTs are mounted onto the mechanical frames by means of PEEKTM holders in form of slabs with dimensions of mm2, 10 mm thick, held up by stainless-steel bars 3 m long, as shown in 9. The support system allows the PMT positioning behind the collection planes mm far from the wires.
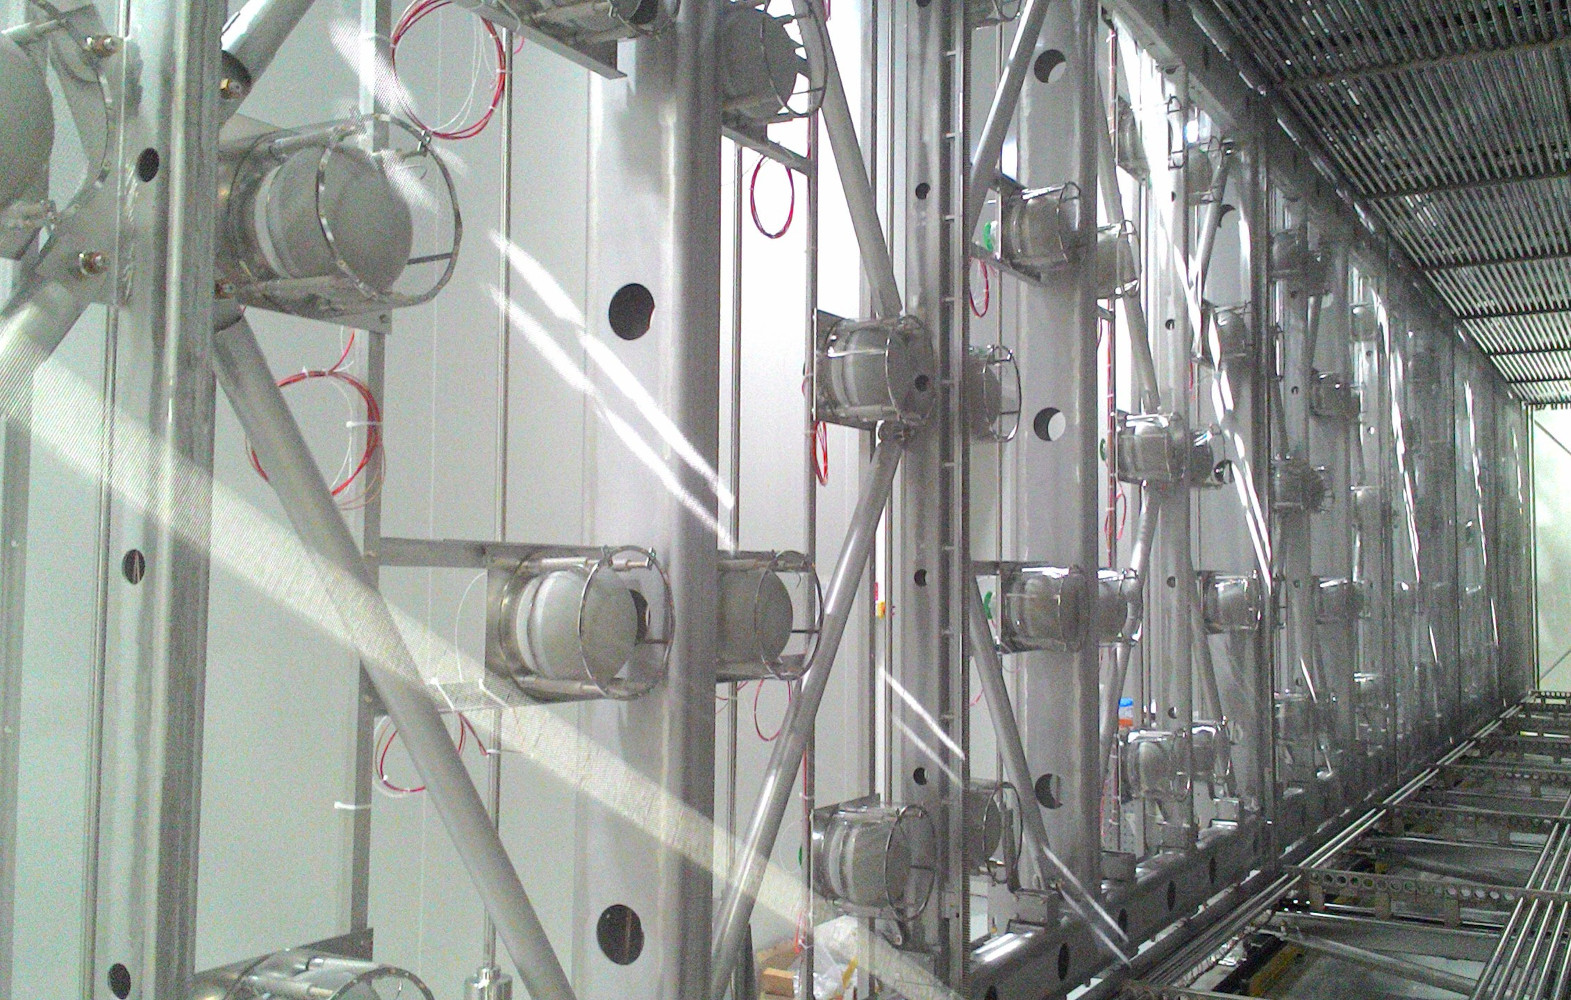
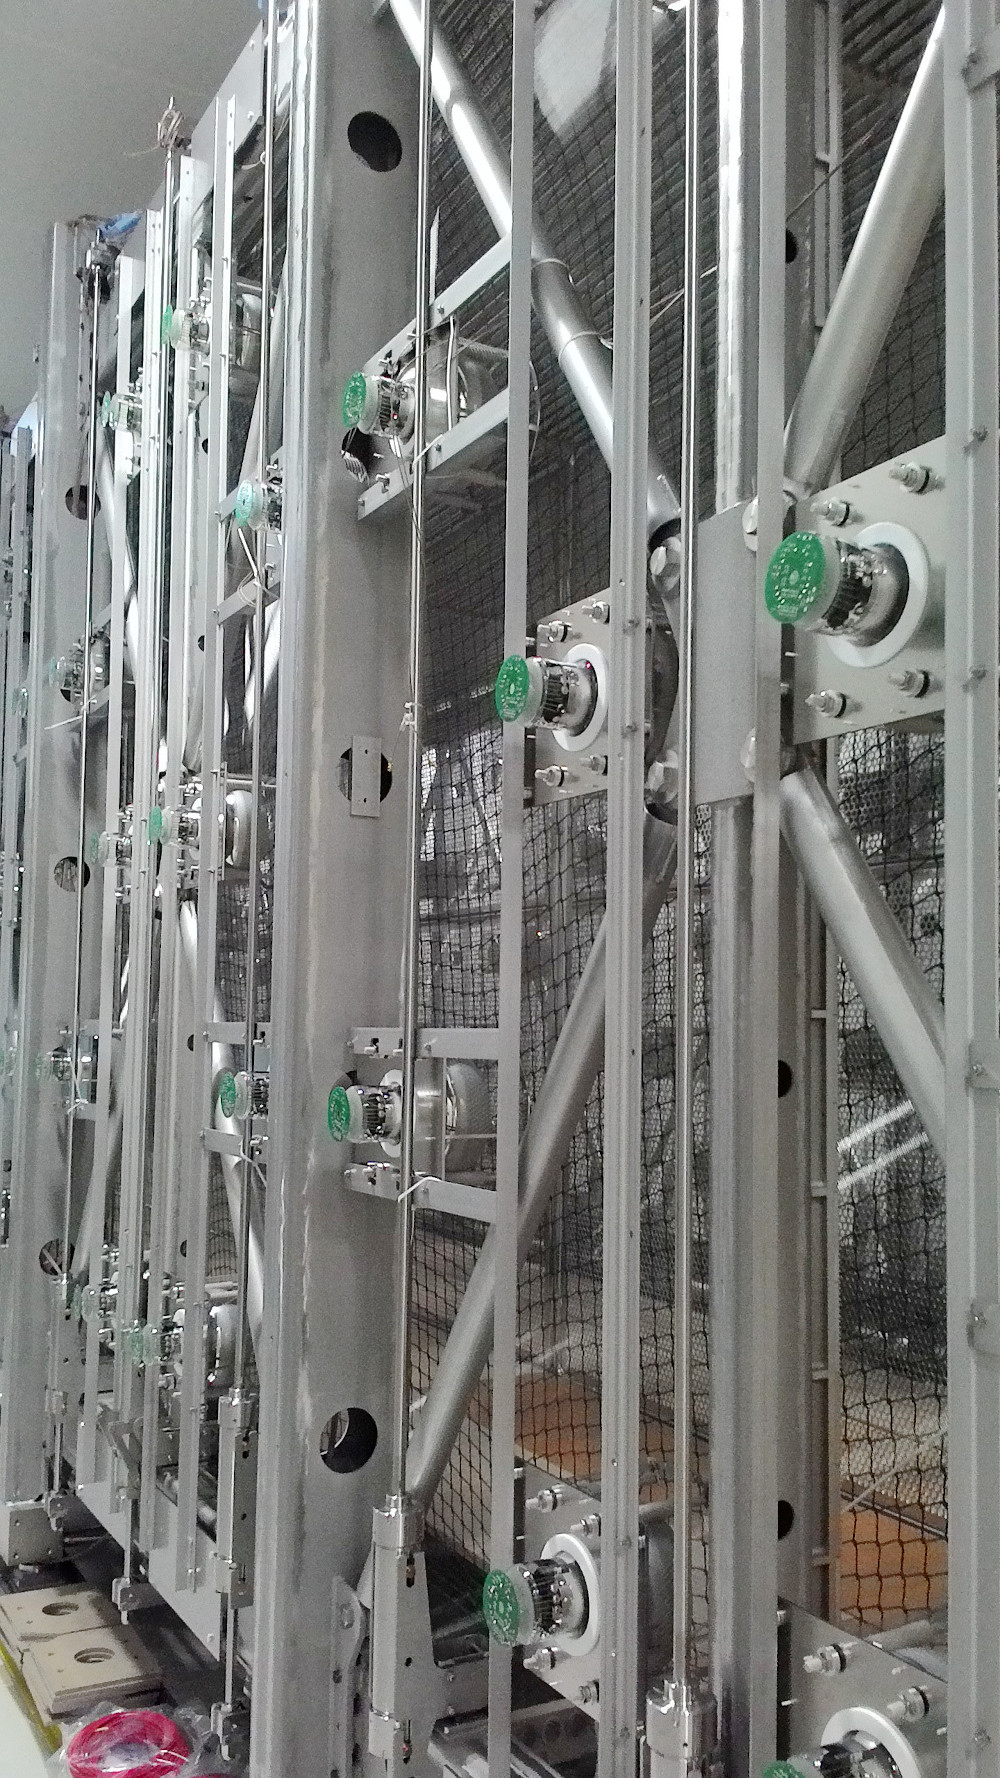
The electron multiplication process inside the PMT gain region can induce a fake signal on the wire plane areas facing them. These induced signals appear as fuzzy smeared blobs on a group of wires spanning the PMT diameter. The effect was witnessed continuously on ICARUS data from LNGS run, but it was negligible and easily identifiable, given the low number of PMTs and tracks per event. At Fermilab, the larger number of PMTs, coupled with higher background track multiplicity, calls for a mitigation of this phenomenon. A stainless steel grid cage is mounted around each device as shown in figure 10. The cage is connected to the detector ground, as well as the wire polarization system. Pictures of the supporting system are shown in figure 11.

4.4 PMT cabling and feedthrough installation
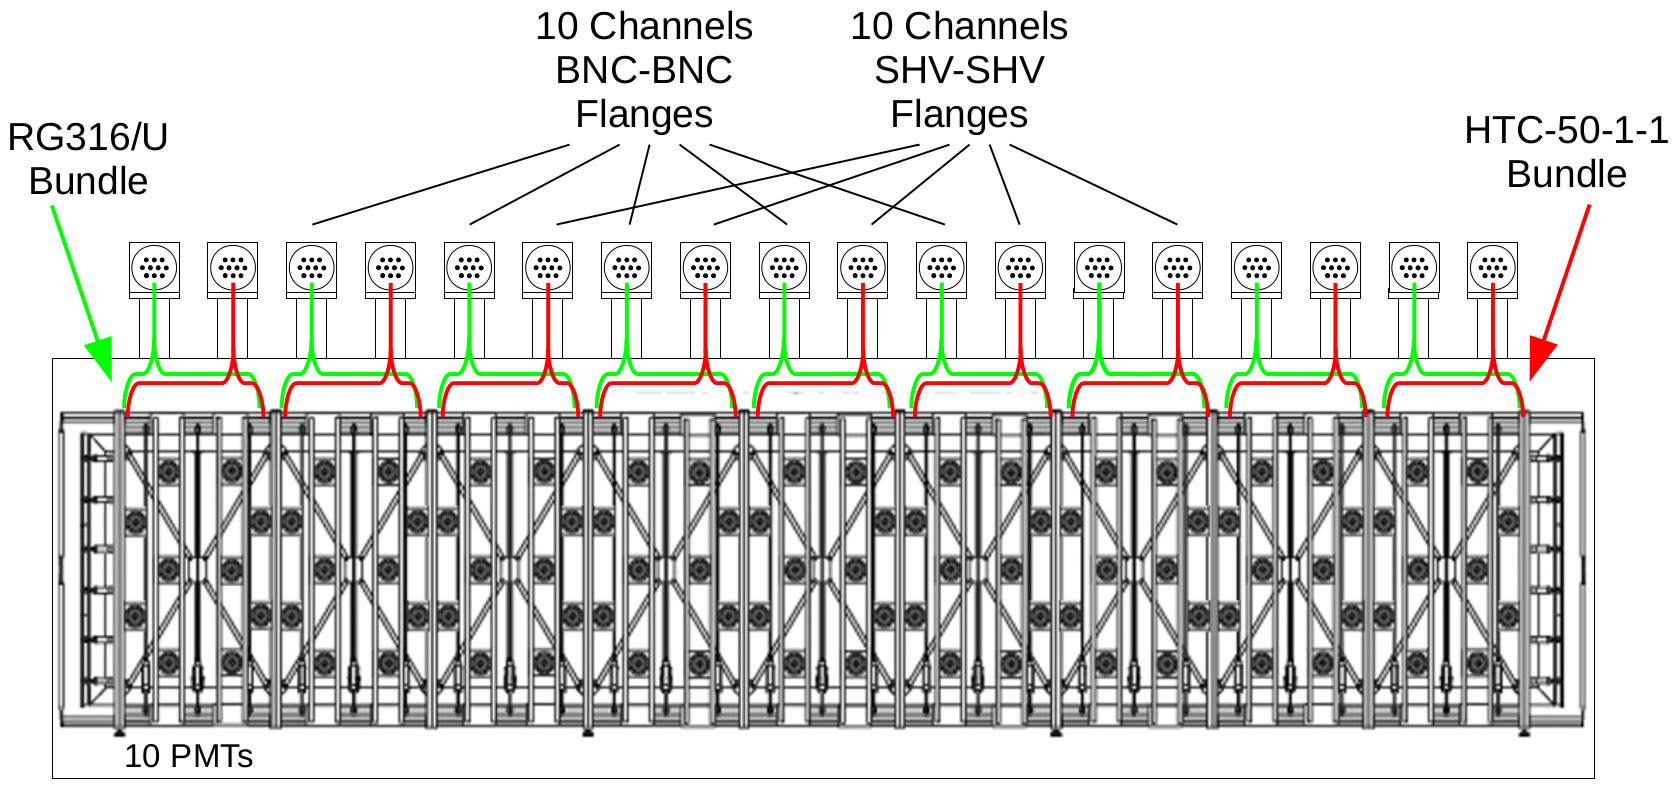
A negative power supply is adopted and two independent coaxial cables are used to provide each PMT with high voltage and to read out the anode signals. Signal cables are RG316/U, 7 m long with a BNC connector on one end. High voltage cables are HTC-50-1-1, 7 m long, with a SHV connector on one end. The non-terminated ends of the cables are directly soldered on the PMT bases.
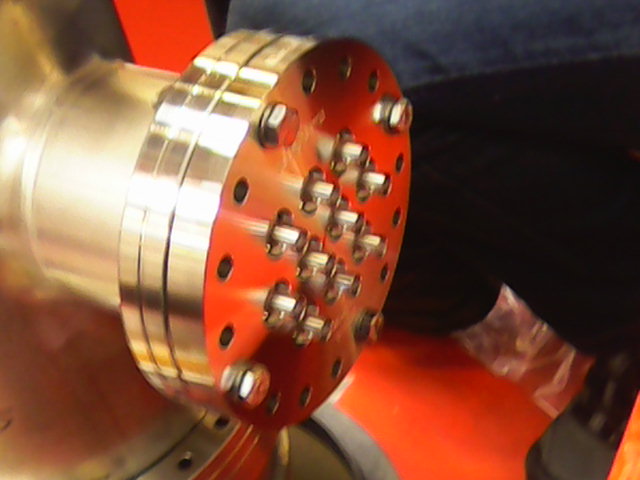
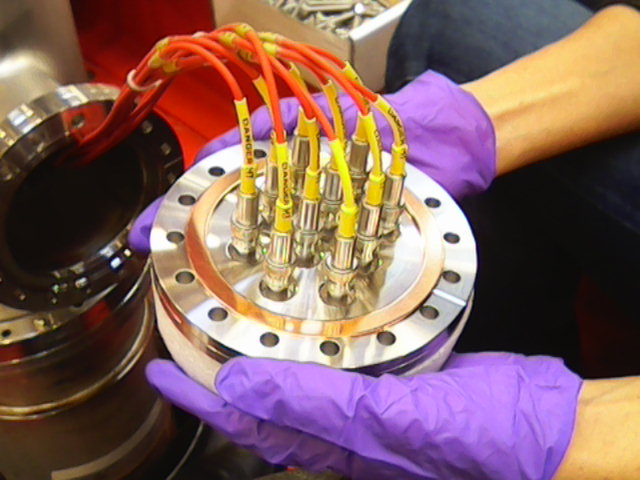
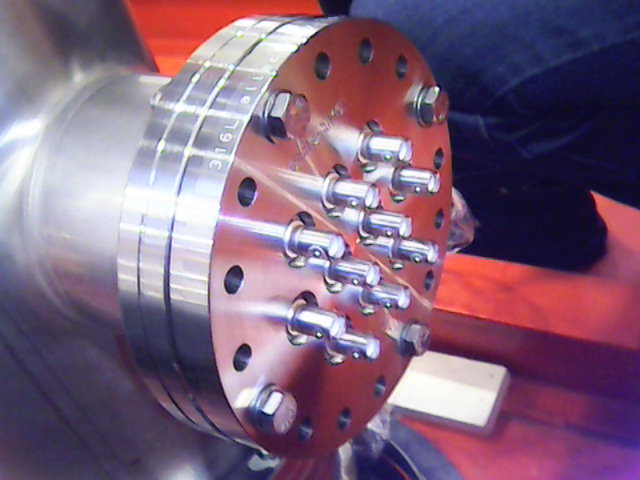
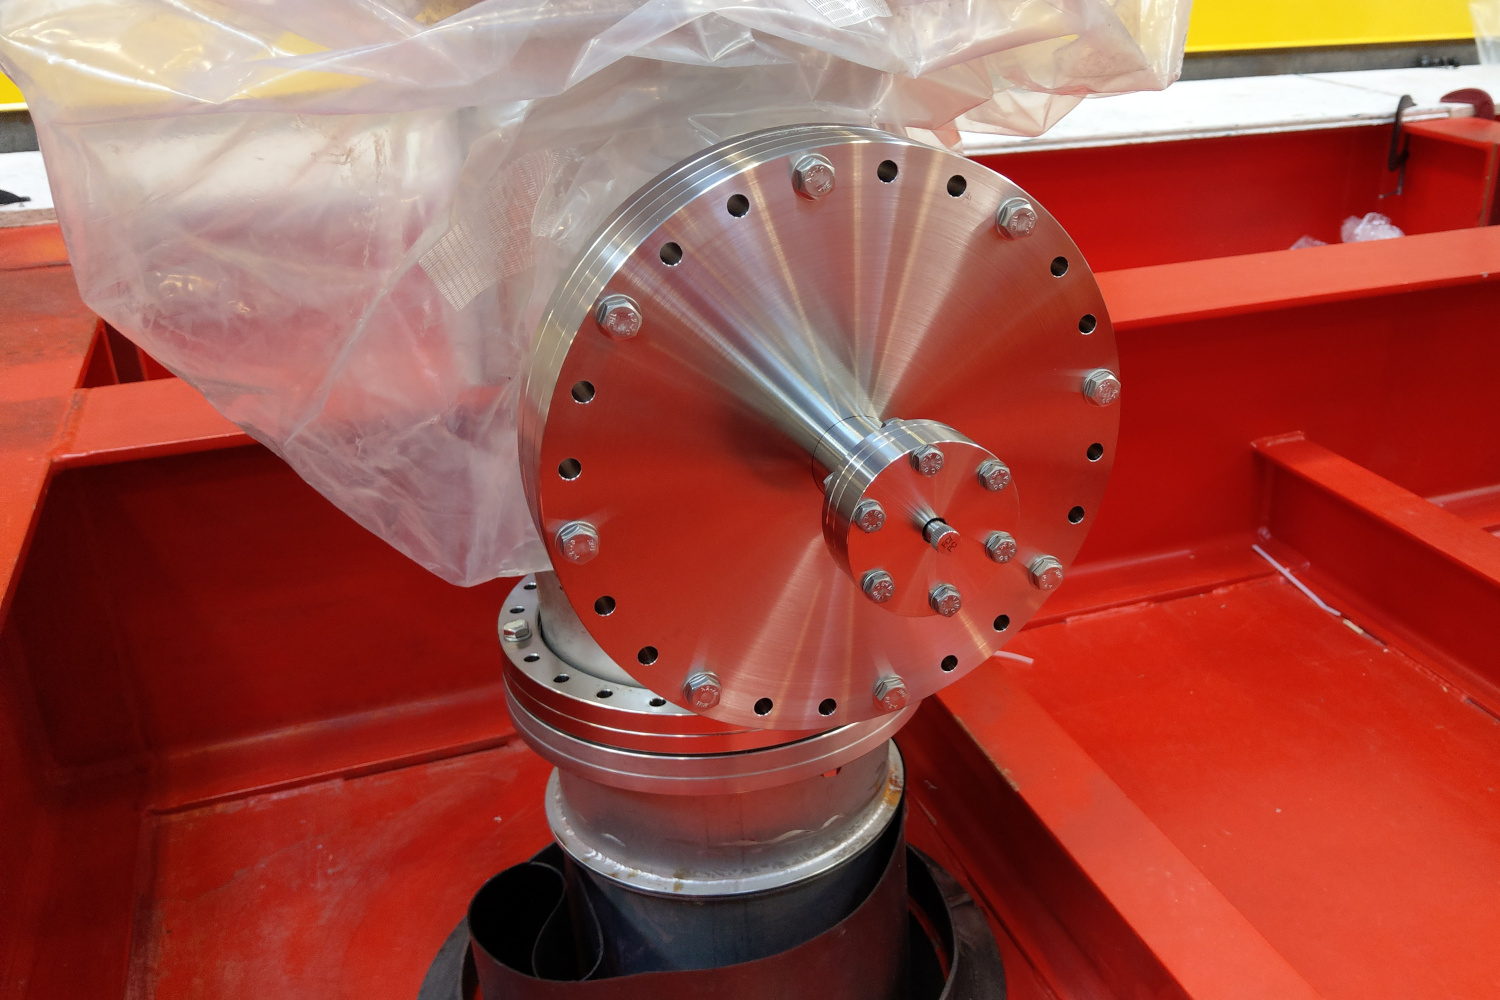
For each group of 10 PMTs mounted in the same frame sector, two bundles of 10 signal cables and 10 power supply cables are deployed along the mechanical structure up to the frame top, as outlined in figure 12. Each bundle is then driven through a stainless steel chimney (20 cm diameter, 1 m long), vertically mounted on the detector roof. The top edge of each chimney hosts a set of feedthrough flanges for the interconnection of various elements of the detector (PMT signal and power supply, wire signals and biasing, optical fibers and sensors). The PMT flanges are from Allectra Ltd., each hosting 10 SHV-SHV or 10 BNC-BNC feedthrough connectors mounted on stainless-steel DN100CF high vacuum flanges. A photo showing the assembly of the PMT flanges is shown in figure 13. The main characteristics of the flanges are listed in table 2.
The electrical connection between PMT flanges and electronics, located in a building alcove adjacent to the detector, consists of 360 signal cables (RG316/U with BNC-MCX termination) and 360 high voltage cables (RG58/U with SHV-SHV termination) deployed on cable-trays. In order to guarantee uniformity among the different channels, all the cables are 37 m in length. The actual total cable length from PMT base to electronic channel input is 44 m. A detailed study on the effects of the use of these extremely long cables shows a reduction of the high frequency components of the PMT signal resulting in an increase of the rise-time to 8 ns [18]. These effects are included in Monte Carlo simulations described in Section 3.3, to evaluate possible effects on the system performance.
| Flange type | DN100CF | DN100CF |
|---|---|---|
| Number of feedthroughs | 10 | 10 |
| Connection type (Int/Ext) | BNC/BNC | SHV/SHV |
| Impedance | 50 Ohm | 50 Ohm |
| Shield type | Grounded | Grounded |
| Voltage | 1000 V | 6000 V |
| Min. temperature | C | C |
| Vacuum | UHV | UHV |

4.5 PMT electronics
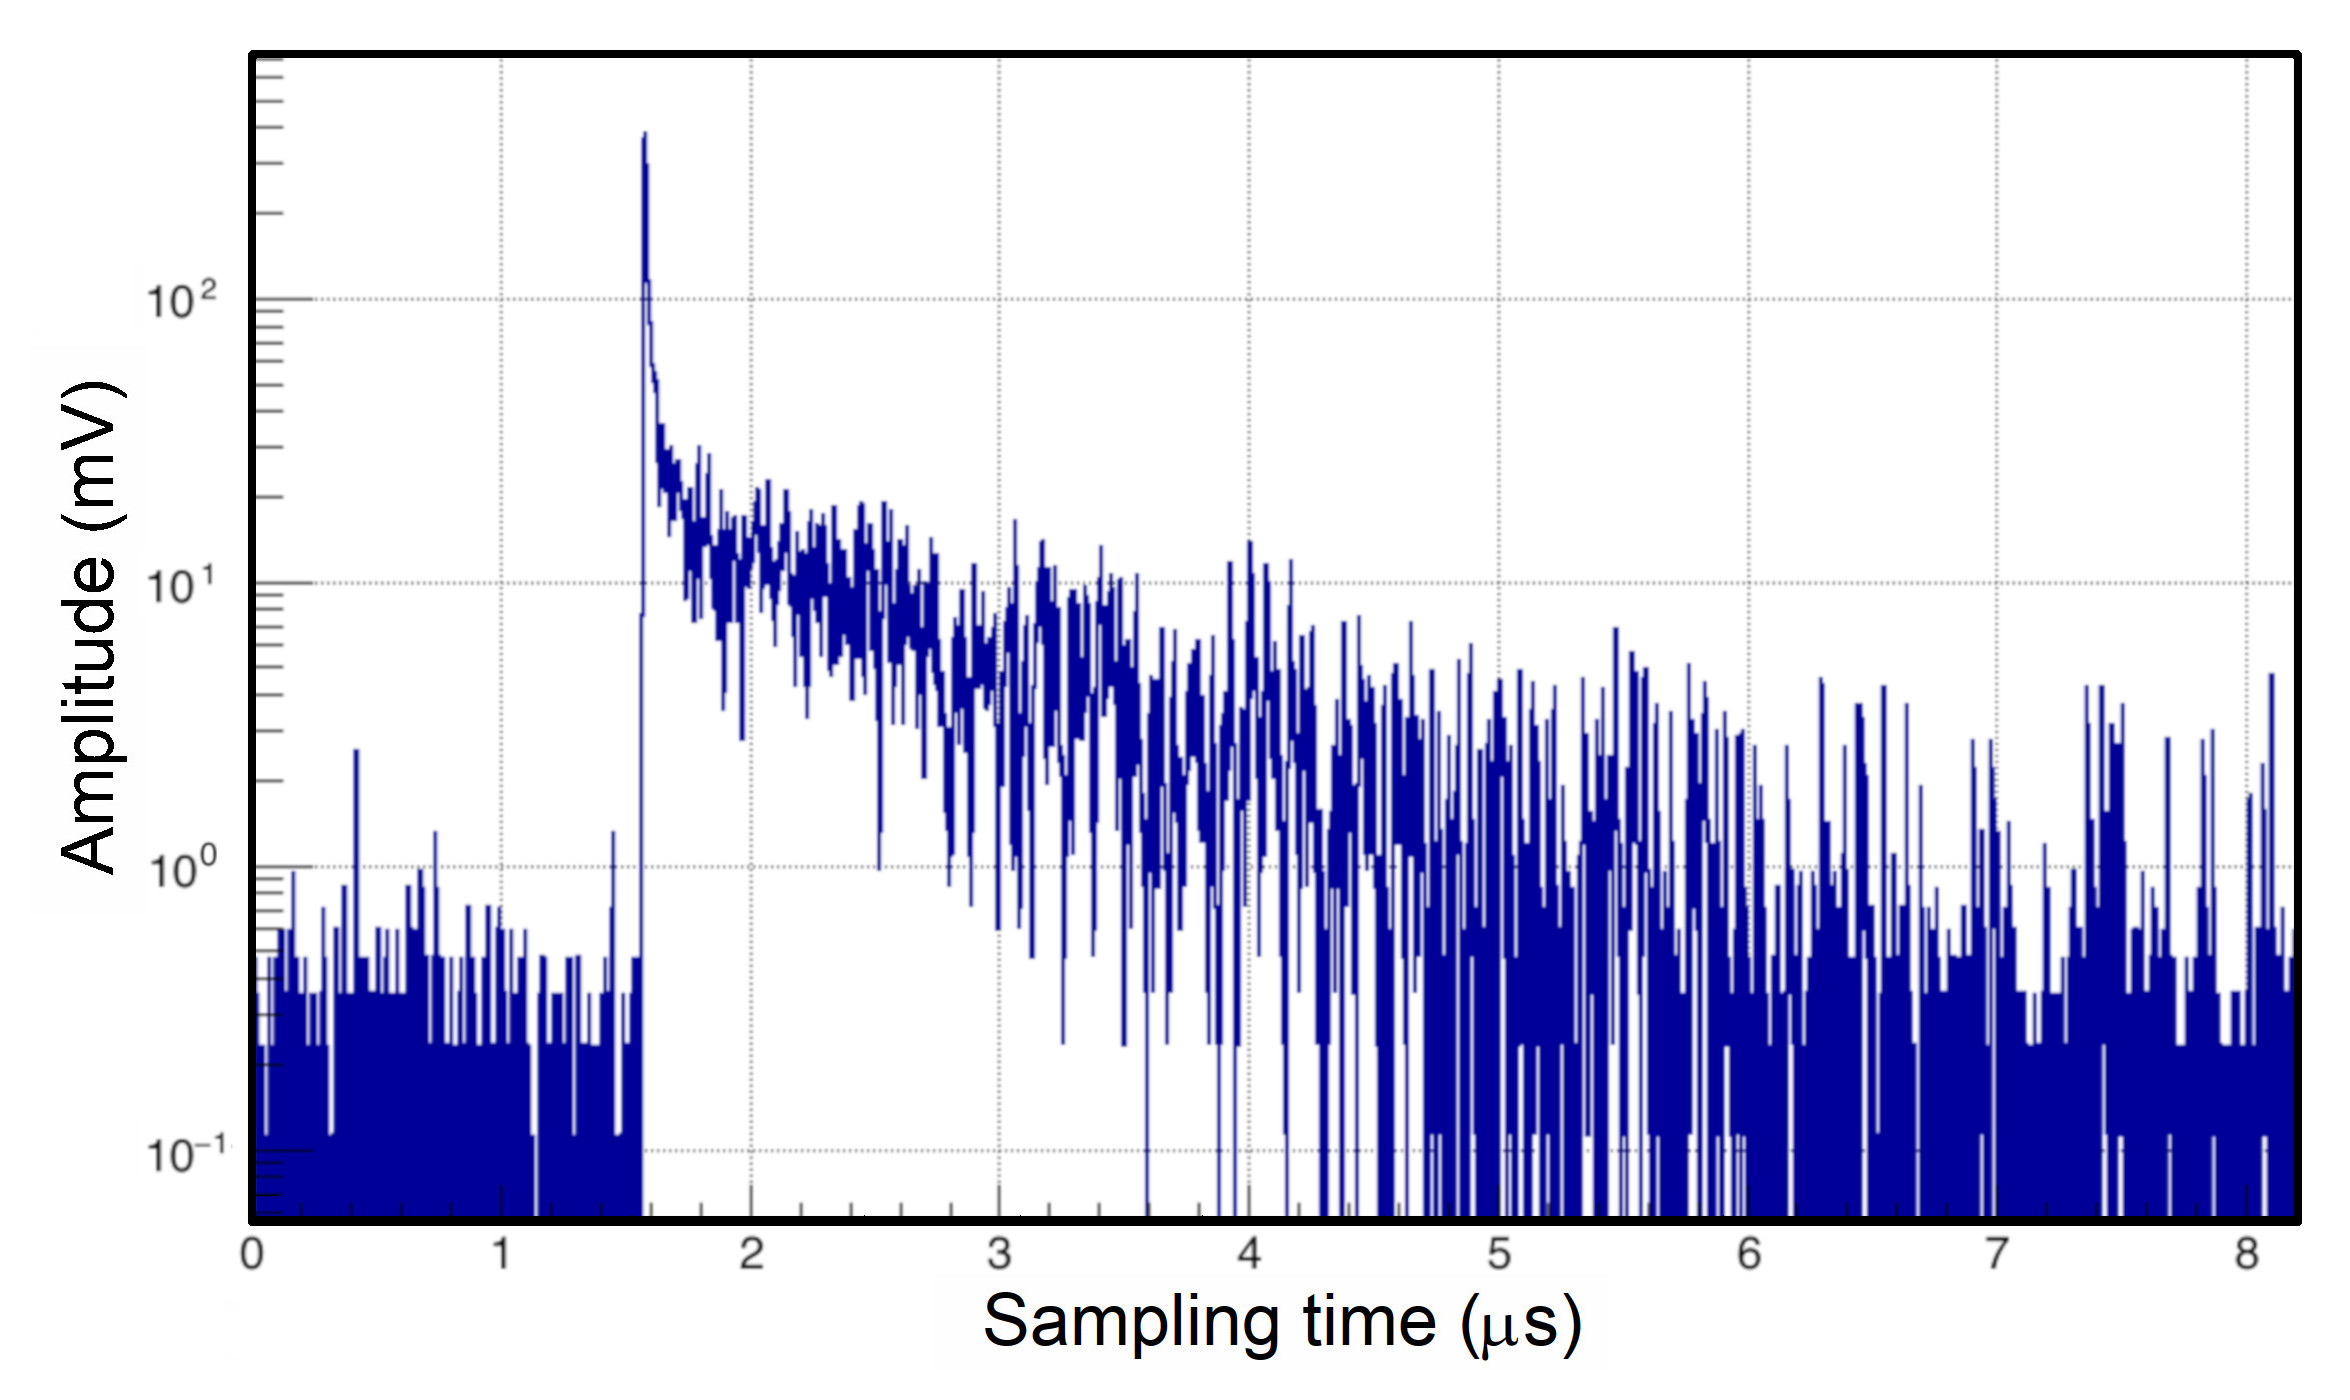
PMT electronics is designed to allow continuous read-out, digitization and independent waveform recording of signals coming from the 360 PMTs of the light detection system. This operation is performed by 24 V1730B digitizers. Each module consists of a 16-channel 14-bit 500-MSa/s FLASH ADC. The 2 Vpp input dynamic range well fits the PMT response in terms of linearity and saturation (see table 1). In each board 15 channels are used for the acquisition of PMT signals, while a channel is left for possible future implementations. During the acquisition, data stream of each channel is continuously written every 2 ns in a circular memory buffer of 5kSa, corresponding to 10 s666The total memory available for each channel is 5.12 MSa, divisible into a maximum of 1024 buffers., allowing the recording of both components of the LAr scintillation light, i.e. photons from fast and slow decays of exited excimers to ground state, as described in Section 3.1. When a boards receives an external trigger request, the active buffers are frozen, writing operations are moved to the next available buffers and stored data are available for download via optical links777Data read out is based on the CAEN proprietary CONET2 (Chain162 able Optical NETwork) protocol allowing up to 80 MB/s data transfer.. The amplitude of the prompt signals from the fast component of the scintillation light, without any pulse integration, is exploited for trigger purposes. To this aim, V1730B boards generate a pattern of digital pulses (200 ns, LVDS logic standard) mapping the PMT signals exceeding digitally programmed thresholds, set to few photoelectrons [19]. The ICARUS Trigger System, which will be described in dedicated papers, generates a first level PMT trigger pulse whenever the coincidence of the discriminated PMT signals satisfy a defined multiplicity inside a neutrino beam gate window.
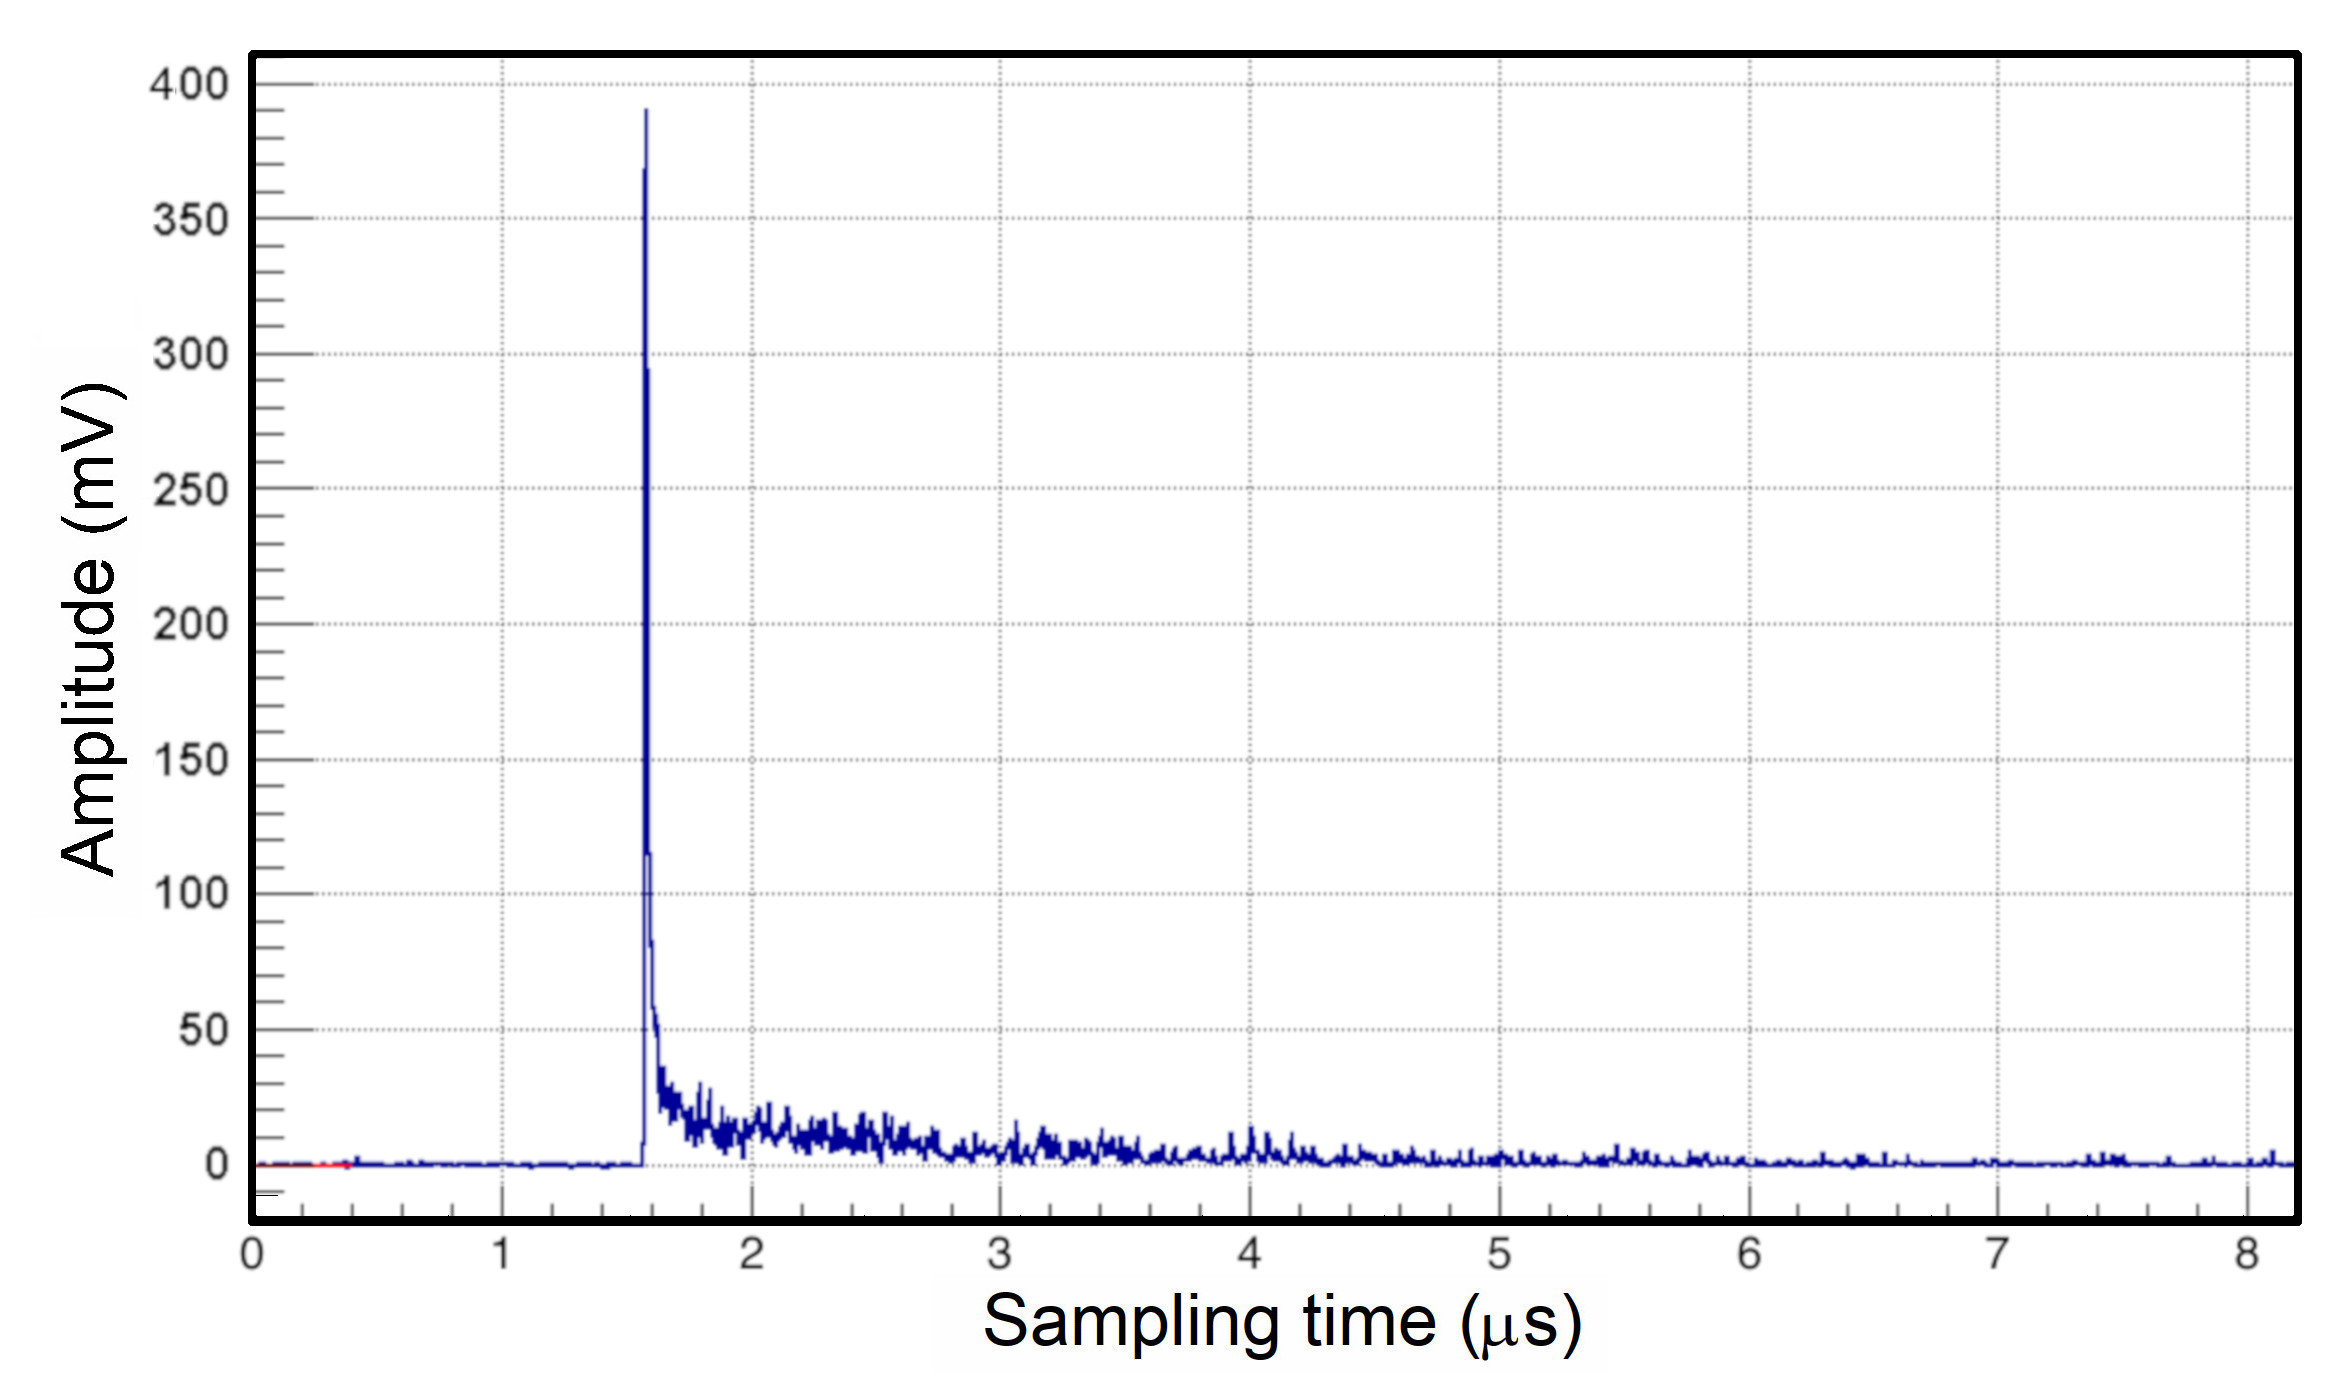
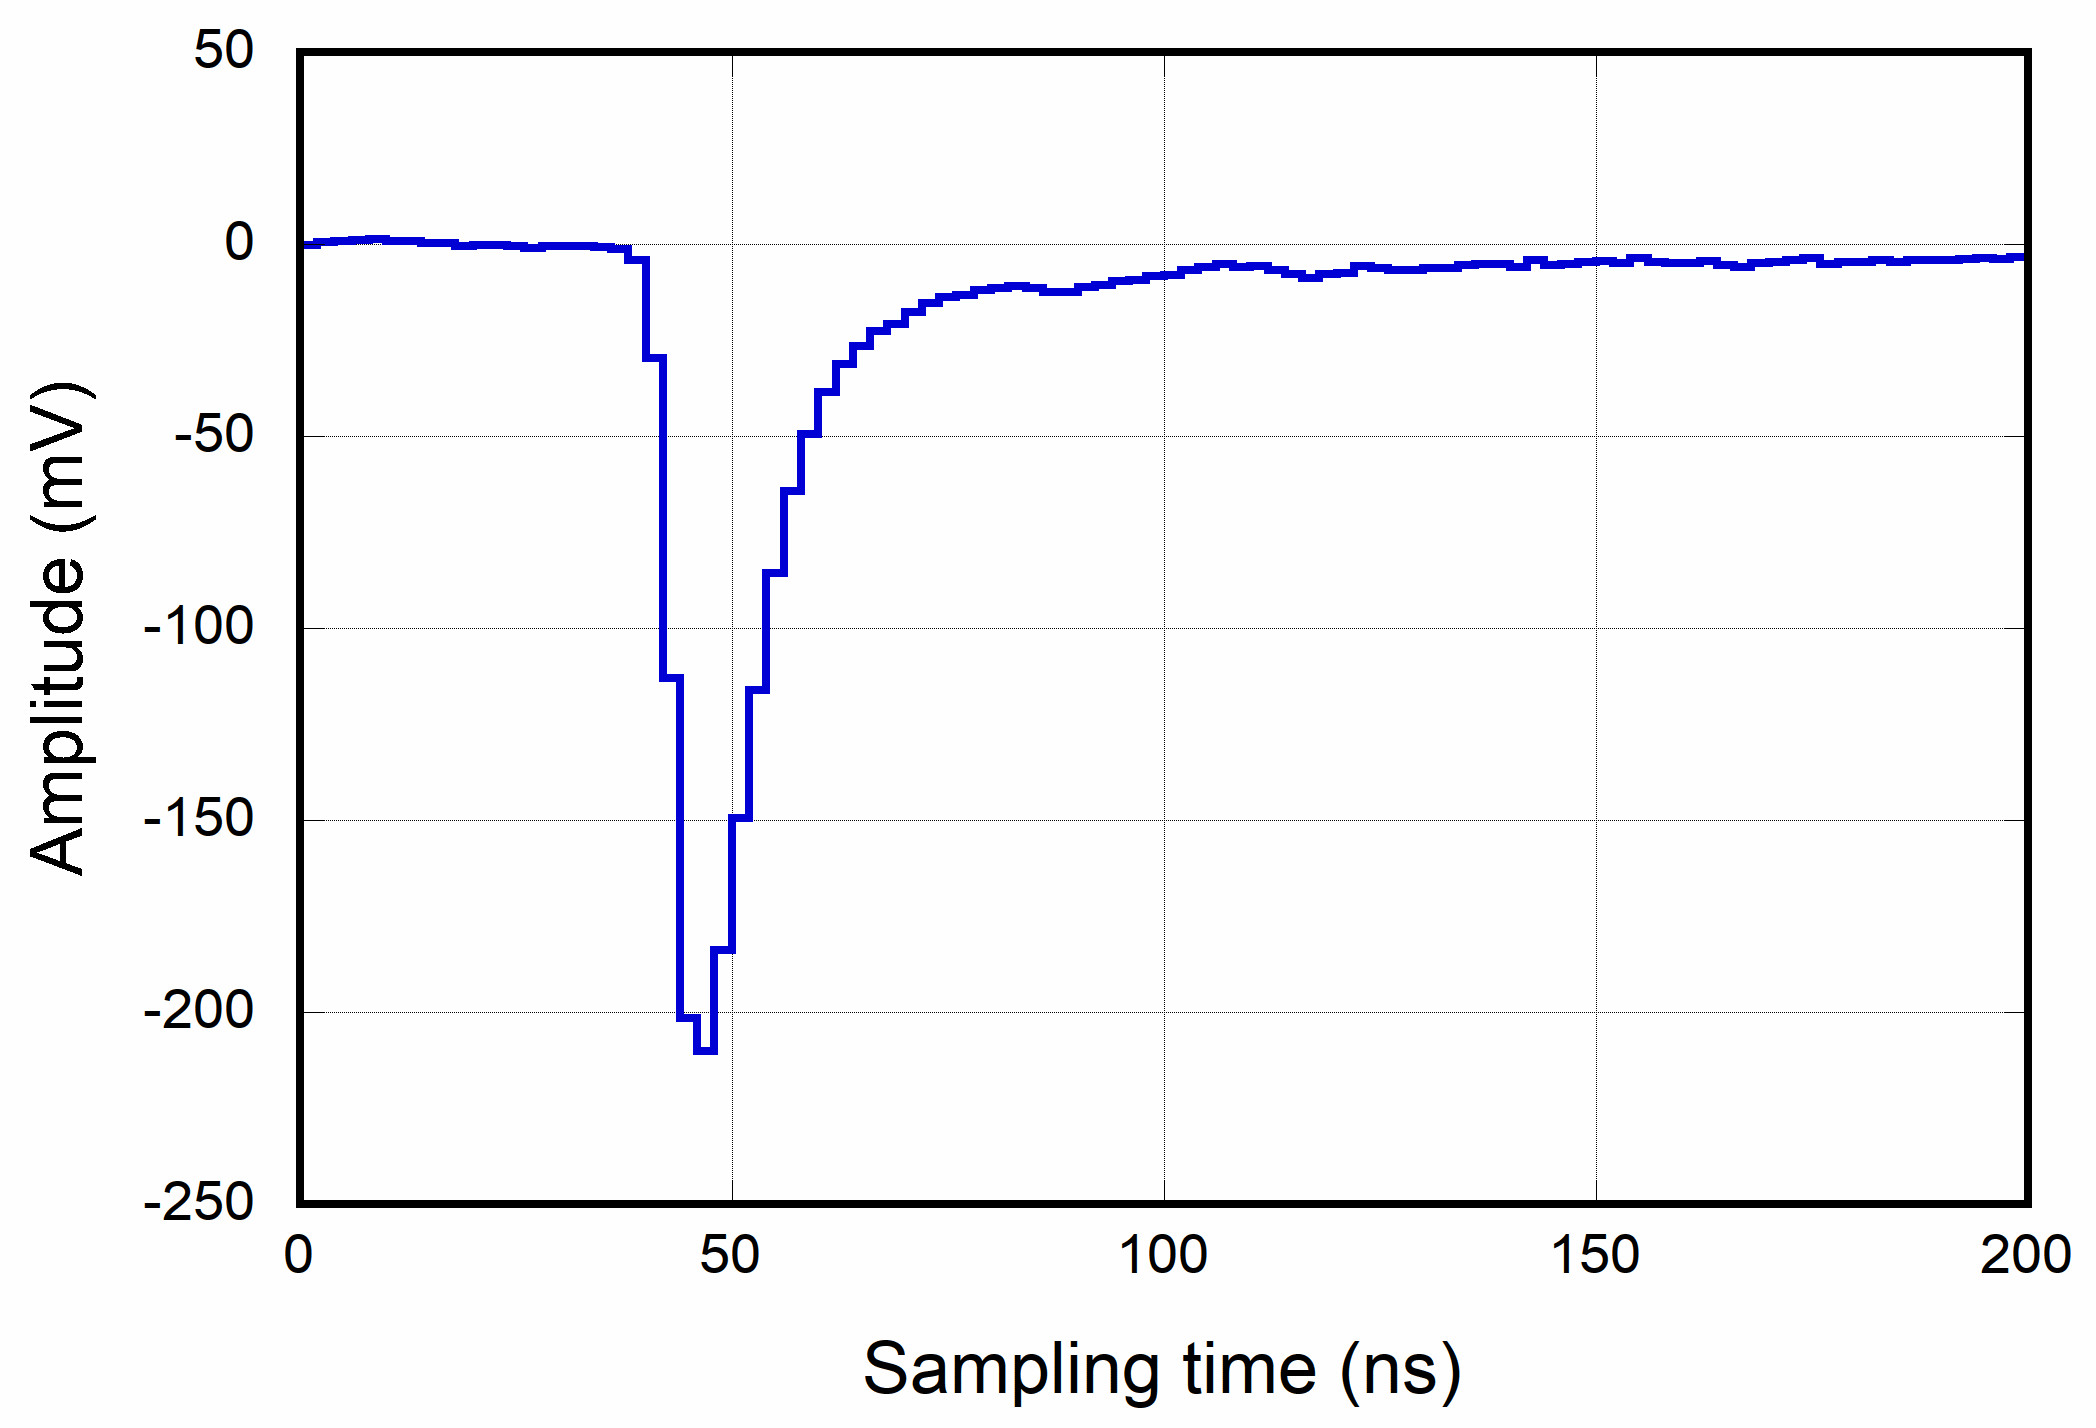
For generation and distribution of high voltages, the same power supply system designed by ICARUS for the LNGS run is adopted. For each cryostat, housing 180 PMTs, a primary -2000 V is generated by a BERTAN 210-02R. The primary voltage is finely regulated and distributed to 180 PMTs by four CAEN A1932AN boards, 48 channels each, housed in a CAEN SY1527 crate. The linear technology employed in this system results in extremely low output ripple, as demonstrated during the ICARUS data taking at LNGS. This is a fundamental feature required for the light detection system to prevent the induction of PMT noise onto the wire planes. In order to perform a study on the performance of the ICARUS PMT electronics and other detector subsystems before the final detector operation at Fermilab, a LAr test facility was instrumented at CERN888This work was carried out in the framework of the CERN Neutrino Platform WA104/NP01 activities. [20]. The apparatus consists of a 1.5 m3 cylindrical cryostat filled with LAr and instrumented with 10 Hamamatsu R5912-MOD PMTs, 6 of them coated with TPB. Scintillation light data were taken by exposing the system to cosmic rays. Figure 14 shows an example of PMT signal taken with this facility, demonstrating the capability of detecting both components of scintillation light and demonstrating the required performance of the electronics.
4.6 Layout of the laser calibration system
To identify interactions associated to the neutrino beam and reject the expected huge cosmic background, the occurrence time of each event should be reconstructed with a resolution better than 1 ns. This can be achieved by means of a precise determination of the time delay of the response of each PMT, that may drift in time for temperature excursions, power supply variations or other reasons. The monitoring of the timing values during data-taking can be accomplished with cosmic rays or by delivering a fast calibration pulse to each individual channel.
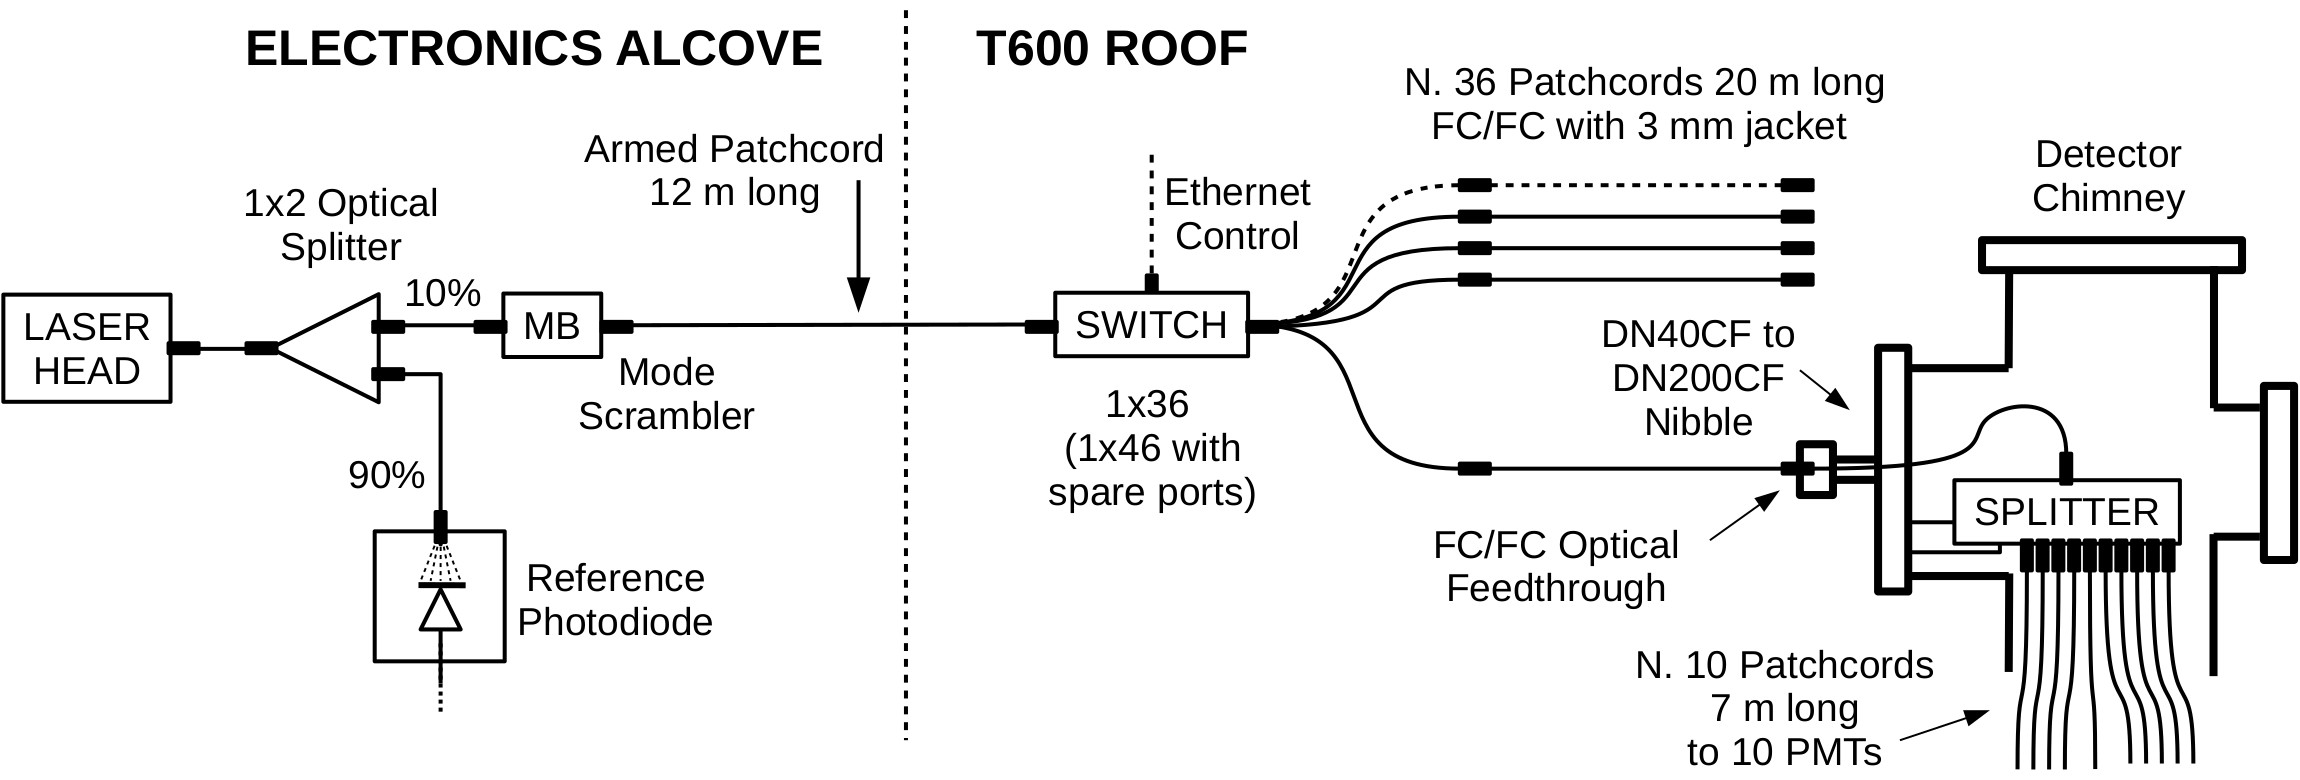
A fast-laser based calibration system has been developed for the time calibration and monitoring of each PMT channel. Its layout is outlined in figure 15, while additional information on the employed components can be found in reference [21]. Fast light pulses (60 ps FWHM, 120 mW peak power, emission at 405 nm) are generated by a laser diode (Hamamatsu PLP10) settled in the building electronics alcove. Light pulses feed, through m patch cables and an optical switch (Agiltron Inc.), 36 optical flanges mounted in the same 36 chimneys used for the PMT signal cables, on the opposite site of the BNC flanges. The main characteristics of the optical flanges are shown in table 3.
| Manufacturer | VACOM GmbH |
|---|---|
| Flange type | DN40CF |
| Connection type (Int/Ext) | FC/FC |
| inside fiber | MM 50 m core; NA 0.2 |
| Min. temperature | C |
| Max. temperature | C |
| Vacuum | UHV |
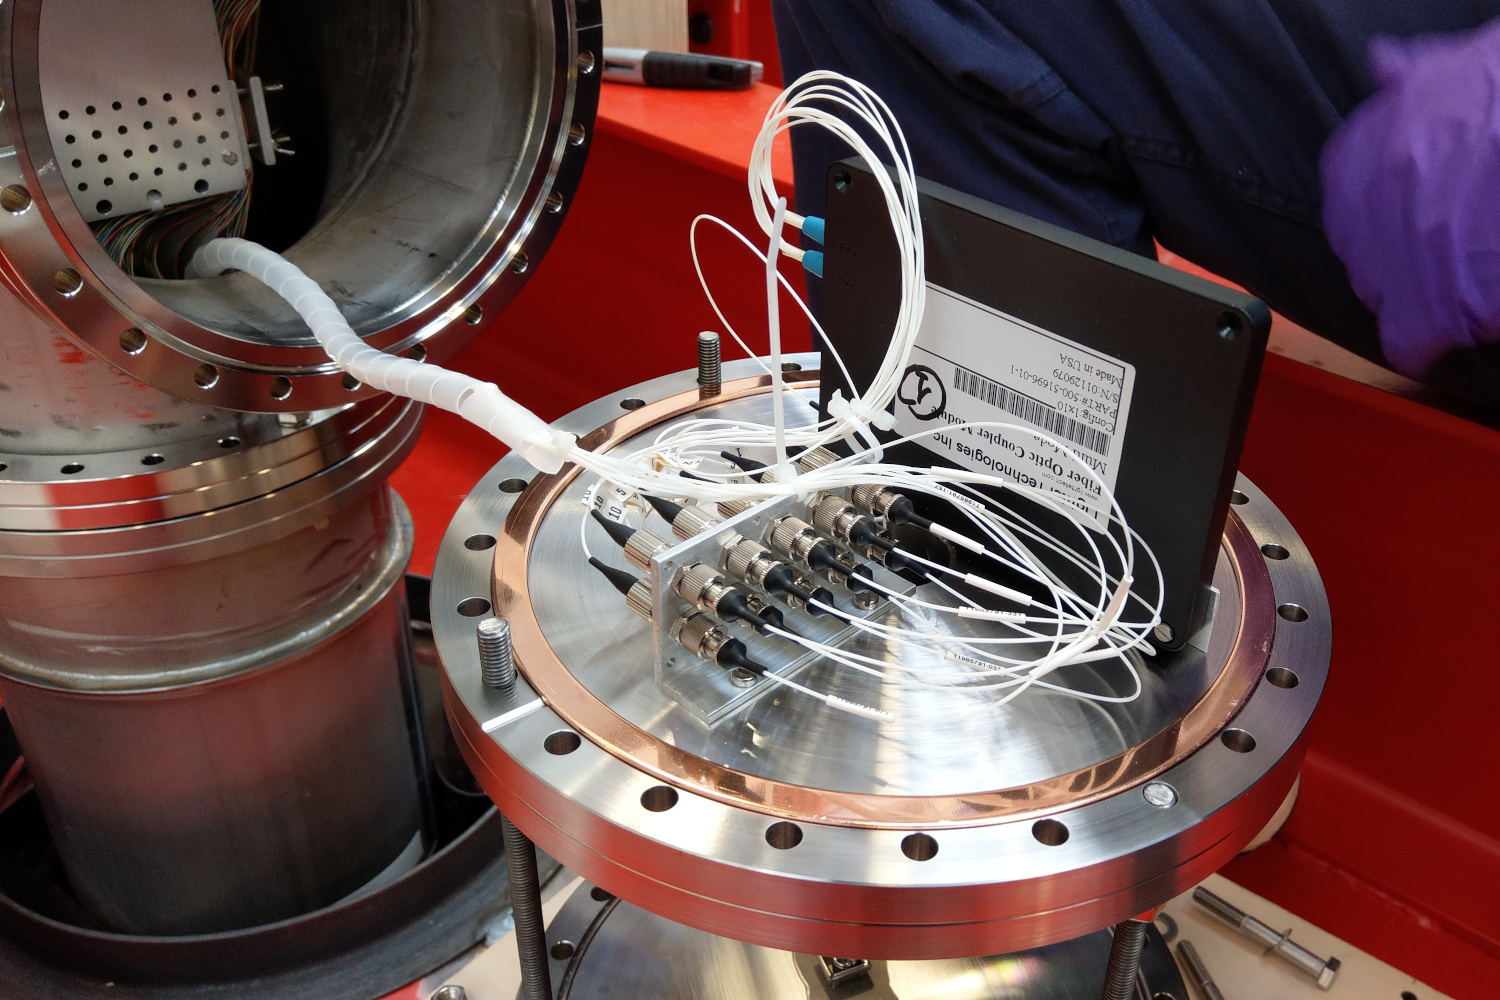
Inside each chimney, a optical splitter (Lightel Technologies Inc.) delivers the input laser signal to 10 (m, 7 m long) injection fibers deployed along the mechanical frames, to convey the calibration signal to each PMT, as shown in figure 16.
A specially shaped stainless steel pipe (2.5 mm diameter, 20 cm long), fixed inside the PMT sustaining structure, drives the end section of each optical fiber and allows the light focusing on the device windows, as shown in figure 17.
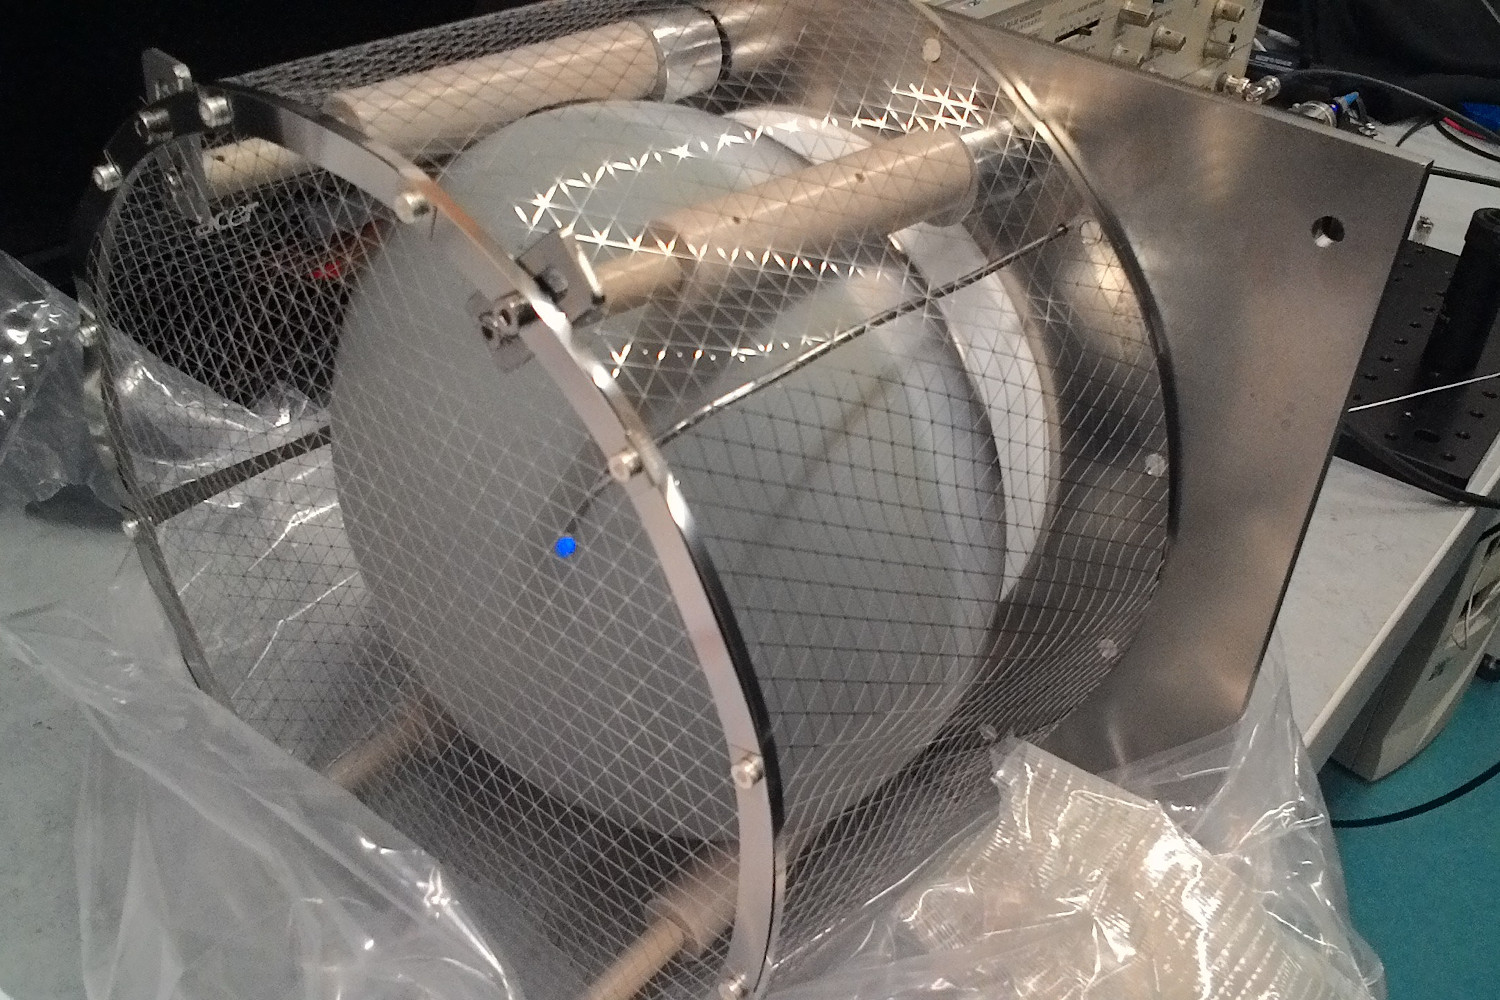
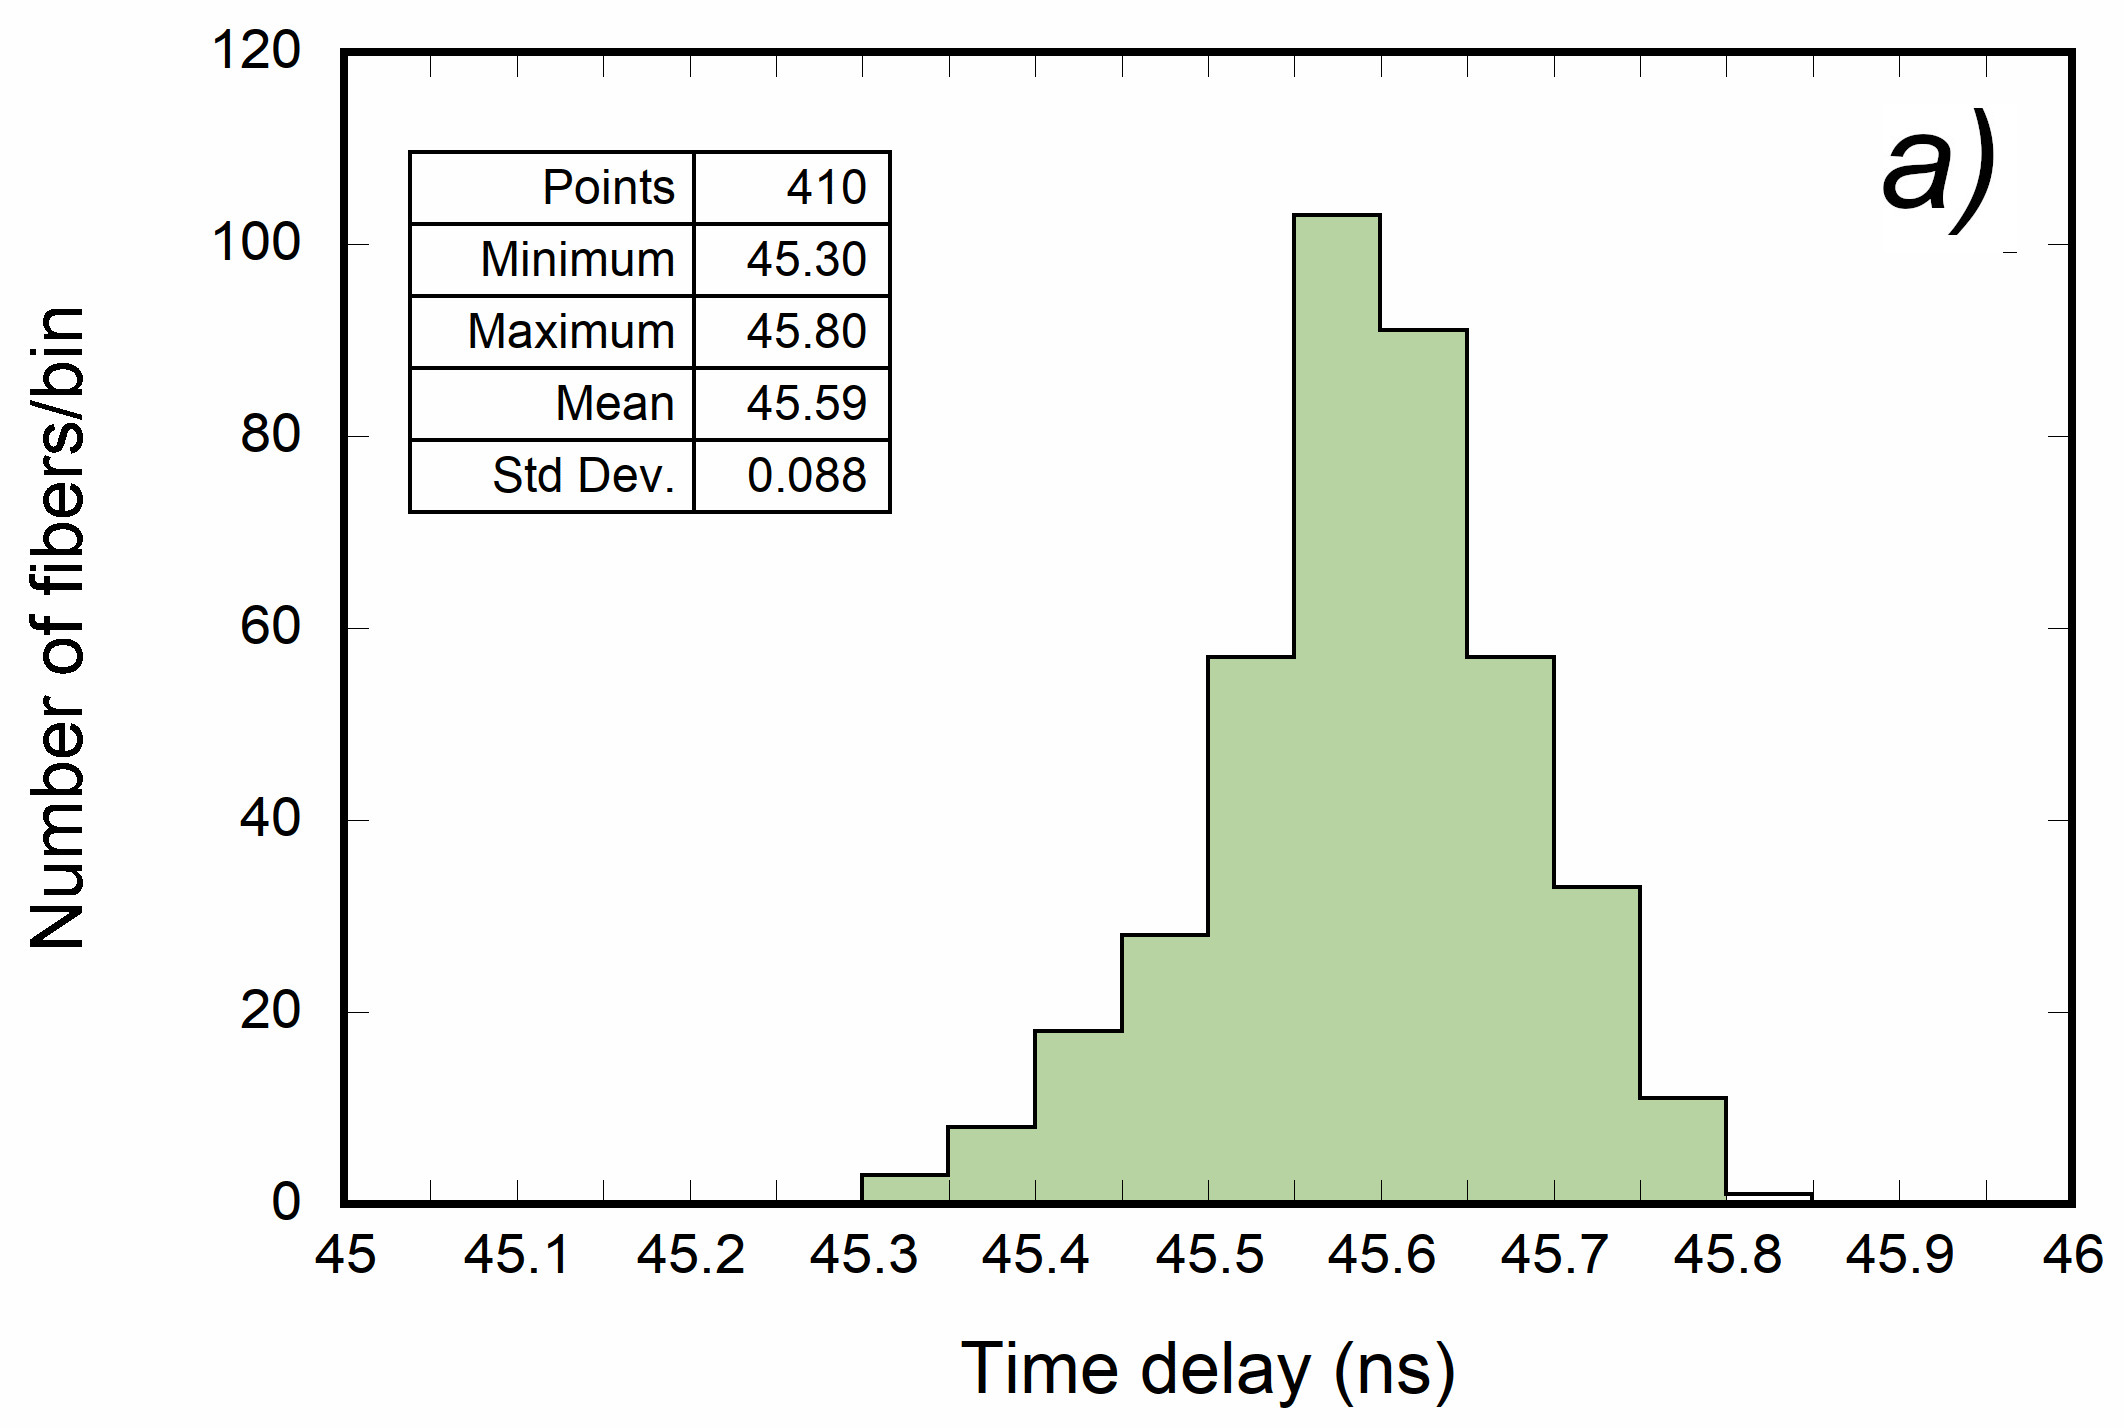
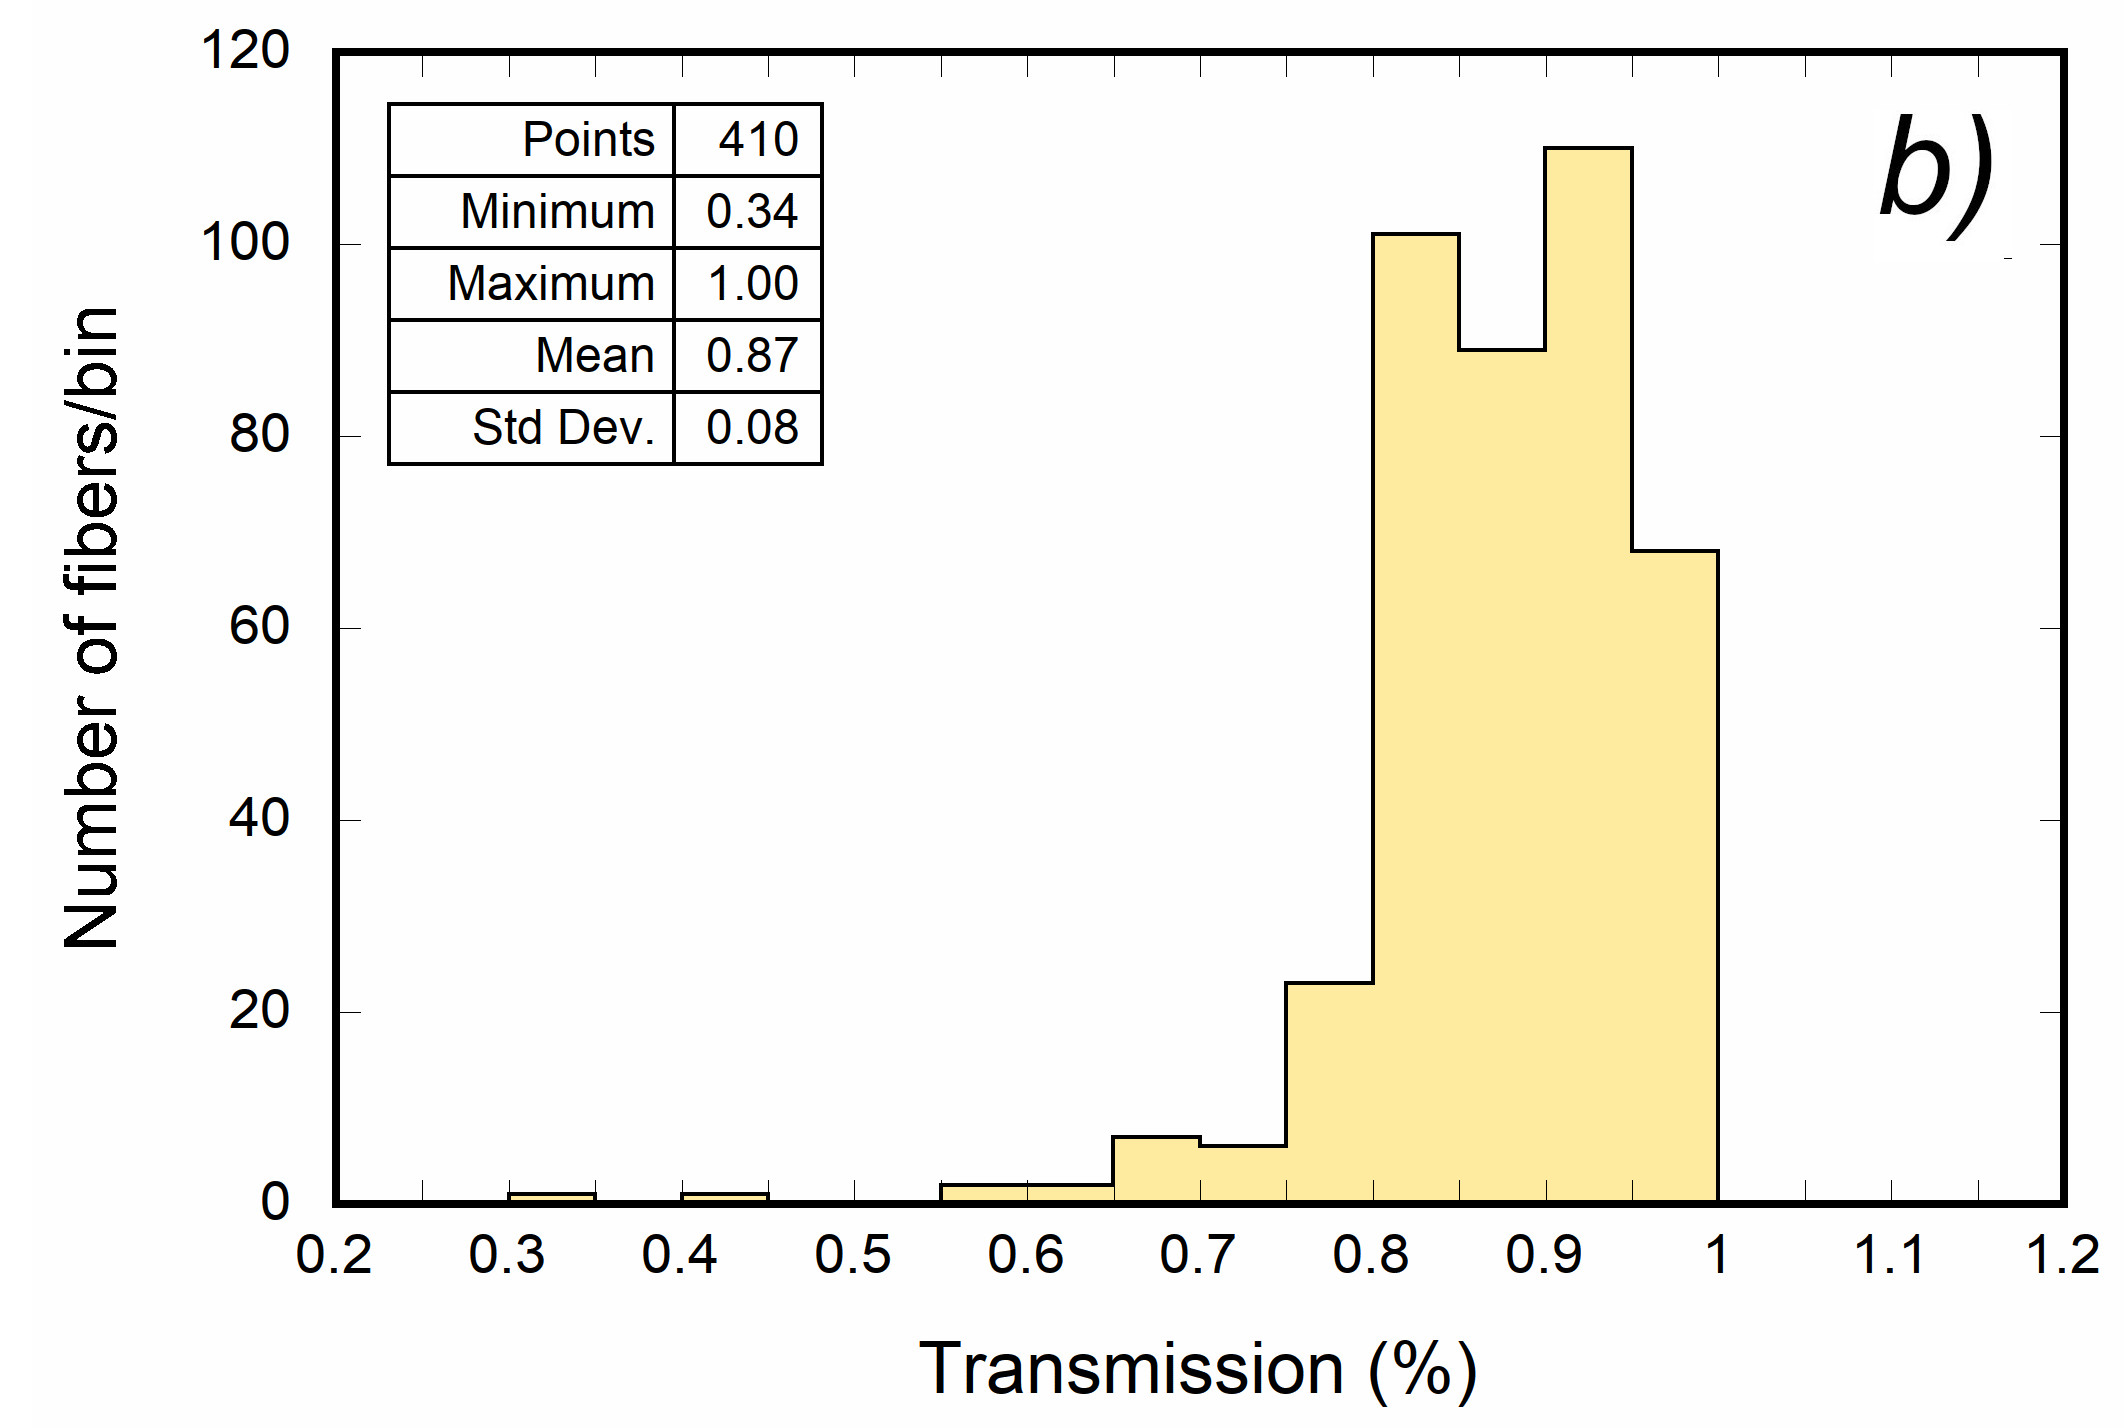
The laser pulses should be delivered to the PMT photocathodes with minimal attenuation and without deterioration of the original timing characteristics. Extensive tests were performed on the different components at both room and cryogenic temperatures, to ensure that selected items comply with these requirements [21]. Figure 18 shows the distributions of time delay and fraction of transmitted light, obtained from measurements at room temperature on the initial sample of 410 injection patches, using the laboratory setup of reference [22]. The delay dispersion over the 7 m cable length is within 90 ps, with an average value of about 45.59 ns, while the dispersion on the transmission is around with an average value of . Measurement at cryogenic temperatures (with a LN2 bath) shows that transmission and delay are similar to the ones measured at room temperature.
The final sample of 360 internal injection patches was then selected, requiring fibers with the highest transmission and similar delays.
The numbers here presented for the laser system only concern the components within the cryostats, which are relevant for the purpose of this paper, while the main characteristics of the external system are presented elsewhere [21]. The installation of the various components is still in progress and did not allow a precise calibration of the entire system on a channel-by-channel basis. Anyway, the different test results indicate that the expected performances of the laser calibration system, such as an intrinsic time calibration resolution of about 100 ps on the single PMT channel [22], well fit the calibration requests for PMT time equalization at the level of 1 ns [1]. The complete description of the laser system performances will be the subject of a forthcoming paper.
5 Final system tests
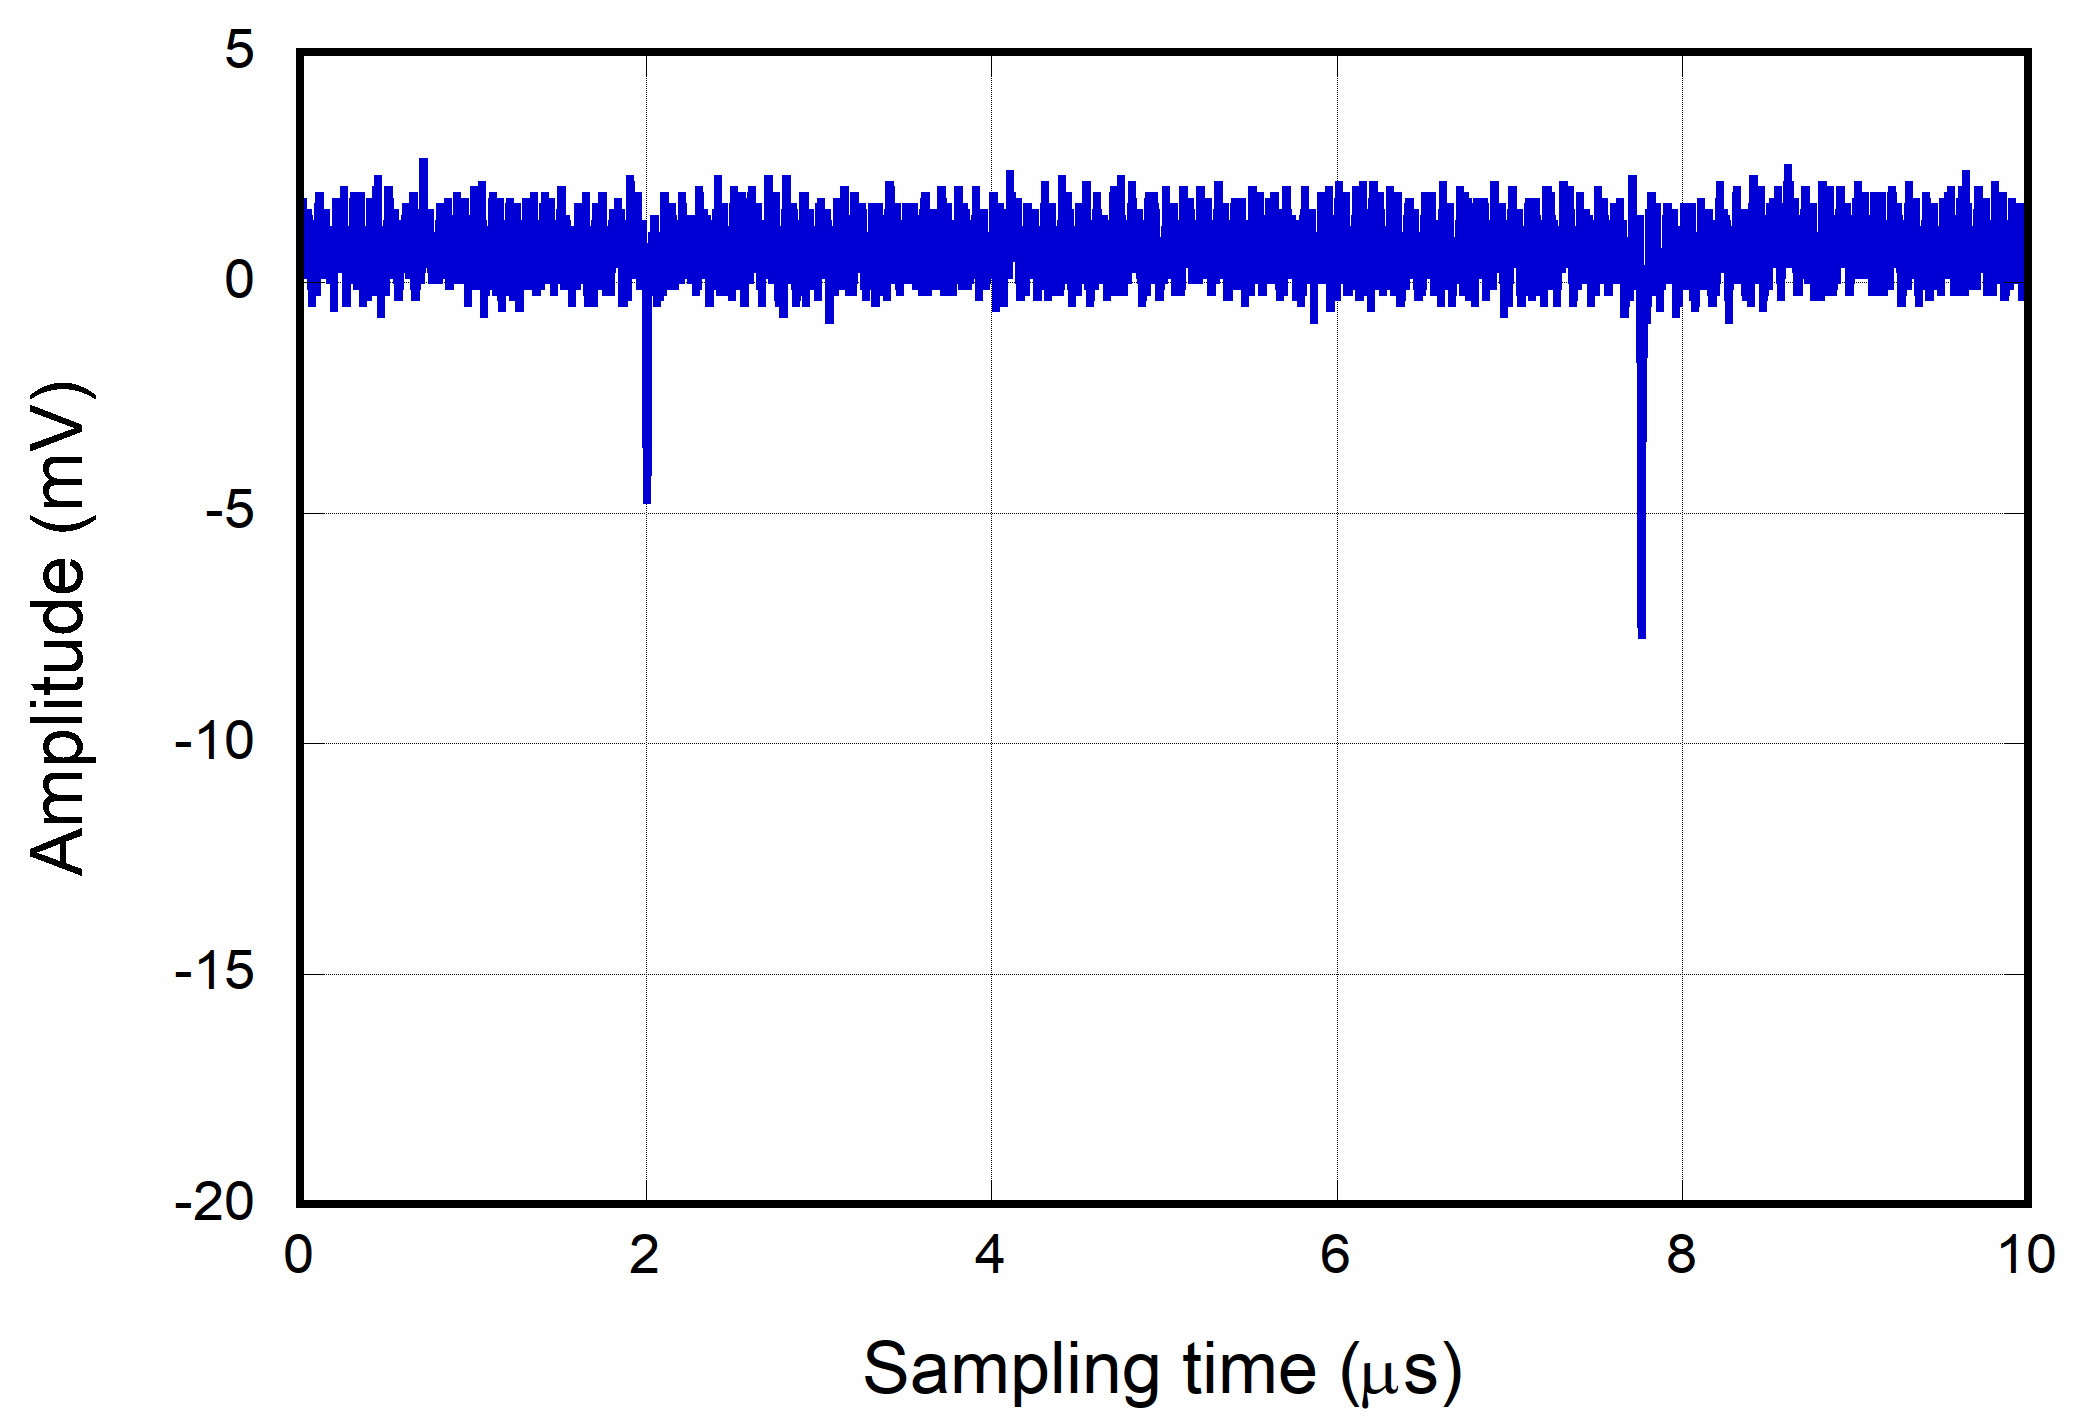
The full light detection system was tested at Fermilab after installation, in order to check the functioning of all the PMT channels, evaluate their performance before cooling down, evaluate the effectiveness of the internal optical-fiber light-distribution system. To this purpose, a subset of the final electronic chain was used. This allowed gaining experience on how to program the new electronics and how to synchronize it with other detector subsystems, such as the trigger and the TPC electronics. Test data were recorded with triggers generated by means of a pulse generator with and without the combination of laser light pulses through the optical-fiber light-distribution system. An example of PMT signal shape recorded in combination with a laser light pulse and a 10 s random trigger acquisition are shown in figure 19.
A first quick check was carried out to highlight possible problems related to the detector transfer to Fermilab. We found 351 working PMTs, a PMT sparking when applied voltage exceeded V, two dead PMTs, and 6 PMTs with some issue when illuminated with the laser source. These PMTs are are undergoing further investigation.
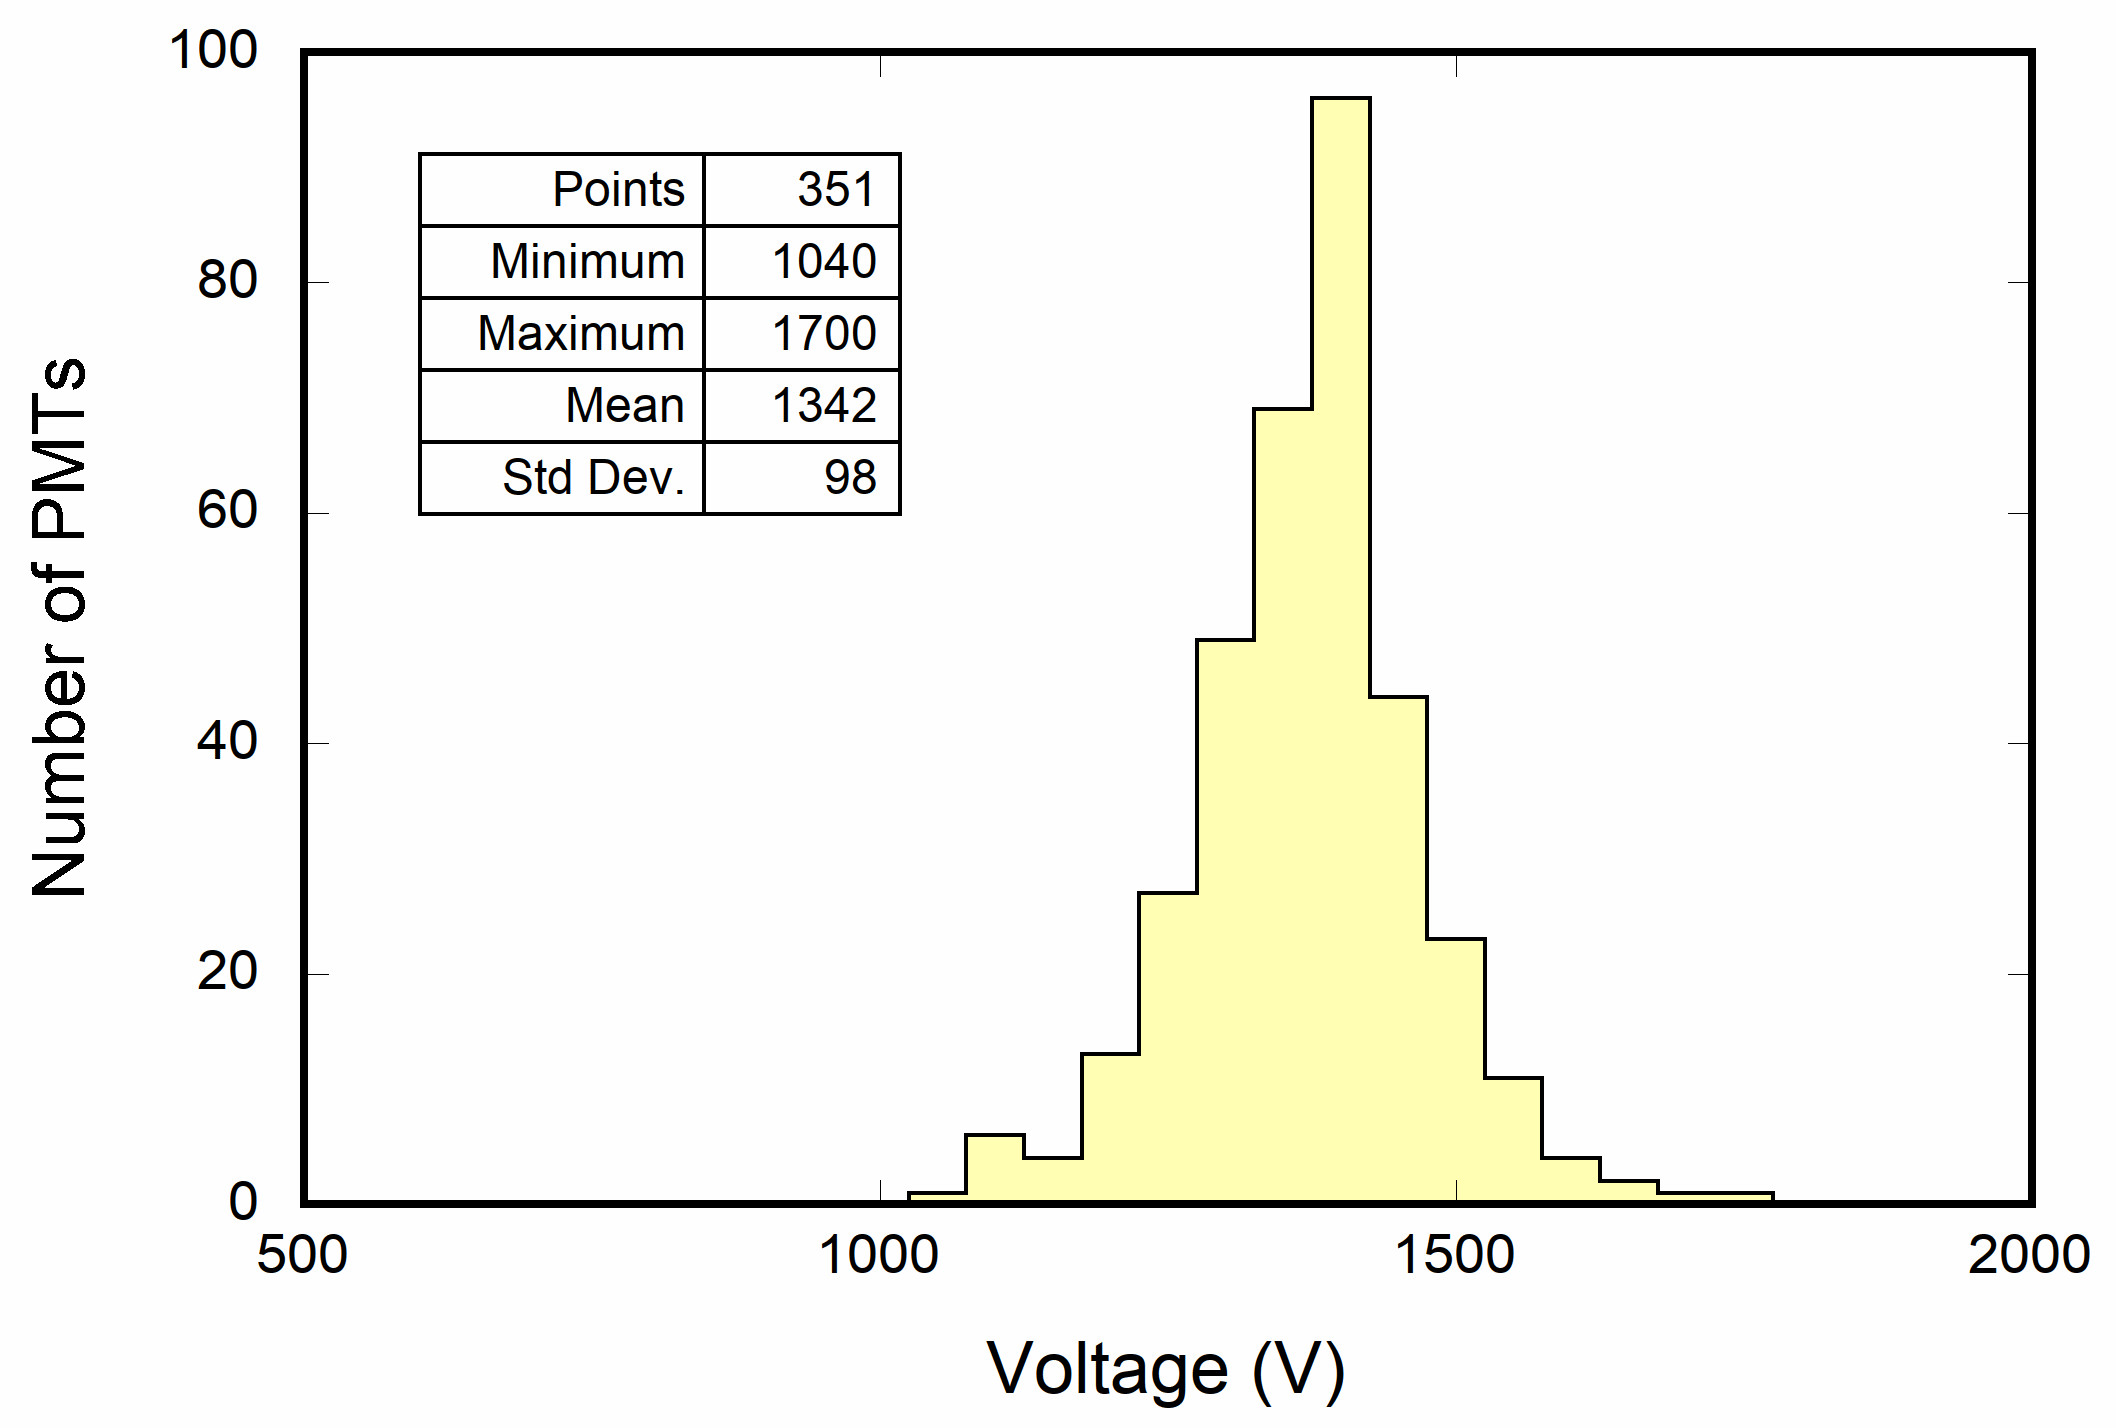
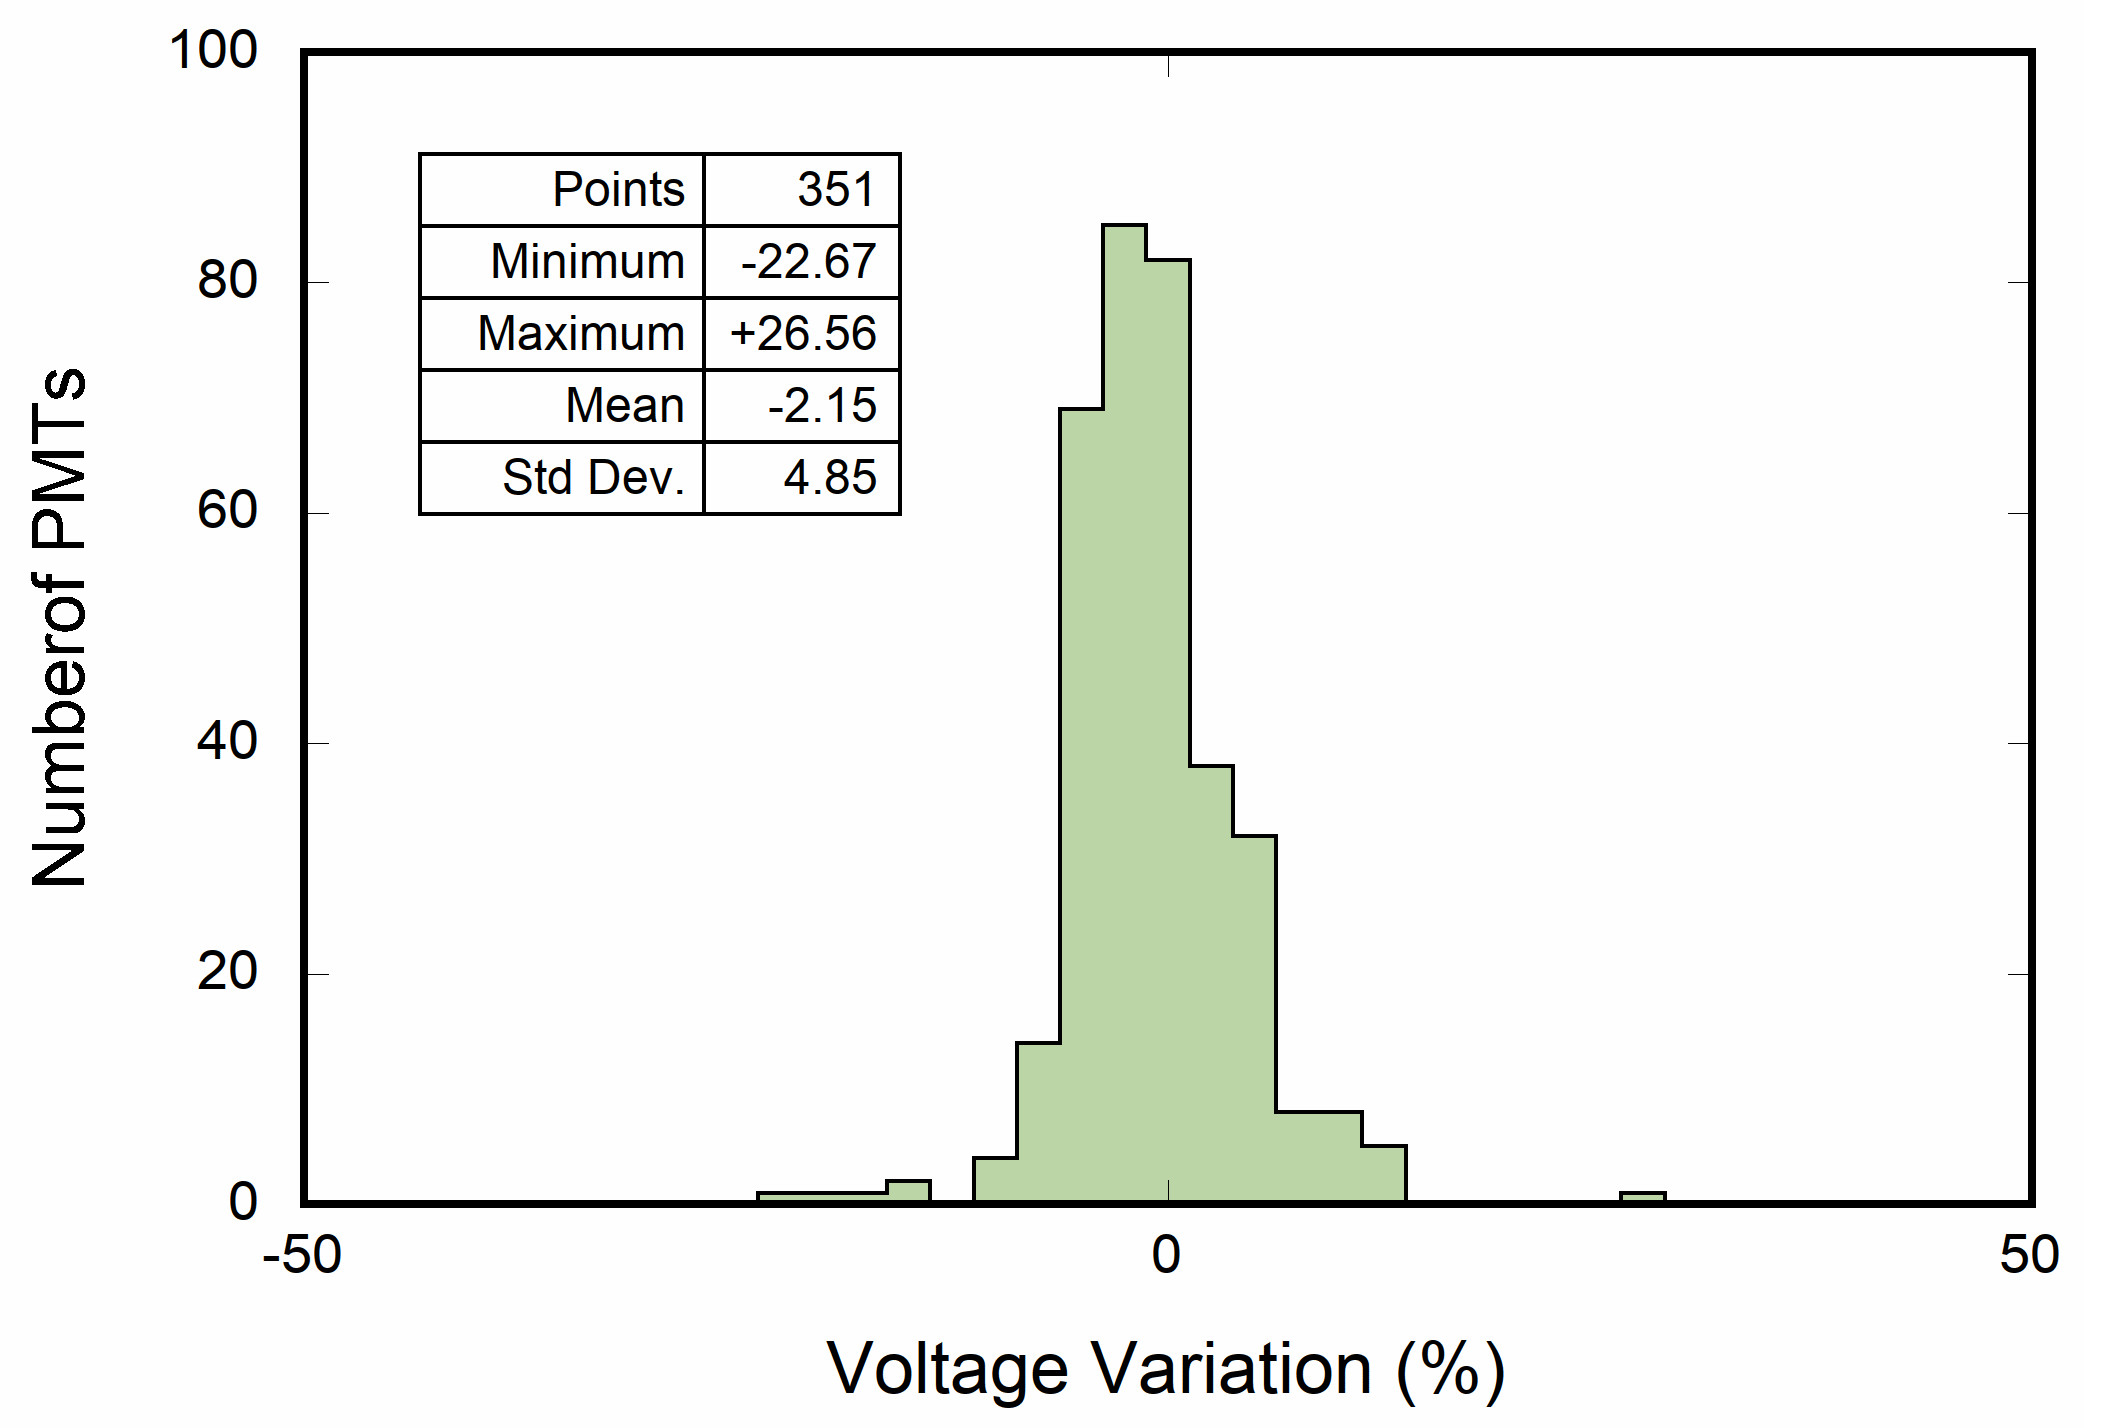
The PMT signal analysis was mainly focused on the gain calibration and dark count rate. The gain calibration of the working PMTs was carried out by acquiring PMT waveforms at a minimum of 3 voltage points. The gain was evaluated by fitting the charge distribution with the analytical expression described in [23]. In figure 20, the distribution of the applied voltage needed to attain a gain of for the 351 working PMTs is shown. Results are consistent with a standard deviation of about 5% with respect the calibration performed at CERN [15].
The dark rate of PMTs was evaluated at Fermilab by counting the number of random single photoelectron pulses using light off data and dividing the total number by the effective acquisition live time. An overall average rate of about 1.6 kHz was found. This value is consistent with the average rate of 2.1 kHz previously measured at room temperature before the installation of the PMTs, taking into account that a different measurement technique was adopted at CERN [15].
6 Conclusions
The new scintillation light detection system for the ICARUS T600 LAr-TPC, realized for its operation at Fermilab in the context of the SBN program, includes the use of 360 large area PMTs mounted behind the wire planes and a fast-laser calibration system. The high performance of this detection system in terms of sensitivity, granularity and time resolution, will allow ICARUS to cope with the large cosmic ray background by identifying the events associated with the neutrino beam.
To this purpose the system was extensively simulated, the components were precisely characterized and the installation procedures and techniques were carefully defined.
Preliminary tests carried out after transport and installation of the apparatus at Fermilab verified the performances of the light detection system required for the identification of signals related to neutrino beam induced events.
Acknowledgment
This work was funded by INFN in the framework of the CERN WA104/NP01 program finalized to the overhauling of ICARUS detector and was supported by the Fermi National Accelerator Laboratory under US Department of Energy contract No. DE-AC02-07CH11359. The research activities were also subsidized by the EU Horizon 2020 Research and Innovation Programme under the Marie Sklodowska-Curie Grant Agreement No. 822185.
References
- [1] MicroBooNE, LAr1-ND, ICARUS-WA104 collaboration, A Proposal for a Three Detector Short-Baseline Neutrino Oscillation Program in the Fermilab Booster Neutrino Beam, arXiv:1503.01520.
- [2] ICARUS collaboration, S. Amoruso, M. Antonello, P. Aprili, F. Arneodo, A. Badertscher, B. Baiboussinov et al., Design, construction and tests of the ICARUS T600 detector, Nucl. Instrum. Meth. A527 (2004) 329–410.
- [3] ICARUS/NP01 collaboration, L. Bagby, B. Baibussinov, V. Bellini, M. Bonesini, A. Braggiotti, L. Castellani et al., New read-out electronics for ICARUS-T600 liquid Argon TPC. Description, simulation and tests of the new front-end and ADC system, JINST 13 (2018) P12007.
- [4] M. Antonello, B. Baibussinov, P. Benetti, E. Calligarich, N. Canci, S. Centro et al., Precise 3D track reconstruction algorithm for the ICARUS T600 liquid argon time projection chamber detector, Adv. High Energy Phys. 2013 (2013) 260820.
- [5] M. Antonello, B. Baibussinov, P. Benetti, F. Boffelli, A. Bubak, E. Calligarich et al., The trigger system of the ICARUS experiment for the CNGS beam, JINST 9 (2014) P08003.
- [6] M. Babicz, S. Bordoni, A. Fava, U. Kose, M. Nessi, F. Pietropaolo et al., Light propagation in liquid argon, accepted for publication on JINST (2020) , [arXiv:2002.09346].
- [7] A. Ankowski, M. Antonello, P. Aprili, F. Arneodo, A. Badertscher, B. Baiboussinov et al., Characterization of ETL 9357FLA photomultiplier tubes for cryogenic temperature applications, Nucl. Instrum. Meth. A556 (2006) 146–157.
- [8] A. Falcone, Studies and tests for the new light collection system of the ICARUS T600 detector. PhD thesis, University of Pavia, 2017.
- [9] ICARUS collaboration, A. Falcone, Performance study of the new light collection system for the ICARUS T600 detector, J. Phys. Conf. Ser. 888 (2017) 012093.
- [10] D. Garcia-Gamez, Developing Scintillation Light Readout Simulation for the SBND experiment, JINST 11 (2016) C01080.
- [11] P. Agnes, G. L. Raselli and M. Rossella, Characterization of large area PMTs at cryogenic temperature for rare event physics experiments, JINST 9 (2014) C03009.
- [12] A. Falcone, R. Bertoni, F. Boffelli, M. Bonesini, T. Cervi, A. Menegolli et al., Comparison between large area photo-multiplier tubes at cryogenic temperature for neutrino and rare event physics experiments, Nucl. Instrum. Meth. A787 (2015) 55–58.
- [13] A. Falcone, F. Boffelli, M. Bonesini, T. Cervi, R. Mazza, A. Menegolli et al., Performance of large area PMTs at cryogenic temperatures for neutrino and rare event physics experiments, PoS PhotoDet2015 (2016) 019.
- [14] M. Babicz, V. Bellini, M. Bonesini, T. Cervi, A. Falcone, A. Menegolli et al., Linearity and saturation properties of Hamamatsu R5912-MOD photomultiplier tube for the ICARUS T600 light detection system, Nucl. Instrum. Meth. A 936 (2019) 554–555.
- [15] ICARUS/NP01 collaboration, M. Babicz, L. Bagby, B. Baibussinov, V. Bellini, M. Bonesini, A. Braggiotti et al., Test and characterization of 400 Hamamatsu R5912-MOD photomultiplier tubes for the ICARUS T600 detector, JINST 13 (2018) P10030.
- [16] M. Bonesini, T. Cervi, A. Falcone, U. Kose, R. Mazza, A. Menegolli et al., An innovative technique for TPB deposition on convex window photomultiplier tubes, JINST 13 (2018) P12020.
- [17] P. Benetti, C. Montanari, G. Raselli, M. Rossella and C. Vignoli, Detection of the VUV liquid argon scintillation light by means of glass-window photomultiplier tubes, Nucl. Instrum. Meth. A505 (2003) 89 – 92.
- [18] M. Diwan, “Photo-multiplier and cable analysis.” url: https://www.phy.bnl.gov/~diwan/talks/pedagogy/pmt/pmt-cable-analysis.pdf, 2019.
- [19] CAEN S.p.A., “V1730/VX1730 & V1725/VX1725 16/8-channel 14-bit 500/250 MS/s Waveform Digitizer.” User Manual UM2792, 2016.
- [20] ICARUS/NP01 collaboration, M. Babicz, M. Diwan, A. Fava, A. Guglielmi, W. Ketchum, G. Meng et al., A particle detector that exploits liquid argon scintillation light, Nucl. Instrum. Meth. A (2019) 162421.
- [21] ICARUS collaboration, M. Bonesini, R. Benocci, R. Bertoni, A. Falcone, R. Mazza, M. Torti et al., The laser diode calibration system of the Icarus T600 detector at FNAL, JINST 15 (2020) C05042.
- [22] R. Bertoni, M. Bonesini, A. de Bari and M. Rossella, A laser diode based system for calibration of fast time of flight detectors, JINST 11 (2016) P05024.
- [23] E. Bellamy, G. Bellettini, J. Budagov, F. Cervelli, I. Chirikov-Zorin, M. Incagli et al., Absolute calibration and monitoring of a spectrometric channel using a photomultiplier, Nucl. Instrum. Meth. A339 (1994) 468 – 476.