The GALAH Survey: A new constraint on cosmological lithium and Galactic lithium evolution from warm dwarf stars
Abstract
Lithium depletion and enrichment in the cosmos is not yet well understood. To help tighten constraints on stellar and Galactic evolution models, we present the largest high-resolution analysis of Li abundances A(Li) to date, with results for over GALAH field stars spanning effective temperatures and metallicities . We separated these stars into two groups, on the warm and cool side of the so-called Li-dip, a localised region of the Kiel diagram wherein lithium is severely depleted. We discovered that stars in these two groups show similar trends in the A(Li)- plane, but with a roughly constant offset in A(Li) of , the warm group having higher Li abundances. At , a significant increasing in Li abundance with increasing metallicity is evident in both groups, signalling the onset of significant Galactic production. At lower metallicity, stars in the cool group sit on the Spite plateau, showing a reduced lithium of around relative to the primordial value predicted from Big Bang nucleosynthesis (BBN). However, stars in the warm group between and , form an elevated plateau that is largely consistent with the BBN prediction. This may indicate that these stars in fact preserve the primordial Li produced in the early Universe.
keywords:
stars: abundances — stars: atmospheres — stars: late-type — Galaxy: abundances — cosmology: primordial nucleosynthesis — techniques: spectroscopic1 Introduction
Lithium is a fragile element that can be destroyed by proton capture reactions at relatively low temperatures () in stellar interiors (Pinsonneault, 1997). Standard stellar evolution models suggest that the convective envelopes are weakly developed in low-mass unevolved (main-sequence) stars with effective temperatures () larger than , thus precluding the surface Li from reaching the interior to be destroyed (Deliyannis et al., 1990). As such, the unevolved, metal-poor stars are expected to retain near-primordial Li abundances, providing an opportunity to put constraints on Big Bang nucleosynthesis (BBN). However, a significant difference has been found between the Li abundance measured from very metal-poor stars in the Galaxy that fall on the so-called “Spite plateau” at A(Li)111A(Li) = , where and are the the number densities of lithium and hydrogen, respectively. (Spite & Spite, 1982), and the prediction by standard BBN models A(Li) (Pitrou et al., 2018). This is the well-known Cosmological Lithium Problem (Spite et al., 2012). It has been suggested that the metal-poor stars we observe have undergone lithium depletion by an amount that may be quantified by comparing stellar abundances to evolutionary models with atomic diffusion and an unknown source of mixing in the stellar interior (Richard et al., 2005; Korn et al., 2006). The results do alleviate the tension to standard Big Bang, but may do not fully bridge the gap as initial abundances of order (Nordlander et al., 2012) or (Mucciarelli et al., 2012) are inferred.
A striking feature called the ”lithium dip” (Li-dip), was first observed in (Population I) main-sequence stars in the Hyades open cluster by Wallerstein et al. (1965), and confirmed by later studies (Boesgaard & Tripicco, 1986; Burkhart & Coupry, 2000; Boesgaard et al., 2016). Li abundances show a significant drop in the temperature range . Within this narrow temperature range, the depletion in A(Li) can reach a factor of 100 relative to stars out of this region. On the warm side of the Li-dip, the Li abundances increase sharply with increasing effective temperature. For larger than 6900 K, the Li abundances seem to remain constant, compatible with the Galactic value (i.e., the meteoritic value; see Lodders et al., 2009). However, few abundance determinations are available for stars in this region, because the primary abundance diagnostic, the Li i 670.8 nm resonance line, is weaker in warmer stars; excessive line broadening due to typically fast stellar rotation further complicates spectroscopic analyses. On the cool side of the Li-dip, the Li abundances increase gradually with decreasing effective temperature until reaching a sort of plateau, which extends from 6400 to 6000 K. Stars in this region are slightly depleted in lithium, however this depletion is uniform, and is not nearly as severe as in the Li-dip stars.
Since the first observations, the presence of the Li-dip has also been found in many older star clusters, such as NGC 752 and M67 (Balachandran, 1995), but not in the youngest open clusters (Boesgaard et al., 1988; Balachandran et al., 2011) – those with ages less than about . This indicates that the large lithium depletions that are now apparent in the Li-dip take place when the stars are on the main-sequence, rather than being there from the star’s birth, or occuring when the star was on the pre-main-sequence phase.
In order to meet observational constraints such as the complicated Li abundance behaviour observed in the main-sequence stars, several different non-standard stellar evolution models have been proposed, which take into consideration atomic diffusion (Michaud, 1986) and rotation-induced mixing (Zahn, 1992). However, these models cannot accurately account for the observed Li-dip. More recent works successfully managed to describe the Li-dip in young stellar cluster Hyades by also accounting for internal gravity waves (Montalbán & Schatzman, 2000; Charbonnel & Talon, 2005). According to their models, one can describe the Li-dip feature by characterising the stars into three groups based on temperature (Charbonnel & Talon, 2005): those warmer than the Li-dip, those within the Li-dip, and those cooler. Stars in the warm group have the shallowest convective envelopes, making them nearly unaffected by diffusion and rotation-induced mixing. Li-dip stars experience rotational mixing as the convective envelope deepens, resulting in severe Li destruction. But for stars in the cool group, even though they have even deeper convective envelopes, internal gravity waves become activated and efficiently extract angular momentum from the interior; this counter-acts the rotational mixing, and limits the amount of lithium destruction. For these reasons, stars on either side of the Li-dip have mechanisms to prevent lithium destruction to different extents. In particular, the warm stars may allow us to probe the primordial Li abundance.
The Li-dip phenomenon has also been observed in unevolved field stars (e.g. Randich et al., 1999; Chen et al., 2001; Lambert & Reddy, 2004; Ramírez et al., 2012; Bensby & Lind, 2018; Aguilera-Gómez et al., 2018). These earlier studies have typical sample sizes of 200-2000 field stars in total, thus spanning only very limited ranges in stellar properties and containing very few stars on the warm side of the Li-dip. To study the lithium evolution comprehensively, a large sample of stars with homogeneous measurements is needed.
The aim of the present paper is to investigate the behaviour of lithium among late-type field stars including main-sequence, turn-off and early sub-giant phase. Using data from the Galactic Archeology with HERMES (GALAH) survey (De Silva et al., 2015), we present the largest sample of lithium abundances so far. The data span benefit from a homogeneous determination of stellar parameters and lithium abundances, and span a wide range of metallicities. These two aspects of our study allow us to draw fresh insights into the lithium puzzle.
2 Observations and analysis
.
We observed over FGK field stars in the solar neighbourhood as part of the GALAH (De Silva et al., 2015), K2-HERMES (Sharma et al., 2019) and TESS-HERMES (Sharma et al., 2017) spectroscopic surveys. The spectral resolving power of the surveys is sufficiently matched to the stellar absorption lines under study. To avoid stars with large convection-driven lithium depletion, we mainly target the dwarf and sub-giant stars with ranging from 5900 to covering a large range of metallicity from to , which includes the Spite plateau at the metal-poor end. After excluding spectroscopically resolved binaries, and observations with fitting inaccuracies, low signal-to-noise ratio, strong emission lines or reduction issues, we obtain a set of 62 945 stars with lithium detections and a separate set of 59 117 stars with upper limits on the Li abundance.
The stellar parameters , , projected rotational velocities , and line-of-sight radial velocity were determined simultaneously in a homogeneous way by fitting observed neutral and ionized lines of Sc, Ti, and Fe lines that are unblended and for which reliable atomic data are available, as well as the -sensitive and lines, using the GALAH analysis pipeline (Buder et al., 2018). Surface gravities were constrained consistently and simultaneously by the fundamental relation between the absolute magnitude, mass and (Buder et al., 2019). Stellar masses and ages were estimated by a Bayesian implementation of isochrone fitting (Lin et al., 2018). Having obtained the optimal stellar parameters, Li abundances were then derived using non-local thermodynamic equilibrium spectral synthesis (Gao et al., 2018) for the Li i 670.8 nm resonance line. The non-LTE departure coefficients come from the model described in (Lind et al., 2009).
In this work, we consider lithium to be detected when the line depression () is deeper than of the flux error within the line mask, and at least below the normalised continuum flux. In all other cases, the measurement is considered as an upper limit. We estimate upper limits on the Li abundance based on linear interpolation in four dimensions, using a large matrix that connects line strength with Li abundance, effective temperature, surface gravity, and rotational velocity.
3 Results
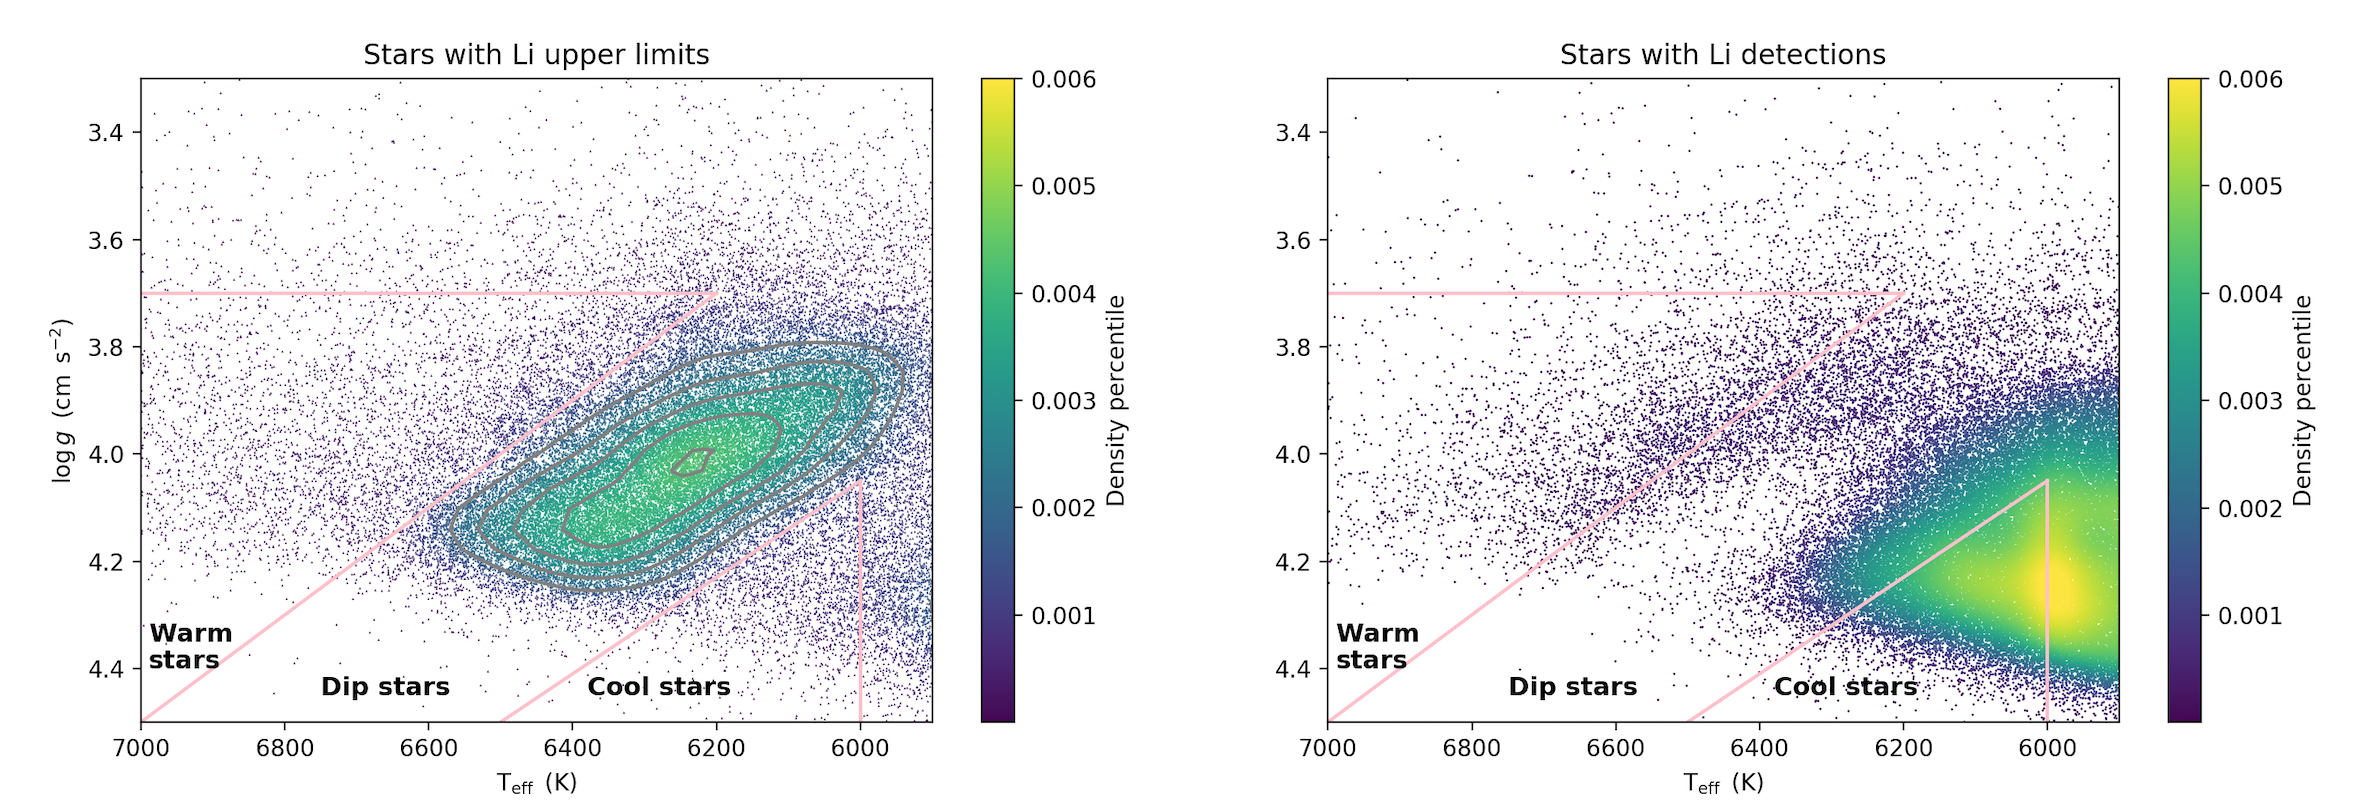
Fig. 1 shows the locations of the sample stars with lithium detections and upper limits in the Kiel diagram, respectively. Comparing the two panels, a clear gap is seen in the distribution of stars for which lithium could be detected (Fig. 1b), whereas a significant overdensity of stars for which only upper limits on the Li abundance could be obtained is seen in the same region (Fig. 1a). Most of the stars with upper limits are concentrated in this diagonal region between to , with surface gravity () ranging from 3.8 to . We interpret this as the Li-dip region: these stars have experienced severe lithium depletion and are now evolving towards to the sub-giant branch.
To characterise the Li-dip region in the Kiel diagram, we first narrow down the range of our sample () to reduce the the evolutionary effects on lithium due to post-main-sequence stars. Our sample now consists of upper main-sequence stars, turn-off stars and early sub-giants. Moreover, we remove all the stars with less than , as those cooler stars undergo strong and rapid lithium depletion, due to their larger convective envelopes (e.g. Bensby & Lind, 2018). The density contours are then overplotted on the distribution of A(Li) upper limits. We define the approximate boundaries of the Li-dip region by using linear fits in the left and right edges of the outermost contour. We delineate the left and right boundaries of the Li-dip region as the warm group and cool group of stars, respectively.
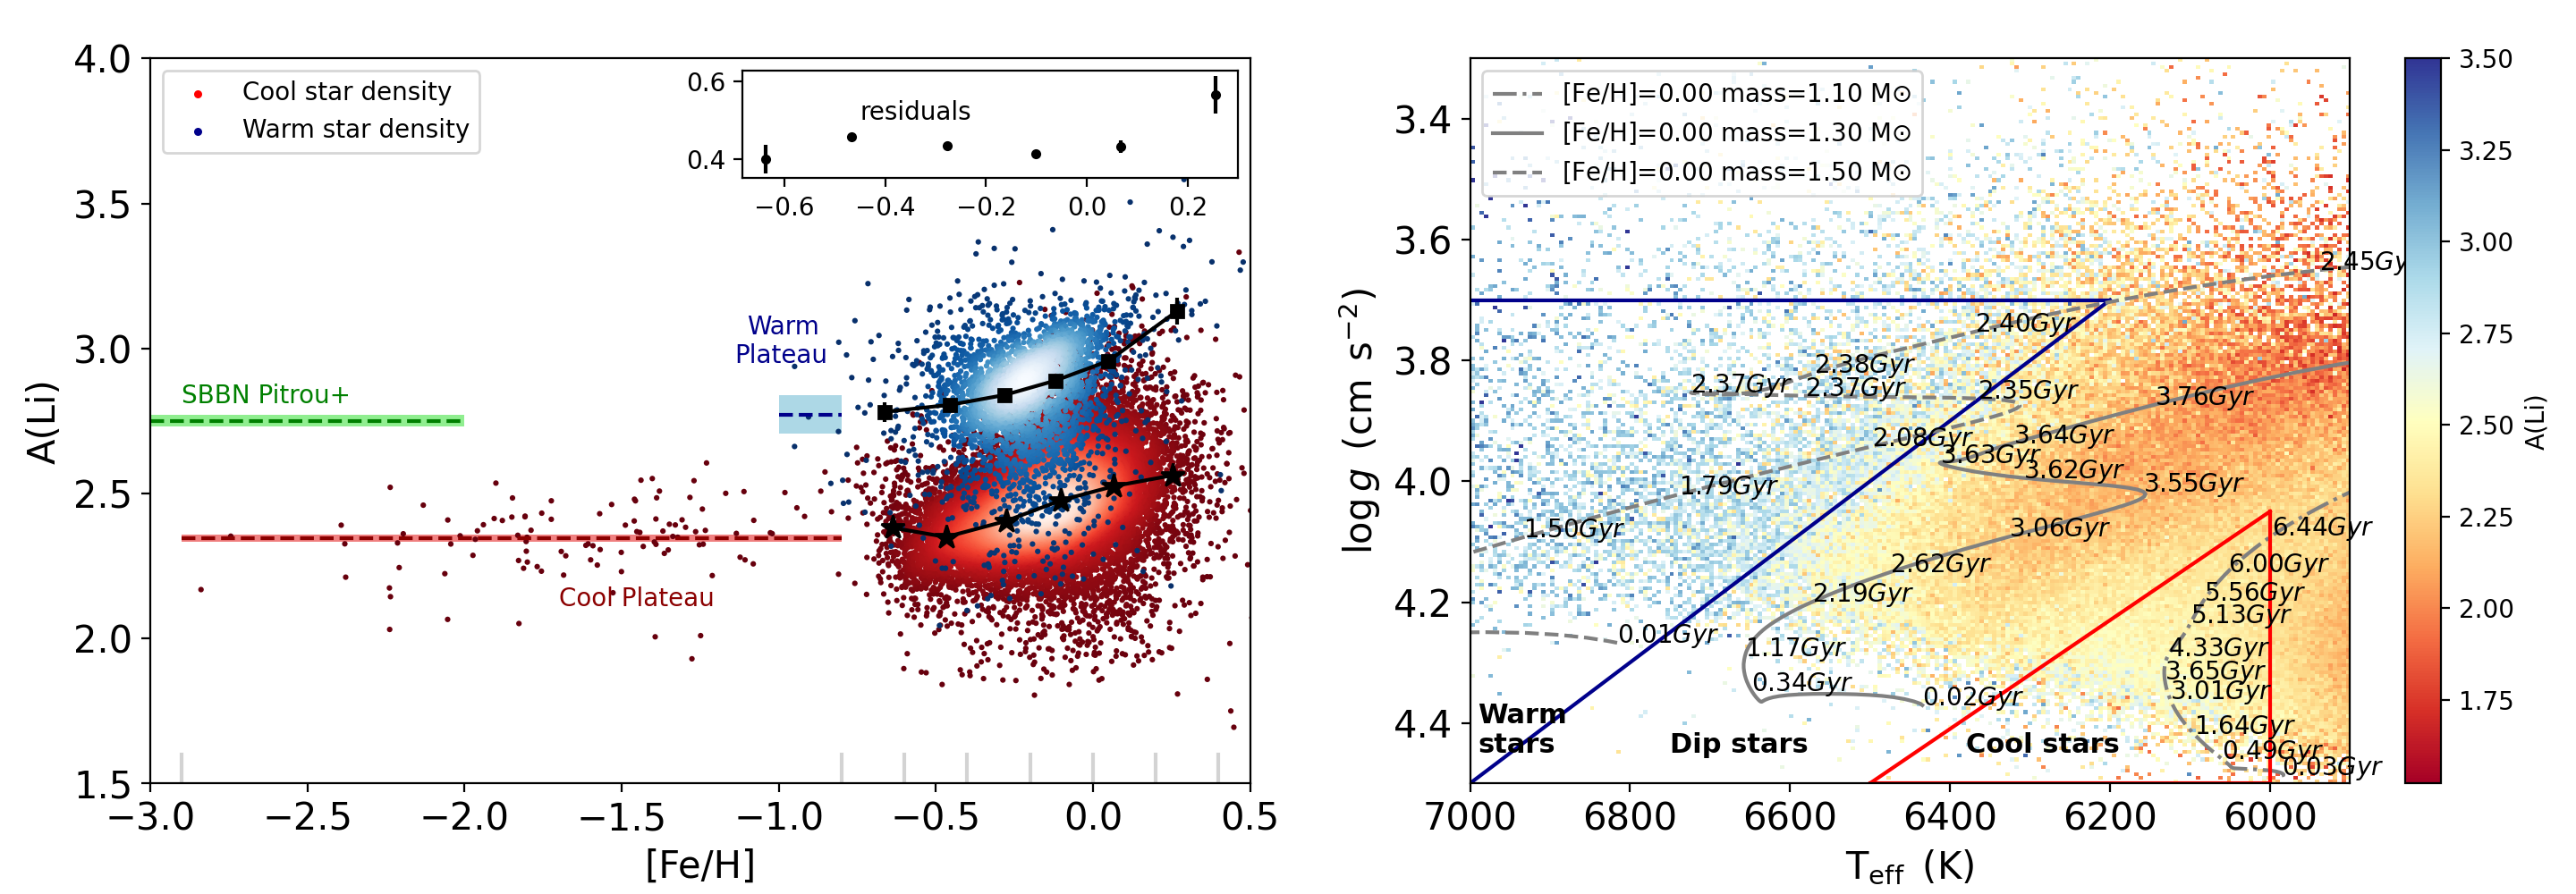
The left panel of Fig. 2 shows lithium trends as a function of metallicity, for the warm and cool groups of stars. At low metallicity (), the stars in the cool group have ages in excess of and reveal the Spite Plateau, showing low and near-constant Li abundances. In contrast, there are no old, metal-poor warm stars in our sample: such stars have higher masses and have evolved off the main-sequence after such a long period. Thus the stars in the warm group only appear above . Up to , the warm group having 117 stars shows a similar constant lithium plateau, but elevated by almost three times that of the cool group (). We measure A(Li) . Remarkably, this plateau is largely consistent with the predictions of BBN (A(Li) ). One interpretation of this, is that both Galactic enrichment and stellar destruction have been insignificant in this population of stars; in other words, that these stars in fact may preserve the primordial Li produced in the early Universe.
At higher metallicities , both the warm and cool groups of stars show an increasing trend in A(Li). This is probably caused by Galactic enrichment (Prantzos et al., 2017). It is interested to note that even in this metallicity regime, the difference in the average Li abundances between the warm and cool groups is still , and remains so up to solar metallicity.
The right panel of Fig. 2 shows the corresponding location of warm and cool group stars in the Kiel diagram with color-coded Li abundances. There is a clear gradient in the Li abundances across the Kiel diagram, delineating the Li-dip from the warm and cool groups of stars. It shows that stars in the cool group are systematically more depleted in lithium than those in the warm group. Since most of our stars are centered around the solar metallicity, we overplotted the evolutionary tracks of different masses in solar metallicity on the distribution of our targets. The theoretical models support our speculation that we have captured the evolutionary track of Li-dip stars in our observations.
At a given , there is a difference in mean age between the warm group (young) and cool group (old), because of the sample selection method. The age difference is largest at low metallicity (up to ) and steadily decreases to become insignificant at the highest metallicities. The lower Li abundances of the cool group should thus be interpreted as a combined effect of their lower effective temperatures and older ages, making depletion more efficient and giving it longer time to act. Sestito & Randich (2005) carried out a detailed investigation of lithium depletion time scales in late-type stars at this temperature with metallicities . They found that main-sequence lithium depletion is not a continuous process and becomes ineffective beyond an age of 1-2 Gyr for the majority of stars, leading to a Li plateau at older ages. The total amount of lithium depletion during the main-sequence lifetime is around 0.5 dex.
The age difference between the warm and cool groups may lead one to speculate that Galactic chemical evolution has elevated the initial Li abundances in the warm group compared to in the cool group. However, our data suggests that such enrichment scales with increasing metallicity and only becomes noticeable at where Fig. 2 above shows the stars in both the warm and cool groups clearly rise off their respective plateaus. Moreover, recent observations of Li abundances in the low metallicity gas () of the Small Magellanic Cloud (Howk et al., 2012) and in warmer stars in the open cluster NGC 2243 (François et al., 2013) (; an estimated age of ) are in good agreement with mean A(Li) measurements in the warm plateau stars. The value of Li abundance obtained from these observations are all comparable to the primordial Li abundance predicted by BBN.
4 Conclusions
To reduce the complex behaviour of lithium in the field stars, for the first time we draw a comparison between the warm and cool groups of stars, which are located on the warm and cool side of the Li-dip, respectively. Here we find that Li abundances in the two groups show a similar pattern as a function of , however, stars in the cool group are more depleted in lithium than those in the warm group by a factor of three. This difference is determined from more than 100 000 stars that have a wide range of stellar properties and chemistry. The implications we can obtain from this result are as follows.
-
•
We find that at , the average Li abundance of stars warmer than the Li-dip shows an elevated lithium plateau, the value of which is consistent with the primordial Li abundance as predicted by BBN within the errors. Since Galactic production of lithium has not yet contributed significantly to the cooler Spite plateau in this metallicity regime, we suggest that the Li abundance measured in the warm group is indicative of insigificant Li depletion as well as insignificant Li enrichment in these stars. This interpretation would explain why the Li abundances closely resemble the BBN primordial value, and is consistent with what has been reported for the Small Magellanic Cloud (Howk et al., 2012) and in the open cluster NGC 2243 (François et al., 2013). Regardless of the possibility that minor depletion and enrichment may have cancelled each other out in this group of stars, the values provide a valuable constraint on both cosmological models of the early universe and stellar evolution models.
-
•
We infer that, at a given metallicity, the three different regimes (warm, Li-dip, cool) follow different lithium depletion mechanisms. For the stars in the cool group, the depletion is not strongly dependent of metallicity; instead it is primarily governed by a star’s main-sequence temperature and age. How much lithium has been depleted is a combination of temperature and stellar age, causing a near-constant offset with respect to the warm group.
-
•
We identify as the turning point where the Li abundances break the plateau and Galactic lithium production becomes significant. We see this in both the warm and the cool groups of stars. Given that the Spite plateau stars (of the cool group) have already experienced a large depletion of lithium and therefore do not reflect the true primordial value, we recommend that modellers apply the BBN-predicted Li abundance, instead of the Spite plateau (Spite & Spite, 1982) Li abundance, as the initial value in chemical evolution models (Prantzos, 2012; Prantzos et al., 2017).
Acknowledgements
XDG, KL, AMA and SB acknowledge funds from the Alexander von Humboldt Foundation in the framework of the Sofja Kovalevskaja Award endowed by the Federal Ministry of Education and Research. KL also acknowledges funds from the Swedish Research Council (VR 2015-004153) and Marie Skłodowska Curie Actions (cofund project INCA 600398), and AMA also acknowledges support from the Swedish Research Council (VR 2016-03765), and the project grant ‘The New Milky Way’ (KAW 2013.0052) from the Knut and Alice Wallenberg Foundation. TZ acknowledges financial support of the Slovenian Research Agency (research core funding No. P1-0188). SLM and JDS acknowledges the support of the Australian Research Council through Discovery Project grant DP180101791. Parts of this research were conducted by the Australian Research Council Centre of Excellence for All Sky Astrophysics in 3 Dimensions (ASTRO 3D), through project number CE170100013. YST is grateful to be supported by the NASA Hubble Fellowship grant HST-HF2-51425 awarded by the Space Telescope Science Institute. SWC acknowledges federal funding from the Australian Research Council though the Future Fellowship grant entitled ‘Where are the Convective Boundaries in Stars?’ (FT160100046). GT acknowledges support by the project grant ‘The New Milky Way’ from the Knut and Alice Wallenberg foundation and by the grant 2016-03412 from the Swedish Research Council. This work is also based on data acquired from the Anglo-Australian Telescope. We acknowledge the traditional owners of the land on which the AAT stands, the Gamilaraay people, and pay our respects to elders past and present.
References
- Aguilera-Gómez et al. (2018) Aguilera-Gómez C., Ramírez I., Chanamé J., 2018, A&A, 614, A55
- Balachandran (1995) Balachandran S., 1995, ApJ, 446, 203
- Balachandran et al. (2011) Balachandran S. C., Mallik S. V., Lambert D. L., 2011, MNRAS, 410, 2526
- Bensby & Lind (2018) Bensby T., Lind K., 2018, A&A, 615, A151
- Boesgaard & Tripicco (1986) Boesgaard A. M., Tripicco M. J., 1986, ApJ, 302, L49
- Boesgaard et al. (1988) Boesgaard A. M., Budge K. G., Ramsay M. E., 1988, ApJ, 327, 389
- Boesgaard et al. (2016) Boesgaard A. M., Lum M. G., Deliyannis C. P., King J. R., Pinsonneault M. H., Somers G., 2016, ApJ, 830, 49
- Buder et al. (2018) Buder S., et al., 2018, MNRAS, 478, 4513
- Buder et al. (2019) Buder S., et al., 2019, A&A, 624, A19
- Burkhart & Coupry (2000) Burkhart C., Coupry M. F., 2000, A&A, 354, 216
- Charbonnel & Talon (2005) Charbonnel C., Talon S., 2005, in Alecian G., Richard O., Vauclair S., eds, EAS Publications Series Vol. 17, EAS Publications Series. pp 167–176, doi:10.1051/eas:2005111
- Chen et al. (2001) Chen Y. Q., Nissen P. E., Benoni T., Zhao G., 2001, A&A, 371, 943
- De Silva et al. (2015) De Silva G. M., et al., 2015, MNRAS, 449, 2604
- Deliyannis et al. (1990) Deliyannis C. P., Demarque P., Kawaler S. D., 1990, ApJS, 73, 21
- François et al. (2013) François P., Pasquini L., Biazzo K., Bonifacio P., Palsa R., 2013, A&A, 552, A136
- Gao et al. (2018) Gao X., et al., 2018, MNRAS, 481, 2666
- Howk et al. (2012) Howk J. C., Lehner N., Fields B. D., Mathews G. J., 2012, Nature, 489, 121
- Korn et al. (2006) Korn A. J., Grundahl F., Richard O., Barklem P. S., Mashonkina L., Collet R., Piskunov N., Gustafsson B., 2006, Nature, 442, 657
- Lambert & Reddy (2004) Lambert D. L., Reddy B. E., 2004, MNRAS, 349, 757
- Lin et al. (2018) Lin J., Dotter A., Ting Y.-S., Asplund M., 2018, MNRAS, 477, 2966
- Lind et al. (2009) Lind K., Asplund M., Barklem P. S., 2009, A&A, 503, 541
- Lodders et al. (2009) Lodders K., Palme H., Gail H.-P., 2009, Landolt Börnstein, p. 712
- Michaud (1986) Michaud G., 1986, ApJ, 302, 650
- Montalbán & Schatzman (2000) Montalbán J., Schatzman E., 2000, A&A, 354, 943
- Mucciarelli et al. (2012) Mucciarelli A., Salaris M., Bonifacio P., 2012, MNRAS, 419, 2195
- Nordlander et al. (2012) Nordlander T., Korn A. J., Richard O., Lind K., 2012, ApJ, 753, 48
- Pinsonneault (1997) Pinsonneault M., 1997, ARA&A, 35, 557
- Pitrou et al. (2018) Pitrou C., Coc A., Uzan J.-P., Vangioni E., 2018, Physics Reports, 754, 1
- Prantzos (2012) Prantzos N., 2012, A&A, 542, A67
- Prantzos et al. (2017) Prantzos N., de Laverny P., Guiglion G., Recio-Blanco A., Worley C. C., 2017, A&A, 606, A132
- Ramírez et al. (2012) Ramírez I., Fish J. R., Lambert D. L., Allende Prieto C., 2012, ApJ, 756, 46
- Randich et al. (1999) Randich S., Gratton R., Pallavicini R., Pasquini L., Carretta E., 1999, A&A, 348, 487
- Richard et al. (2005) Richard O., Michaud G., Richer J., 2005, ApJ, 619, 538
- Sestito & Randich (2005) Sestito P., Randich S., 2005, A&A, 442, 615
- Sharma et al. (2017) Sharma S., et al., 2017, preprint, (arXiv:1707.05753)
- Sharma et al. (2019) Sharma S., et al., 2019, arXiv e-prints,
- Spite & Spite (1982) Spite F., Spite M., 1982, A&A, 115, 357
- Spite et al. (2012) Spite M., Spite F., Bonifacio P., 2012, Memorie della Societa Astronomica Italiana Supplementi, 22, 9
- Wallerstein et al. (1965) Wallerstein G., Herbig G. H., Conti P. S., 1965, ApJ, 141, 610
- Zahn (1992) Zahn J.-P., 1992, A&A, 265, 115