tcb@breakable
Near-Perfect Recovery in the One-Dimensional Latent Space Model
Abstract
Suppose a graph is stochastically created by uniformly sampling vertices along a line segment and connecting each pair of vertices with a probability that is a known decreasing function of their distance. We ask if it is possible to reconstruct the actual positions of the vertices in by only observing the generated unlabeled graph. We study this question for two natural edge probability functions — one where the probability of an edge decays exponentially with the distance and another where this probability decays only linearly. We initiate our study with the weaker goal of recovering only the order in which vertices appear on the line segment. For a segment of length and a precision parameter , we show that for both exponential and linear decay edge probability functions, there is an efficient algorithm that correctly recovers (up to reflection symmetry) the order of all vertices that are at least apart, using only samples (vertices). Building on this result, we then show that vertices (samples) are sufficient to additionally recover the location of each vertex on the line to within a precision of . We complement this result with an lower bound on samples needed for reconstructing positions (even by a computationally unbounded algorithm), showing that the task of recovering positions is information-theoretically harder than recovering the order. We give experimental results showing that our algorithm recovers the positions of almost all points with high accuracy.
1 Introduction
Large graphs arise naturally in modeling many scenarios in social interaction, natural language processing, image processing, and recommendation systems. Nodes in these graphs represent individual entities such as people, genes, or pixels and edges represent relationships between them. A natural goal in analyzing such graphs is to partition the nodes into a small number of sets in such a way that two nodes in the same set ‘behave similarly’ in terms of their interaction. Algorithms for finding such communities are analyzed on synthetic data generated by a stochastic model. The stochastic block model or planted cluster model is a commonly used generative model. This model is parametrized by where is the number of vertices, is the number of clusters, is a -vector of probabilities summing to 1, and is a matrix. The cluster that a vertex belongs to is chosen independently of other vertices according to . For any two vertices and in clusters and respectively, the probability of an edge between and is . Much work has been done in this model to understand the information-theoretic and computational limits for achieving exact, partial and weak recovery. For a detailed discussion of the model, its motivation, different notions of recovery, and positive and negative results, see the excellent survey by Abbe [1].
The stochastic block model is based on the assumption that the entities involved can be neatly categorized into a small number of classes, and membership in a class is the sole determinant of how an entity interacts with others. For example, in this model, we could regard people’s political persuasion as being binary – say, liberal or conservative in the United States – and posit that there is a certain probability for edges connecting two conservatives or two liberals, and a different probability for an edge connecting a liberal to a conservative. Many real situations are more complex. For example, the probability of an edge between two nodes in a social network might be a function of many different attributes of these nodes, each of which can be discrete or continuous-valued.
Other variants of the stochastic block model have been proposed recently. [5, 10]. However, these models all share many features with the stochastic block model, and in particular, assume that objects only belong to one of a small number of clusters, with a clear difference in probabilities between intra-cluster and inter-cluster edges. Just like the stochastic block model, these models do not capture some aspects of the real situation in which relationship graphs arise.
In this paper, we study similar recovery problems in a different model called the latent space model. In this model, we think of nodes as points in a metric space, and let edges be independently sampled with probabilities that are a decreasing function of the distance between the endpoints. Given a large graph generated according to this model, we seek to find (approximate) locations of each node or entity in the metric space. The latent space model can be seen as a generalization of the stochastic block model, by letting the points in the same cluster be at distance 0 from each other, and points in different clusters be at distance 1. In fact, an intermediate model between the stochastic block model and our model consists of a metric space with a finite number of points (or clusters), where each entity is located at one of these points. If we can find good enough approximations for the location of each node in the metric space, we will exactly identify cluster membership in these finite and discrete metric spaces.
The latent space model was first introduced by Hoff et al. [8] and extended by Handcock et al. [7]. This model has been applied to political relationships [9, 14] and social networks [6]. Previous work on this model has been focused on heuristic approaches to finding the maximum likelihood latent positions and empirical evaluations of these approaches [7, 8, 15]. Recently, Ke and Honorio [10, 11] studied a particular case of the latent space model where each point belongs to one of two communities, and the points in the same community are close to each other.
We study the basic version of the latent space model, where the nodes are uniformly sampled on a segment. We consider both the problem of recovering the order of the nodes and the problem of recovering the positions of the nodes. For this simple setting our focus is on designing algorithms with provable guarantees on number of samples needed, running time, and quality of approximation. While maximum likelihood methods are statistically consistent and converge to the right model in the limit, there are no proofs in the literature about the convergence rate of maximum likelihood heuristics that have been proposed for our model.
The work of Sarkar et. al [16] considers a setting that is somewhat similar to ours. They focus on the problem of estimating the distance between a given pair of nodes in a -dimensional latent space, based on the observed graph. However, in their setting, the edges obey a threshold behavior where any pair of nodes has an edge iff they are within a specified threshold distance. Thus once the node positions are fixed, the resulting graph is deterministic. In contrast, in our setting, even when the node positions are fixed, the resulting graph has high entropy as well contains a mixture of short-range and long-range edges, making the reconstruction problem distinctly more challenging even in the one-dimensional case that we consider here.
In statistical mechanics and probability theory, models such as the latent space model have been studied under the name long-range percolation models [2, 4, 13, 17]. Most of the work in these disciplines is focused on the problem of understanding structural properties of the graphs that arise, rather than algorithmic reconstruction of the locations of entities. Our paper takes a first step in designing and analyzing efficient algorithms for this reconstruction. We focus here on reconstruction in a one-dimensional metric space, namely, the real interval . We assume that entities are uniformly sampled (with sufficient density) from this metric space. We also restrict attention to specific types of edge probability functions - exponentially decaying functions and linearly decaying functions. In other words, if is the distance between points and , we consider a model where the probability of an edge is and another model where the probability of an edge is , in both cases for a constant .
In the standard stochastic model a distinction is made between fundamental (information-theoretic) limits and (efficient) computational limits for each kind of recovery and bounds for each of them are pretty tightly pinned down. Specifically, the information-theoretic bounds are based on the separation needed between intra-cluster edge probabilities and inter-cluster probabilities. Since our edge probabilities are continuous functions of distance, we cannot hope to show these kinds of bounds. Instead, we give upper and lower bounds for how densely entities must be sampled in order to efficiently recover their approximate order. Since these bounds are essentially tight, and the upper bound is by an efficient algorithm, they are both information-theoretic and computational.
1.1 Problem Statement and Results
We consider the following scenario: On the segment points, say , are uniformly sampled. Let be the location of , and let be the location vector. A random graph is constructed with this vertex set; edges are sampled independently as follows: for any pair of vertices and , an edge exists between them with probability , where and is some monotone decreasing function such that and . For such a graph and a position vector , denote by the likelihood of given , i.e. .
Our goal is to design an algorithm that takes as input the (unlabeled) graph , and a constant , and outputs a vector which is a “recovery” of the location of each point. We consider two distinct notions of recovery: (1) recovering the order, by which we mean that for any pair of and such that , with high probability; (2) recovering the location, by which we mean that for any , with high probability. We study both these problems for two natural choices of , namely, the exponential decay function , and the linear decay function .
For the problem of recovering the order to within any specified precision , we show that it suffices to sample points. Notice that points are necessary, since otherwise will have isolated vertices with high probability, and it is information-theoretically infeasible to determine the relative order of two isolated vertices no matter how far apart. At a high-level, our algorithms employ the following general approach. First, for each pair of vertices, we use the number of common neighbors to approximate the distance between them. Of course the greater the number of common neighbors between two nodes, the smaller we expect their distance to be. But we need to precisely quantify the range of distances that can be sufficiently accurately reconstructed using a coarse measure such as the number of common neighbors. We prove bounds for this range under both exponential decay and linear decay models. We then use this information to determine spatial relationships between vertices, and recover a global order.
For the problem of recovering the location, we focus on the case . Building on our algorithm for recovering the order, we can show that with samples, it is possible to recover locations of the points to within precision . We also show that the sample complexity of recovering positions is inherently much more than the sample complexity for recovering the order. Specifically, for any , we give two location vectors and such that and prove that it is impossible to distinguish these two vectors with large constant probability given a random graph generated in accordance with one of these two vectors. This shows that points are necessary to recover locations. Matching this, given samples, we prove that we can distinguish between any two location vector and such that . Note that the upper bound refers to the problem of distinguishing two position vectors. The best upper bound we can prove for recovering position is still .
Finally, we analyze the accuracy of our recovery algorithms on synthetically generated datasets, and show that consistent with our theoretical results, we are able to reconstruct the order and positions of the underlying point set to an increasingly high precision as the sample size increases.
Organization
The remainder of the paper is organized as follows. In Section 2, we give some math results which we will use in our paper. In Section 3, we present and analyze our algorithm for recovering the order of vertices for both the exponential decay function and the linear decay function. In Section 4, we show that we can recover approximate positions of each vertex in both models. We also establish our lower bound on the number of samples needed for this task. We present our empirical results in Section 5. Finally, in Section 6 we briefly discuss the larger context for our problem and open problems.
2 Math Tools
2.1 Basic Math Inequalities
In this section, we prove some math results we used.
Proposition 2.1.
Suppose four different numbers , , , , satisfy that , , , and , then
Proof.
For any positive numbers , let . Then , which means is between and .
We first prove , and with the same argument, , which together imply the proposition.
Case 1: . , which means .
Case 2: . , which means .
Case 3: , . ∎
Proposition 2.2.
If , ; if , .
Proof.
The Taylor expansion of is
The inequality holds because . On the other hand,
since . ∎
Proposition 2.3.
For any , .
Proof.
Let , to prove the proposition, we only need to prove that for any , , which is equivalent to proving that
Let be the LHS, . The derivative when , so when . ∎
Proposition 2.4.
For any , .
Proof.
Let , to prove the proposition, we only need to prove that for any , , which is equivalent to prove that
Let be the LHS, , and the derivative
when , so when . ∎
Proposition 2.5.
For any , .
Proof.
Let , to prove the proposition, we only need to prove that for any , , which is equivalent to prove that
Let be the LHS, , and the derivative
when and , so when . ∎
2.2 Sub-exponential Variables and Bernstein Bound
In this section, we review the concept of sub-exponential variables and Bernstein bound.
Definition 1 (Sub-exponential Variables).
A random variable with mean is sub-exponential with parameters if for any with ,
The following result is a common technique for proving sub-exponential.
Proposition 2.6.
For any random variable with mean and any number , where is a random variable which is independent and identical to .
Proof.
The second inequality is due to Jensen’s inequality. Let be a random variable taking value on with probability half on both values. Since and are identical, and are identical. So we have
On the other hand, for any number ,
So ∎
Proposition 2.7 (Bernstein bound [3]).
Let be independent random variables, where is sub-exponential random variable with mean and sub-exponential parameter .
where and
3 Recovering the Order
We start by proving a simple statement — that with enough samples, each segment of length has at least one vertex. Throughout the paper, whenever we say , we mean .
Lemma 3.1.
If and , with probability , for any non-negative integer , the interval on the segment has at least one point.
Proof.
Since , . For any such segment, the probability that there is no point on it is . The assertion follows by using the union bound over all segments. ∎
We will also need the following simple proposition directly implied by Chernoff bound.
Proposition 3.2.
Let be the sum of i.i.d Bernoulli samples with probability . Let . Then the probability that is if .
Proof.
By Chernoff bound, for any ,
Let , the RHS will be , ∎
We now give the algorithm that recovers the order for each of the 2 different choices of functions provided there are sufficiently many vertices. Specifically, we prove the following two theorems. The probability of success indicated in the theorems is over the randomness of the location of the points as well as the realization of the graph.
Theorem 1.
When , for any and , there is a poly-time algorithm that recovers the order with probability .
Theorem 2.
When , for any and , there is a poly-time algorithm that recovers the order with probability .
The basic idea of both algorithms is that, we first approximate the distance between any pair of vertices. The approximation does not need to be very precise in general – we only need the precision when the real distance is within a narrow range. When it is outside that range, the approximation only needs to answer that it is out of range. Since we cannot distinguish between a vector of positions and its reflection, we find a vertex that is very close to an endpoint, and assume that that endpoint is 0, the left end of the segment. Then we use the distance approximations to build the relationship between every pair of vertices that are sufficiently far apart. In other words, for each sufficiently distant pair , we decide which of and is to the left. From these pairwise relationships, we recover the global order.
We define what we mean by a good approximation of the distance between two vertices.
Definition 2.
A distance function is refered to as a -approximation if for any pair of vertices and , satisfies:
-
•
If , .
-
•
If ,
-
•
If , .
We say is a good approximation if it is an -approximation with and . We present the algorithm that recovers the order given good approximations. We then present algorithms that produce good approximations for each of the probability functions.
Lemma 3.3.
There is an algorithm that recovers the order of the vertices if we are given an -approximate distance function with and with probability .
In Section 3.1, we describe such an algorithm. We follow this up with good approximation schemes for in Section 3.2, and in Section 3.3.
3.1 Order Recovery from Approximate Distances
In this section, we give an algorithm (ALGORITHM 1) to recover the order of vertices on the segment when we are given a -approximate distance function with and . The algorithm works as follows: for any triple of vertices , , and , if is in the middle, then the distance between and is larger than and . With a good distance approximation, we can detect which vertex is in the middle, in all triples of vertices that are not too far or too close. We store these ordered triples in a set (Lemma 3.4). For any vertex which never occurs in the middle of an ordered triple in , it must be close to one of the endpoints of the segment. Arbitrarily fixing the position of one such vertex as being near the left endpoint, we can ‘recursively orient’ each triple in (Lemma 3.5), which means that we can tell the order of any vertices that are not too close (Lemma 3.6). Finally, we use this information to give the full order (Lemma 3.7). Lemma 3.3 immediately follows from Lemma 3.7.
Lemma 3.4.
For any triple in , the location of is in the middle of the location of and . On the other hand, for any triple of vertices such that is in the middle of and , and , .
Proof.
For any three vertices , , such that and both in , we have and are both between and by the definition of approximation. If is in the middle, then , which means is at least since both of and are at least . If is not in the middle, then , which means . So the triple is in if and only if is in the middle. ∎
By Lemma 3.1 , for any vertex located between , there are two vertices and on its left and its right such that and are both between . This means that and are both in . So (as ), which implies vertices in are located in or . Furthermore, for any vertex pair with , there exists a vertex such that or . Without loss of generality, suppose . Then contains all the vertices such that no vertex on its left with .
Lemma 3.5.
The while loop of the algorithm always terminates. Moreover, for any pair of vertices and , if and only if is to the left and .
Proof.
We first prove that for any pair of vertices in , is to the left of , using induction on the order of the pairs added to . For the base case, only contains vertices with no vertex on their left with approximate distance at least . So for any pair added into before the while loop, is to the left. Assume inductively that this is true for all pairs added before the current iteration of the while loop. For any pair added into in the current iteration, there is a vertex such that and . By induction hypothesis, is on ’s left. So is between and , so is on ’s left by Lemma 3.4.
We prove that the while loop terminates, i.e., that all triples in eventually get deleted. Suppose for contradiction that, is the leftmost vertex to appear in any undeleted triple, and there is a triple that never gets deleted. (Note that whenever , ). If there exists a vertex to the left of with , then is in and will be deleted sometime, then , which means will be deleted. If there is no such vertex then , which also means , will be deleted in the first iteration. Thus contradicts that would never gets deleted.
Finally, we prove that any pair of vertices with will be added into . This is because by Lemma 3.1 , there exists a vertex such that or . Since such triple was deleted in the while loop, has been added into . ∎
Lemma 3.6.
For any pair of vertices and , the vertex is reachable from in if and only if and is to the left.
Proof.
If is reachable from , there is a path form to , and the location of any vertex on the path is to the left of the next vertex on the path. So is on ’s left. If , by Lemma 3.5, , otherwise the path has at least three vertices. By Lemma 3.5, any neighbouring vertex has distance at least , which means the distance between and is at least , so .
For any pair , with to the left and , if , then , which means is reachable from in . If , then the distance between them is at least . by Lemma 3.1, there exists a sequece of vertex such that for any , is to the left of , and the distance between them is between and , which means , in other words, by Lemma 3.5, , so is reachable form in . ∎
Lemma 3.7.
The output order of the algorithm satisfies that for any and that are separated by a distance of at least , appears prior to in the order if and only if is to the left of .
Proof.
If is to the left and the distance between and is at least , for any vertex on ’s right with , we have , which means and . For any vertex on ’s left with , , which means and . So . On the other hand, by Lemma 3.1 and the fact that , there exists a vertex with one of the following two properties:
-
•
is on ’s right and and .
-
•
is on ’s left and and .
In the first case, while , which means is reachable from but not . In the second case, while , which means is reachable from but is not reachable from . So is strictly larger than . ∎
3.2 Distance Approximation for Exponential Decay Function
In this section, we consider the case that . The probability of an edge between two vertices and , with locations and respectively, is . We first analyze the degree of each vertex and the number of common neighbors between each pair of vertices.
Lemma 3.8.
For any vertex located at position on the segment, if we uniformly sample a vertex on the segment, then the edge is present with probability . In other words, this is the expected probability of an edge from , where the expectation is over the choice of the other endpoint .
Proof.
The probability is the expectation of where is the location of which is uniformly sampled on the segment. So the probability is
∎
Lemma 3.9.
For any two vertices and located at and respectively with , if we uniformly sample a vertex on the segment, then is a common neighbor of and with probability .
Proof.
Let be the probability that is a common neighbor of and where is the location of , then
So the overall probability is
∎
By Lemma 3.9, the number of common neighbors of a pair of vertices “mostly” depends on the distance between these two vertices. We use the degree of these two vertices to eliminate the effect of the remaining terms. We first prove that we can check if two vertices are far away.
Lemma 3.10.
If , with probability , for any two vertices and , (a) if they have no common neighbor, then , and (b) if , then they have no common neighbor.
Proof.
If , then one of and is , without loss of generality, suppose is . Since , . By Lemma 3.9, the probability that a random sampled vertex be a common neighbor of and is at least . Since , the probability that and have no common neighbor is .
If , the probability that a random vertex be a common neighbor of them is at most . So with probaiblity , they have no common neighbor. ∎
We now describe how to approximate the distance between two vertices.
Lemma 3.11.
If and , then for any pair of vertices and , with probability , we can calculate , an approximation of such that:
-
•
If , .
-
•
If ,
-
•
If , .
Proof.
For any number , let and . We first prove that we can either approximate with additive error at most or directly output a which satisfies the condition.
We first check if and have common neighbors. If they have no common neighbor, then by Lemma 3.10, . So we can directly output . Otherwise we have .
By Lemma 3.9 and Proposition 3.2, we can approximate with additive error since . To eliminate the terms and , we use the degree of and . By Lemma 3.8 and Proposition 3.2, we can approximate and with additive error . On the other hand, . The last two terms are since . So we can approximate with additive error . We can thus approximate with additive error at most .
The proof is completed by the observation that is monotone decreasing when , and the derivative when . ∎
3.3 Distance Approximation for Inverse Linear Decaying Function
In this section, we deal with the case that and thus the probability of an edge existing between two vertex and with location and on the segment be . We first analyze the degree of each vertex and the number of common neighbors between each two vertices; proofs are deferred to the full version.
Lemma 3.12.
Suppose a vertex is located at , if we uniformly sample a vertex on the segment then an edge will be presented with probability
Proof.
The probability is
∎
Lemma 3.13.
Suppose two vertices and are located at and on the segment with and , if we uniformly sample a vertex on the segment, then is a common neighbor of and with probability
Proof.
The probability is
∎
We next show that it can be inferred if a vertex is close to one of the endpoints. If so, we can further approximate its location to within a multiplicative error. In the rest of this section, let .
Lemma 3.14.
If and , then with probability , for any vertex , we can output a number such that:
-
•
if , then , and
-
•
if , then .
where .
Proof.
Since . By Proposition 3.2 and Lemma 3.12, we can approximate within additive error with probability . Let be this value, we prove that satisfies the requirement.
. By Proposition 2.2, if and at most otherwise.
If , . So since .
If , So . ∎
Lemma 3.15.
Suppose and , with probability , for any two vertex and with distance , we can approximate by which satisfies:
-
•
if .
-
•
if .
-
•
if .
Proof.
For any number , , denote and . We first prove that we can either approximate with additive error at most or directly output a which satisifies the condition. By Lemma 3.13 and Proposition 3.2, we can approximate with additive error , Denote as this value.
Let and be the value given by Lemma 3.14. If and are both at least , then and are both at least far away from both endpoints. By the argument in the proof of Proposition 2.1, and are both at most . So . If one of and larger than and the other less than , then . So we can directly output . The only case remaining is when both of and at most .
In this case, and are both at most far away from one of the endpoint. If they are close to different endpoint, then , which menas and . Otherwise and thus . So we can check if and are close to the same endpoint. If not, and so we can directly output . Then we focus on the case that they are close to the same endpoint. Without loss of generality, suppose both of and are at most .
If and are both at most , then both of and are at most , which means and are both at most . Then we can output . If one of and is at least and the other is at most , then . So we can output . The only case remaining is when both of and are at least . In this case, and are both larger than . By Proposition 2.1, . So is an approximation of with additive error at most .
By this point, we either already output a which satisfies the condition or have an approximation of with additive error . To complete the proof we observe that the function is monotone decreasing when and that the derivative of is strictly less than when . ∎
4 Recovering the Position
In this section, we consider the problem of recovering the positions of the vertices on the segment. First, we prove the following simple result, which extends the results for recovering the order.
Theorem 3.
Suppose . For any function , if we can recover the order of the vertices, then we can also recover a position vector such that for any , with probability .
Proof.
Suppose the order output by the order recovery algorithm is , and their true positions are . We will prove that (i.e. we can just output the position as uniformly dispersed along the segment according to the order).
Suppose the real order is , and the real positions are . We first prove , and then prove that . The following arguments are based on the event that the run of the order recovery algorithm is successful.
For any , if , then for any , . By the definition of recovering the order, for any , occurs before in the order output by the algorithm, which contradicts the fact that appears at the position of the order output by the algorithm. So . For the same reason, we also have .
On the other hand, for any , let be the number of vertices sampled in segment . By the Chernoff bound, with probability , . By taking the union bound over the complementary events, all ’s are close to their expectation with probability . For any , suppose , then there are at most vertices sampled in the segment and at least vertices sampled in the segment , which implies . On the other hand, , so . ∎
By Theorem 3 and the results in Section 3, we can recover the position with vertices for both choices of . However, there is a huge gap compared to the number of samples necessary for recovering the order.
Sample complexity of identifying best position vector
In the remainder of this section, we consider the following “weaker” problem: the task is distinguishing two position vectors and where and with the guarantee that vertices in and have the same order. We focus on the exponential decay function and the case when the number of samples is between the gap of Theorem 1 and Theorem 3. We say that two position vectors and are -far if there exists a vertex such that . We prove that we cannot distinguish two positions which are far away when there are samples. This shows that we cannot recover the position of vertices with only samples even if the algorithm is given the order.
Theorem 4.
For any , if is sampled uniformly at random, then with probability , we can construct a position vector which has the same order as and is -far from such that, for any tester that determines whether a graph is generated from or , if we randomly select a postion vector from , and sample a graph according to , there is a constant probability that .
On the other hand, we prove that if , then we can distinguish any two position vectors which are far from each other when one vector is sampled uniformly, which means Theorem 4 is tight up to a factor.
Theorem 5.
For any , if is sampled uniformly at random, then with probability , for any position vector with the same vertex order as and -far from , suppose we randomly sample a graph according to , then with probability , .
4.1 Proof of Theorem 4
For any tester which decides whether a graph is generated from or , let (resp. ) be the probability that (resp. ) generates a graph such that (resp. ). By Le Cam’s method [12, 18], we have
where is the total variation distance between and . On the other hand, by Pinsker’s inequality,
where is the Kullback–Leibler divergence between and . Therefore, to prove that any tester cannot distinguish and , we only need to prove is bounded away from . By definition,
From this point, we use to simplify . Denote , and if and if . Again by definition,
Now we define the location vector that confuses the tester. Without loss of generality, suppose . Let be the position vector such that . It is easy to see that as long as is super constant, with probability , which means and are -far. To proof Theorem 4, we only need to prove .
Throughout this section, we let and as . The following lemma gives the upper bound on .
Lemma 4.1.
For any pair of vertices ,
Proof.
By definition of , with probability , and with probability , . So
by Proposition 2.3, . Together with Proposition 2.2,
Since , and , which means .
∎
Now we give an upper bound on .
Lemma 4.2.
If and is obtained by sampling each point uniformly, then with probability .
Proof.
Let the be the set of vertices where contains all the vertices inside the interval in . Let , be two vertices inside and where , then by Lemma 4.1 and the fact that the distance between and is at least and at most , . So
By Rearrangement inequality [19], for any , . So
By the choice of , each with probability by Chernoff bound, so , which means . ∎
4.2 Proof of Theorem 5
We define and the as in Section 4.1. To prove Theorem 5, we need to prove . The basic idea is to prove is large and use the concentration bound (Propostion 2.7) to prove is larger than the “concentration range”.
The main difficulty is that since the location vector is chosen adversarily, some ’s might be “ill-behaved” and thus their deviation is hard to control due to the choice of . To solve this problem, we construct as follows: If , then let if ; if , then let ; if . In any scenerio, is always smaller than . (This is due to Proposition 2.2.) So . Moreover, let be the sum of excluding those pairs where and . For such pairs, the probability that is and in that event, . Since there are at most pairs of such , with probability , all of these ’s are greater than . So with probability , . So it is sufficient to prove . We call the unexcluded pairs as the pair contributing to . Throughout this section, let and .
We first prove a simple lemma about the distance between each pair of vertices in .
Lemma 4.3.
If , with probability , for any pair , .
Proof.
For any pair , the probability that is at most . Since there are at most pairs, so with probability there is no such pair. ∎
Hereafter, we assume for all pair of . We establish the following property of .
Lemma 4.4.
For any pair that contributes to , is a sub-exponential random variable with parameter where and .
Proof.
By Proposition 2.6, it is sufficient to prove that for any ,
where is a random varibale independent and identical to . We prove the lemma respectively in the case of and .
Case 1: . Denote . with probability and with probability . So
So .
On the other hand, with probability and otherwise. By the condition that contributes to , ; by Proposition 2.3, . So for any . Which means
which means
Case 2: . Denote . with probability and with probability . Since , , which means . So for any . So
On the other hand, , so we just need to prove
Case 2.1: If ,
On the other hand, , so .
Case 2.2: If and , . Let , by Proposition 2.4, , so , which means where since . So . On the other hand, . So .
Case 2.3: If , let and . Since , since . On the other hand, since , by Proposition 2.5, so , and (the last inequality is due to for any ). So
which means
∎
Next, we analyze the expectation of . The following lemma is a byproduct of the proof of Lemma 4.4.
Lemma 4.5.
For any , , if . Otherwise .
We next show that satisfies the triangle inequality.
Lemma 4.6.
For any , and , .
Proof.
Since and has the same vertex order, . ∎
We prove a lower bound on the expectation of .
Lemma 4.7.
For any , if is sampled uniformly, then with probability , for any such that there is a pair with , .
Proof.
By Lemma 4.5, . It is sufficient to prove that sum of some contributed to is larger than . We first prove that if there is a pair and satisfies and , then . By Chernoff bound, with probability there are at least vertices in each segment of length . So there are at least vertices which is at most away from both and . Suppose is such a vertex, then either or is at least by Lemma 4.6, which means either or is at least by lemma 4.5. So .
For any integer , let be the set of vertex in segment . Let and . Without loss of generality, suppose . Then for any vertex in (resp. ), if (resp. ) is at least , which means . Otherwise, we have and for any and , .
For any , let be an arbitrary vertex in . We prove that . For any , since and are in and respectively, , which means .
Let and for any , let be arbitrary vertices in . Then
∎
5 Empirical Results
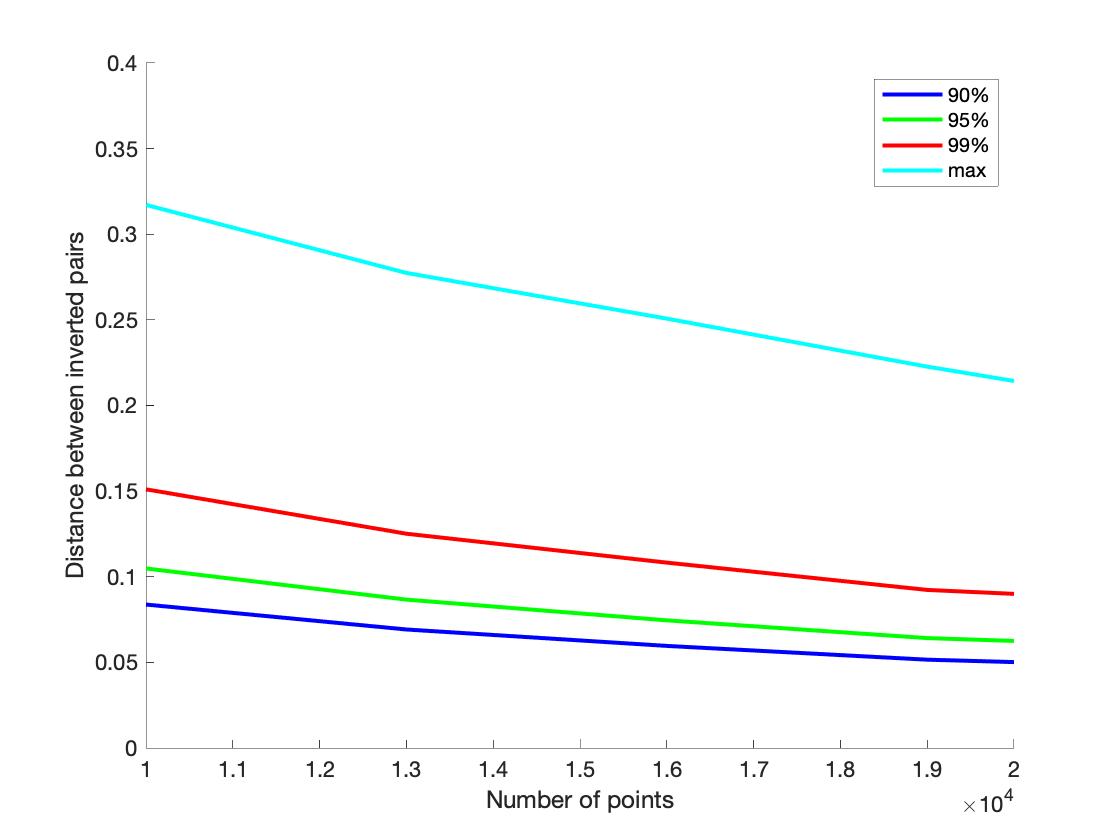
In this section, we present results on simulating our algorithms on synthetically generated test sets. We created 5 test sets where each set contains independently generated graphs. In each test set, the points are generated uniformly at random on the line with length . The number of points in the test sets range from to . We focus on the probability function for the probability of generating edges in each test set.
We run our algorithm in Section 3 to recover the order of points as well as output the position by the algorithm given in Theorem 3. We then analyze the observed error in using our algorithms for recovering the order and recovering the position.
For the task of recovering the order, we collect all pairs of vertices such that our algorithm outputs them in inverted order. We calculate the distance between each inverted pair, and consider the 90th percentile, 95th percentile, 99th percentile and the maximum distance values among the inverted pairs. For each of these values, we use the average among the 30 tests in each test set. The results are illustrated in Figure 1(a). As indicated by our theoretical analysis, as the sample size increases, distance between inverted pairs decreases. For instance, the green line shows that once the sample size exceeds 10000, more than 95% of inversions occur among pairs that are less than 0.1 distance apart (i.e. very close).
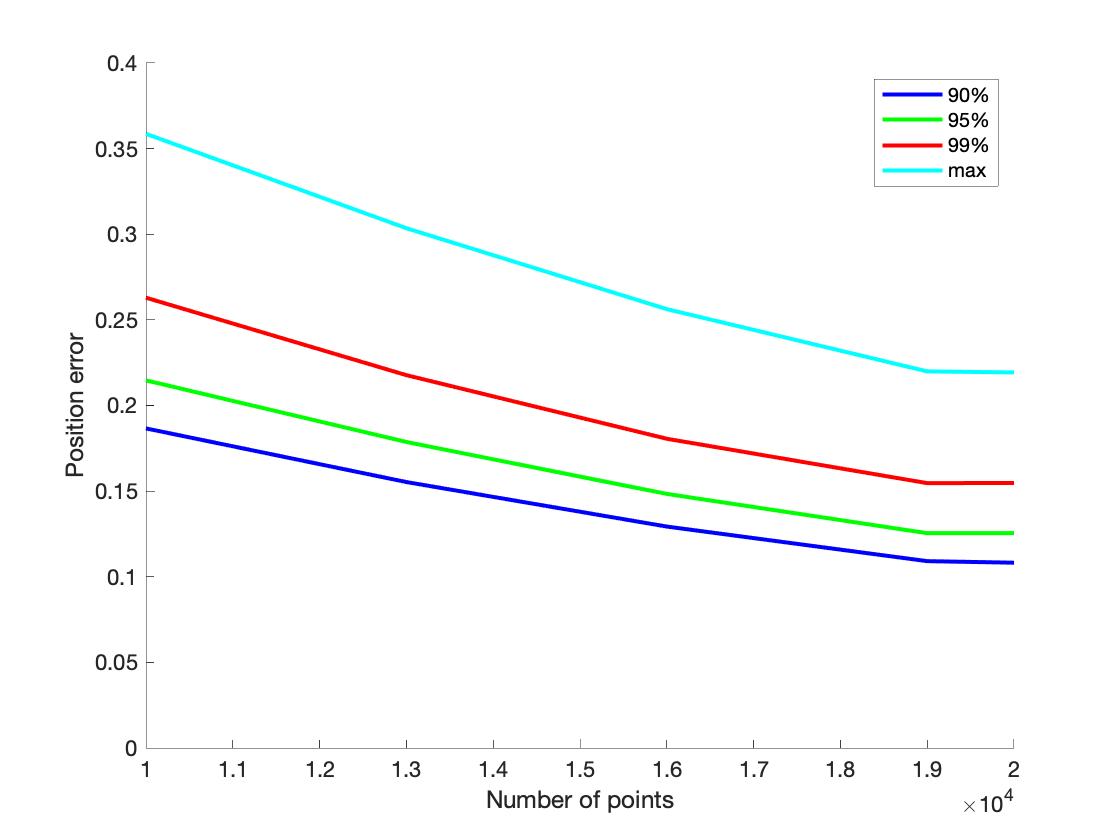
For the task of recovering the positions, we calculate the distance between the position output by our algorithm and the actual position for each point. Again, we look the 90th percentile, 95th percentile, 99th percentile and the maximum, and use the average among the 30 tests in each test set. The results are illustrated in Figure 1(b).
6 Conclusions
We developed a framework for recovery that uses the following high-level approach: 1) use the graph to reconstruct approximate degrees and common neighborhood sizes for pairs of vertices; 2) use this information to approximately identify the neighborhoods of each vertex, and spatial relationships between vertices in each neighborhood; and finally, 3) use the local knowledge to establish global structure - order relations or positions. Using this framework, we obtained essentially tight bounds on the number of samples required for recovering the (approximate) order of points on a line segment under both exponential decay and linear decay models. It would be interesting to close the gap that remains between the upper and lower bounds for recovering the location of the points. We also empirically analyzed recovery accuracy of our algorithms on synthetic data sets.
This paper can be seen as taking the first step in what should be a promising line of research, that will include generalizing our results to other metric spaces as well as to other edge probability functions. As we move from one-dimensional space to higher dimensional spaces, recovery becomes distinctly harder (as one might expect) but our preliminary investigation suggests that the framework described in this work continues to be of value in understanding recovery in for . Beyond this, a particularly intriguing problem is to recover missing attributes. If we are given a graph as well as some partial information about the attributes of vertices, can we learn both the edge probability function and values of the missing attributes? Such problems are likely to be of interest in social science research, as well as in understanding diverse networks such as biological and economic networks.
References
- [1] E. Abbe. Community detection and stochastic block models: Recent developments. Journal of Machine Learning Research, 18(177):1–86, 2018.
- [2] M. Aizenman and C. M. Newman. Discontinuity of the percolation density in one dimensional percolation models. Communications in Mathematical Physics, 107(4):611–647, 1986.
- [3] S. Bernstein. On a modification of chebyshev’s inequality and of the error formula of laplace. Ann. Sci. Inst. Sav. Ukraine, Sect. Math, 1(4):38–49, 1924.
- [4] D. Coppersmith, D. Gamarnik, and M. Sviridenko. The diameter of a long range percolation graph. In Proceedings of the thirteenth annual ACM-SIAM symposium on Discrete algorithms, pages 329–337. Society for Industrial and Applied Mathematics, 2002.
- [5] Y. Deshpande, S. Sen, A. Montanari, and E. Mossel. Contextual stochastic block models. In Advances in Neural Information Processing Systems, pages 8581–8593, 2018.
- [6] J. C. Fisher. Social space diffusion: Applications of a latent space model to diffusion with uncertain ties. Sociological Methodology, page 0081175018820075, 2019.
- [7] M. S. Handcock, A. E. Raftery, and J. M. Tantrum. Model-based clustering for social networks. Journal of the Royal Statistical Society: Series A (Statistics in Society), 170(2):301–354, 2007.
- [8] P. D. Hoff, A. E. Raftery, and M. S. Handcock. Latent space approaches to social network analysis. Journal of the american Statistical association, 97(460):1090–1098, 2002.
- [9] P. D. Hoff and M. D. Ward. Modeling dependencies in international relations networks. Political Analysis, 12(2):160–175, 2004.
- [10] C. Ke and J. Honorio. Information-theoretic limits for community detection in network models. In Advances in Neural Information Processing Systems, pages 8324–8333, 2018.
- [11] C. Ke and J. Honorio. Exact recovery in the latent space model. arXiv preprint arXiv:1902.03099, 2019.
- [12] L. Le Cam. Asymptotic methods in statistical decision theory. Springer Science & Business Media, 2012.
- [13] C. M. Newman and L. S. Schulman. One dimensional percolation models: The existence of a transition for . Communications in Mathematical Physics, 104(4):547–571, 1986.
- [14] T. L. J. Ng, T. B. Murphy, T. Westling, T. H. McCormick, and B. K. Fosdick. Modeling the social media relationships of irish politicians using a generalized latent space stochastic blockmodel. arXiv preprint arXiv:1807.06063, 2018.
- [15] A. E. Raftery, X. Niu, P. D. Hoff, and K. Y. Yeung. Fast inference for the latent space network model using a case-control approximate likelihood. Journal of Computational and Graphical Statistics, 21(4):901–919, 2012.
- [16] P. Sarkar, D. Chakrabarti, and A. W. Moore. Theoretical justification of popular link prediction heuristics. In IJCAI 2011, Proceedings of the 22nd International Joint Conference on Artificial Intelligence, Barcelona, Catalonia, Spain, July 16-22, 2011, pages 2722–2727, 2011.
- [17] L. S. Schulman. Long range percolation in one dimension. Journal of Physics A: Mathematical and General, 16(17):L639, 1983.
- [18] B. Yu. Assouad, Fano, and Le Cam. In Festschrift for Lucien Le Cam, pages 423–435. Springer, 1997.
- [19] A. Zygmund et al. HG Hardy, JE Littlewood and G. Pólya, Inequalities. Bulletin of the American Mathematical Society, 59(4):411–412, 1953.