The ALMA Spectroscopic Survey in the Hubble Ultra Deep Field: The nature of the faintest dusty star-forming galaxies
Abstract
We present a characterization of the physical properties of a sample of 35 securely detected, dusty galaxies in the deep ALMA 1.2 mm image obtained as part of the ALMA Spectroscopic Survey in the Hubble Ultra Deep Field (ASPECS) Large Program. This sample is complemented by 26 additional sources identified via an optical/infrared source positional prior. Using their well-characterized spectral energy distributions, we derive median stellar masses and star formation rates (SFR) of and 30 yr-1, respectively, and interquartile ranges of and yr-1. We derive a median spectroscopic redshift of 1.8 with an interquartile range , significantly lower than submillimeter galaxies detected in shallower, wide-field surveys. We find that 59%13%, 6%4%, and 34%9% of our sources are within, above, and below dex from the SFRstellar-mass relation or main sequence (MS), respectively. The ASPECS galaxies closely follow the SFRmolecular gas mass relation and other previously established scaling relations, confirming a factor of five increase of the gas-to-stellar-mass ratio from to and a mild evolution of the gas depletion timescales with a typical value of 0.7 Gyr at . ASPECS galaxies located significantly below the MS, a poorly exploited parameter space, have low gas-to-stellar-mass ratios of and long depletion timescales Gyr. Galaxies along the MS dominate the cosmic density of molecular gas at all redshifts. Systems above the MS have an increasing contribution to the total gas reservoirs from to , while the opposite is found for galaxies below the MS.
1 Introduction
A major focus of galaxy evolution studies in the past few decades has been to understand the physical mechanisms that drive the growth of galaxies, starting from cold atomic hydrogen through the cold interstellar medium (ISM; e.g. where the bulk of dense molecular hydrogen, H2, resides) to star formation. A critical measurement has been the determination of the evolution of the cosmic star formation rate (SFR) density, establishing an important framework to understand the key epochs in which the different physical mechanisms are taking place (e.g., Madau & Dickinson, 2014). Due to the direct link between the reservoirs of molecular gas in the universe and star formation activity, understanding this cosmic evolution of galaxies requires measurements of the cold ISM through cold dust and molecular gas observations (e.g., Carilli & Walter, 2013).
To study these processes, several approaches have been developed to select a variety of galaxy populations in which signatures of the ISM content can be observed.
Large (sub)millimeter continuum surveys with bolometer cameras on single-dish telescopes have been conducted over the past two decades, covering significant contiguous areas of the sky, ranging from a few tens of arcmin2 to thousands of deg2 (e.g., Barger et al., 1998; Hughes et al., 1998; Bertoldi et al., 2000; Eales et al., 2000; Cowie et al., 2002; Scott et al., 2002; Coppin et al., 2006; Bertoldi et al., 2007; Greve et al., 2008; Scott et al., 2008; Weiß et al., 2009; Austermann et al., 2010; Vieira et al., 2010; Negrello et al., 2010; Aretxaga et al., 2011; Hatsukade et al., 2011; Scott et al., 2012; Mocanu et al., 2013; Geach et al., 2017; Wang et al., 2017; Simpson et al., 2019). By construction, these surveys tend to detect the redshifted far-IR emission from galaxies at and thus trace the dust reservoirs heated by ultraviolet (UV) radiation from star formation or active galactic nucleus (AGN) activity, hence preferentially selecting galaxies with high SFRs and/or substantial dust (and molecular gas) reservoirs (e.g., Casey et al., 2014). These efforts yielded the discovery of a population of luminous dusty star-forming galaxies (DSFGs) at high redshift that were not accounted for in previous optical cosmological surveys. These galaxies, commonly called submillimeter galaxies (SMGs), have SFRs yr-1 and assembled a significant fraction of their stellar content with (e.g., Simpson et al., 2014; Swinbank et al., 2014; da Cunha et al., 2015; Chang et al., 2018; Zavala et al., 2018; Dudzevičiūtė et al., 2020).
An important step to understanding the physical mechanisms of galaxy growth has been the determination that the bulk of star-forming galaxies, typically selected through their optical colors, form a broad correlation or ‘sequence’ between their stellar masses and SFRs, representing what has been called the “main-sequence” (MS) of star formation (e.g., Brinchmann et al., 2004; Daddi et al., 2007; Elbaz et al., 2007, 2011; Noeske et al., 2007; Peng et al., 2010; Rodighiero et al., 2010; Whitaker et al., 2012, 2014; Schreiber et al., 2015; Speagle et al., 2014). Galaxies below this sequence are usually called ‘passive’ galaxies, while those above it are called “starbursts”. Follow-up observations of dust continuum and molecular gas, through 12CO line emission, in optically selected MS galaxies across the stellar mass versus SFR diagram yielded a revolution in the study of galaxy evolution: these star-forming MS galaxies were found to host large amounts of molecular gas, yielding bright detections of CO line emission (e.g., Daddi et al., 2010b). This targeted approach enabled the study of galaxies with faint dust continuum emission that blind bolometer surveys were unable to explore. Most significantly, these studies allowed for the determination of scaling relations between various fundamental parameters, including their stellar masses, specific SFRs, molecular gas depletion timescales, and molecular gas fractions, revealing for some of these parameters clear signs of evolution with redshift (e.g., Daddi et al., 2010a; Tacconi et al., 2010, 2013, 2018; Sargent et al., 2014; Genzel et al., 2010, 2015; Leroy et al., 2013; Saintonge et al., 2011, 2013, 2016; Santini et al., 2014; Papovich et al., 2016; Schinnerer et al., 2016; Scoville et al., 2016, 2017; Wiklind et al., 2019; Liu et al., 2019; Freundlich et al., 2019). These observations have established a basis for an observational and theoretical framework of galaxy evolution.
Despite the important progress made, dust continuum surveys have only been able to detect directly the (sub)millimeter brightest galaxies, missing the general population of (dusty) star-forming galaxies through cosmic time. Targeted CO/dust observations across the stellar mass vs. SFR diagram, on the other hand, have focused on galaxies preselected through their optical colors, potentially missing a significant fraction of the galaxy population (e.g., Aravena et al., 2019).
The advent of the Atacama Large Millimeter/submillimeter Array (ALMA) has opened a new window for studying cold dust and molecular gas in the general population of star-forming galaxies, enabling us for the first time to produce sensitive blank-field dust continuum and CO line emission searches over significant contiguous areas of the sky ( arcmin2). These efforts have mostly been done in well-studied cosmological deep fields in order to take advantage of the wealth of multiwavelength data (e.g., Aravena et al., 2016b; Franco et al., 2018; González-López et al., 2017; Dunlop et al., 2017; Hatsukade et al., 2018; Pavesi et al., 2018; Riechers et al., 2019), as well as fields known to be located in galaxy protoclusters at high redshift (e.g., Umehata et al., 2018).
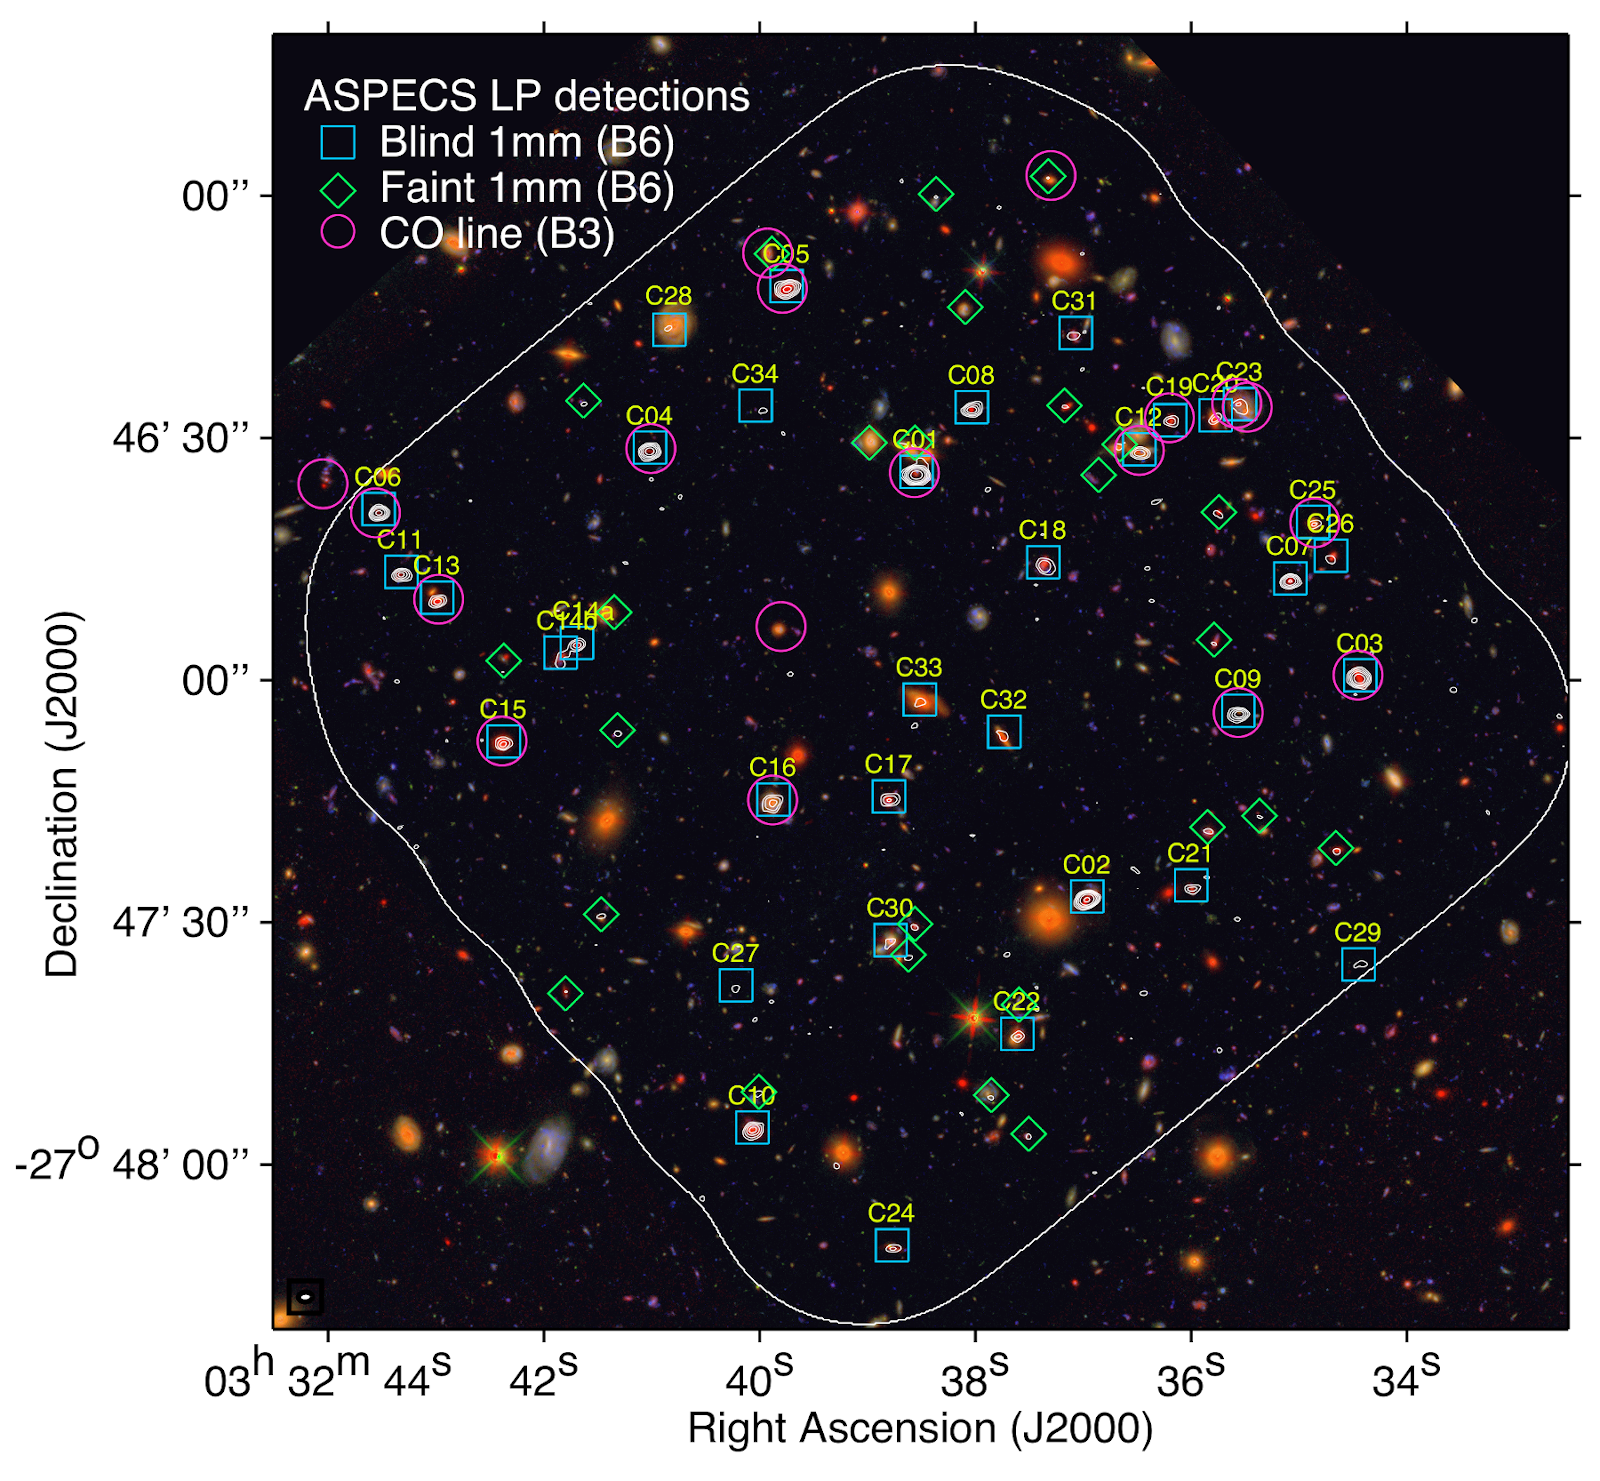
The ALMA Spectroscopic Survey (ASPECS) in the Hubble Ultra Deep Field (HUDF) is a simultaneous blank-field CO line and dust continuum survey of distant galaxies performed with ALMA. In a first stage, the ASPECS pilot program targeted a region of 1 arcmin2 in the HUDF, spectroscopically scanning the full ALMA bands 3 (3 mm) and 6 (1 mm) to search for CO line emission from galaxies at , [CII] line emission at and dust continuum (e.g., Walter et al., 2016; Aravena et al., 2016b, c; Decarli et al., 2016a, b; Carilli et al., 2016; Bouwens et al., 2016). The ASPECS large program (LP) builds upon the observational strategy and results presented by the ASPECS pilot observations, extending the covered area of the HUDF to 4.6 arcmin2, roughly comprising the Hubble eXtremely Deep Field (XDF), the region of the HUDF with the deepest near-IR (NIR) observations (Illingworth et al., 2013; Koekemoer et al., 2013). The first results of the ASPECS LP based on the ALMA band 3 observations are presented in a series of recent papers (González-López et al., 2019; Decarli et al., 2019; Aravena et al., 2019; Boogaard et al., 2019; Popping et al., 2019; Uzgil et al., 2019; Inami et al., 2020).
In this paper, we present the physical properties of the faint dusty sources detected in the sensitive ASPECS 1.2 mm continuum map using the wealth of ancillary multiwavelength data available in the HUDF. In Section 2, we briefly summarize the ASPECS observations and ancillary data used. In Section 3, we present our main results and describe the sample of millimeter sources, their multi-wavelength counterparts, redshifts, and spectral energy distributions (SEDs). In Section 4, we study the location of our sources with respect to the main sequence of star formation and compare the properties of the dust continuum sources with galaxies in the field and previous ISM studies. Finally, in Section 5, we summarize the conclusions of this work. Throughout this paper, we assume a standard CDM cosmology with km s-1 Mpc-1, and . All magnitudes are presented in the AB system.
| ID | R.A. | Decl. | S/N | CO ID | OIR? | Reference | |||
|---|---|---|---|---|---|---|---|---|---|
| (J2000) | (J2000) | (Jy) | (Jy) | (Y/N) | |||||
| (1) | (2) | (3) | (4) | (5) | (6) | (7) | (8) | (9) | (10) |
| C01 | 03:32:38.54 | :46:34.6 | 67.6 | 1.0 | 1 | Y | CM | ||
| C02 | 03:32:36.96 | :47:27.2 | 44.1 | 1.0 | Y | 3D | |||
| C03 | 03:32:34.43 | :46:59.8 | 30.7 | 1.0 | 4 | Y | CM | ||
| C04 | 03:32:41.02 | :46:31.6 | 26.8 | 1.0 | 3 | Y | CO | ||
| C05 | 03:32:39.75 | :46:11.6 | 23.2 | 1.0 | 5 | Y | CM | ||
| C06 | 03:32:43.53 | :46:39.2 | 22.6 | 1.0 | 7 | Y | CO | ||
| C07 | 03:32:35.08 | :46:47.8 | 20.1 | 1.0 | Y | CO | |||
| C08 | 03:32:38.03 | :46:26.6 | 16.2 | 1.0 | Y | M | |||
| C09 | 03:32:35.56 | :47:04.2 | 15.9 | 1.0 | 13 | Y | CO | ||
| C10 | 03:32:40.07 | :47:55.8 | 13.8 | 1.0 | Y | M | |||
| C11 | 03:32:43.32 | :46:47.0 | 13.6 | 1.0 | Y | 3D | |||
| C12 | 03:32:36.48 | :46:31.8 | 10.7 | 1.0 | 15 | Y | CM | ||
| C13 | 03:32:42.99 | :46:50.2 | 9.7 | 1.0 | 10 | Y | CM | ||
| C14a | 03:32:41.69 | :46:55.8 | 9.4 | 1.0 | Y | CO | |||
| C14b | 03:32:41.85 | :46:57.0 | 9.4 | 1.0 | Y | CM | |||
| C15 | 03:32:42.37 | :47:08.0 | 8.9 | 1.0 | 2 | Y | CM | ||
| C16 | 03:32:39.87 | :47:15.2 | 8.8 | 1.0 | 6 | Y | CM | ||
| C17 | 03:32:38.80 | :47:14.8 | 8.1 | 1.0 | Y | M | |||
| C18 | 03:32:37.37 | :46:45.8 | 7.2 | 1.0 | Y | M | |||
| C19 | 03:32:36.19 | :46:28.0 | 6.8 | 1.0 | 12 | Y | CM | ||
| C20 | 03:32:35.77 | :46:27.6 | 6.0 | 1.0 | Y | M | |||
| C21 | 03:32:36.00 | :47:25.8 | 5.5 | 1.0 | Y | 3D | |||
| C22 | 03:32:37.61 | :47:44.2 | 5.5 | 1.0 | Y | M | |||
| C23 | 03:32:35.55 | :46:26.2 | 5.4 | 1.0 | 8 | Y | CM | ||
| C24 | 03:32:38.77 | :48:10.4 | 5.4 | 1.0 | Y | 3D | |||
| C25 | 03:32:34.87 | :46:40.8 | 5.4 | 1.0 | 14 | Y | CM | ||
| C26 | 03:32:34.70 | :46:45.0 | 4.3 | 0.5 | Y | M | |||
| C27 | 03:32:40.22 | :47:38.2 | 4.1 | 0.8 | N | ||||
| C28 | 03:32:40.84 | :46:16.8 | 3.9 | 0.9 | Y | M | |||
| C29 | 03:32:34.45 | :47:35.6 | 3.5 | 0.8 | N | ||||
| C30 | 03:32:38.79 | :47:32.6 | 3.5 | 0.8 | Y | M | |||
| C31 | 03:32:37.07 | :46:17.4 | 3.5 | 0.8 | Y | M | |||
| C32 | 03:32:37.73 | :47:06.8 | 3.5 | 0.8 | Y | M | |||
| C33 | 03:32:38.51 | :47:02.8 | 3.3 | 0.6 | Y | M | |||
| C34 | 03:32:40.04 | :46:26.4 | 3.3 | 0.6 | N |
2 Observations
2.1 The ASPECS LP
The ASPECS 1.2 mm continuum map yields an unprecedented rms level of Jy beam-1, being the most sensitive millimeter survey obtained today over a contiguous area of arcmin2 (González-López et al., 2020). The depth of these observations yielded the detection of 35 statistically significant sources plus 26 prior-based lower-significance sources (see below) and allowed for the discovery of a flattening of the 1 mm number counts at fluxes Jy (González-López et al., 2020; Popping et al., 2020). These results reflect that most of the extragalactic background light (EBL) at this wavelength in the HUDF is resolved by these observations (González-López et al., 2020), being a direct consequence of the shape and evolution of the 1 mm luminosity function (Popping et al., 2020). While the area covered by the ASPECS LP program is relatively modest, its depth allows us to reach well beyond the knee of the luminosity function at 1.1 mm and thus access most of the dust content available in the HUDF galaxies.
2.2 ALMA observations
The ASPECS LP survey setup and data reduction steps are described in González-López et al. (2020), Walter et al. (2016) and Aravena et al. (2016b). Here we repeat the most relevant information for the present study.
ALMA band 6 observations were obtained during Cycles 4 and 5 under excellent to good weather conditions (PWV). Observations were performed in an 85-point mosaic, covering roughly the same region comprised by the ALMA band 3 mosaic of the XDF (see González-López et al., 2020). Individual pointings overlap each other by about half the ALMA primary beam (PB) at half-power beamwidth (HPBW), i.e., close to Nyquist sampling. Band 6 was scanned using eight frequency tunings, covering 212.0-272.0 GHz with no overlap or gaps between individual spectral windows. The ALMA PB in individual pointings ranges between and for this frequency range.
The observations were performed using the C43-1 and C43-2 arrays, leading to an angular resolution of at the center of the band 6 scan (242 GHz). Calibration was performed via standard observatory procedures with passband and phase calibration determined from nearby quasars and should be accurate within . Calibration and imaging were done using the Common Astronomy Software Application package (CASA) versions v5.1.1 and v5.4.0-70, respectively. To obtain continuum maps, we collapsed along the frequency axis in the uv-plane and inverted the visibilities using the CASA task TCLEAN using natural weighting and mosaic mode. This yielded an image reaching down to a noise level of 9.3Jy beam-1. A second version of the 1.2 mm map was obtained by tapering the visibilities in order to gain sensitivity for extended sources that were marginally detected in the naturally weighted image. This yielded an image with a resolution of with a noise level of 11.3Jy beam-1.
2.3 Ancillary data
Our ALMA observations cover roughly the same region as the Hubble XDF. Thus, the ASPECS LP field benefits from the deepest observations obtained with the Hubble Space Telescope (HST) Advanced Camera for Surveys (ACS) and Wide Field Camera 3 (WFC3) through the HUDF09, HUDF12, and Cosmic Assembly Near-infrared Deep Extragalactic Legacy Survey (CANDELS) programs, as well as public photometric and spectroscopic catalogs (Coe et al., 2006; Xu et al., 2007; Rhoads et al., 2009; McLure et al., 2013; Schenker et al., 2013; Bouwens et al., 2014; Skelton et al., 2014; Momcheva et al., 2016; Morris et al., 2015; Inami et al., 2017). As in other ASPECS studies, we make use of this optical and infrared coverage of the XDF, including the photometric and spectroscopic redshift information available from Skelton et al. (2014). The area covered by the ASPECS LP footprint was observed by the MUSE Hubble Ultra Deep Survey (Bacon et al., 2017), representing the main optical spectroscopic sample in this area (Inami et al., 2017). The Multi-Unit Spectroscopic Explorer (MUSE) at the ESO Very Large Telescope provides integral field spectroscopy in the wavelength range Åof a region in the HUDF and a deeper region that mostly overlaps with the ASPECS field. The MUSE spectroscopic survey provides spectroscopic redshifts for optically faint galaxies at magnitudes (and down to mag for fainter emission-line galaxies), and thus very complimentary to our ASPECS survey. MUSE covers key spectral lines, including H 6563, [OIII] 4959, 5007 and [OII] 3726, 3729 at ; [OII] 3726, 3729 at , a number of absorption features at , and Lyman- at (e.g. Boogaard et al., 2019). In addition to the HST and MUSE coverage, a wealth of optical and infrared coverage from space and ground-based telescopes is available in this field. This includes Spitzer Infrared Array Camera (IRAC) and Multiband Imaging Photometer (MIPS) imaging, as well as by the Herschel PACS and SPIRE photometry (Elbaz et al., 2011). From this, we created a master photometric and spectroscopic catalog of the XDF region as detailed in Decarli et al. (2019), which includes bands for galaxies, 475 of which have spectroscopic redshifts.
3 Results
3.1 Main sample
Details about the 1mm continuum source extraction, fidelity, and completeness analysis, as well as source catalog are described in González-López et al. (2020). Here, we provide a brief summary of these procedures.
Source extraction was performed simultaneously in the natural and tapered weighted images, using the LineSeeker code by searching for all pixels with signal-to-noise ratio (S/N) , and grouping them into single sources using the DBSCAN algorithm. The noise level was computed from the RMS value in all pixels excluding those with S/N (for details see González-López et al., 2019, 2020).
The fidelity for each of the extracted sources was computed based on the number of positive () and negative () detections at a given S/N value, with . For reference, a fidelity of 50% is achieved at S/N. A similar procedure on the tapered image yields a 50% fidelity at S/N.
This extraction yielded a sample of 34 sources, one of which was split into two separate sources based on visual inspection (González-López et al., 2020), leading to a final high-fidelity sample of 35 sources with fidelities . Only one additional source not significantly detected in the natural weighted image was found in the tapered one, C28, which is found to be associated with a large spiral galaxy at (see González-López et al., 2020). Table 1 lists this main sample, and these sources are highlighted in Fig. 1.
3.2 Multi-wavelength counterparts
3.2.1 Optical
We searched for matches between the 1.2 mm continuum detections and the HST optical sources in the field, using the catalog from Skelton et al. (2014). We identified these optical counterparts within a radius from the 1.2 mm position (for details see González-López et al., 2020) with an additional requirement that the probability of chance association , is less than 5%. Here, is the number density of optical sources (with ) in the neighborhood, and is the distance between the millimeter and the optical source. Based on this, we expect one to two sources to be a spurious association. The radius is well matched to the 1.2 mm map beam size and the typical size of optical sources in the field (Aravena et al., 2016b). The astrometry of the ALMA and HST images, when corrected for known distortions (Dunlop et al., 2017), is accurate to within thus not representing a major source of possible offsets. While offsets between the optical and (sub)millimeter components of are not unusual for bright DSFGs (e.g., Hodge et al., 2012), this is typically not the case for for fainter dusty galaxies or “typical” galaxies as in the sample studied here (e.g., Daddi et al., 2010b; Franco et al., 2020).
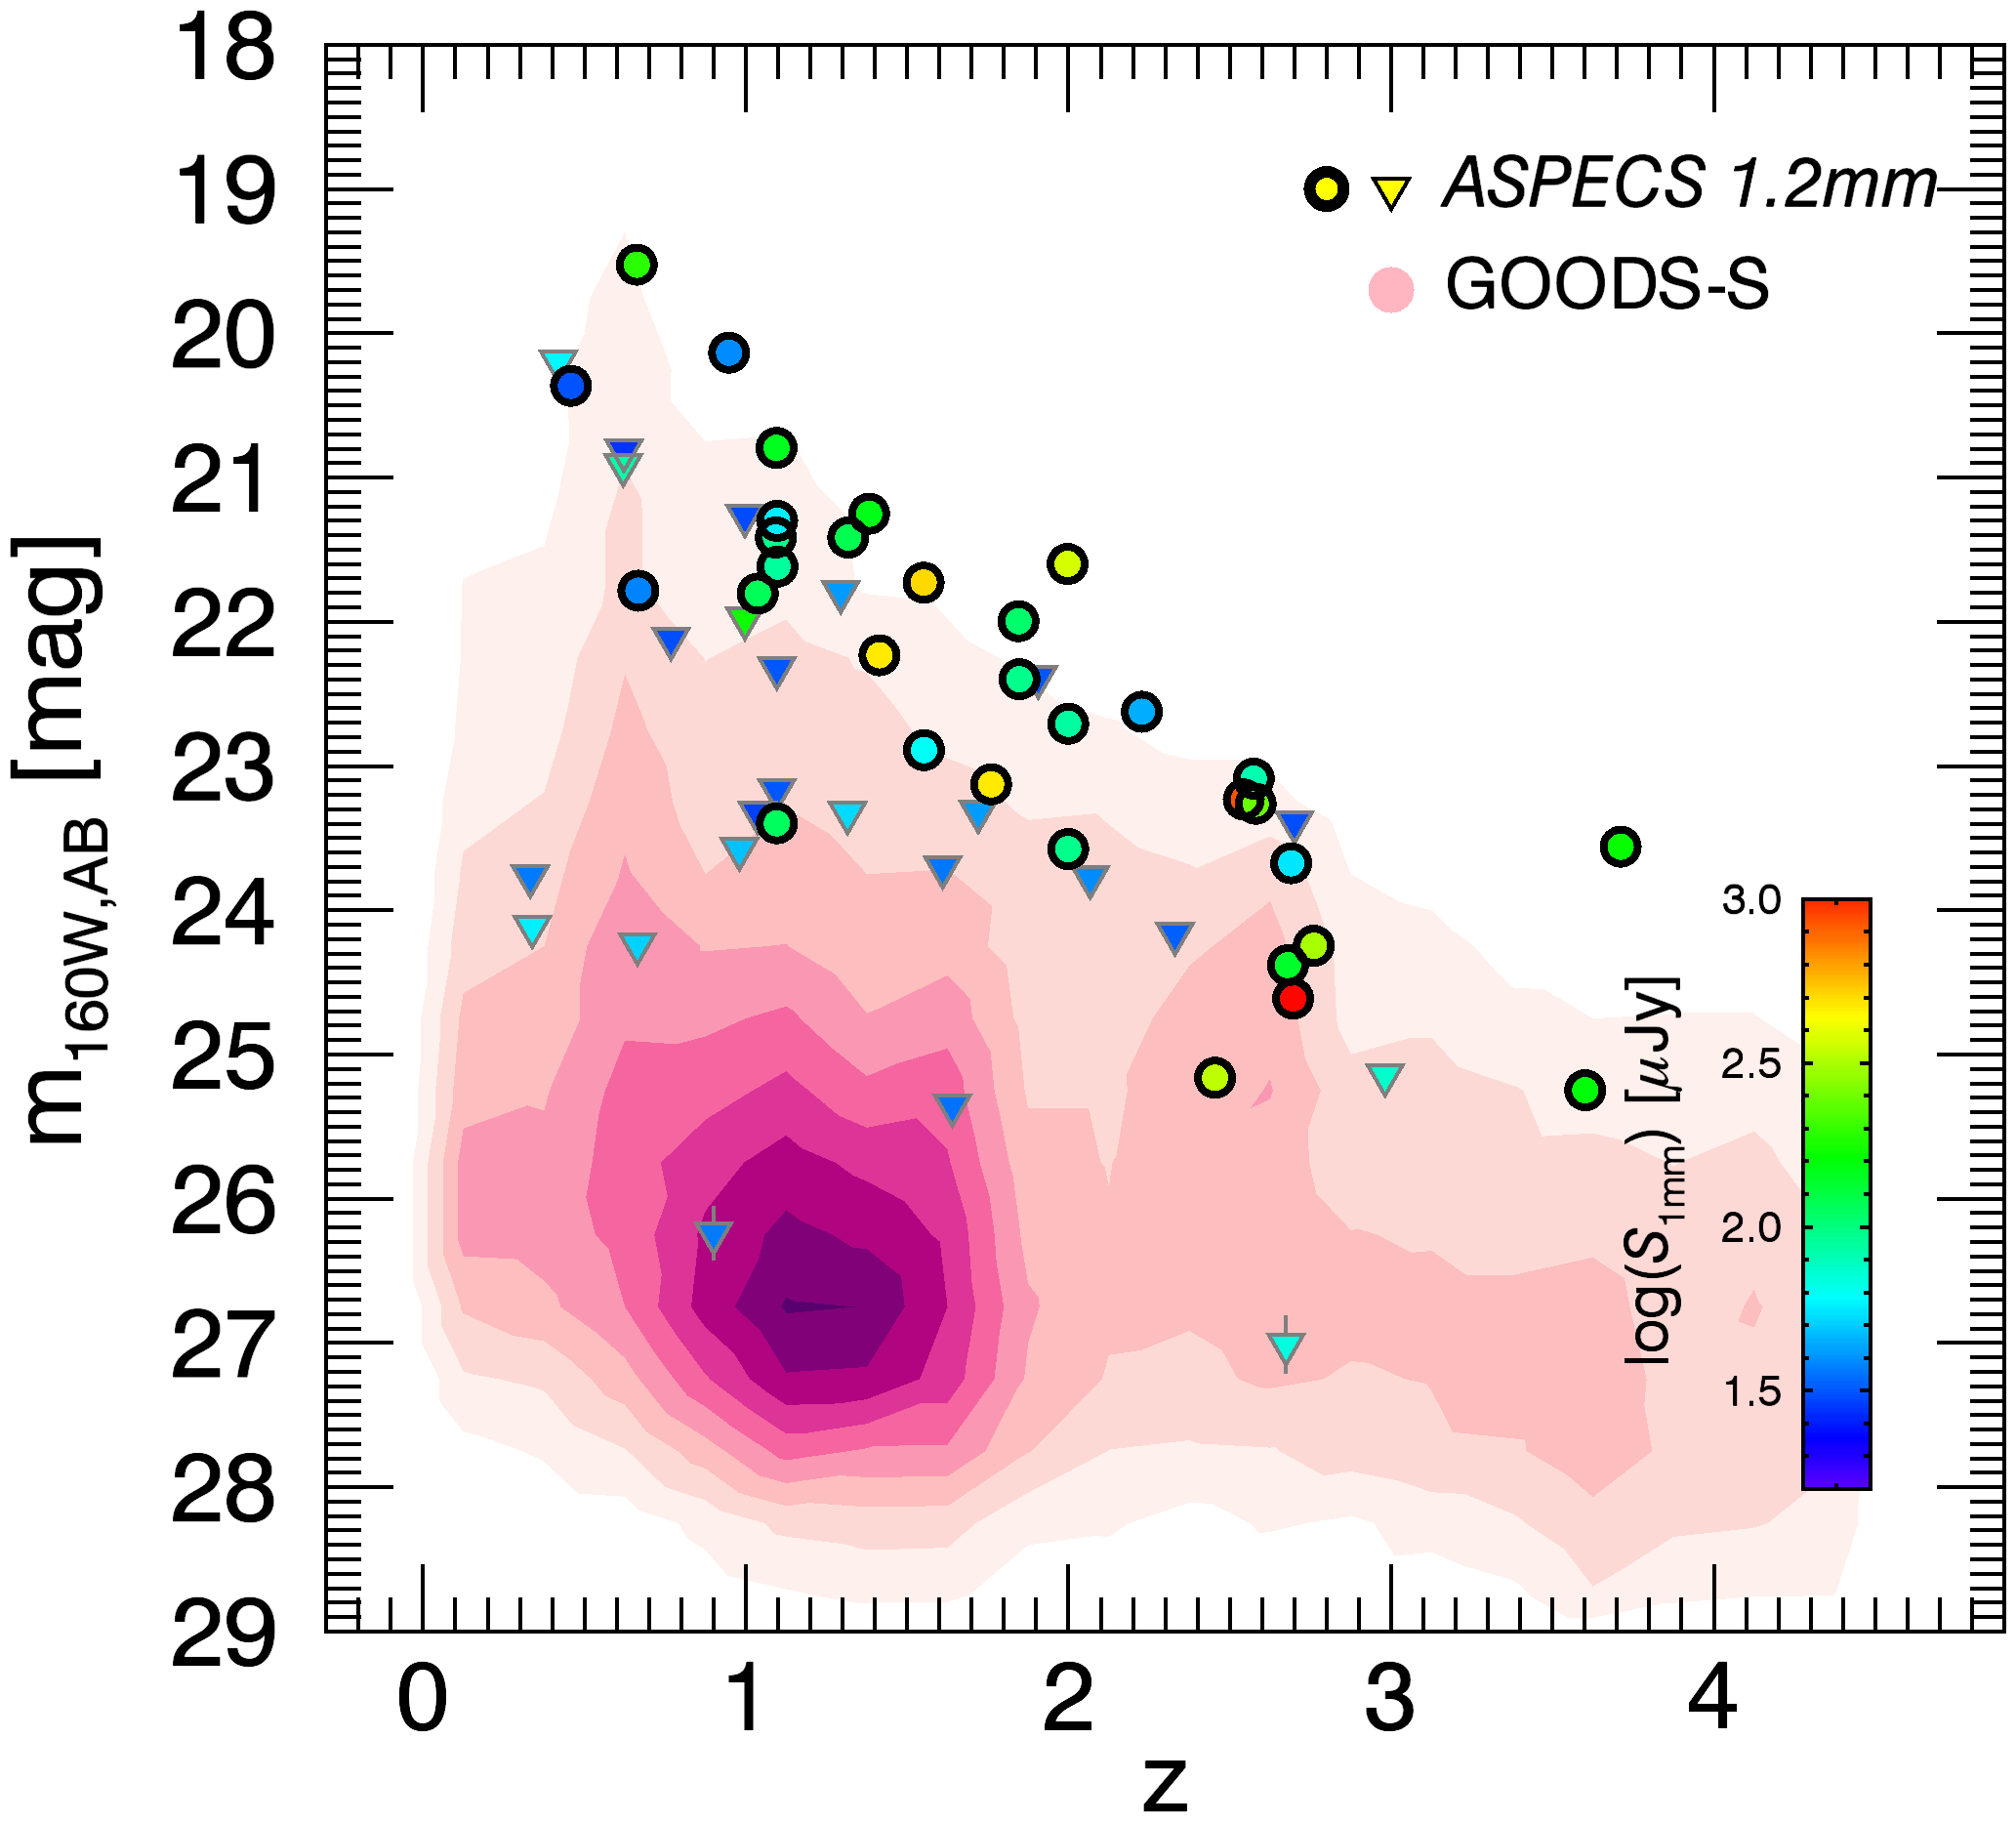
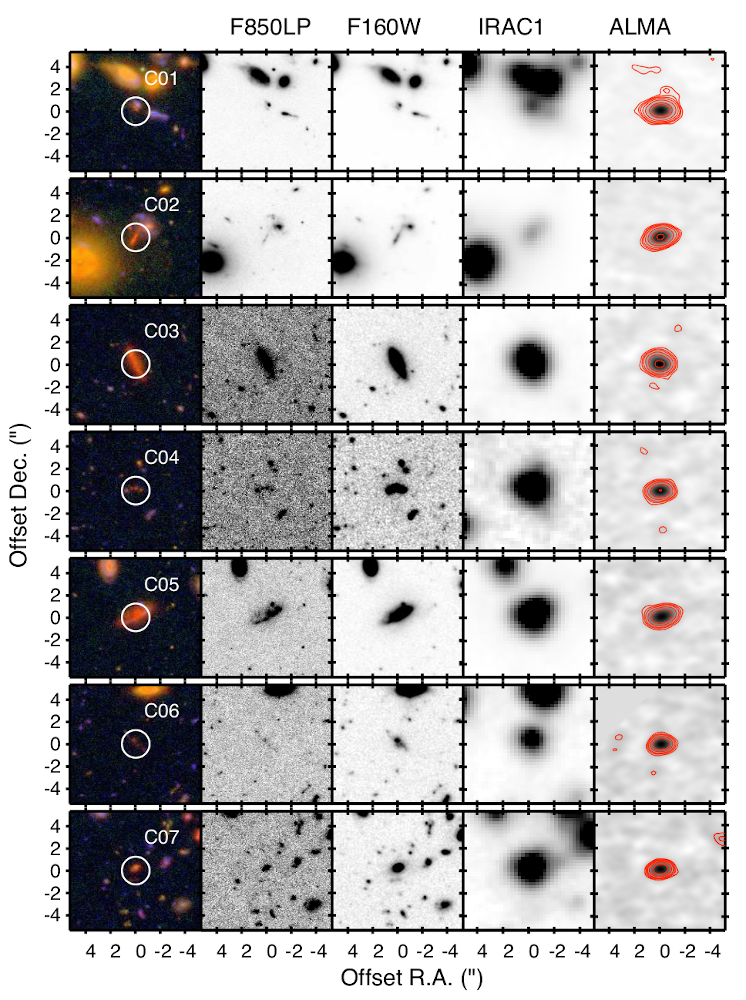
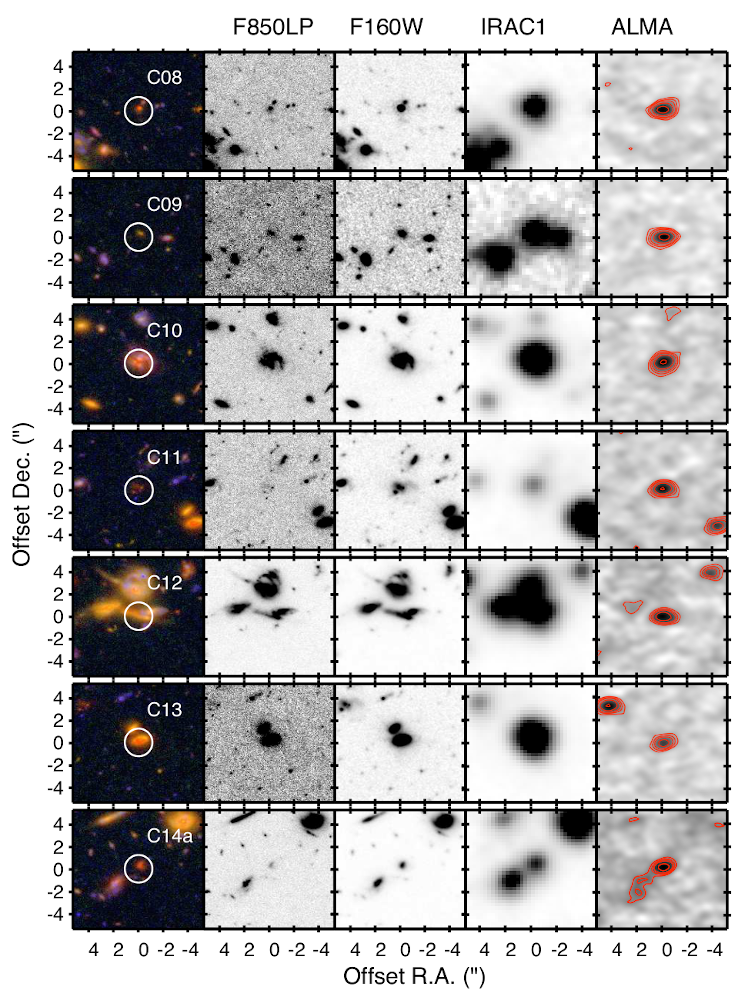
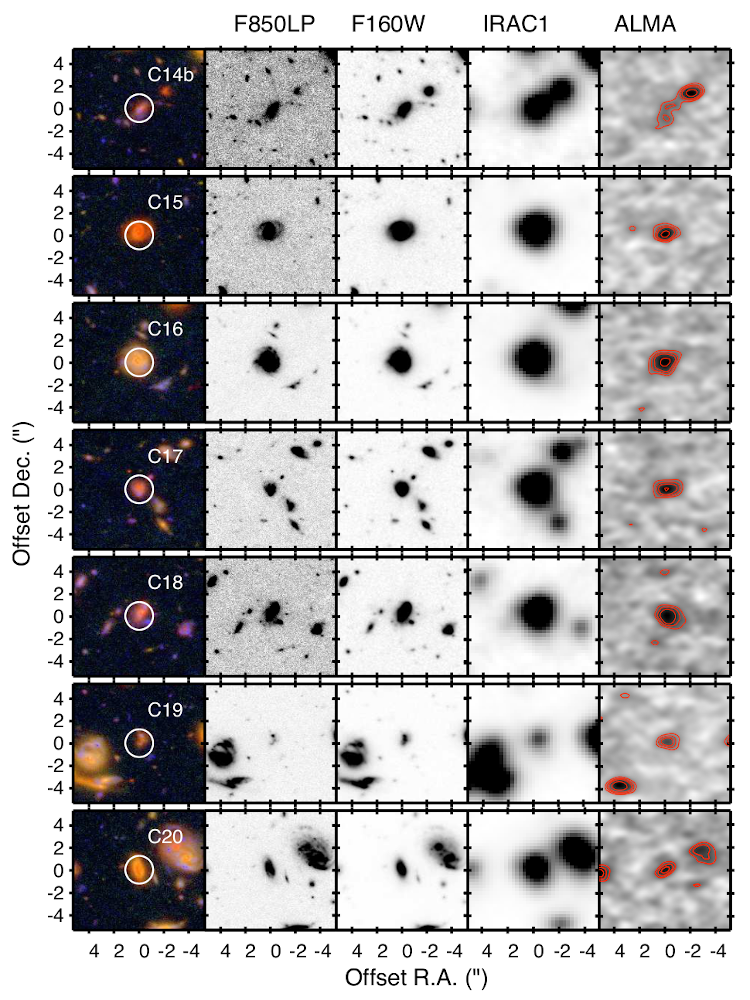
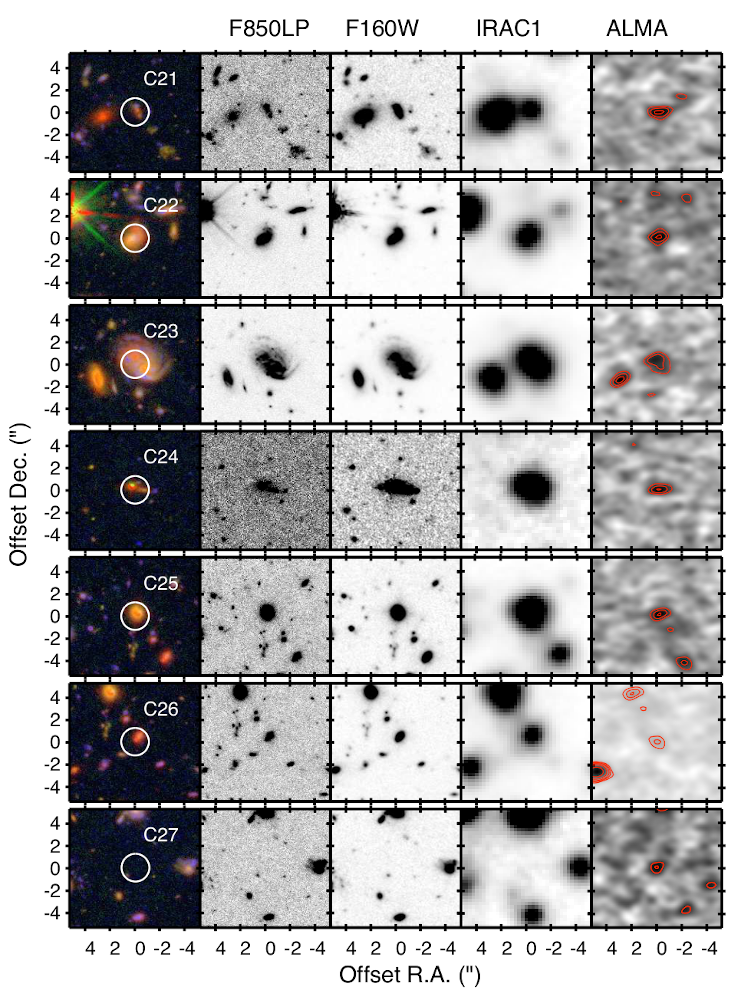
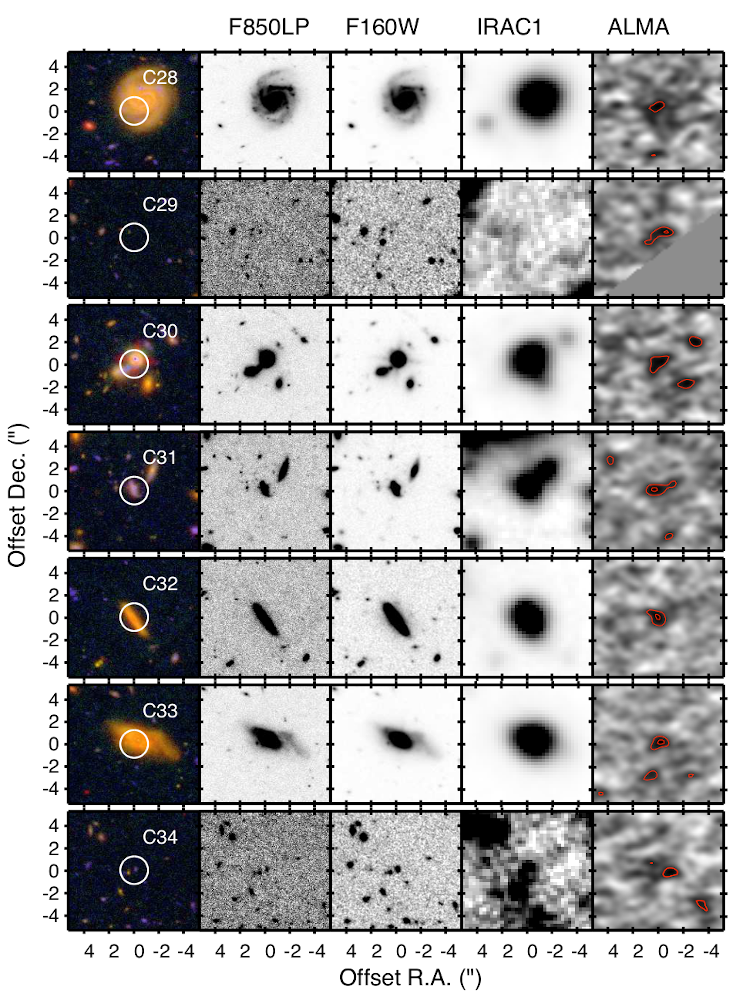
Figure 1 shows the location of the 1.2 mm sources with respect to the optical galaxies in the field. Figure 2 shows the HST F160W magnitudes as a function of redshift for the 1.2 mm sources compared to the optical galaxies in the field. At all redshifts, ASPECS 1.2 mm galaxies are among the brightest. Multi-wavelength cutouts for individual sources are shown in the Appendix B. We find that from the sample of 35 millimeter detections in the ASPECS field, 32 have clear optical counterparts in the HST images. The three 1.2 mm detections with no optical counterparts have low S/N values and are consistent with the number of spurious sources at these significances, based on the fidelity analysis (see discussion in González-López et al., 2020).
3.2.2 IR
Several of our ASPECS 1.2 mm continuum sources have an IR counterpart in Spitzer 24m and/or Herschel PACS 100/160m catalogs (Elbaz et al., 2011). We find that out of the 35 significant ASPECS sources, 25 have a Herschel PACS counterpart within , and 10 have only upper limits at these wavelengths (González-López et al., 2020). Due to its poor angular resolution (), we do not attempt to match our sample to Herschel SPIRE sources. Out of these 10 Herschel PACS undetected sources, five have a clear 24m and optical counterparts (1mm.C8, 1mm.C11, 1mm.C18, 1mm.C21 and 1mm.C31). From the other five sources (1mm.C9, 1mm.C25, 1mm.C27, 1mm.C29 and 1mm.C34), only two have clear optical counterparts (1mm.C9 and 1mm.C25).
Conversely, out of the 37 Herschel PACS sources in the HUDF, 25 have a clear 1.2 mm counterpart as mentioned above, nine can be associated to a 1.2-mm positive blobs in the map, and three have no millimeter match. Most of these nine sources are part of the ASPECS 1mm secondary sample. The other three Herschel sources undetected at 1.2 mm are located near the edge of the ASPECS map, where the sensitivity worsens rapidly.

3.2.3 CO
It is interesting to check how many of the previously reported ASPECS CO emitters from ALMA band 3 observations (González-López et al., 2019) are detected in the deep ASPECS 1.2 mm map. Of the 18 ASPECS CO line emitters (16 blind plus 2 prior based), 13 have a counterpart in the main sample of dust continuum sources reported here. From the other 5 CO sources (ids 3mm.9, 3mm.11, 3mm.16, 3mm.MP1 and 3mm.MP2), two have associated emission at the level (3mm.16 and 3mm.MP1), and are included in the faint prior-based sample (see Section 3.3). One of these, 3mm.9, falls outside the coverage of the ASPECS 1.2-mm mosaic (see Fig. 1), while 3mm.MP2 is blended with 3mm.8 corresponding to source C24 in the 1mm map. Hence, only one CO source, 3mm.11, has a formal nondetection at 1.2 mm, yielding an upper limit of 50Jy (). We note that this source identification and redshift have been confirmed through a clear CO(4-3) line detection in the ALMA band 6 cube (Boogaard et al., 2020).
3.3 Prior-based millimeter sample
Millimeter sources at a lower significance level than the main sample, down to a fidelity of 50%, were extracted based on the existence of an optical or IR counterpart (see above). Optical sources were restricted to have HST F160W magnitudes mag, to ensure more reliable associations. This prior based approach relies on the fact that bright optical sources will most likely be associated with massive or star-forming galaxies, which would likely show faint 1.2 mm emission. For this secondary sample, we consider a millimeter source as plausible if the probability of chance association with an optical match is and lies within . Based on this, we expect source to be a false optical-millimeter match. Similarly, one can look for associations between faint millimeter sources and IR Herschel/PACS sources in the field. Given the low density of both source samples, the likelihood of a chance association is negligible. For additional details on the prior-based selection, we refer the reader to González-López et al. (2020).
With this approach we find an additional sample of 25 millimeter sources using an optical prior. Twelve of these have an IR (Spitzer and/or Herschel) counterpart. Only one additional source is found using a Herschel prior alone. Throughout the rest of this paper, we treat this prior-based, faint millimeter sample as the secondary sample.
3.4 SED fitting and derivation of properties
For all galaxies in the HUDF, we fit their SED using the high-redshift extension of magphys (da Cunha et al., 2008; da Cunha et al., 2015). We use the available 26 broad- and medium-band filters in the optical and infrared regimes, from the band to Spitzer IRAC 8m, and including the Spitzer MIPS 24 m and the ALMA 1.2 mm and 3 mm fluxes and upper limits. For the continuum-detected galaxies, we include the ALMA 1.2 mm and 3 mm and Herschel PACS 100 and 160m fluxes or limits. We note that for the field galaxies we do not include the Herschel PACS limits, as the depth of the ALMA maps sets significantly more stringent constraints.
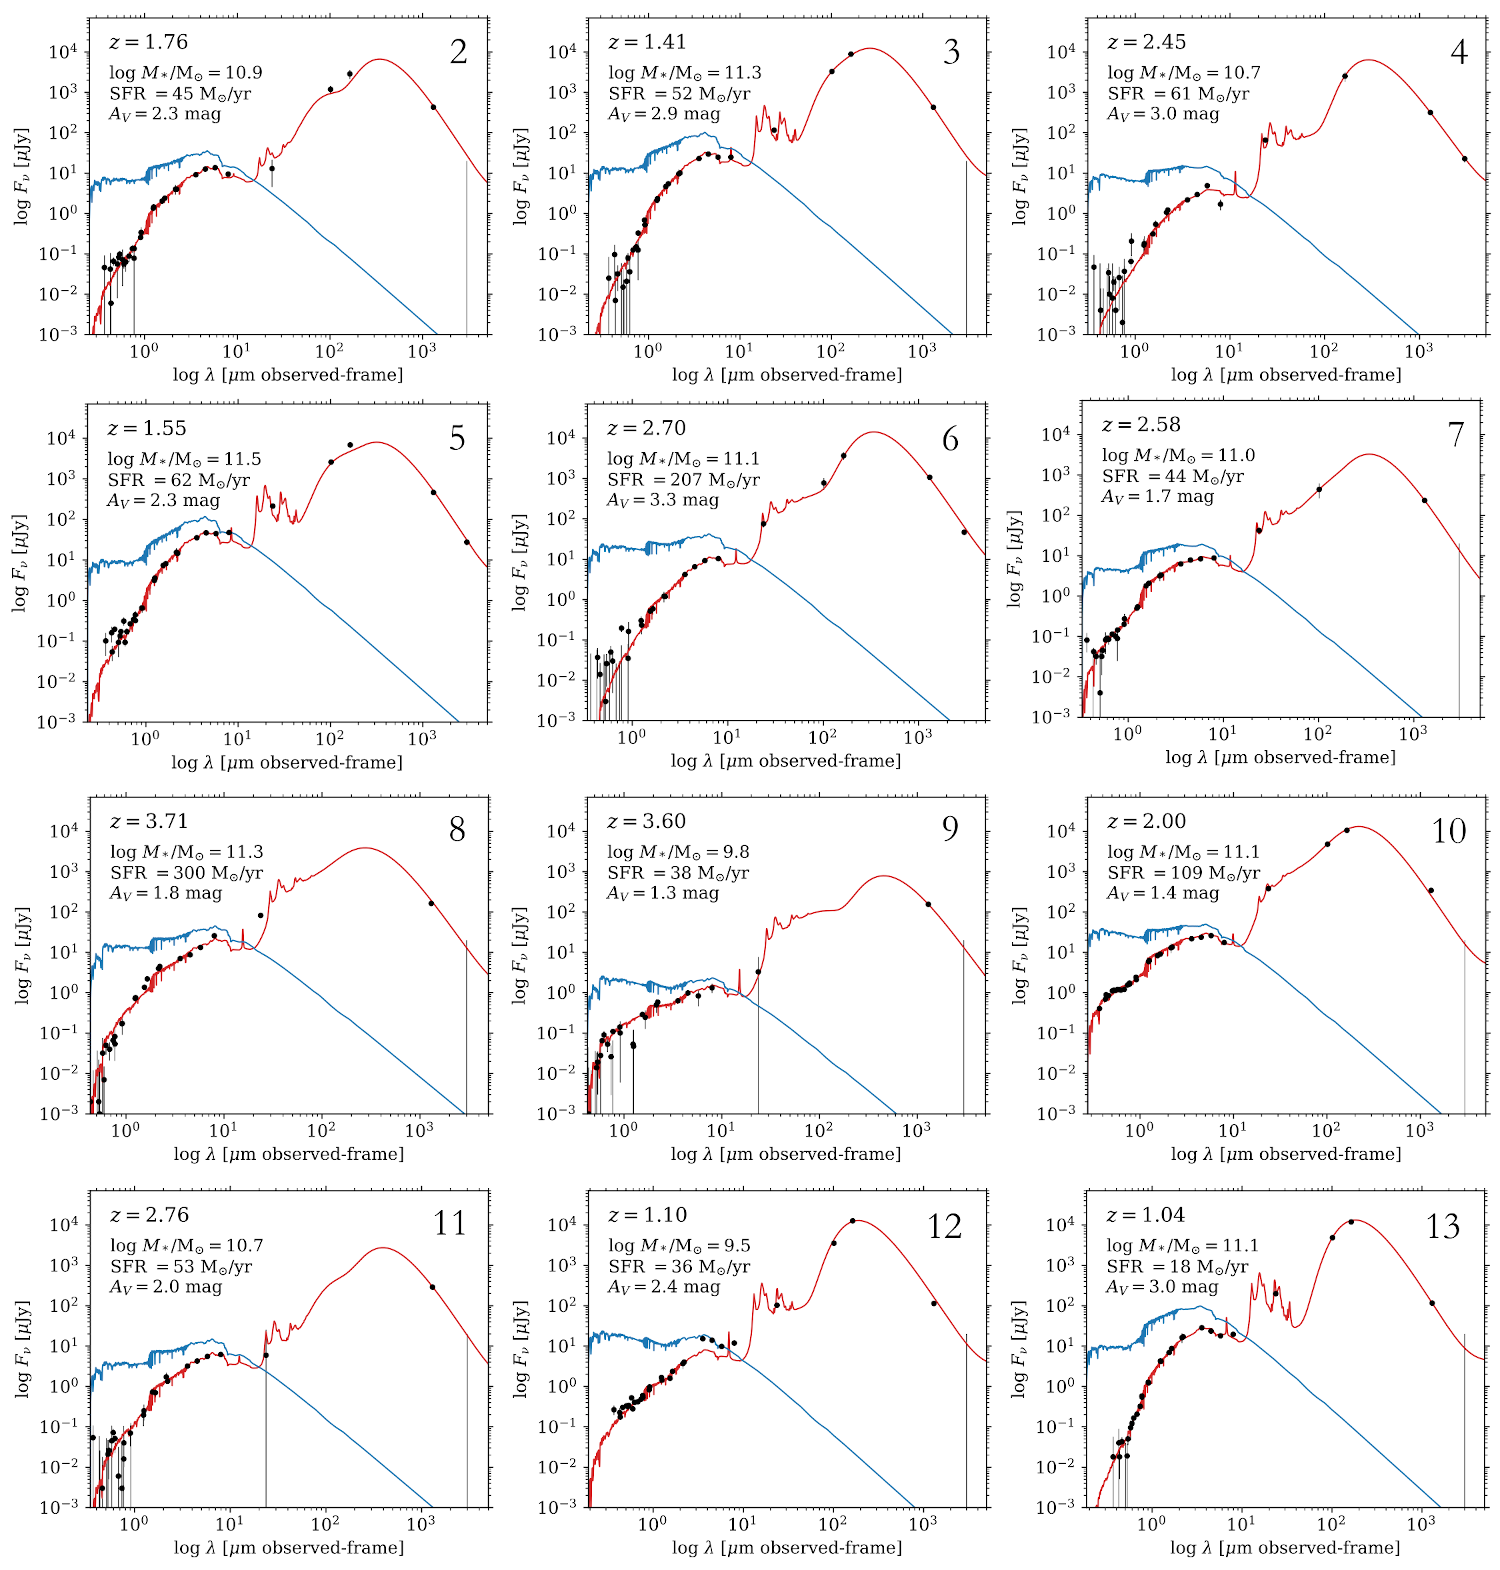
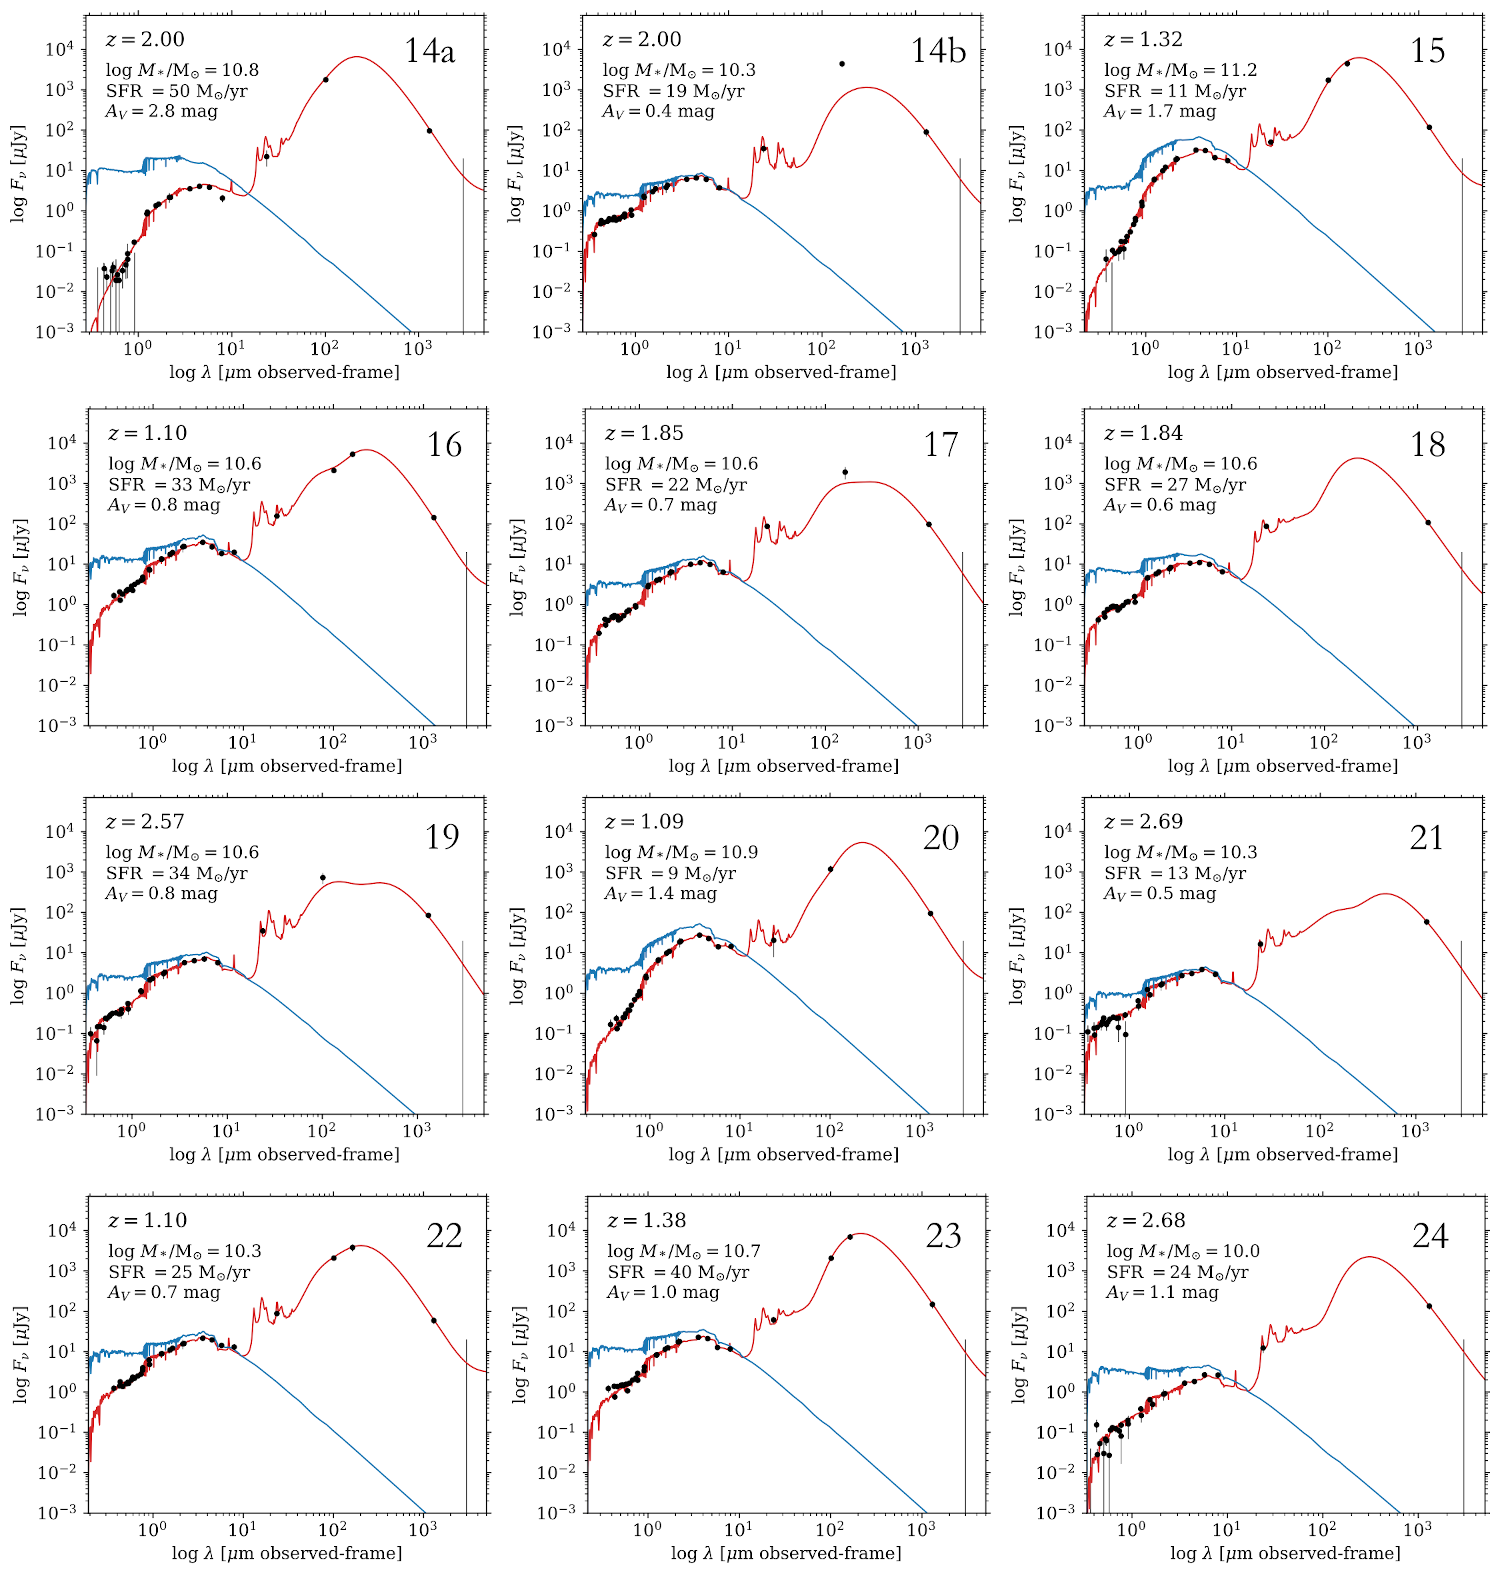
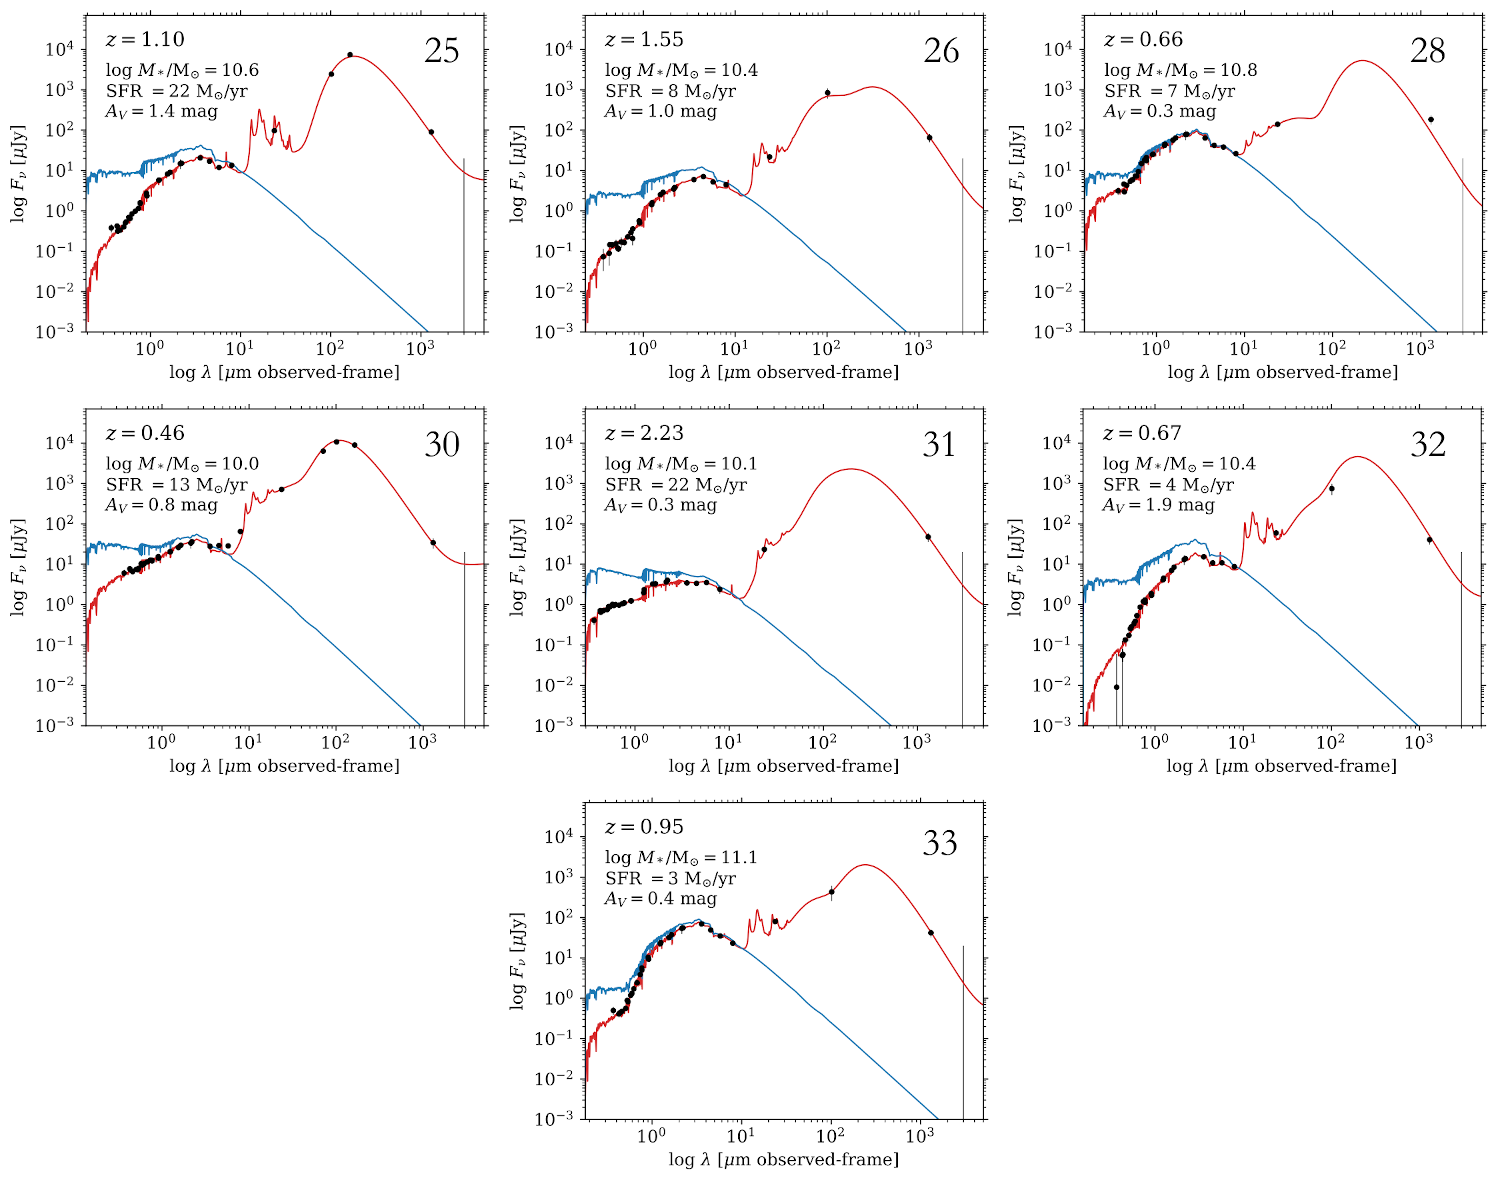
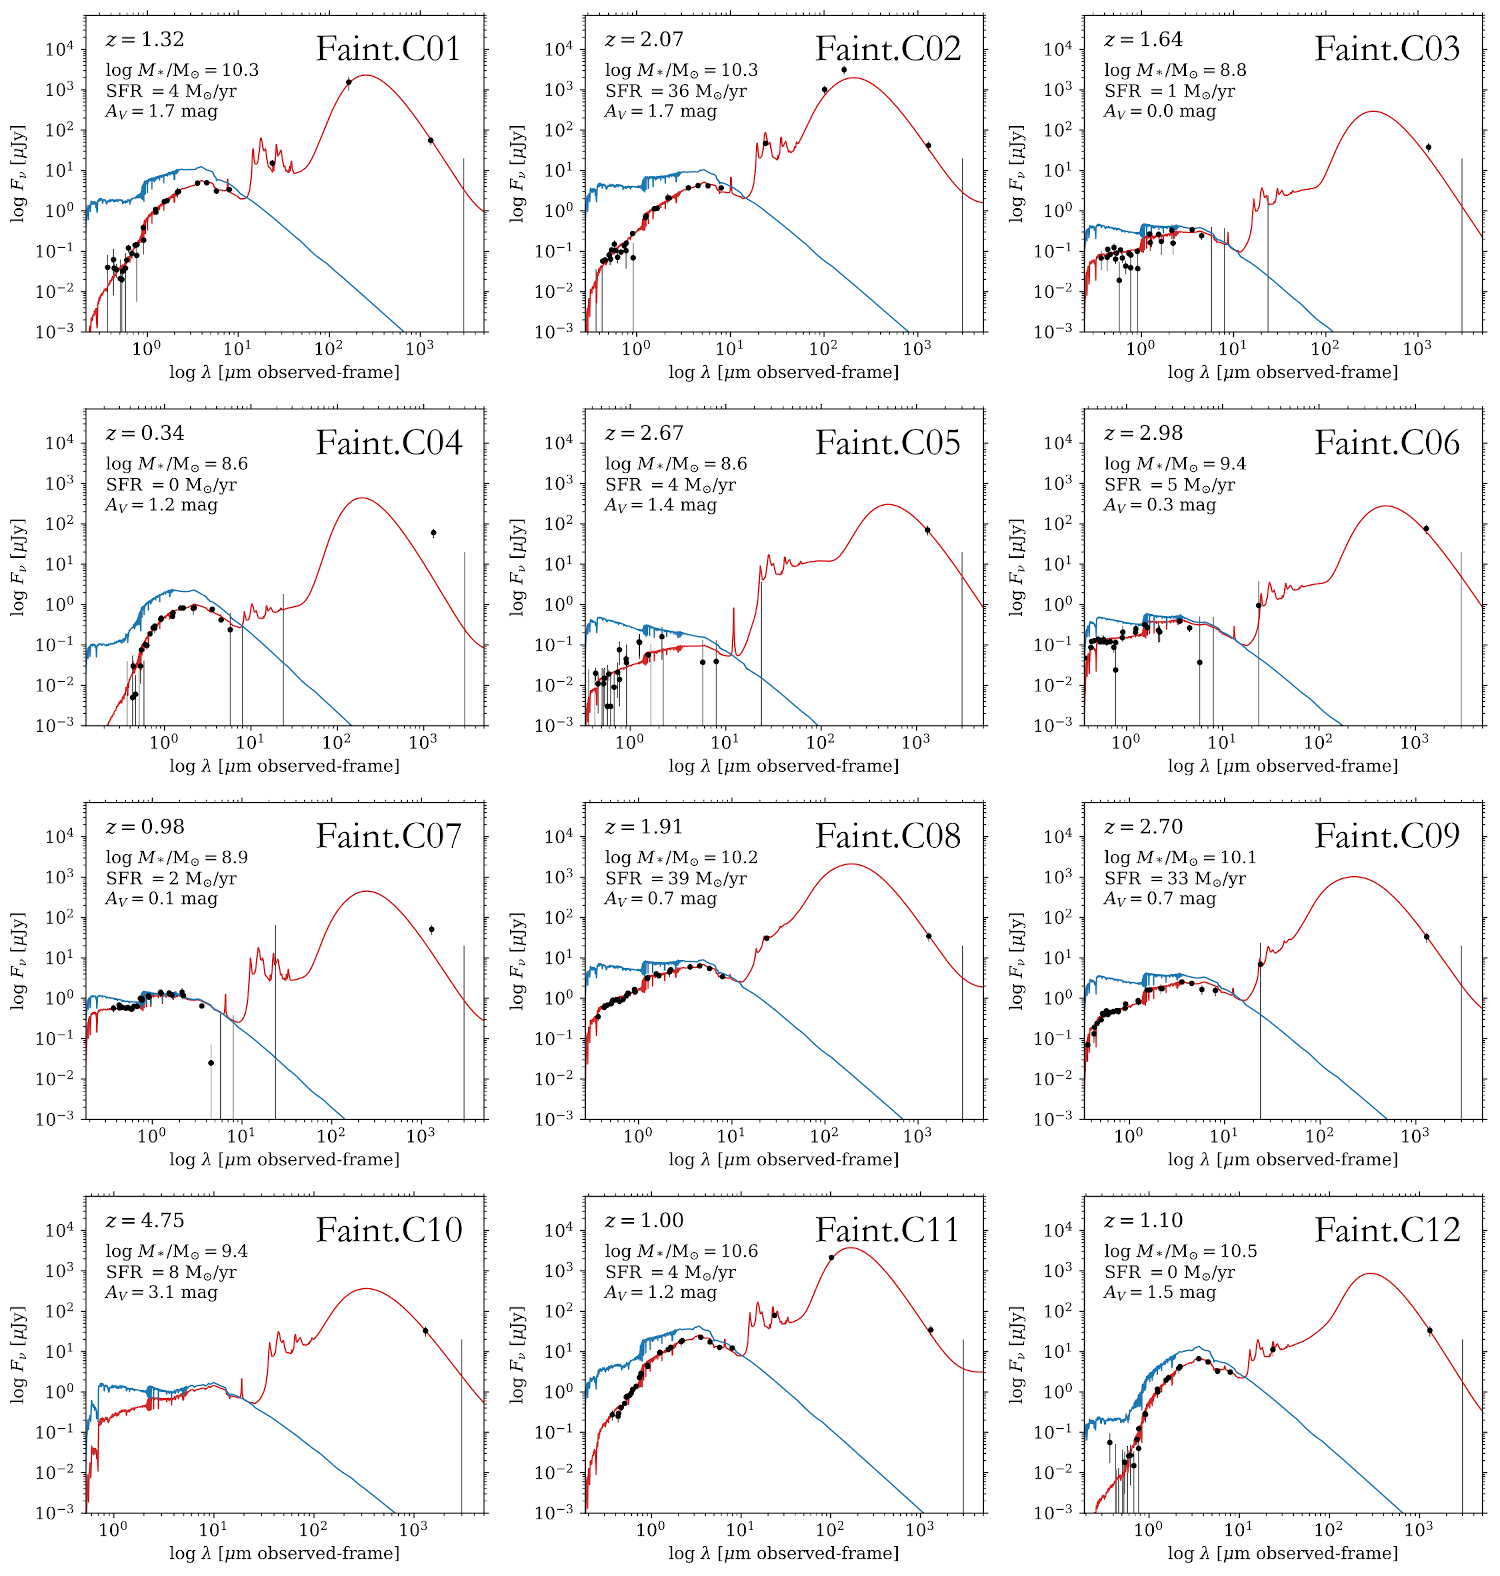
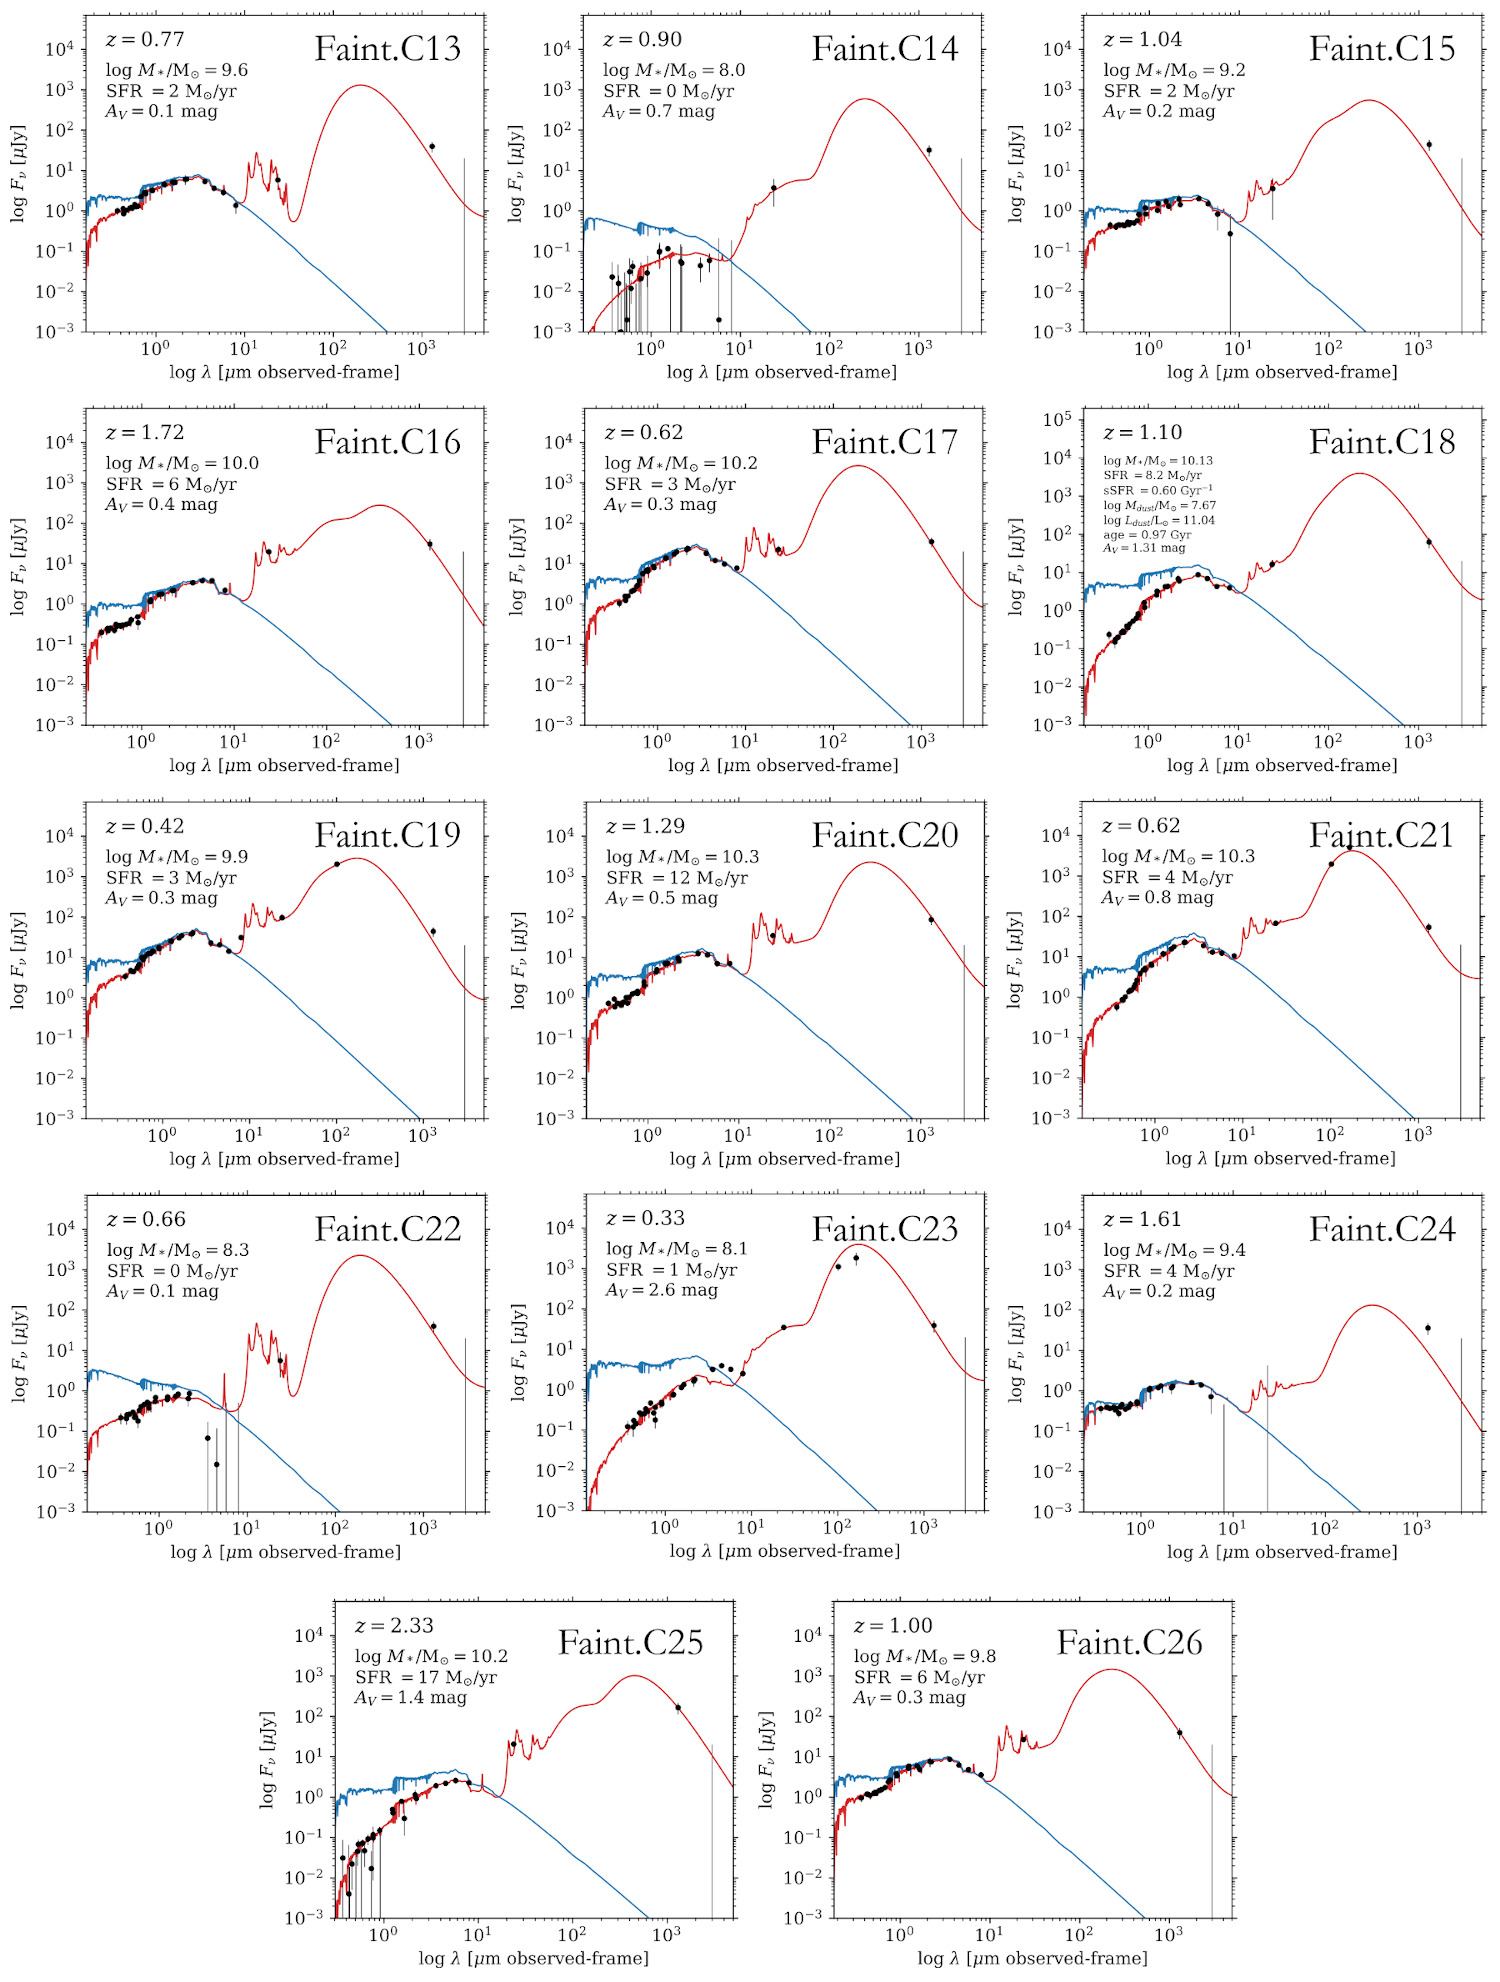
magphys yields estimates for the stellar masses, SFR, specific SFR, and attenuation. To constrain the FIR SED, magphys assumes a two-component graybody approximation, with dust emissivity indexes of 1.5 and 2.0 for the warm and cold components, respectively. Under these assumptions, magphys fits yield estimates of the IR luminosity and the dust masses and temperatures. magphys employs a physically motivated prescription to balance the energy output at different wavelengths. Thus, even in cases with poor constraints on the IR SED, estimates on the IR luminosity and/or dust mass arise from constraints on the dust-reprocessed UV emission, which is well sampled by the UV-to-infrared photometry as demonstrated by Dudzevičiūtė et al. (2020). An example of the photometry and SED fits obtained for the ASPECS sources is shown in Fig. 3. The full set of SED fits is presented in the Appendix C. The properties derived for individual ASPECS 1mm sources are shown in Table 2. The values listed correspond to the same values used in González-López et al. (2020) and Boogaard et al. (2020).
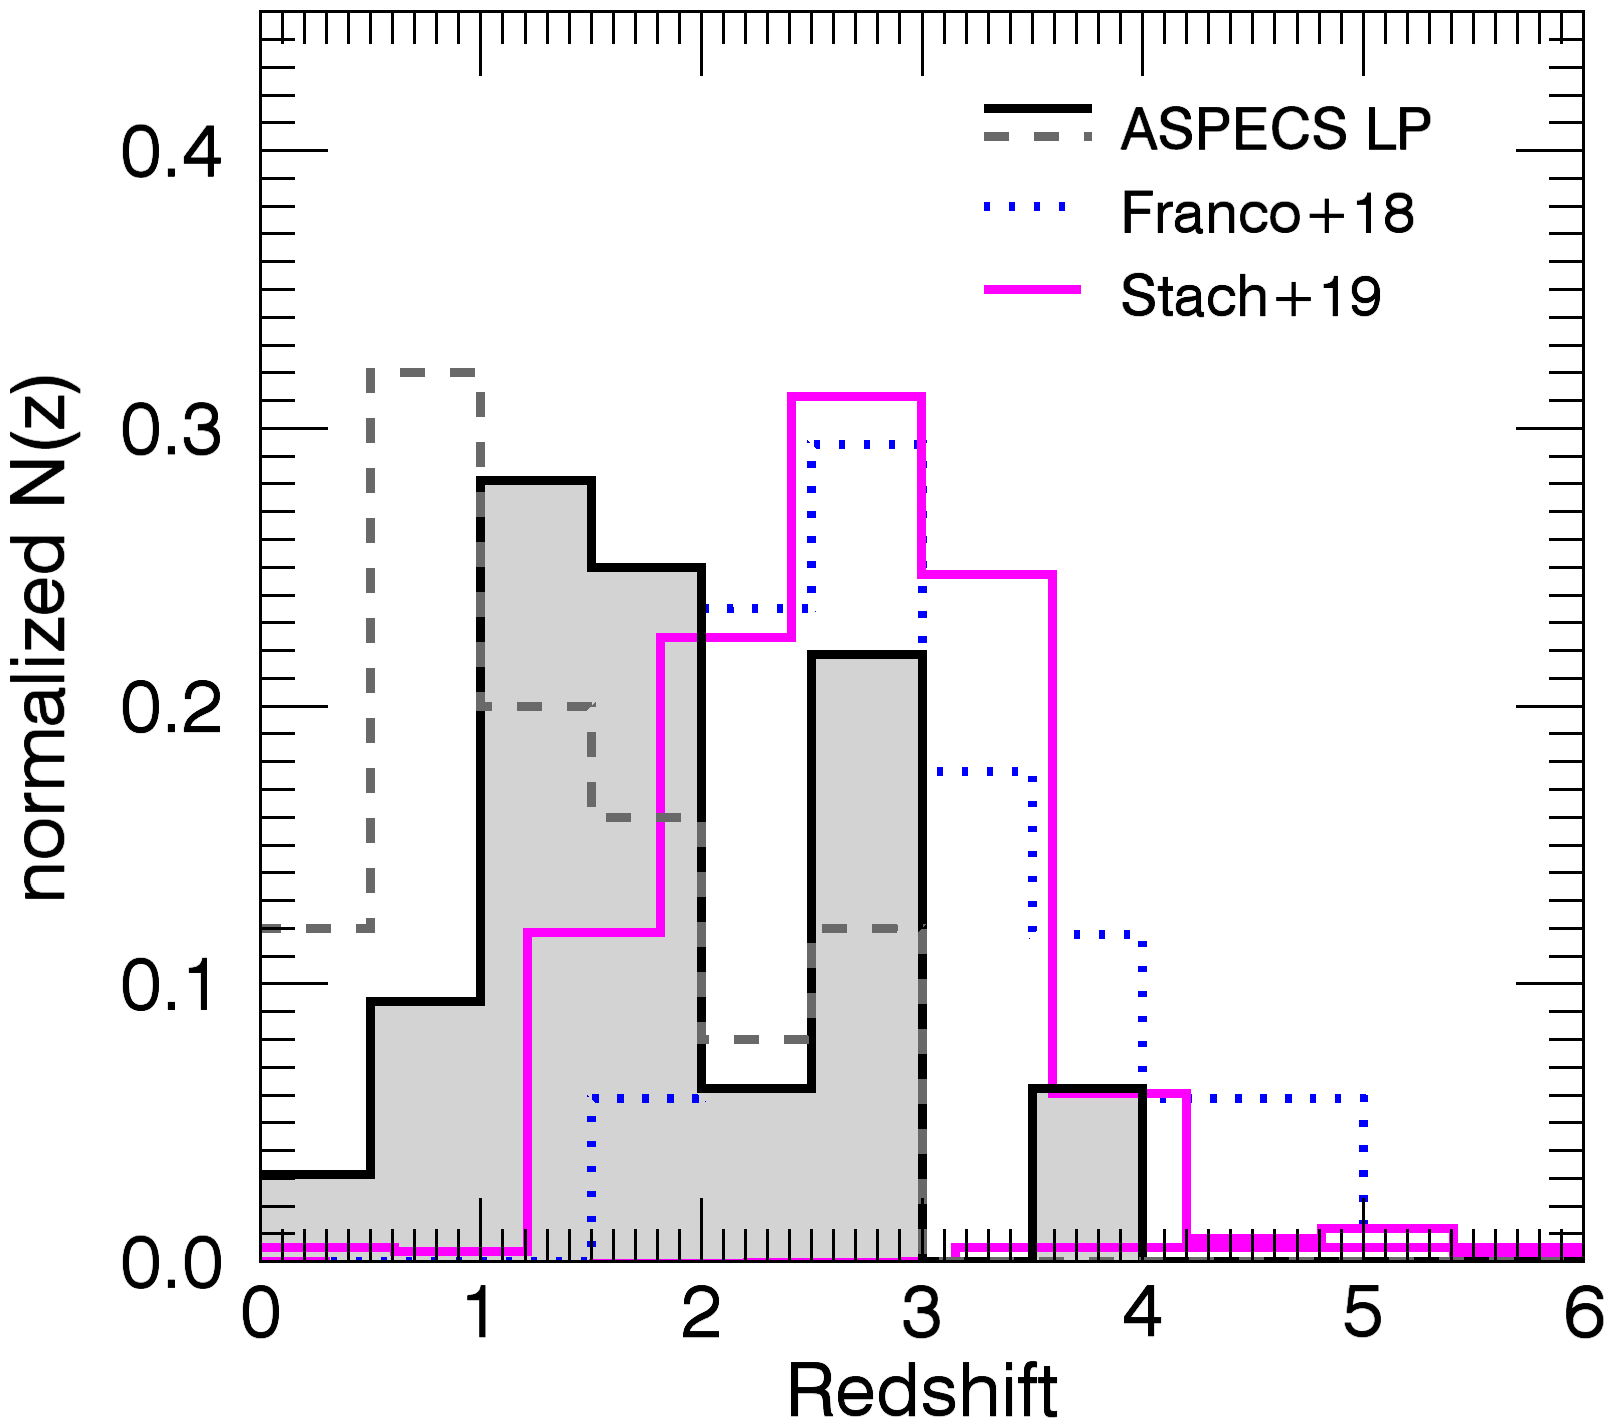
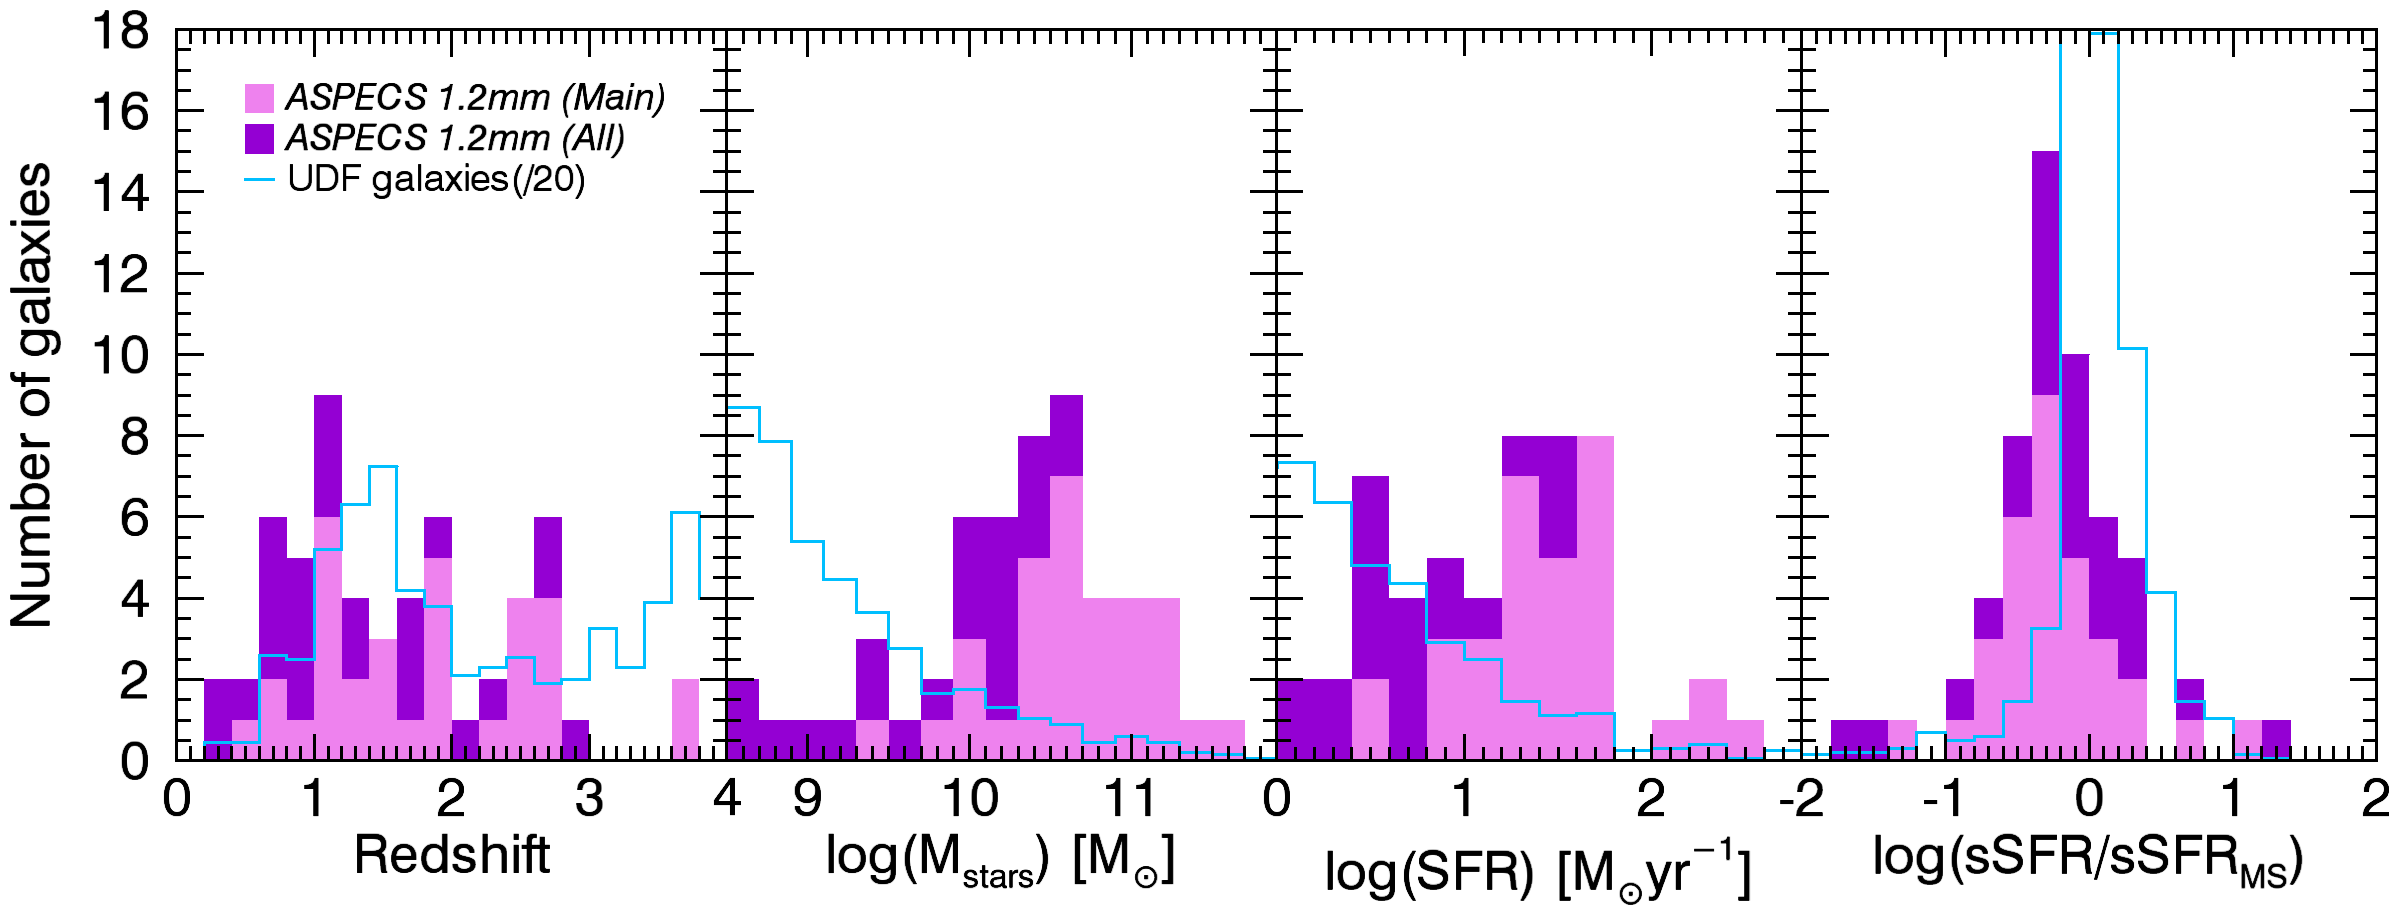
Figure 4 shows the distributions of redshift, SFR, stellar mass, and specific SFRs for our ASPECS 1.2 mm continuum sources compared to all galaxies in the HUDF. This HUDF galaxy sample was restricted to galaxies with log() and log(SFR), and to sources that fall within the region covered by the ASPECS observations (within PB) and with redshifts that match those found for the ASPECS 1.2 mm sources (). From this, we find that the ASPECS galaxies are among the most massive and star-forming galaxies in the ASPECS field in the specified redshift range. The ASPECS 1.2 mm galaxies span almost 2 dex in stellar mass and SFR. For the main sample, we find a median stellar mass of , with an interquartile range of , and a median SFR of yr-1, with an interquartile range of yr-1. These values confirm previous results found for this galaxy population by the ASPECS pilot survey (Aravena et al., 2016b), which targeted a smaller region of the HUDF at slightly shallower depth. Interestingly, when including sources from the faint, prior-based sample, we find lower redshifts, lower stellar masses, and SFRs compared to the main sample. For this sample, we find a median stellar mass of , with an interquartile range , and a median SFR of yr-1, with an interquartile range of yr-1.
Based on the comparison of the stellar masses and SFRs obtained with magphys and prospector (see Bouwens et al., 2020), we find that these parameters are precise to within 0.1-0.2 dex in the stellar-mass range explored in this study. To test the reliability of the physical parameters obtained with magphys, Dudzevičiūtė et al. (2020) run magphys SED fitting on a sample of galaxies from the EAGLE galaxy simulation with SFR yr-1 and . They find that magphys successfully provides good estimates of all parameters, except for the stellar masses where a significant systematic underestimation of 0.46 dex was found. Dudzevičiūtė et al. (2020) attribute this difference to variations in the adopted star-formation histories, dust model, and geometry between magphys and the used radiative transfer code. Based on the comparison of the stellar masses and SFRs obtained with the magphys and prospector SED fitting codes in HUDF/ASPECS galaxies, Bouwens et al. (2020) find that these parameters are precise to within dex, and magphys stellar masses are lower by 0.1 dex in the stellar-mass range explored in this study (). These later results are in good agreement with the comparisons made by Liu et al. (2019). To account for these systematic uncertainties, we have added in quadrature a 0.1 dex uncertainty to all the magphys parameters derived.
4 Analysis and Discussion
4.1 Redshifts
The vast majority of identified ASPECS 1.2 mm galaxies have a reliable spectroscopic redshift: out of the 32 ASPECS 1.2 mm galaxies with optical counterparts in the main sample, 28 have an unambiguous spectroscopic redshift available either from the deep ASPECS CO spectroscopy (González-López et al., 2019), MUSE spectroscopy (Boogaard et al., 2019) and/or from other optical/NIR spectroscopic surveys in the HUDF. The other four sources have a photometric redshift from the 3D-HST survey (e.g., Skelton et al., 2014; Momcheva et al., 2016). Similarly, out of the 26 sources in the secondary sample, 21 have a spectroscopic redshift and 5 have a photometric redshift from 3D-HST (see Tables 1 and 3).
Figure 5 shows the redshift distribution of the ASPECS 1.2 mm continuum sources in the main sample compared to two other galaxy samples detected in previous (sub)millimeter continuum deep maps, including the ALMA survey of the GOODS South field (Franco et al., 2018) and the recent ALMA survey of the SCUBA-2 Cosmology Legacy Survey UKIDSS/UDS field (AS2UDS; Stach et al., 2019; Dudzevičiūtė et al., 2020). The latter survey, in particular, specifically targets millimeter-brighter galaxies ( mJy), most of which correspond to SMGs.
We find that the main sample of ASPECS 1.2 mm continuum galaxies has a median redshift of 1.85 with an interquartile range of . The secondary sample of ASPECS 1.2 mm galaxies has consistently lower redshifts, yielding a median redshift of 1.10 and an interquartile range of . These redshifts are significantly lower than those found in shallower surveys such as that in the GOODS South field, with a median redshift of 2.92 (Franco et al., 2018) and in the AS2UDS with a median redshift of 2.61 (Dudzevičiūtė et al., 2020). These results confirm previous indications from the ASPECS pilot survey that these faint DSFGs (with mJy) have significantly different redshift distributions and lower median redshifts than brighter SMGs selected from shallower, larger-area surveys at similar wavelengths (e.g., Aravena et al., 2016b). Furthermore, this supports previous findings that the redshift distribution of (sub)millimeter surveys is sensitive to depth (e.g., Archibald et al., 2001; Ivison et al., 2007; Béthermin et al., 2015; Brisbin et al., 2017).
4.2 Location in stellar mass vs. SFR plane
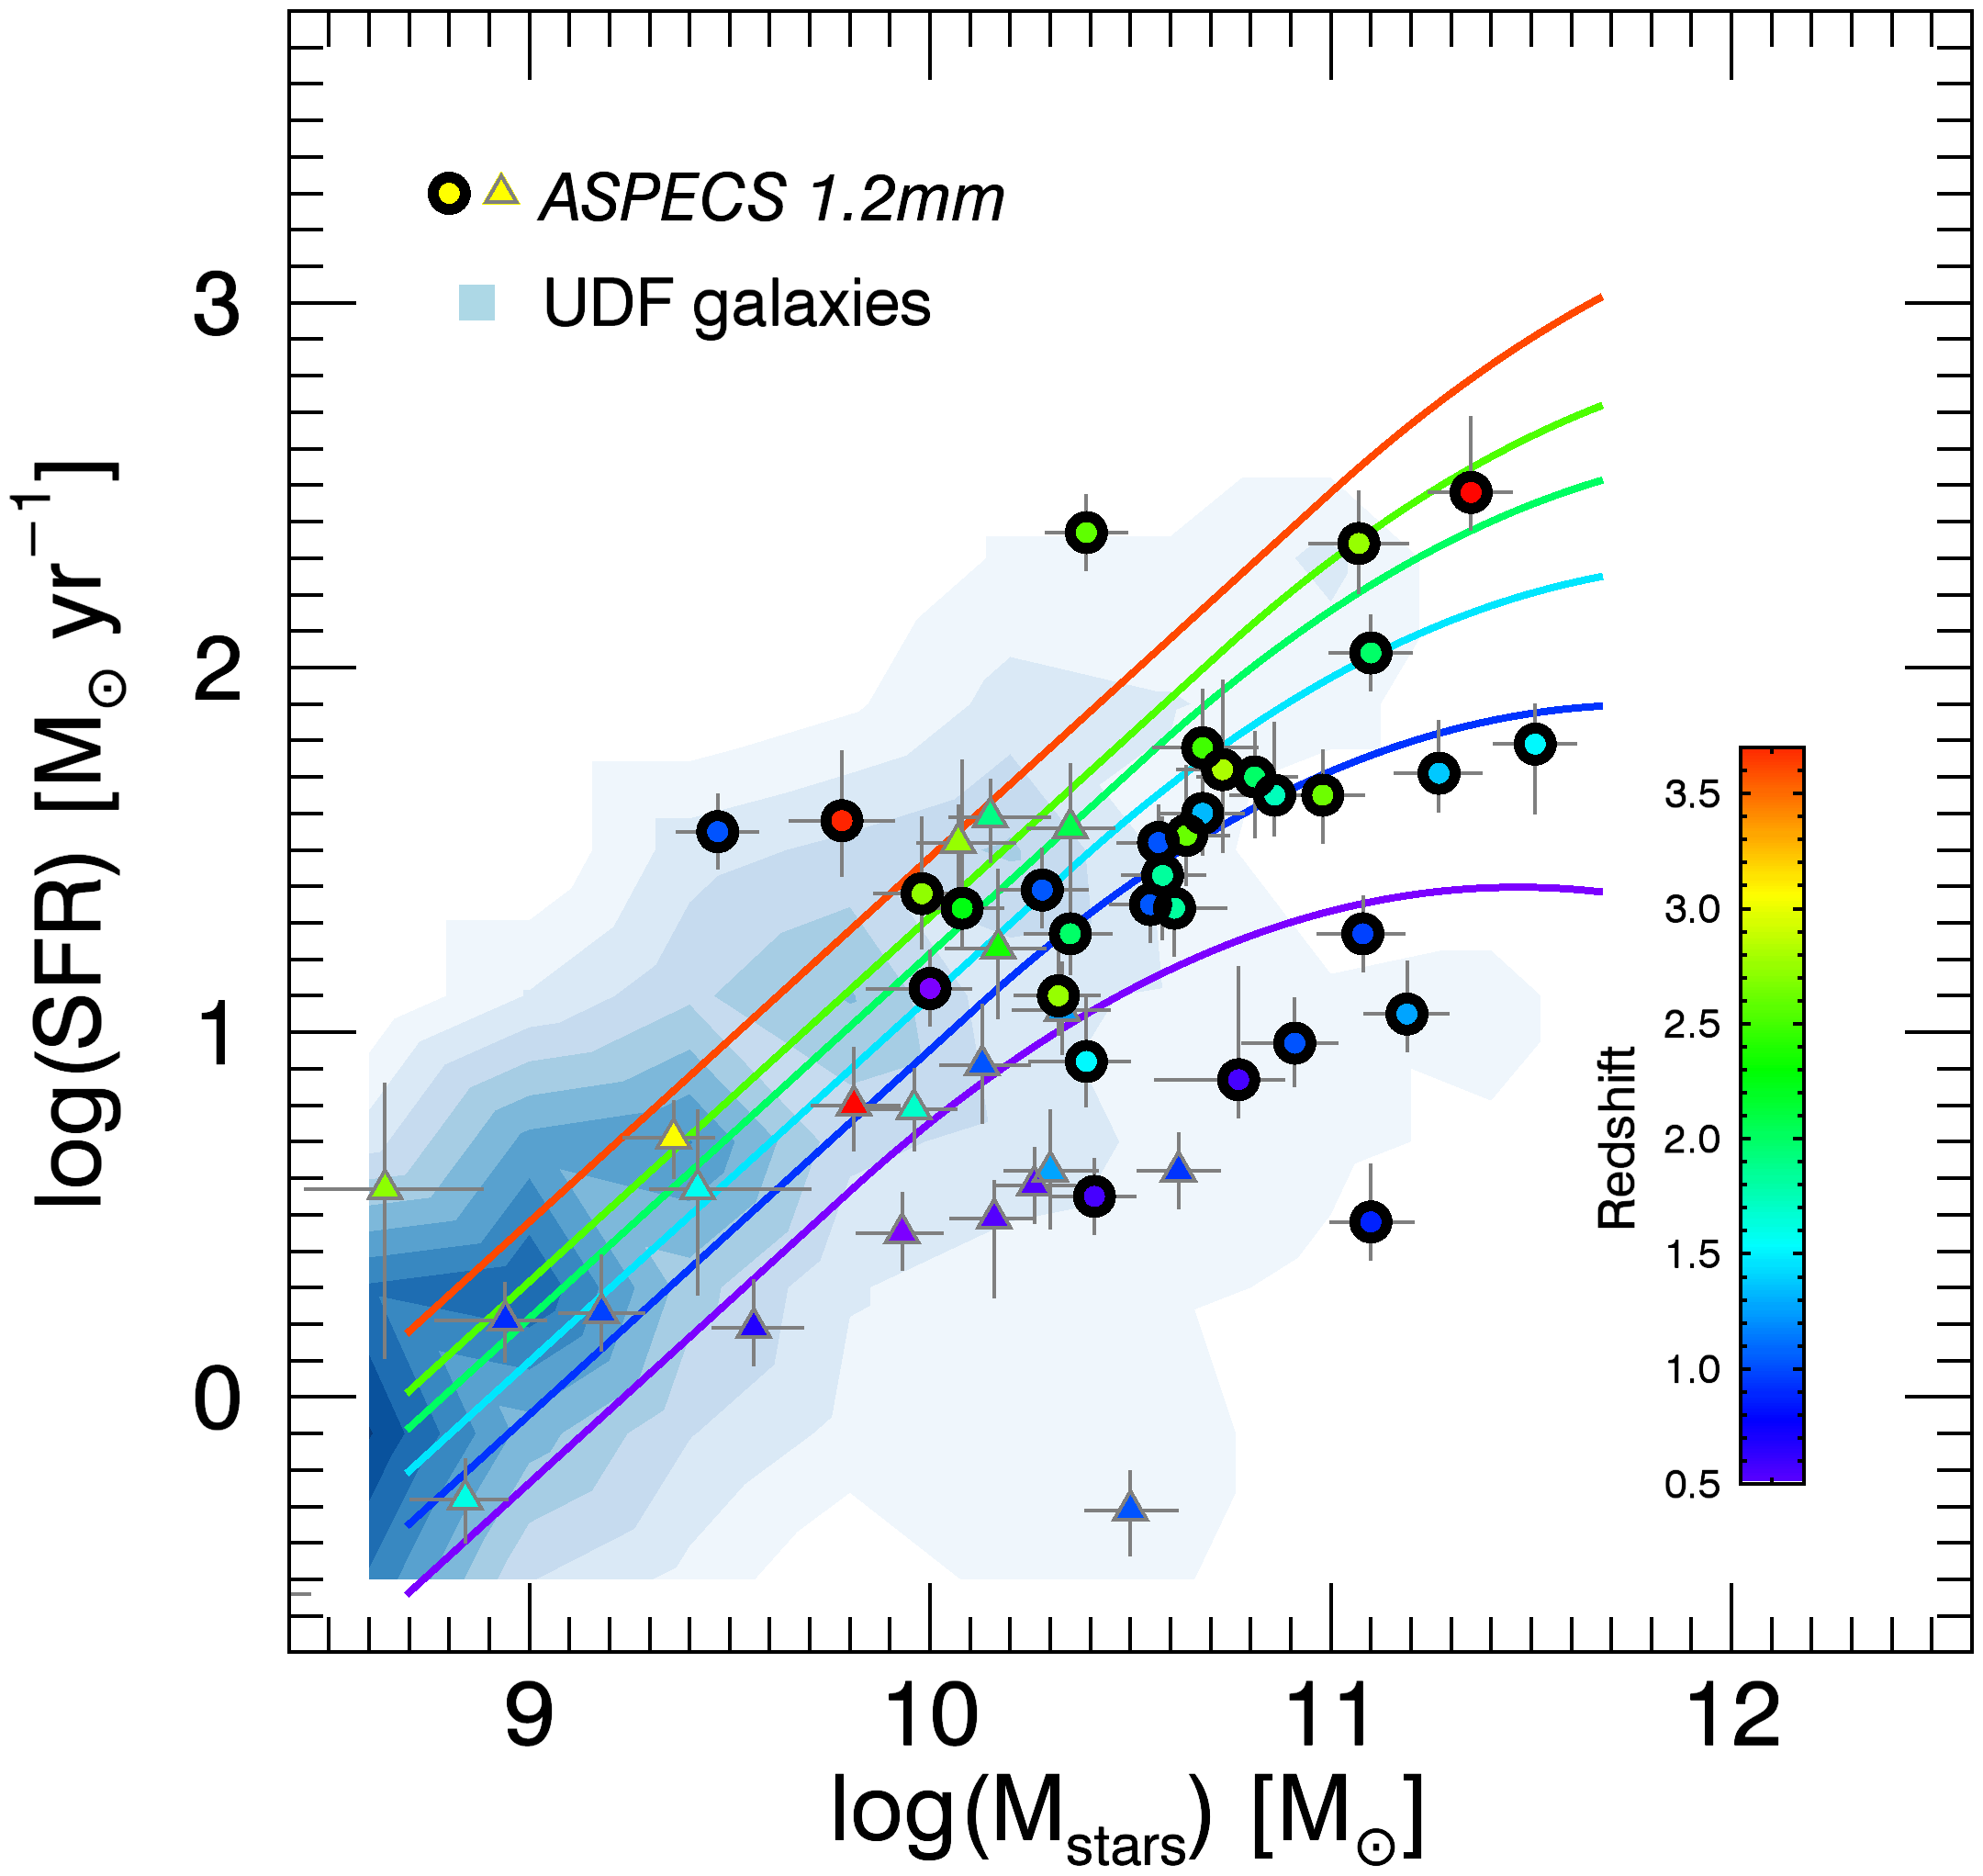
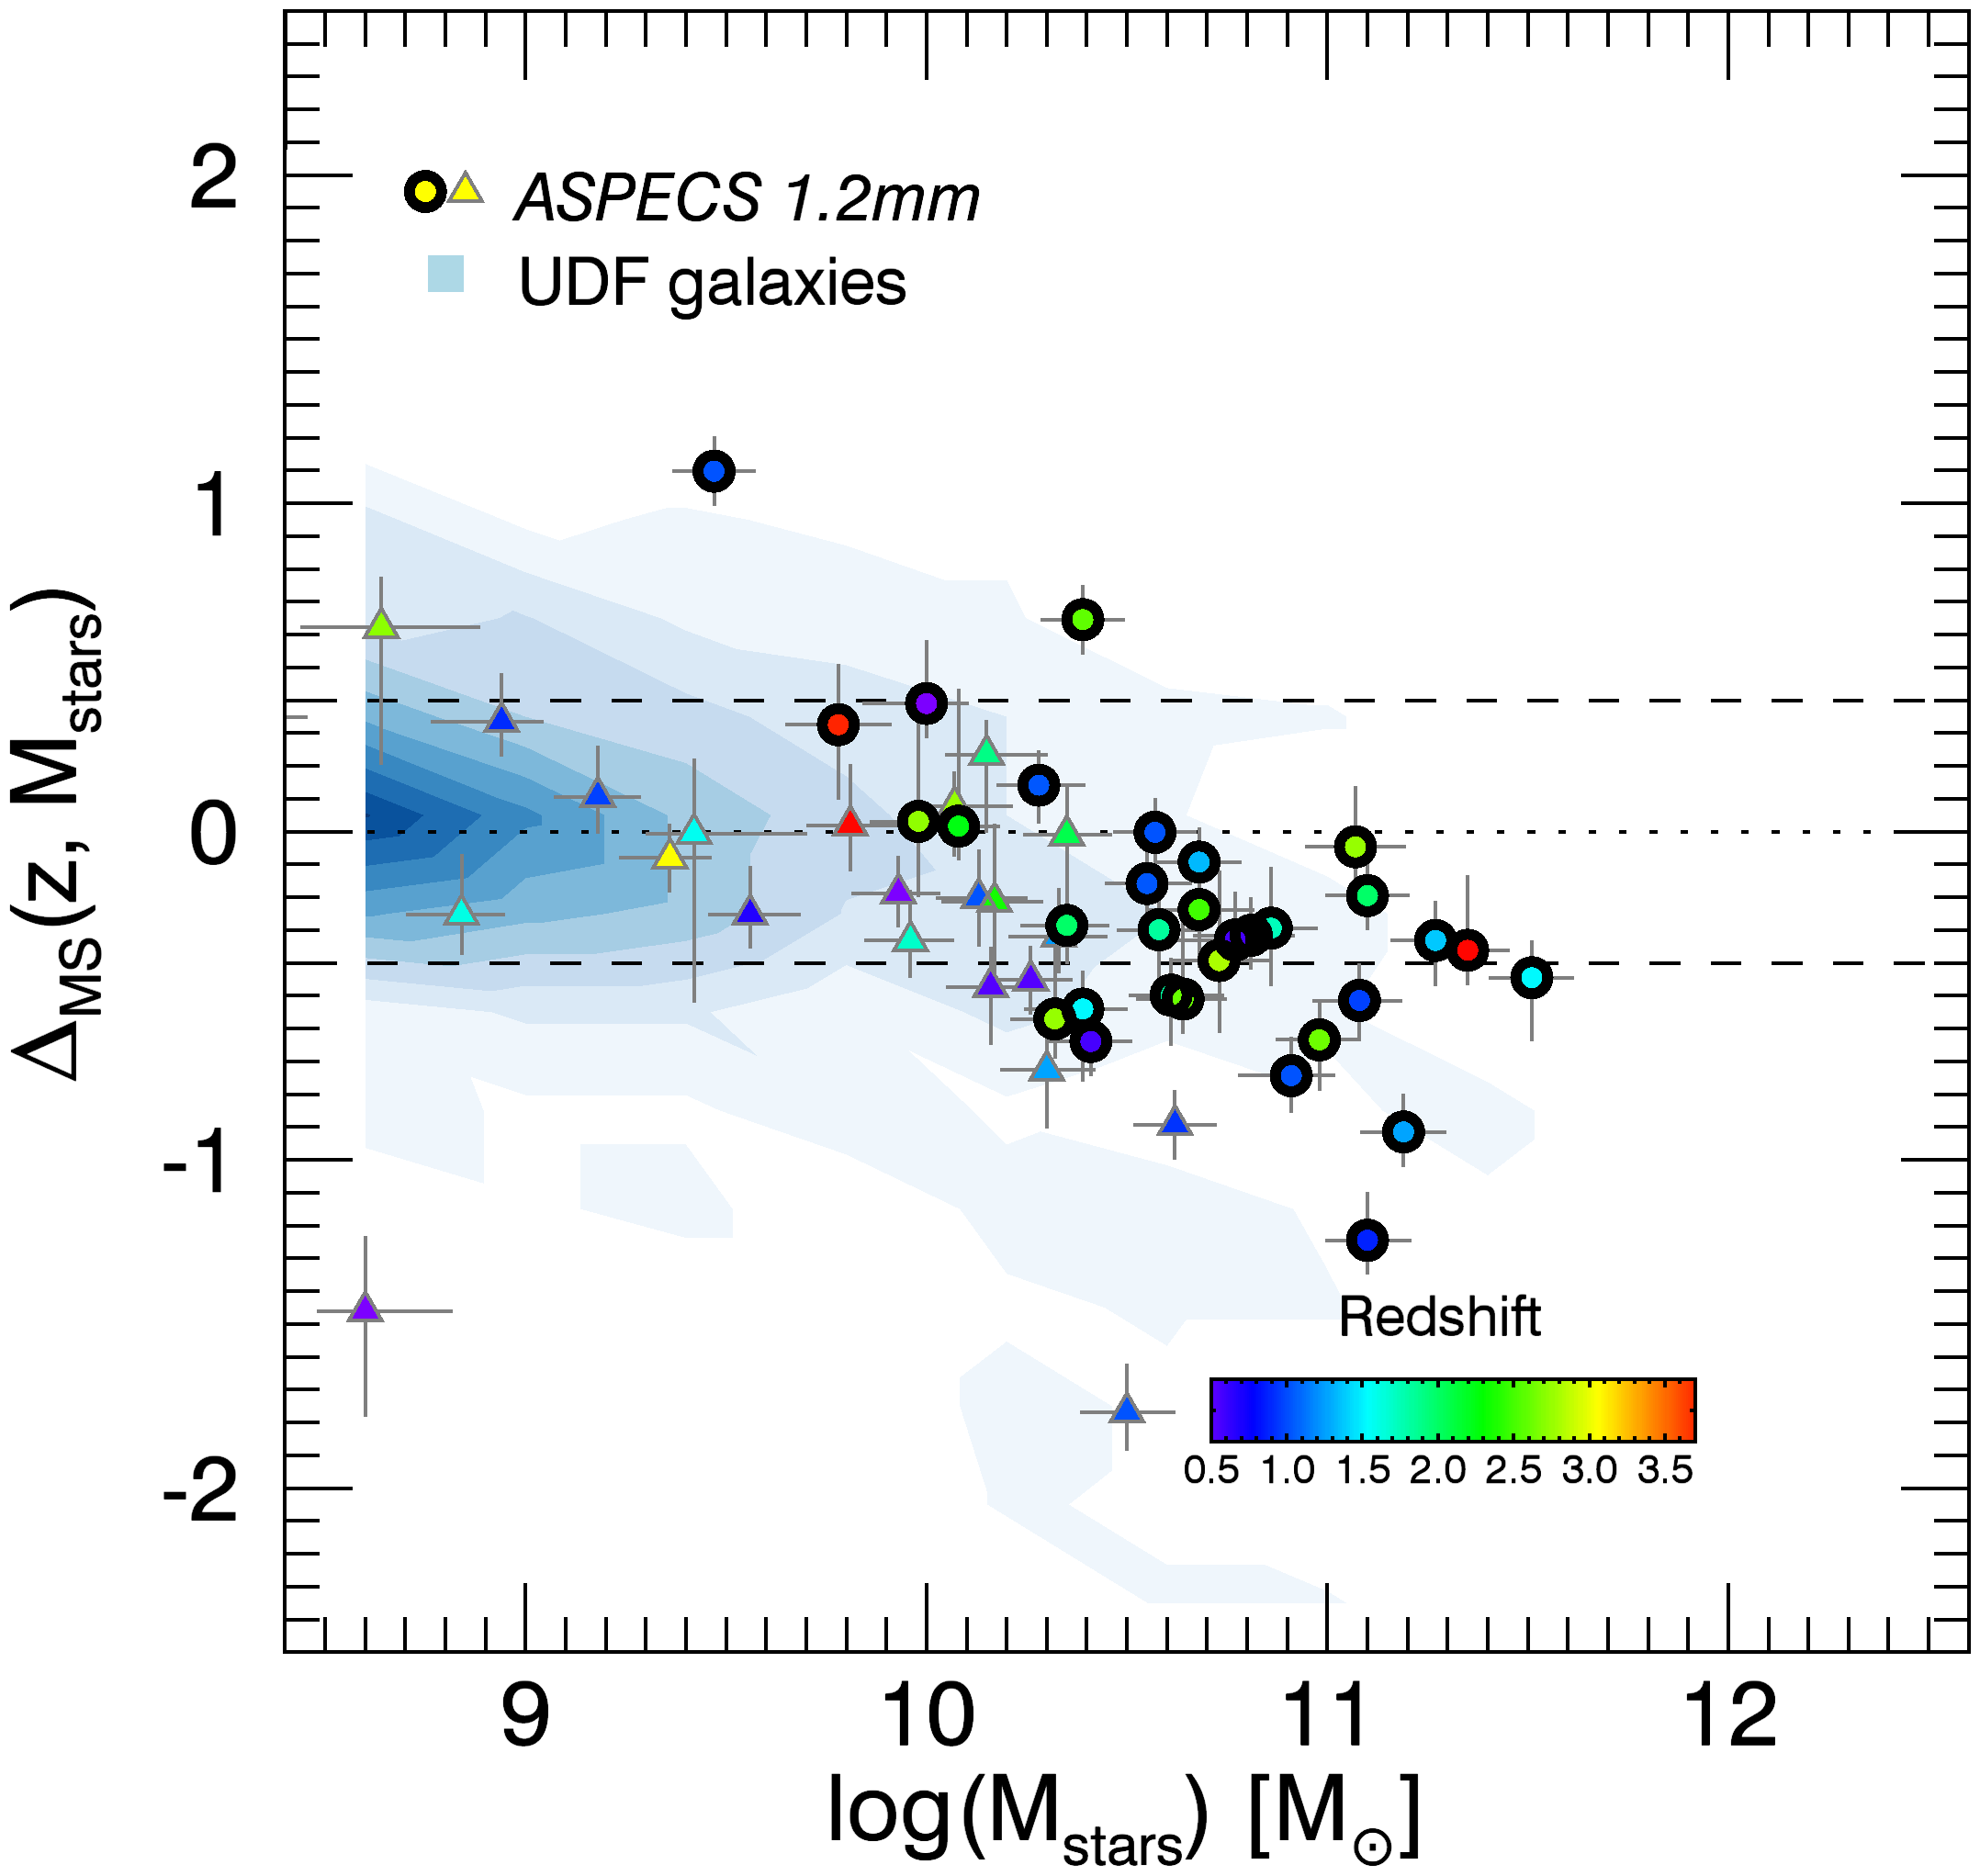
Based on the properties derived through SED fitting, we explore the location of our galaxies in the stellar mass versus SFR diagram. The left panel of Fig. 6 shows the comparison between the ASPECS sources and HUDF galaxies. The right panel of Fig. 6 shows the normalized specific SFR, representing the galaxies’ offset with respect to the star formation MS, using a prescription for its location as a function of redshift and stellar mass from Schreiber et al. (2015). Here, the specific SFR is defined as sSFR=SFR, and thus the offset from the MS is defined as .
We define the boundaries of the main sequence to be within dex from the prescription curves given by Schreiber et al. (2015). This selection is conservative, thus accounting for possible uncertainties on the stellar mass estimates. With this prescription, we find that most of the UDF galaxies are consistently located within the MS, well centered around the MS with a median and an interquartile range width of 0.31 dex.
We find that (19 out of the 32) of galaxies from the main sample lie within dex from the MS at the respective redshift and stellar mass. Furthermore, (2 out of 32) and (11 out of 32) of the ASPECS 1.2 mm galaxies are located above and below the MS, respectively. For the secondary sample, we find that , and (17, 2, and 6 sources) fall within, above, and below 0.4 dex from the MS, respectively, i.e., the percentages for secondary sample of ASPECS 1.2 mm galaxies are very similar to those obtained for the main sample. We note that the MS limits are broad, covering roughly an order of magnitude around the star-forming “sequence”. Thus, these results indicate that galaxies below the MS represent a non-negligible fraction of the dusty (gas-rich) galaxies in the ASPECS survey. Such below-MS galaxies, typically associated with “passive” (or even “quenched”) star formation activity, have so far been mostly ignored in observations of cold dust and molecular gas although significant progress has been made in recent years (e.g., Sargent et al., 2015; Suess et al., 2017; Spilker et al., 2018; Gobat et al., 2018; Bezanson et al., 2019).
The ASPECS 1.2 mm galaxies in the main sample show median and interquartile range width values of -0.30 and 0.51 dex, respectively. Similarly, the secondary sample shows median and interquartile width values of -0.19 and 0.40 dex, respectively. These values indicate that ASPECS 1.2 mm galaxies are systematically below the nominal MS prescription, with a wider distribution, contrary to the case of the UDF sample, which is well centered around the MS, and suggest the almost lack of an MS for these faint dusty galaxies.
Furthermore, we find a tendency of decreasing with increasing stellar mass, particularly for galaxies with stellar masses above , which tend to lie below the defined boundaries of the MS. The fractions of galaxies below the MS in this mass range are similar between the main and secondary sample. This could imply that the most massive ASPECS 1.2 mm galaxies are halting their SFR significantly, faster than field galaxies, while still retaining a significant amount of ISM dust and gas. This would be in line with observations of a flattening of the MS at the highest stellar masses111However, this effect could also be produced if the adopted MS prescription (Schreiber et al., 2015) does not apply to our sample in this stellar mass range, or if the derived SFR values for our galaxies are underestimated. To explore this, we first used the (different) MS prescription from Speagle et al. (2014), and found consistent results when compared to those obtained with the adopted MS prescription, even yielding systematically higher fractions of galaxies below the MS for both the ASPECS 1.2 mm galaxies and the UDF galaxies. Furthermore, with the adopted MS prescription the majority of the field galaxies fall very well aligned with the MS, and since the properties for the UDF and ASPECS galaxies were derived consistently, we do not expect unphysical systematic differences in the SFR values for the ASPECS sample..
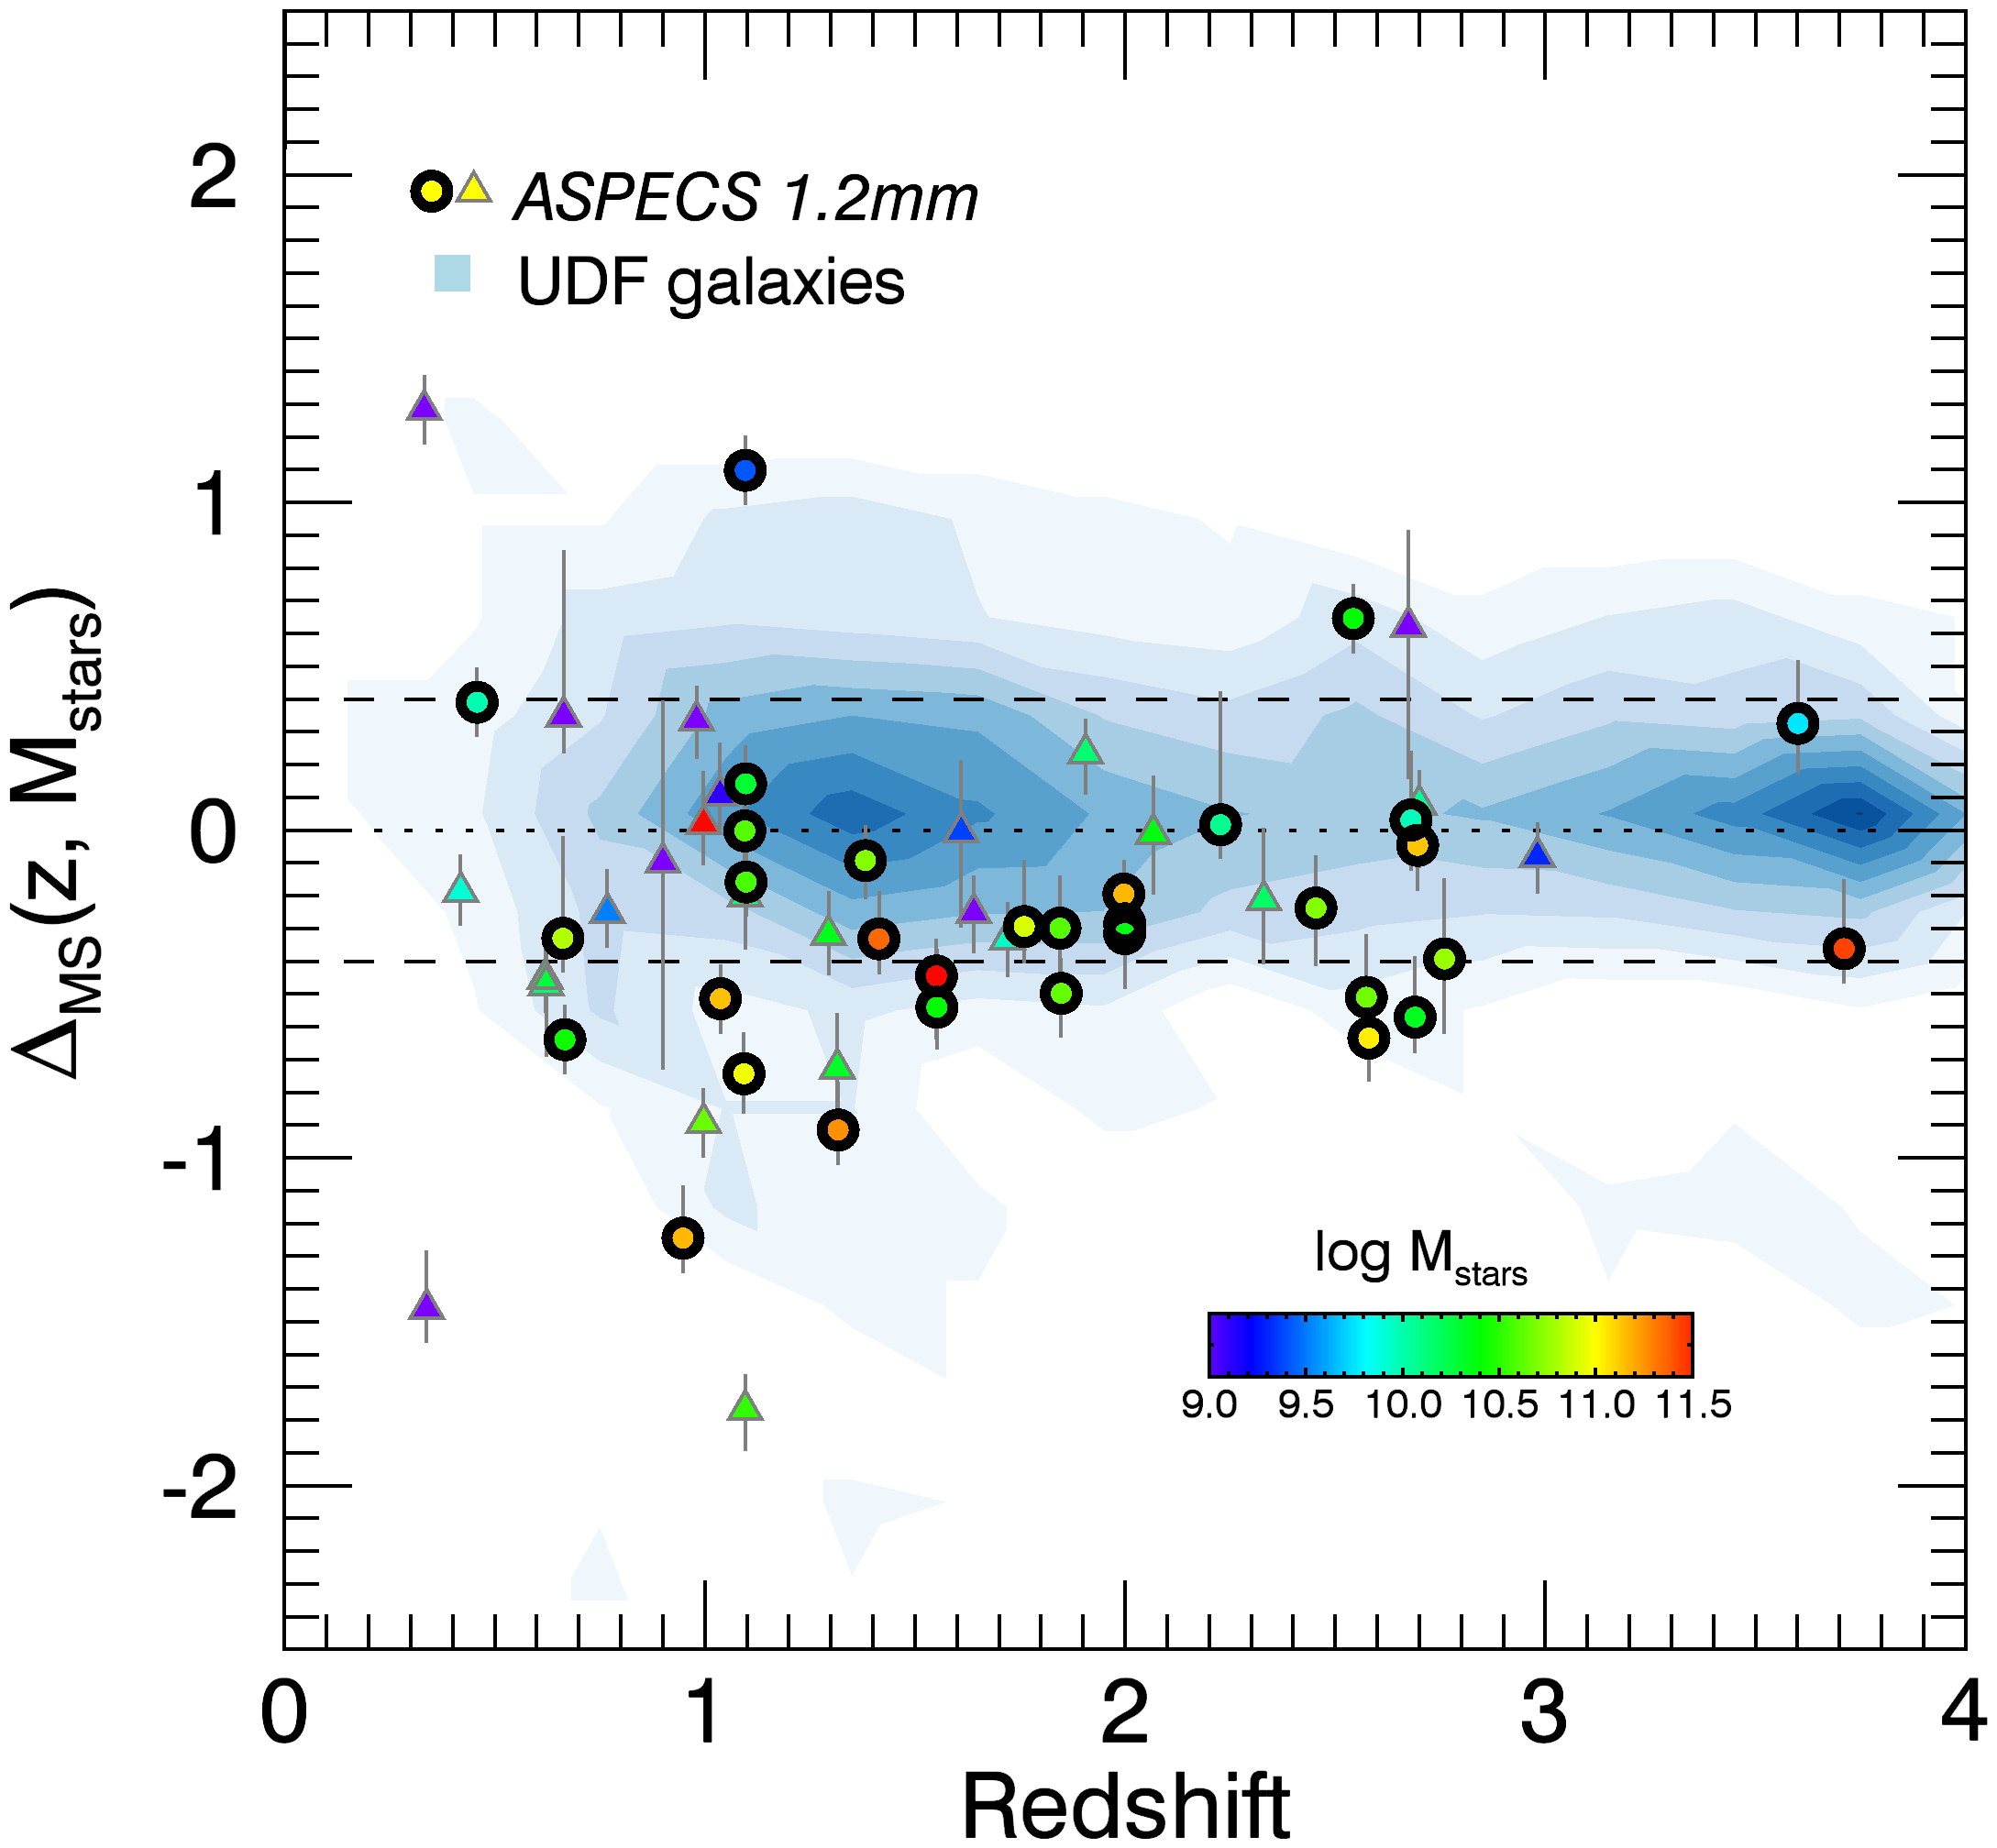
Figure 7 shows the evolution of with redshift. While the bulk of field galaxies show almost no evolution, there appears to be a mild tendency for the ASPECS 1.2 mm galaxies to have lower at decreasing redshifts. This pattern, however, could be produced by the low number of ASPECS 1.2 mm sources.
4.3 ISM molecular gas masses
The magphys SED fitting routine uses a prescription to balance the energy output at various wavelengths, thus producing estimates of the dust mass () based on the best SED fit model. For this estimation, magphys uses a two-component gray body dust SED with varying dust temperature and mass, and fixed dust emissivity indices and for the warm and cold dust components, respectively. Note that for the majority of our ASPECS galaxies there are Herschel far-IR measurements that improve greatly the completeness of the dust SED, providing better accuracy in the dust masses. Following the approach in Aravena et al. (2016a), we used this estimate along with an assumption of the molecular gas-to-dust ratio () to compute the molecular gas mass as .
For consistency with previous studies in the ASPECS series (e.g. Aravena et al., 2016b, 2019; Boogaard et al., 2019; Decarli et al., 2019), we fix and use this SED-based approach to compute the molecular gas masses for the ASPECS 1.2 mm continuum sample throughout. The computed masses are listed in Tables 2 and 4.
In the Appendix The ALMA Spectroscopic Survey in the Hubble Ultra Deep Field: The nature of the faintest dusty star-forming galaxies, we present a detailed comparison between three different estimates of the molecular gas mass for our sample (SED-based, 1.2-mm continuum, CO), and the effects of using a metallicity-dependent prescription for . Using either this later approach or any of the other methods yields molecular gas estimates that are well within the uncertainties of the measurements and thus fully consistent with the masses used here.
4.4 ISM properties
In the following, we study and place in context the ISM properties of the ASPECS 1.2 mm galaxies with respect to previous observations of distant galaxies.
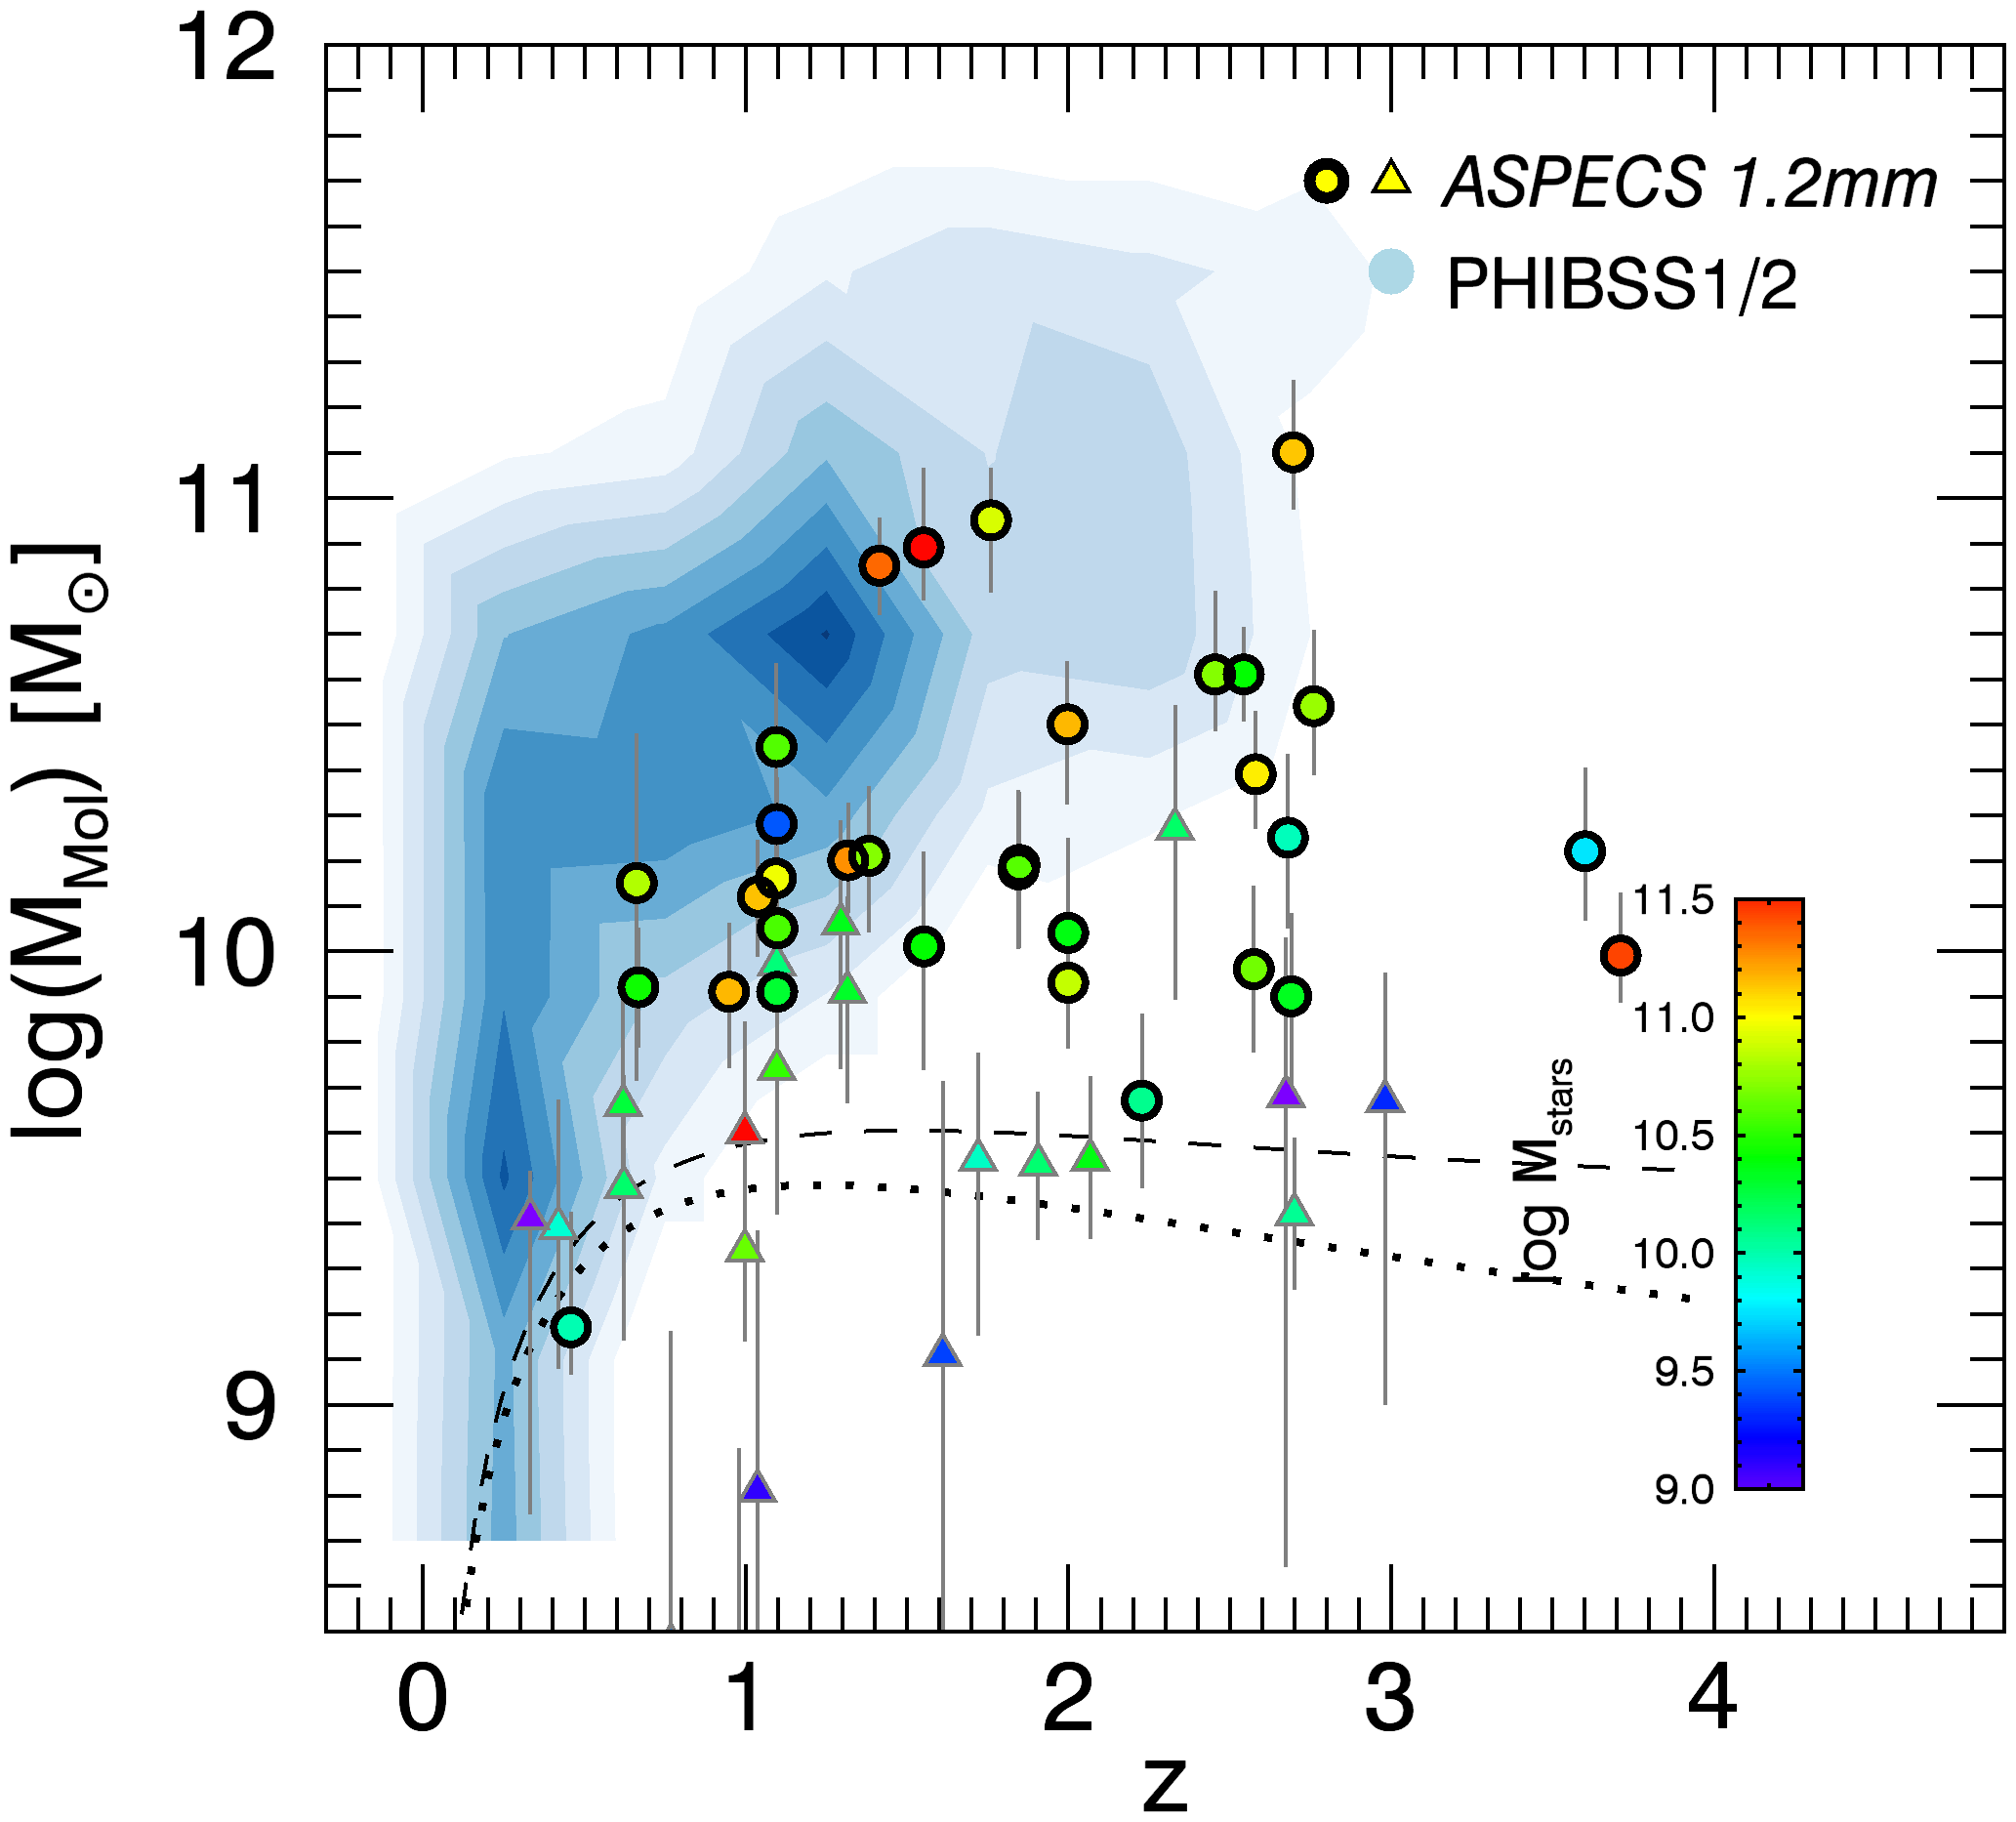
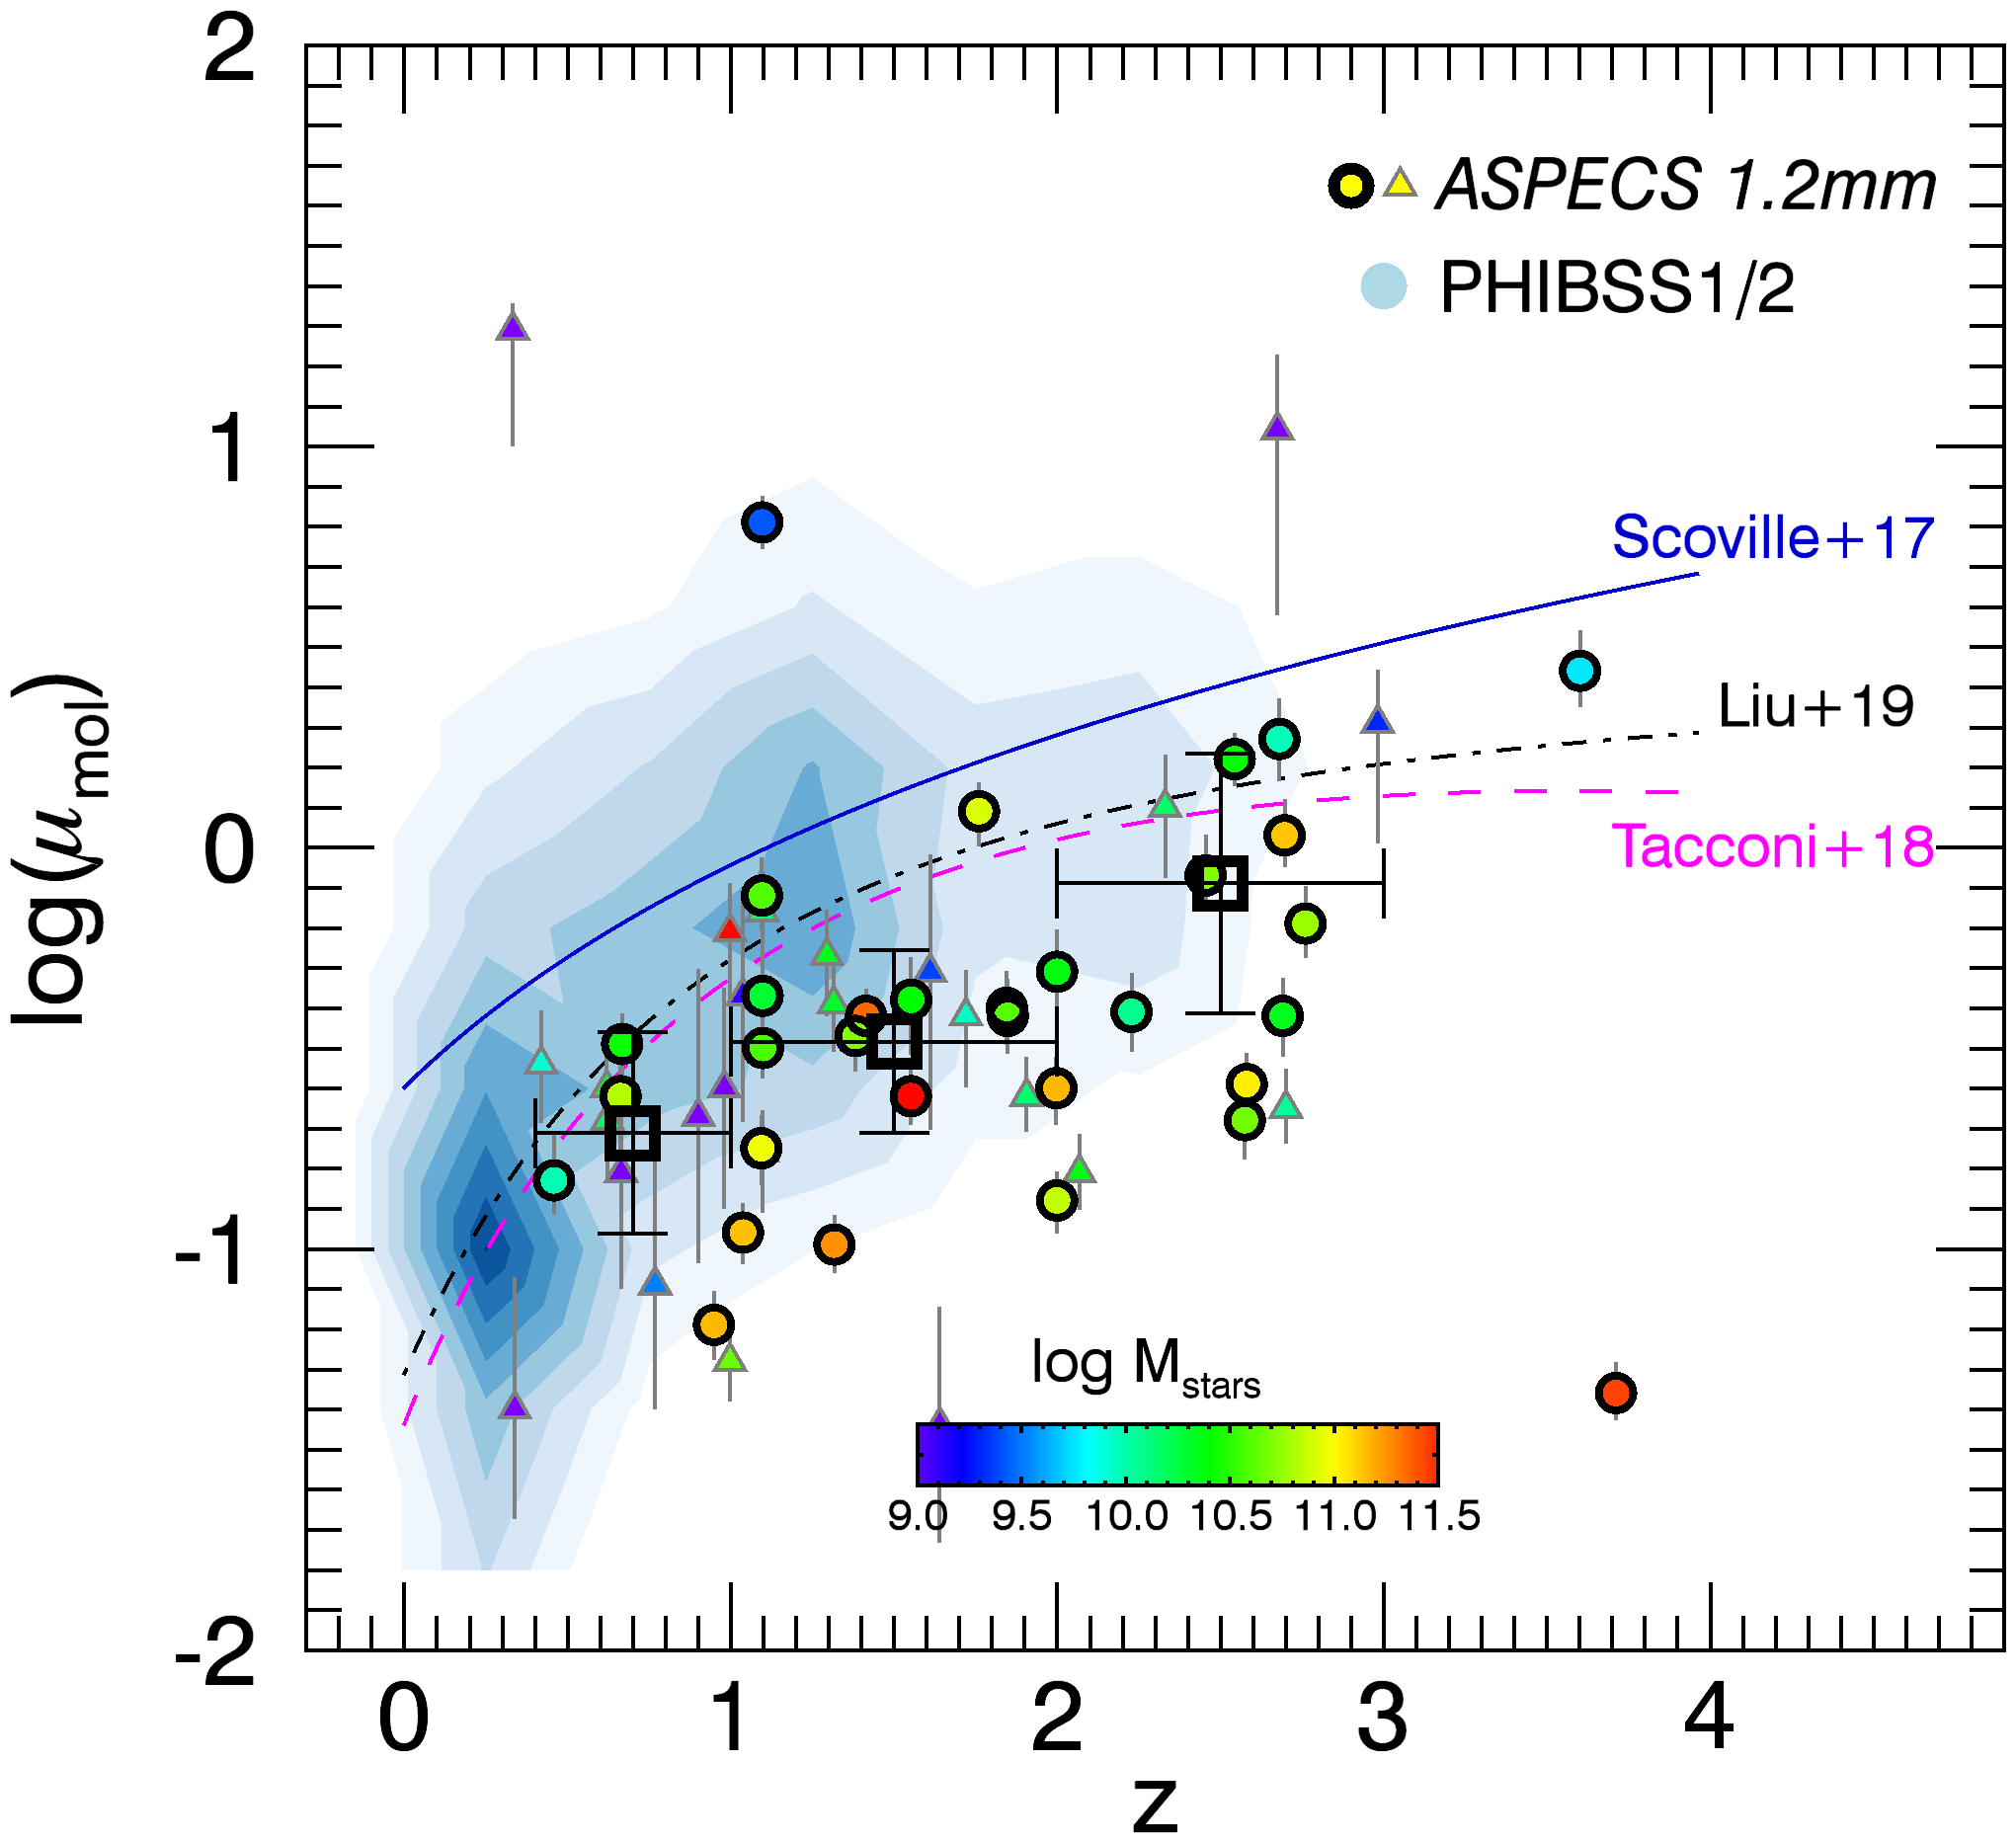
For comparison, we use the compilation of CO line and dust continuum measurements obtained by the IRAM Plateau de Bureau HIgh-z Blue Sequence Survey (PHIBSS; Tacconi et al., 2013) and PHIBSS2 (Tacconi et al., 2018; Freundlich et al., 2019). These provide stellar masses, SFRs, and molecular gas masses (from dust and CO observations) for a large sample of 1444 massive star-forming galaxies from to 4 (see also Liu et al., 2019). Figure 8 shows the molecular gas mass as a function of redshift for the ASPECS 1.2 mm galaxies compared to the PHIBSS1/2 sample. The galaxies detected by the ASPECS 1.2 mm survey have molecular gas masses well below the lower mass envelope of the PHIBSS1/2 sample in this plane. This means that the ASPECS observations reach galaxies with lower molecular gas masses, with a well described selection function as shown by the dashed and dotted lines in this plot.
The relationship between the SFR and molecular gas mass in galaxies is usually termed the global “Schmidt-Kennicutt” (SK) relation or “star-formation” law and exposes the intimate interplay between star formation and molecular gas. The ratio between these two quantities is usually referred to as ‘star formation efficiency’, defined as SFESFR/. The inverse of this relation, typically termed as the gas depletion timescale and defined as /SFR, is rendered as the time necessary to exhaust all molecular gas reservoir in the galaxy at the current SFR in the absence of feedback mechanisms.
Another key parameter corresponds to the molecular gas fraction, , which corresponds to the fraction of baryons contained in the form of molecular gas in a galaxy. For simplicity and for consistency in the comparison with earlier work, hereafter we conduct our analysis using the molecular-gas-to-stellar-mass ratio, .
Both parameters, and (or ) are thought to follow scaling relations with redshift, sSFR, and stellar mass, as determined from previous targeted star-forming galaxies (e.g. Daddi et al., 2010b; Tacconi et al., 2010, 2013, 2018; Genzel et al., 2015; Scoville et al., 2017; Liu et al., 2019).
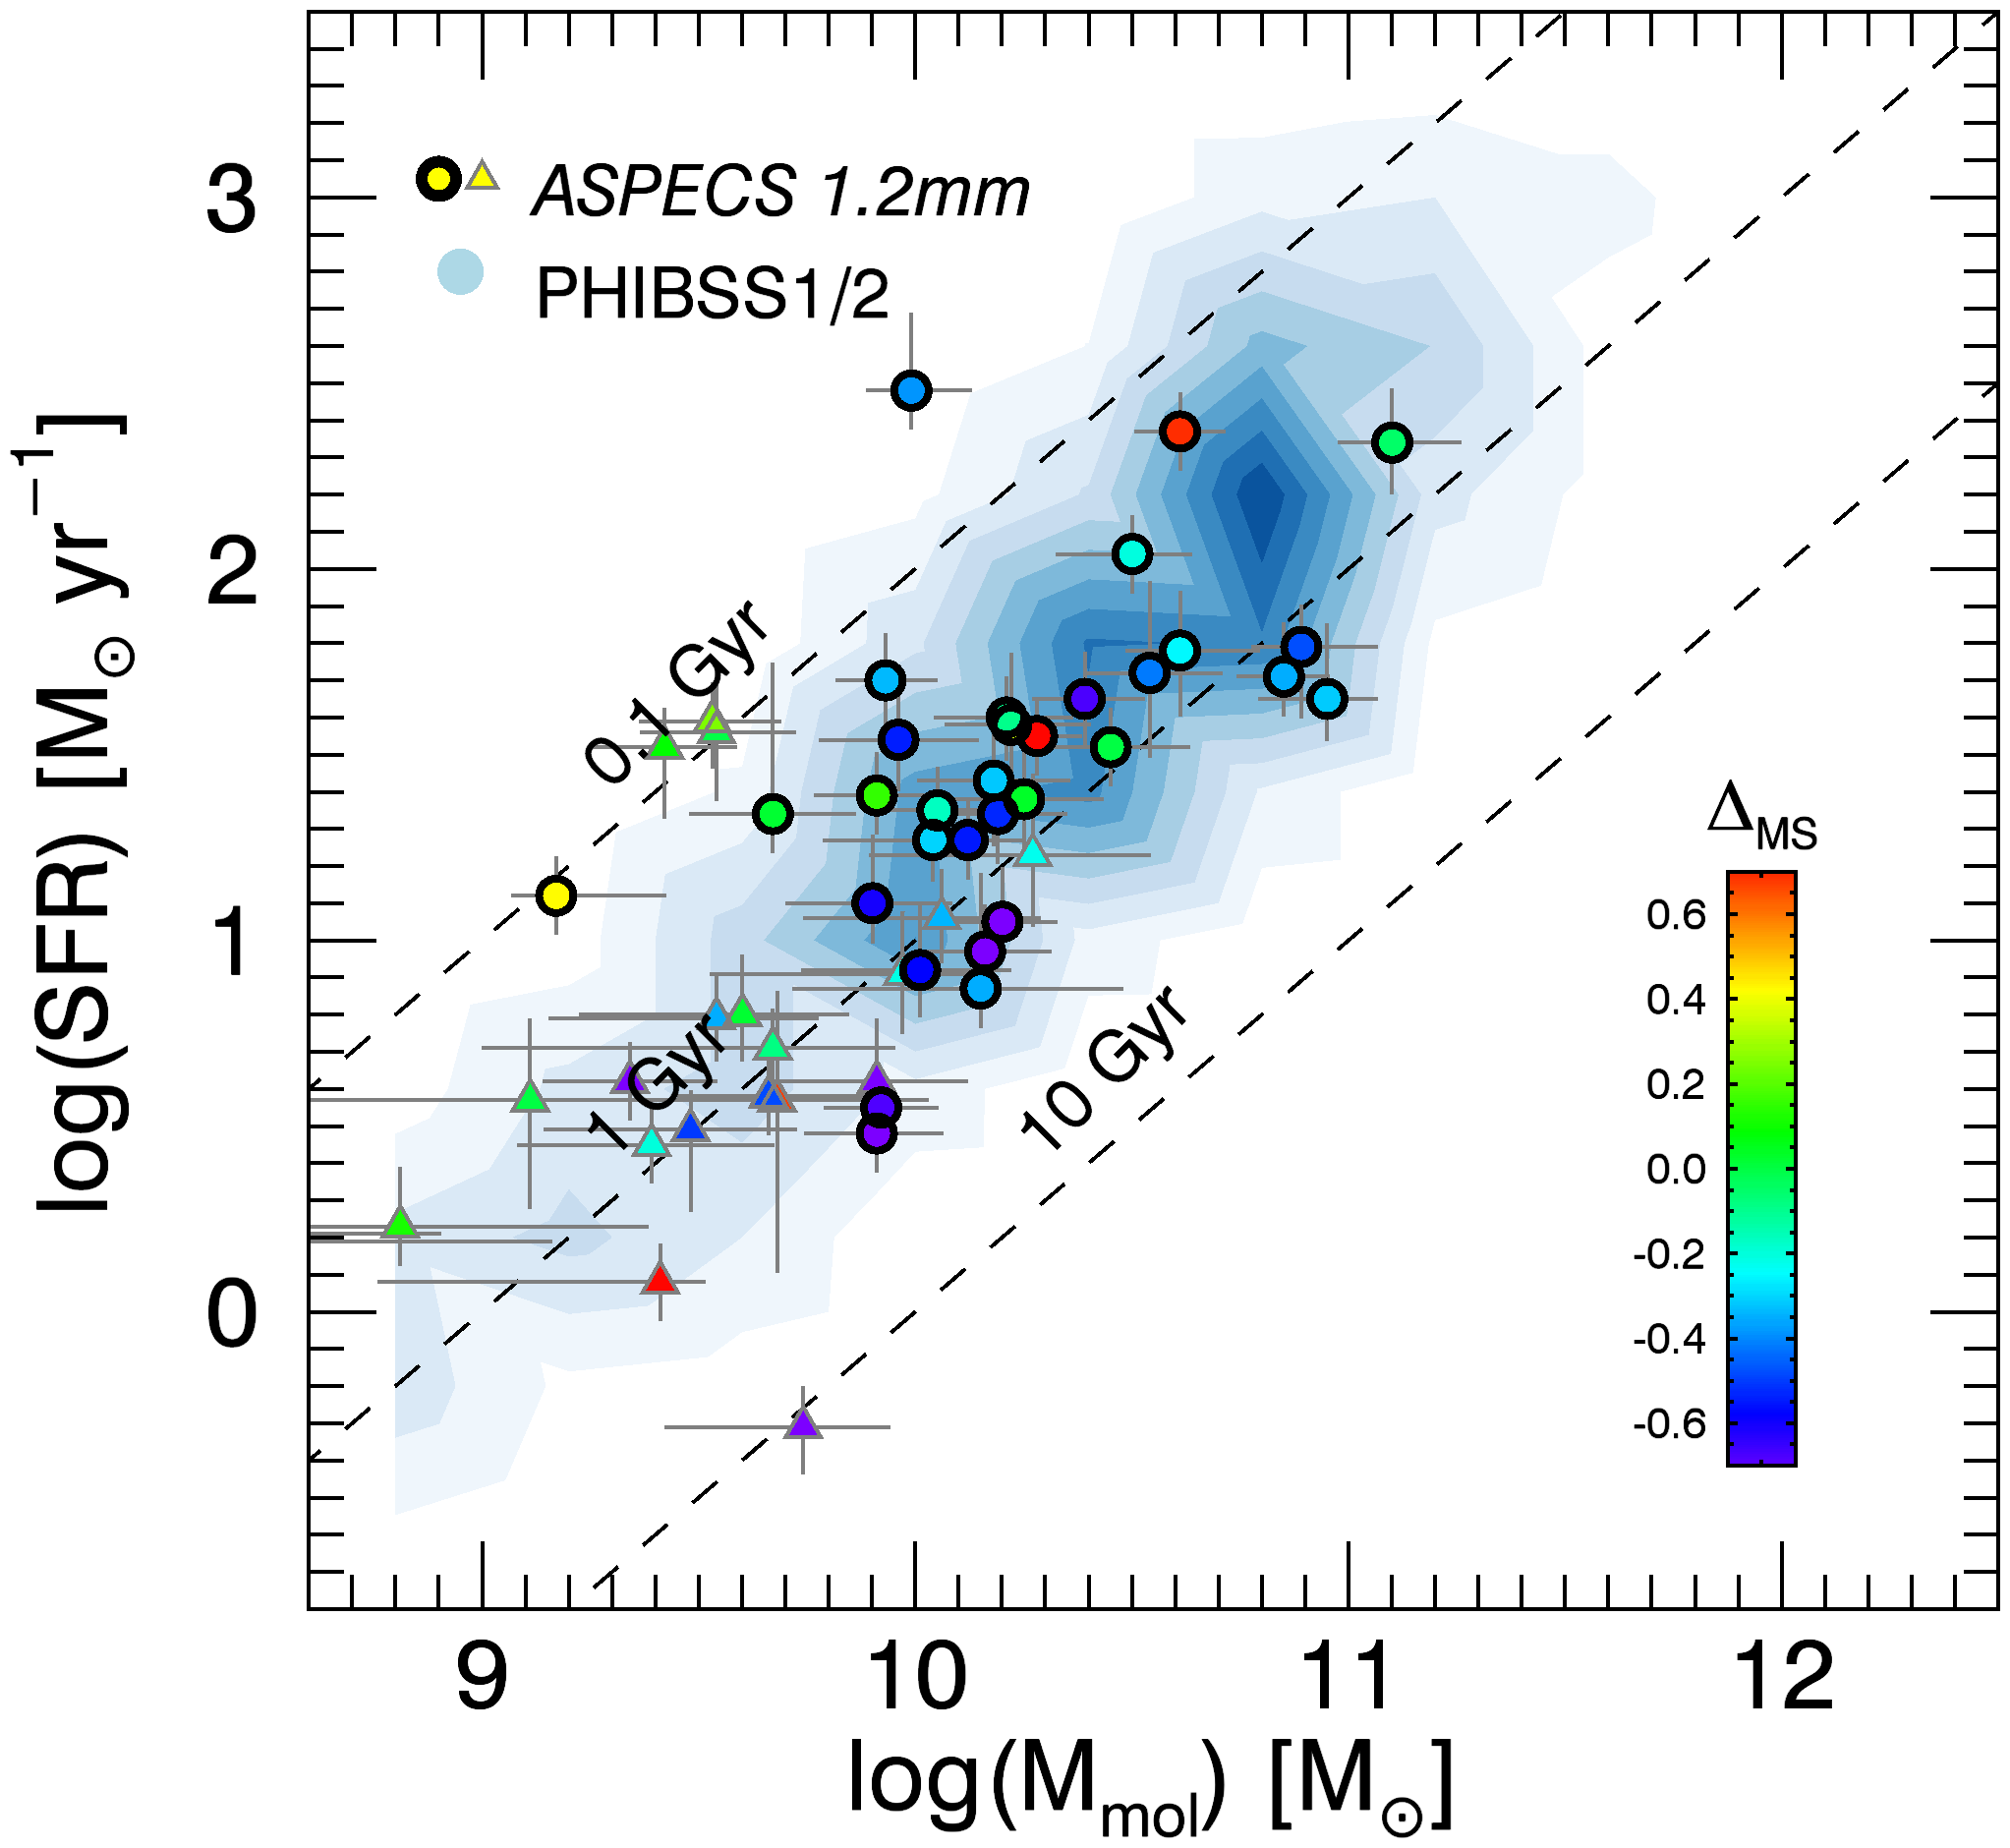
Figure 9 shows the SFR as a function of Mmol (global SK plot) for the ASPECS 1.2 mm galaxies compared to the PHIBSS1/2 sample. The coloring of each point represents the normalized sSFR or offset from the MS, and the dashed lines show the location of constant molecular gas depletion timescales. Most ASPECS 1.2 mm galaxies in the main sample are located slightly above the line of Gyr, consistent with the location of the PHIBSS1/2 sources. Only one of the ASPECS sources is consistent with gas depletion timescales shorter than 0.1 Gyr. The secondary sample shows a large scatter in gas depletion timescales with sources spanning the full range from 0.1 to 10 Gyr, although most of them are consistent with Gyr.
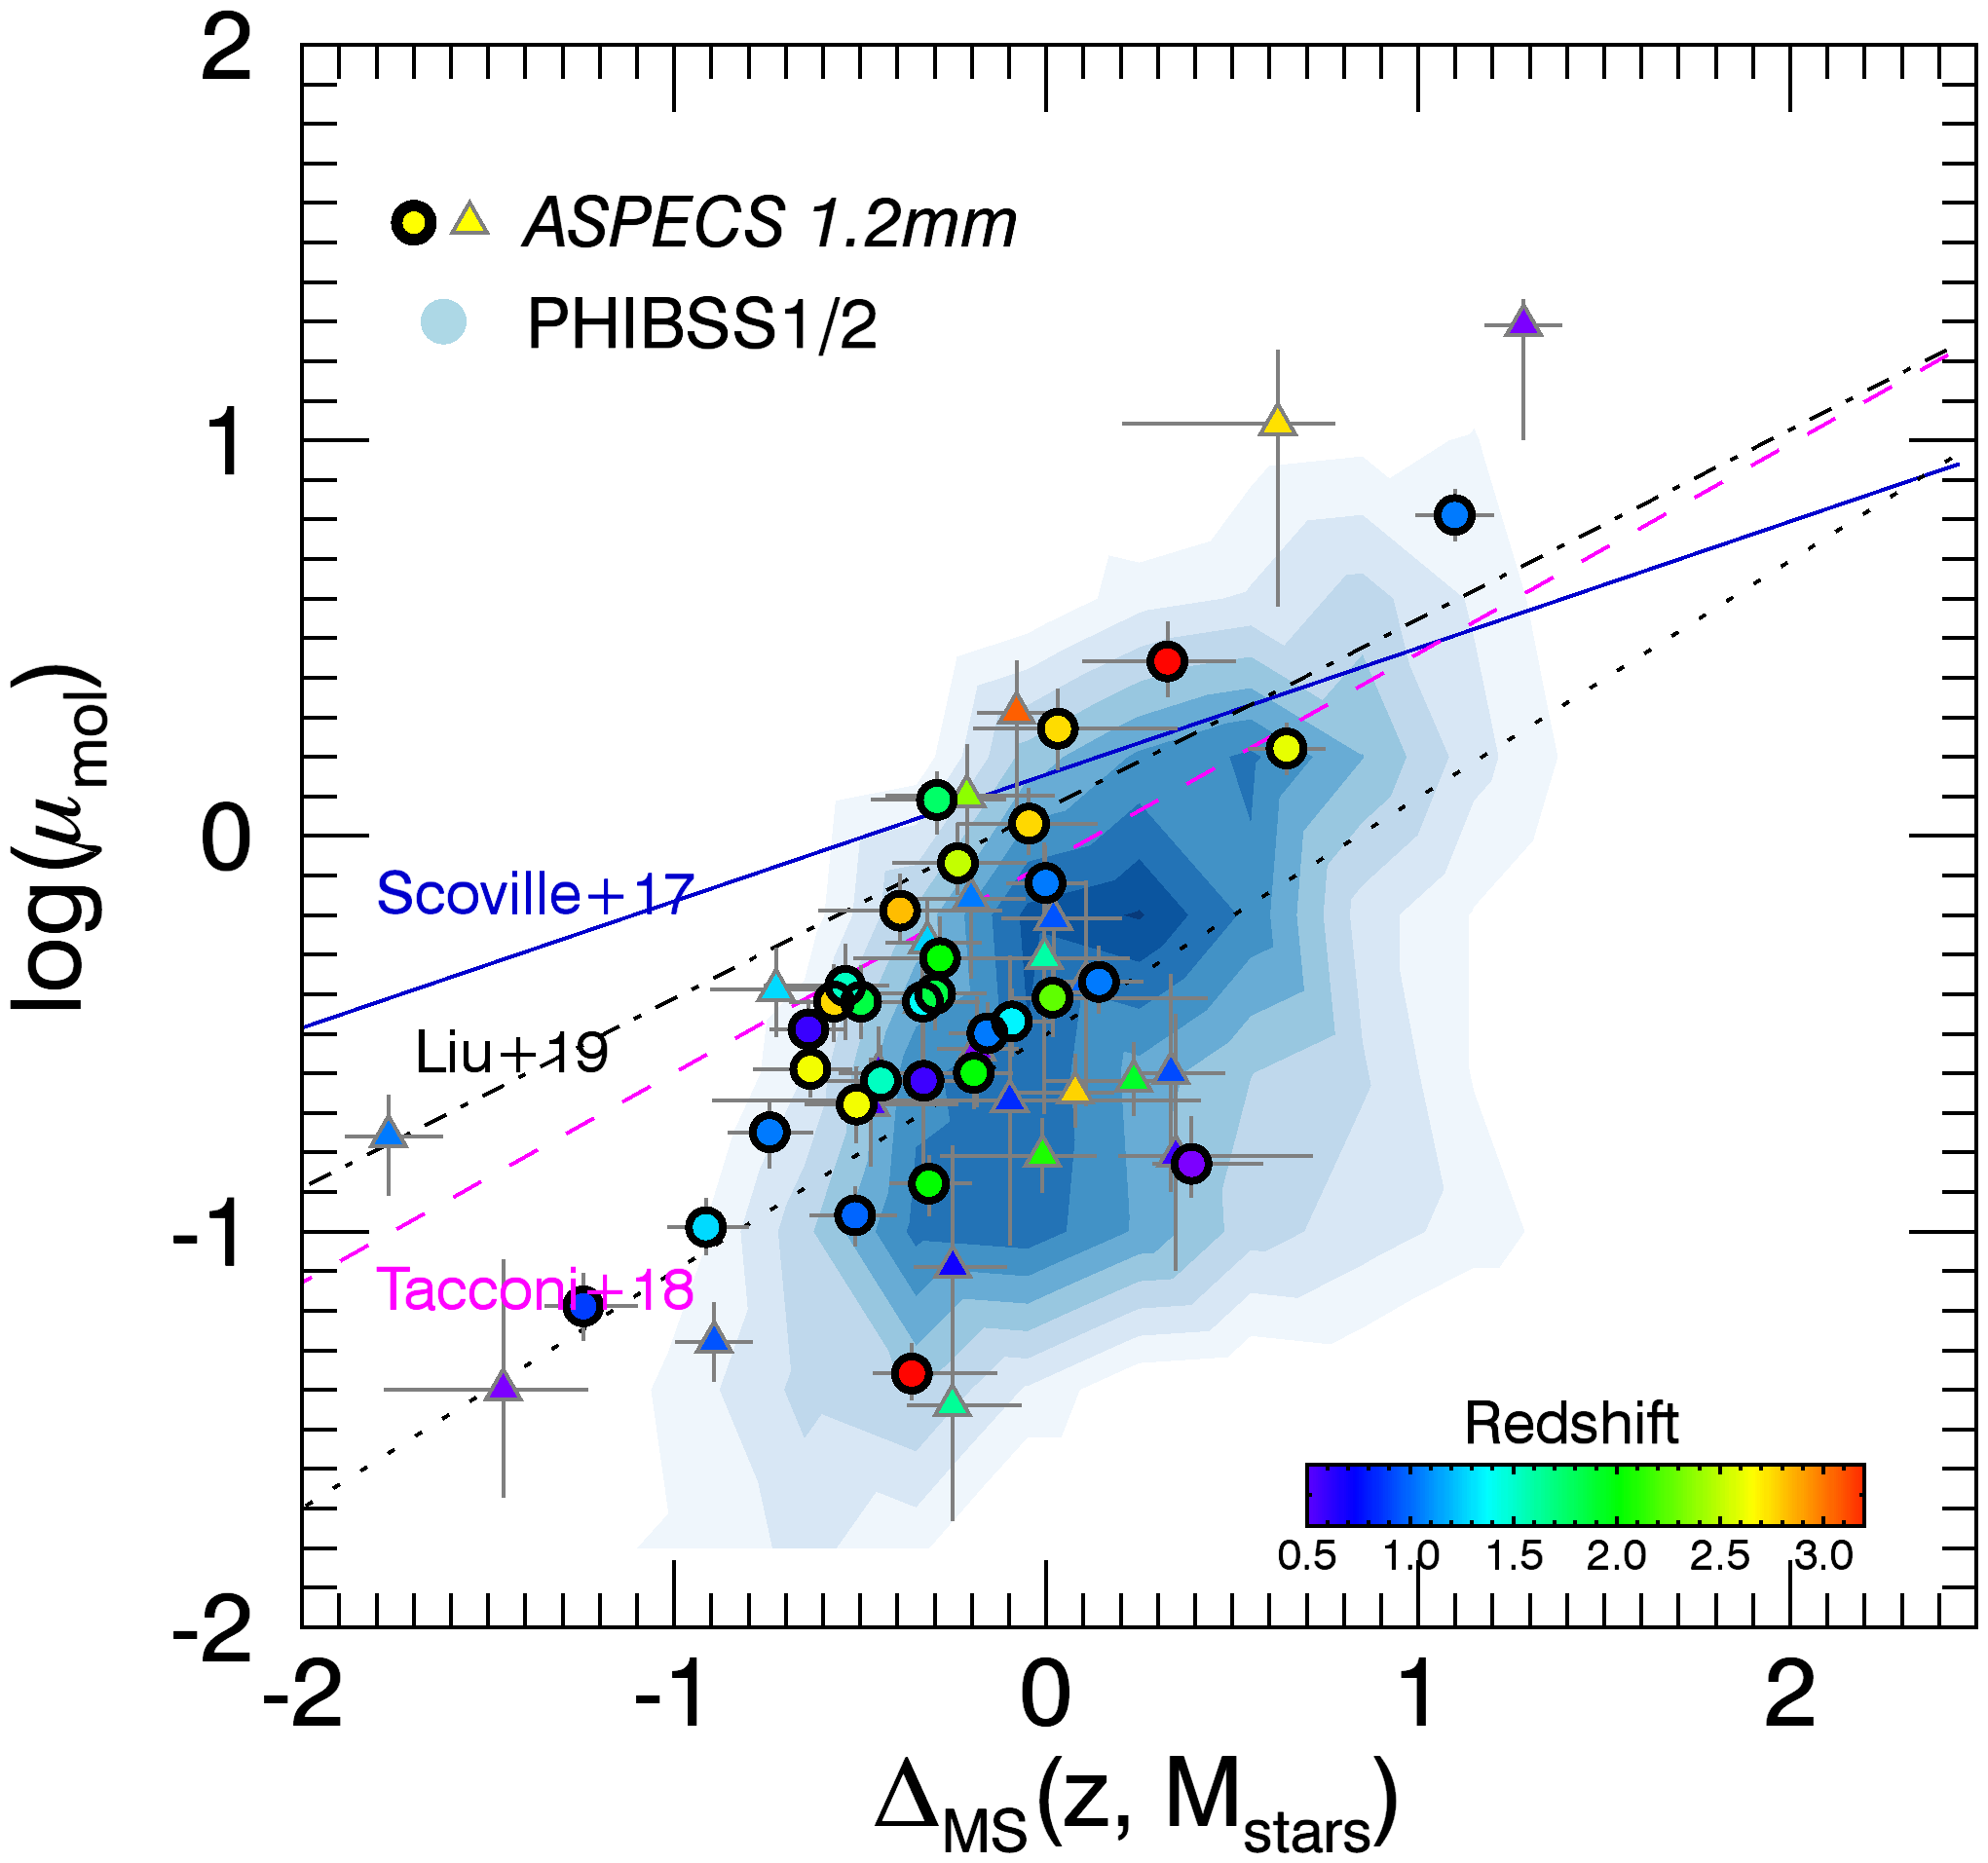
The left panel of Fig. 10 shows the molecular-gas-to-stellar-mass ratio () versus the offset from the MS (). The ASPECS 1.2 mm galaxies in the main sample follow the PHIBSS1/2 sources and the expected scaling relations for their typical mass and redshift (Liu et al., 2019), where galaxies show an increasing with increasing . It is interesting to note that those galaxies with show molecular-gas-to-stellar-mass ratios of (or molecular gas fractions ), consistent with recent measurements based on CO line emission in individual “quenched” galaxies and post-starbursts (e.g., Sargent et al., 2015; Suess et al., 2017; Spilker et al., 2018; Gobat et al., 2018; Bezanson et al., 2019). This indicates that galaxies below the MS have already exhausted a significant part of their molecular gas reservoirs and are in the process of being quenched.
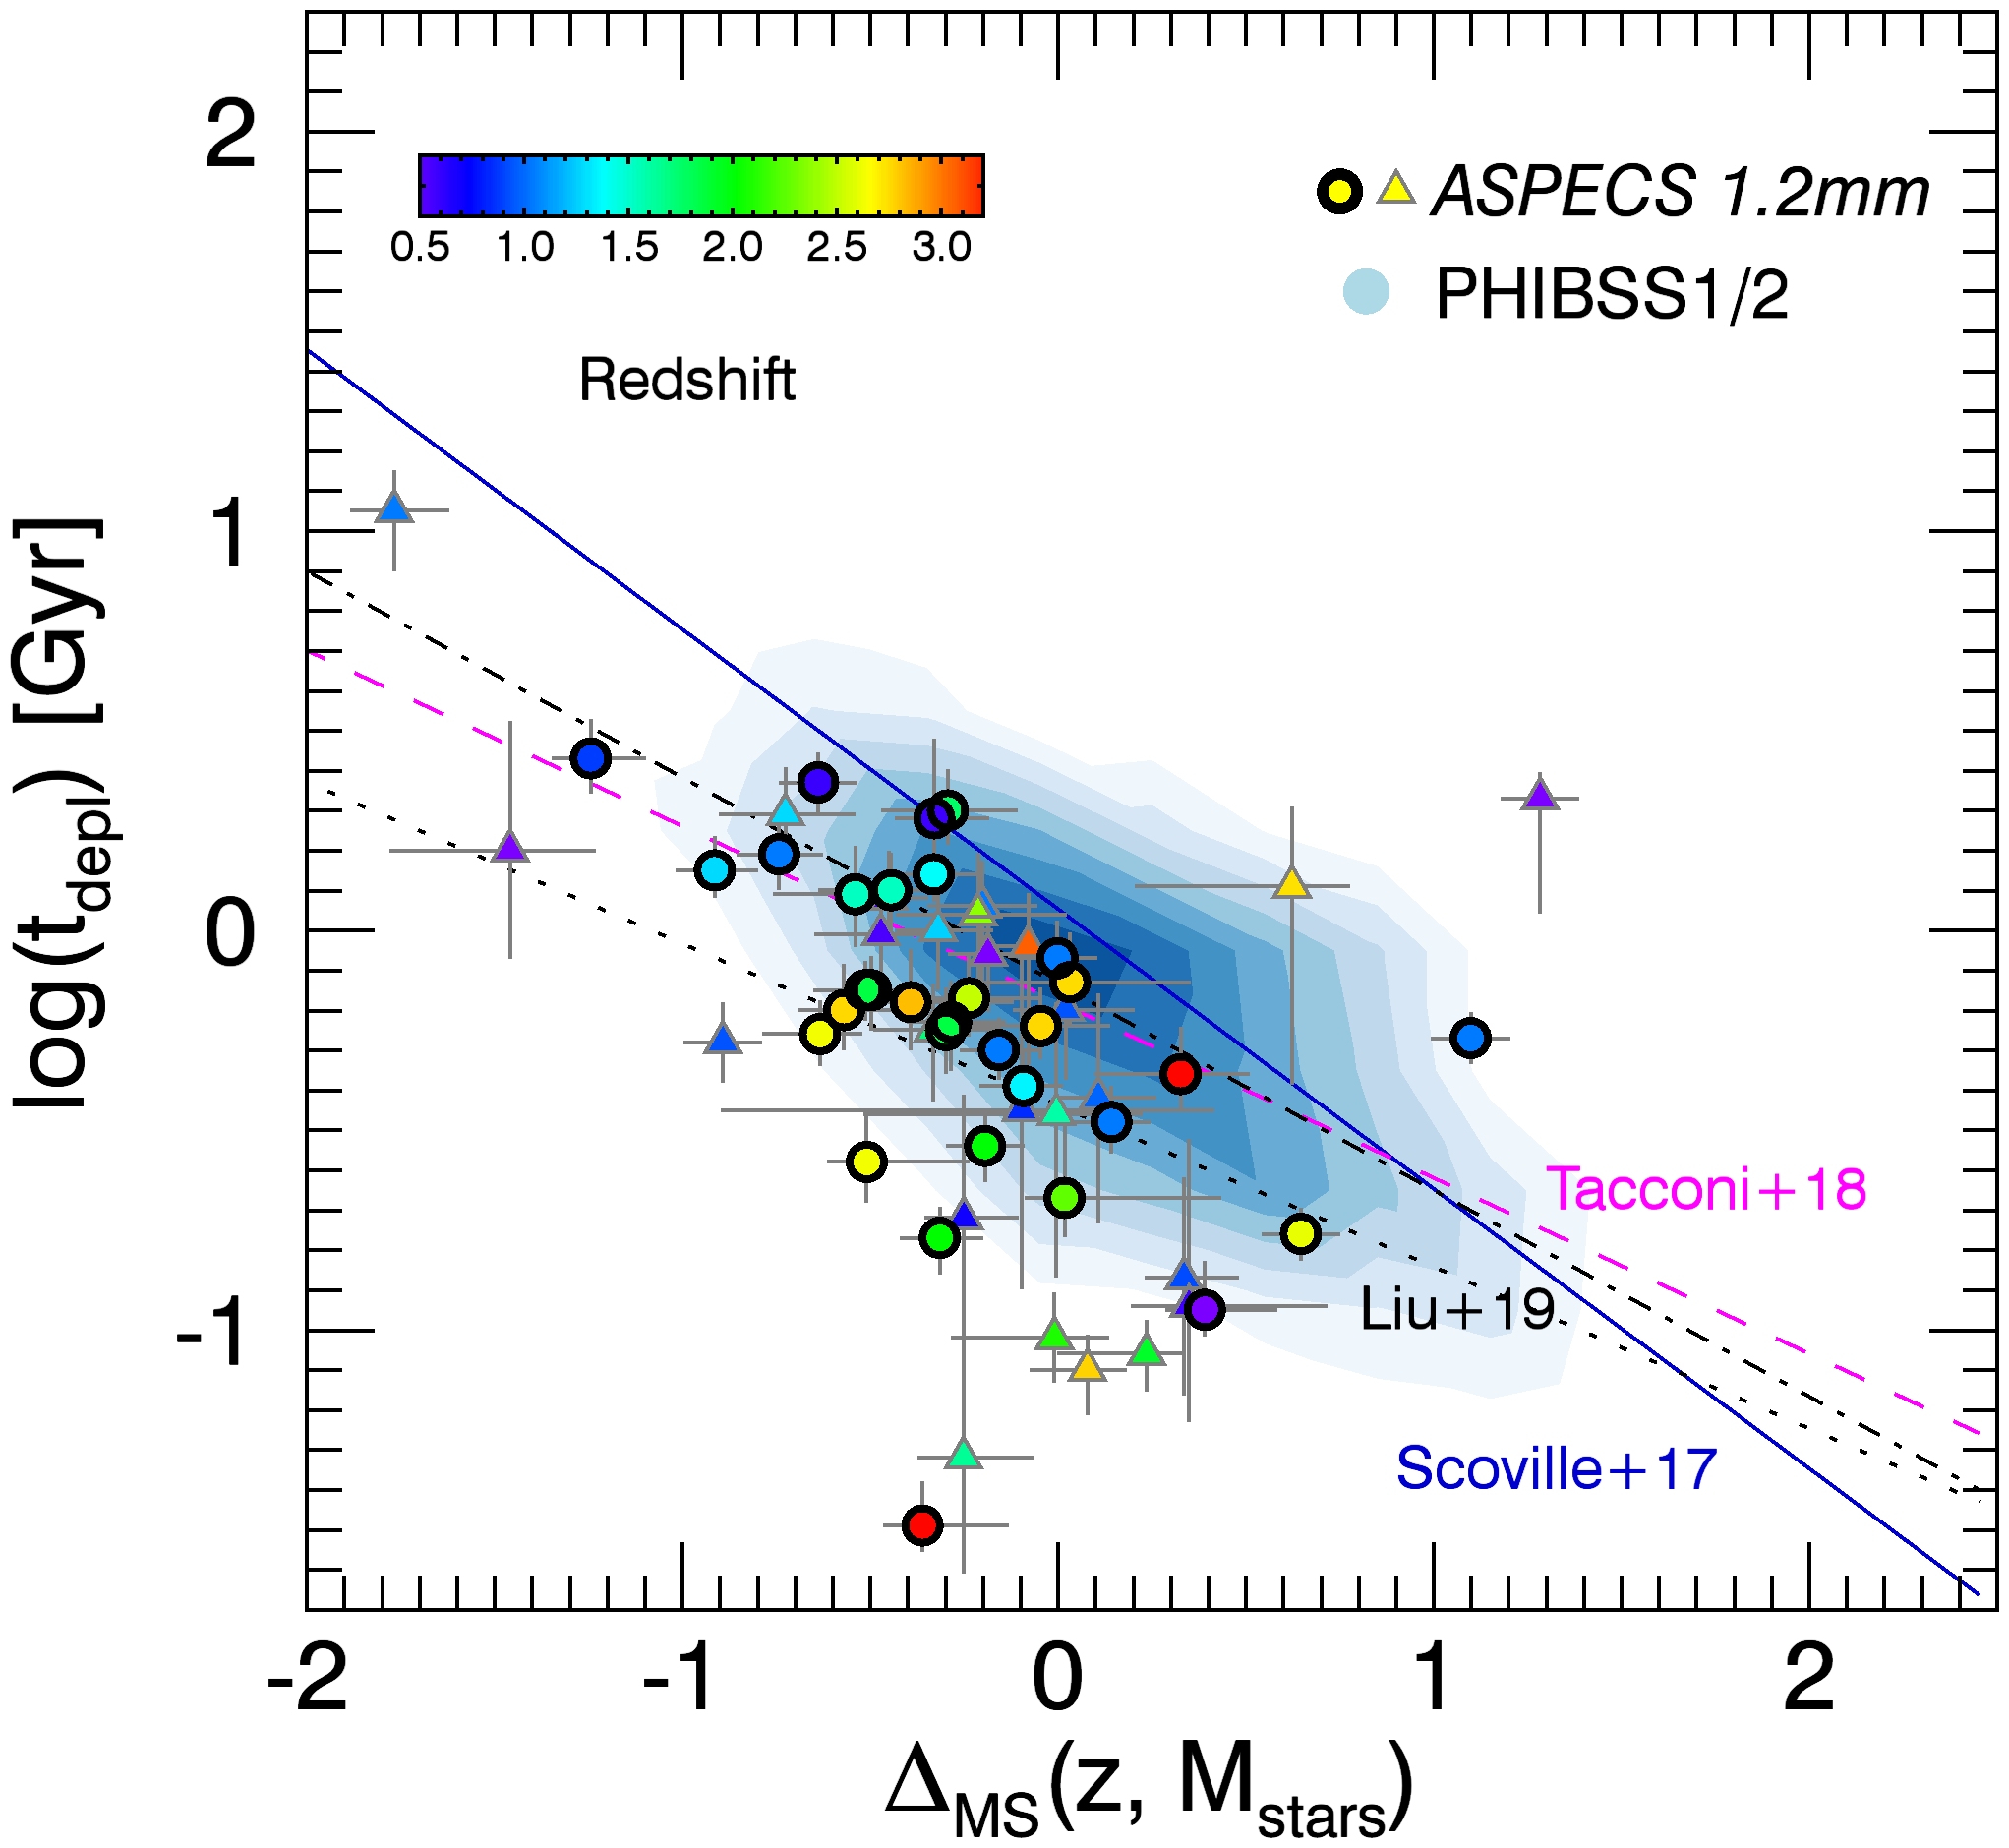
The right panel of Fig. 10 shows the molecular gas depletion timescale versus . As with , the majority of the ASPECS 1.2 mm galaxies in the main sample tend to form a sequence in this plane, where galaxies with larger positive offsets from the MS tend to have shorter depletion timescales and thus are consistent with a “starburst” mode of star formation, and conversely, galaxies with negative offsets from the MS have longer depletion timescales. The ASPECS 1.2 mm galaxies are in agreement with the bulk of literature PHIBSS1/2 sources in this plane and follow closely the scaling relations predicted for their range of stellar masses and redshift (e.g., Liu et al., 2019). As predicted from the scaling relations, the galaxies with show molecular gas depletion timescales of Gyr.
| ID | SFR | |||||||||
|---|---|---|---|---|---|---|---|---|---|---|
| (AB mag) | ( yr) | () | (K) | () | () | () | () | |||
| (1) | (2) | (3) | (4) | (5) | (6) | (7) | (8) | (9) | (10) | (11) |
| C01 | 2.543 | 23.2 | ||||||||
| C02 | 1.760 | 23.1 | ||||||||
| C03 | 1.414 | 22.2 | ||||||||
| C04 | 2.454 | 25.2 | ||||||||
| C05 | 1.551 | 21.7 | ||||||||
| C06 | 2.696 | 24.6 | ||||||||
| C07 | 2.580 | 23.3 | ||||||||
| C08 | 3.711 | 23.6 | ||||||||
| C09 | 3.601 | 25.2 | ||||||||
| C10 | 1.997 | 21.6 | ||||||||
| C11 | 2.760 | 24.2 | ||||||||
| C12 | 1.096 | 23.4 | ||||||||
| C13 | 1.037 | 21.8 | ||||||||
| C14a | 1.999 | 23.6 | ||||||||
| C14b | 1.999 | 22.7 | ||||||||
| C15 | 1.317 | 21.4 | ||||||||
| C16 | 1.095 | 20.8 | ||||||||
| C17 | 1.848 | 22.4 | ||||||||
| C18 | 1.845 | 22.0 | ||||||||
| C19 | 2.574 | 23.1 | ||||||||
| C20 | 1.093 | 21.4 | ||||||||
| C21 | 2.690 | 23.7 | ||||||||
| C22 | 1.097 | 21.3 | ||||||||
| C23 | 1.382 | 21.3 | ||||||||
| C24 | 2.680 | 24.4 | ||||||||
| C25 | 1.098 | 21.6 | ||||||||
| C26 | 1.552 | 22.9 | ||||||||
| C28 | 0.662 | 19.5 | ||||||||
| C30 | 0.458 | 20.4 | ||||||||
| C31 | 2.227 | 22.6 | ||||||||
| C32 | 0.667 | 21.8 | ||||||||
| C33 | 0.948 | 20.1 |
4.5 Evolution of the ISM
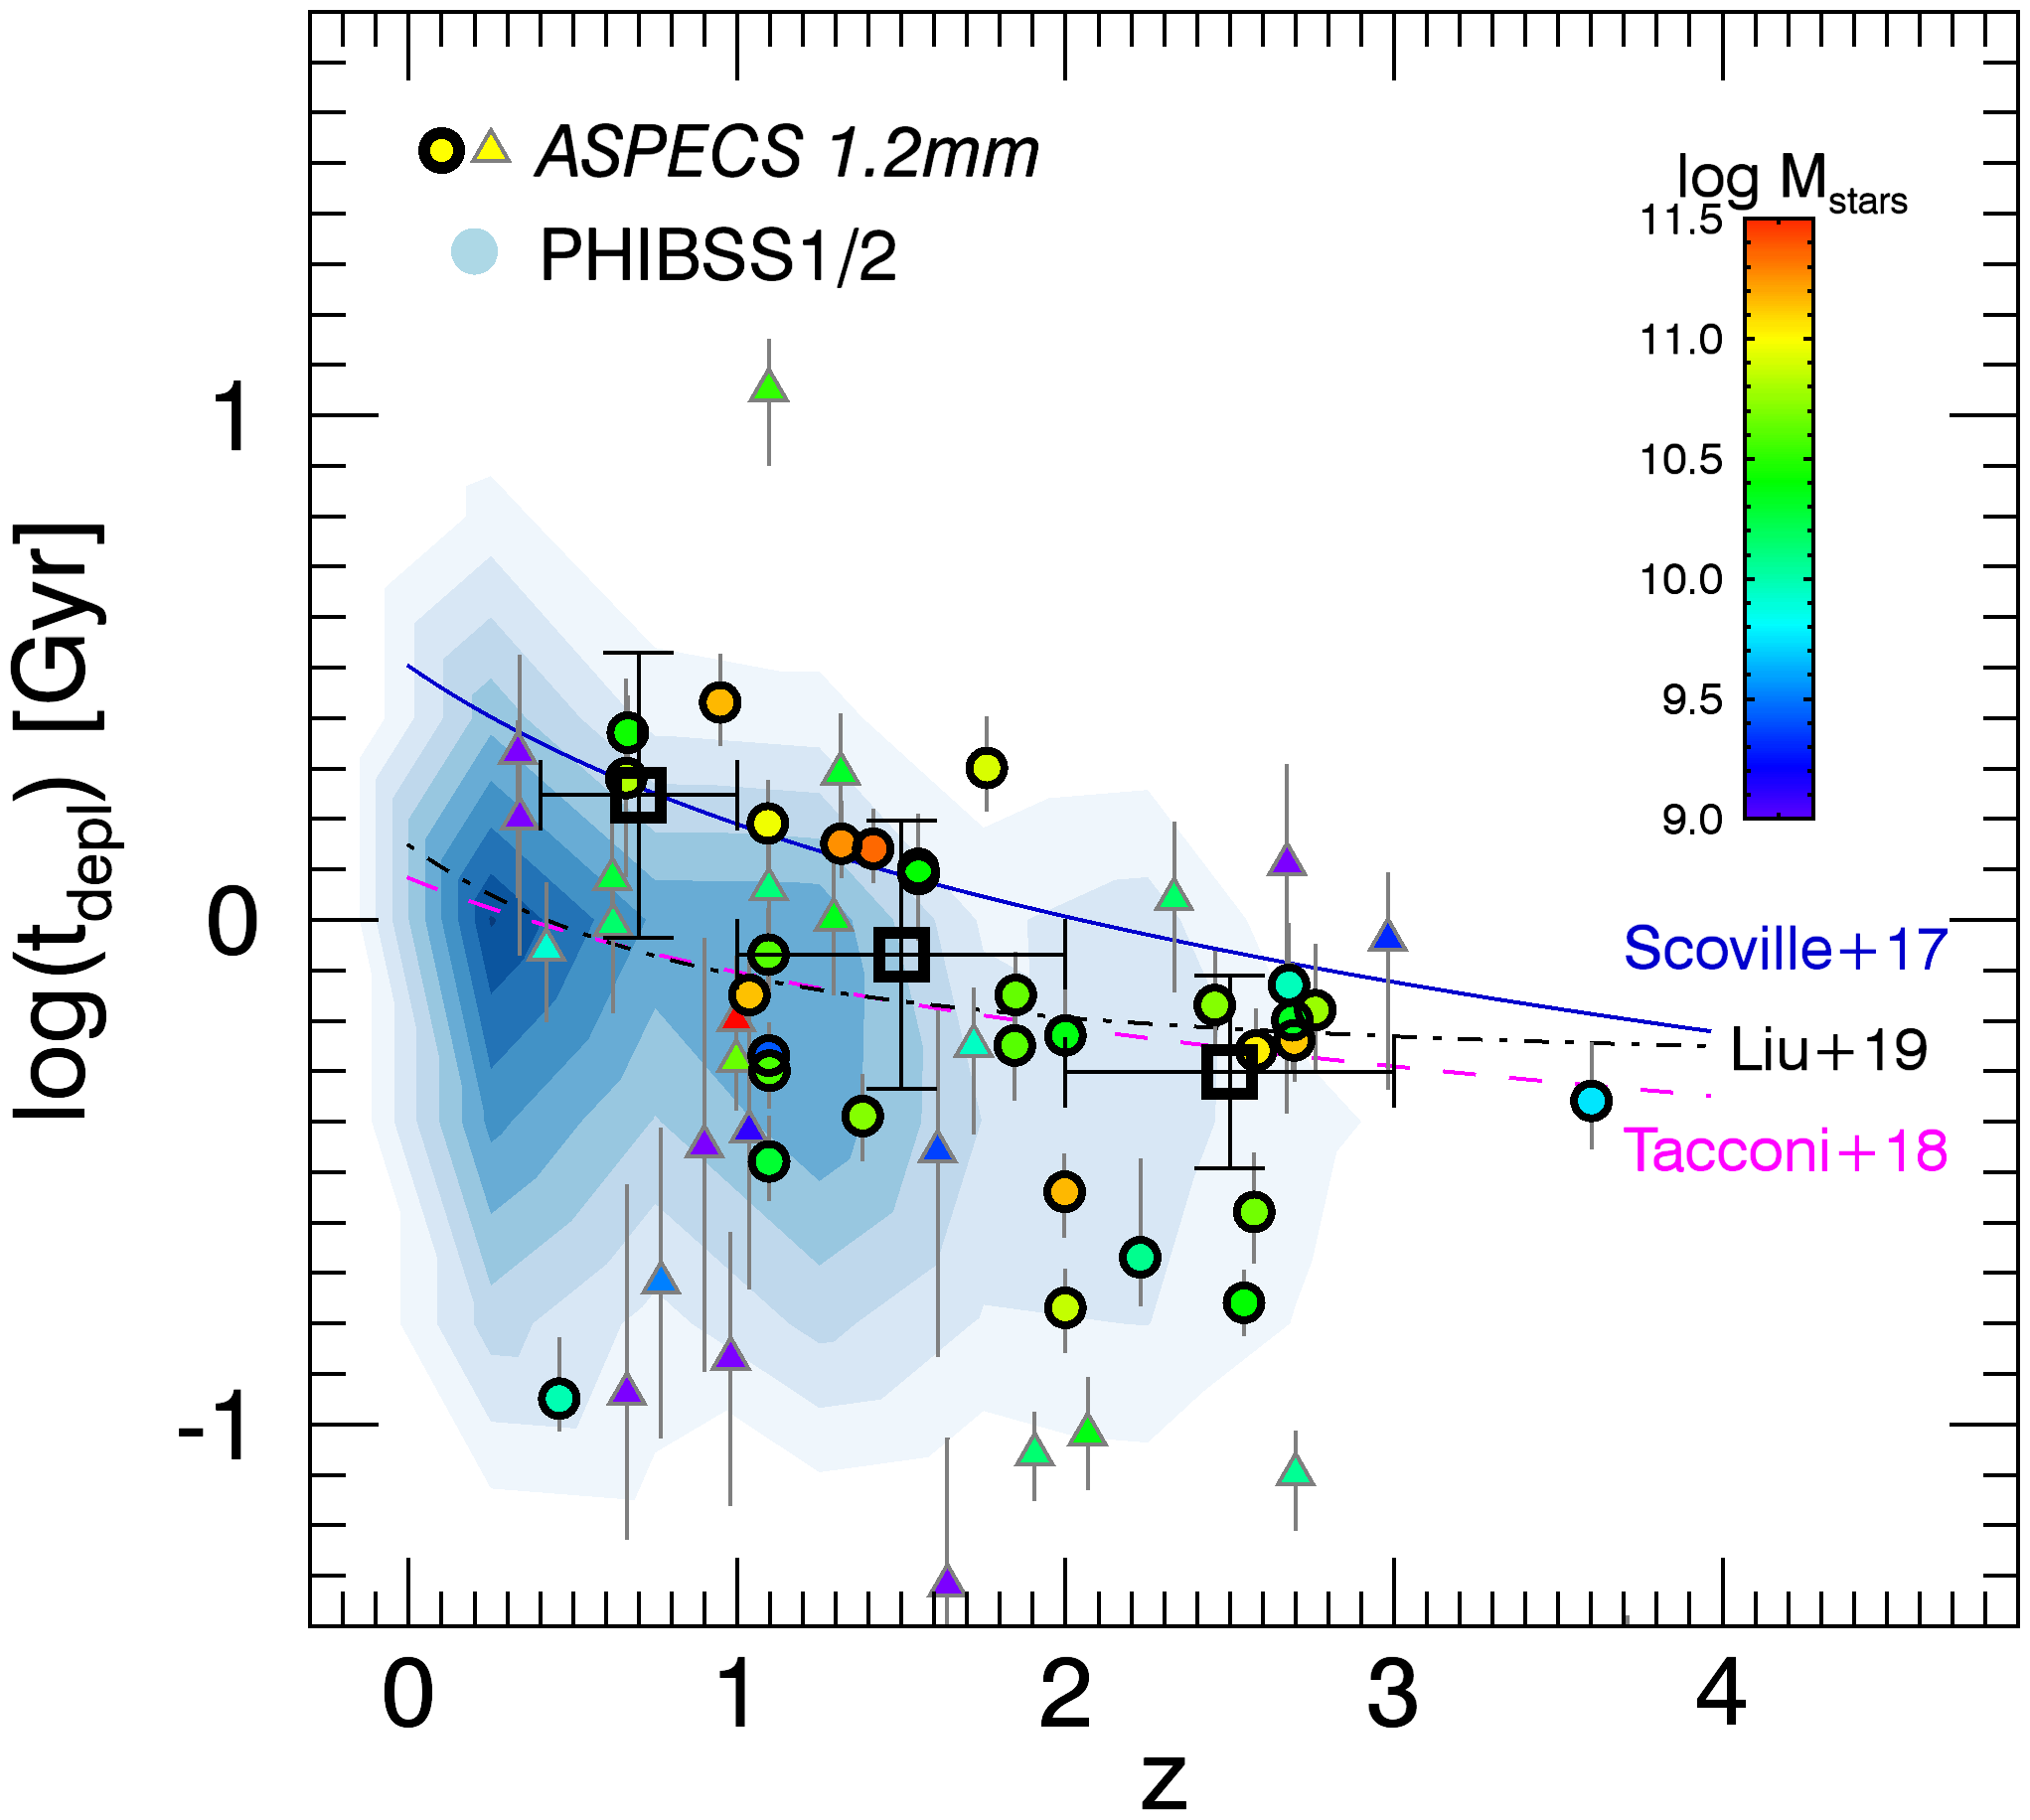
Figure 11 shows the evolution with redshift of the gas depletion timescales and molecular gas ratio for the ASPECS 1.2 mm galaxies, compared with the PHIBSS1/2 sample and with the standard scaling relations for these parameters (e.g., Scoville et al., 2017; Tacconi et al., 2018; Liu et al., 2019). We find that the ASPECS 1.2 mm galaxies exhibit the mild evolution of with redshift as expected from previous observations and models. As seen previously for the ASPECS CO-selected galaxies (Aravena et al., 2019), the ASPECS 1.2 mm galaxies tend to be slightly above the bulk of PHIBSS1/2 sources; however, the average obtained for the main sample in different redshift bins (open black squares) are in agreement with the evolution of for MS galaxies predicted by Tacconi et al. (2018) and Liu et al. (2019) at the median stellar mass and redshift of the ASPECS 1.2 mm sample. Two of the ASPECS galaxies show significantly lower values than those expected for MS galaxies at their respective redshifts, yet consistent with the spread of values shown by the PHIBBS1/2 galaxies. Overall, the mild evolution of the average gas depletion timescales yields a typical Gyr in the redshift range .
Similarly, the ASPECS 1.2 mm galaxies follow and support the general trend of increasing the molecular gas ratio by roughly a factor of 5.0 from to . As with , we find that the ASPECS sources in the main sample lie slightly below the region occupied by the PHIBSS1/2 galaxies, although the average points fall within the uncertainties from the values predicted for MS galaxies by Tacconi et al. (2018) and Liu et al. (2019) at the median stellar mass and redshift of the ASPECS 1.2 mm sample. The lower values compared to the PHIBSS1/2 sample argue for a milder evolution of this parameter for ASPECS 1.2 mm galaxies. We also find that one and two ASPECS sources from the main and secondary samples, respectively, have log(, consistent with a dominant molecular phase component and well above the general trend paved by the PHIBSS1/2 galaxies and the ASPECS main sample sources.
4.6 Molecular gas budget
One of the most important results of “molecular deep field” observations, as exemplified by the ASPECS project, corresponds to the determination of the cosmic molecular gas density as a function of redshift (), as it provides a measurement of the amount of material available to support star formation (e.g., Walter et al., 2014; Decarli et al., 2016a, 2019; Riechers et al., 2019). Measuring this parameter requires observations of molecular gas through CO line or dust continuum emission over a significantly large, well-defined cosmological volume. Current studies from the various surveys present a consistent picture for the evolution of out to , showing minor changes of this parameter between to 1 and a steep decline from to 0, thus following very closely the evolution of the cosmic SFR density in this redshift range (Decarli et al., 2016a; Riechers et al., 2019; Decarli et al., 2019; Magnelli et al., 2020). It is thus interesting to ask, what is the nature of the galaxies that dominate with redshift? Or equivalently, what is the contribution of different galaxy types to ?
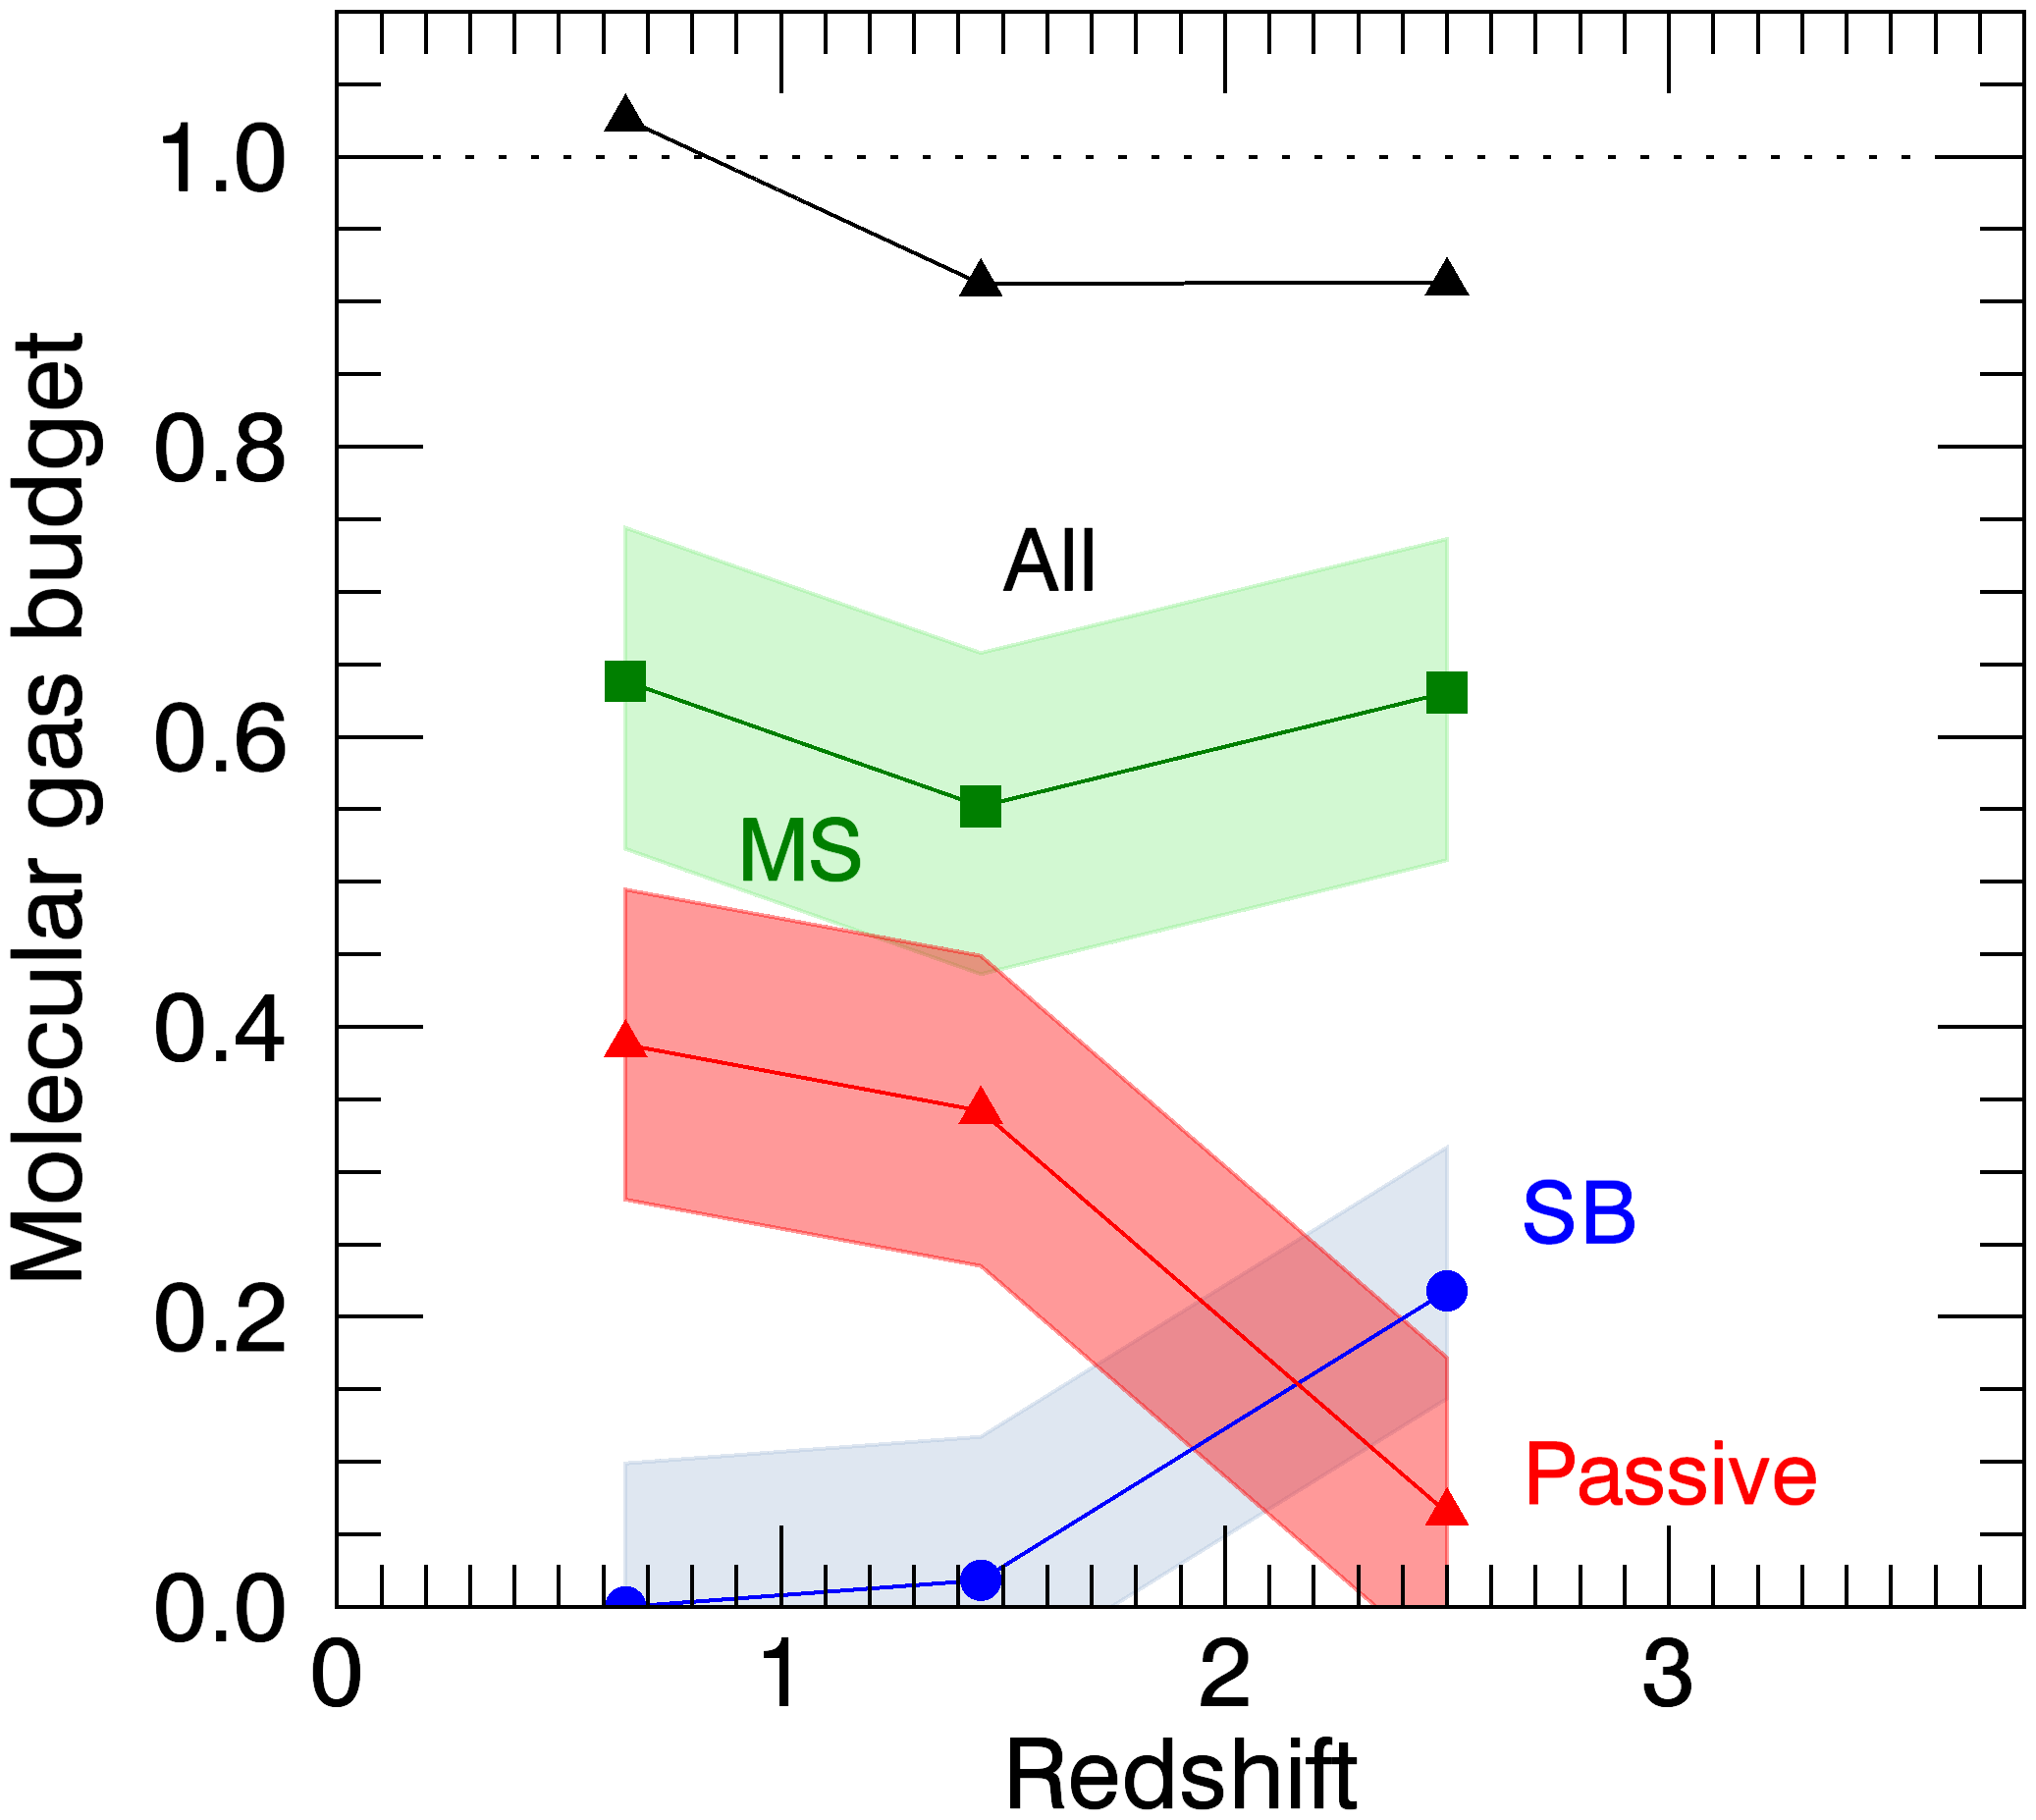
We here follow the same approach introduced in Aravena et al. (2019) and compute the fraction of contributed by galaxies within, above and below the MS, at three redshift bins. From the full sample of ASPECS 1.2 mm galaxies (main and secondary samples), we select sources with , and to be above, below ,and within the MS, respectively. We subdivided each of these samples into three redshift bins and , and added up the derived dust-based, molecular gas masses for all galaxies in each redshift bin and galaxy type. Each of these measurements was thus divided by the total molecular gas mass, obtained from the value of (i.e., ) for that redshift bin from the ASPECS survey (Decarli et al., 2019), thus yielding the fraction of contributed from galaxies in a particular galaxy class (or cosmic molecular gas budget). The addition of the molecular gas masses from all galaxies in a particular redshift bin (divided by ) yields to full contribution from the individually detected galaxies to the cosmic molecular gas budget. The uncertainties in the molecular gas budget value are computed as the sum in quadrature of the individual molecular gas mass values and the statistical uncertainty, which follows a binomial distribution, scaled to the total molecular gas in that redshift bin.
Figure 12 shows the results from this procedure. The dotted horizontal line represents a fraction of equal to 100% at each redshift. We find that the contribution to from all galaxies studied here to the molecular gas budget corresponds to almost 100% at decreasing to 80% at , implying that the galaxies in this study account for almost all the cosmic density of molecular gas measured in the HUDF. This is in good agreement with the fact that the ASPECS 1.2 mm galaxies, including the secondary sample, make up close to 100% of the EBL expected in the HUDF at this wavelength. Furthermore, we find that the dominant population of at all redshifts corresponds to MS galaxies. There is a strong evolution with increasing redshift. Galaxies above the MS, which contribute with about 20% of at , suffer a steep decline at dropping their contribution to . Meantime, the contribution from galaxies within the MS stays relatively constant at of from to . Surprisingly, galaxies below the MS increase their contribution to from at to at . This result suggests an overall cessation of star formation in galaxies on and above the MS from to , which coincides with an increased abundance of below-MS galaxies. These galaxies, which ceased their star formation activity, would still retain a significant portion of their dust and molecular gas reservoirs, contributing an important fraction to at . We note that since the galaxies in this study make up most of at , there is little room for a significantly larger contribution from above or below the MS galaxies that we might be missing as a results of the limited areal coverage of the ASPECS field (i.e. massive galaxies above the MS are less abundant and thus would only be found in larger-area surveys).
These trends are in agreement with previous results obtained from the ASPECS CO sample alone presented by Aravena et al. (2019), and thus the physical interpretation given there is also applicable here. Our results follow consistently the contributions from galaxies above and in the MS to the cosmic SFR density as a function of redshift (e.g., Sargent et al., 2012; Schreiber et al., 2015). Furthermore, our results are in apparent disagreement with the large molecular gas masses found for massive early-type galaxies at (e.g. below the MS galaxies Gobat et al., 2018). However, it seems plausible that while galaxies below the MS might have larger molecular gas reservoirs at , they are less abundant and thus represent a minor fraction of . At lower redshifts, the average molecular gas content of galaxies below the MS is lower; however, this population is more numerous, thus contributing a larger fraction of .
5 Conclusions and closing remarks
In this paper, we have measured and analyzed the properties of a sample of 61 faint, dust-selected galaxies found in the deep ALMA 1.2 mm map of the HUDF as part of the ASPECS LP; 35 and 26 of these sources form the main and secondary samples, respectively. The integrated emission from these individual galaxies makes up most of the 1.2 mm light measured in the HUDF (González-López et al., 2020), and thus accounts for almost all the dust emission found in this region of the sky. As such, these galaxies represent a unique opportunity to study the evolution of the dust and molecular gas mass with cosmic time in a close to statistically complete fashion. The main results from this study can be summarized as follows:
-
•
Out of the 35 sources blindly detected at 1.2 mm, 32 have clear optical counterparts in the HST images and 25 have Herschel PACS counterparts. Additionally, we select 26 millimeter sources using optical and IR priors. Out of the 18 CO line emitters detected by the 3mm line spectroscopy (González-López et al., 2019; Boogaard et al., 2019; Aravena et al., 2019), 15 have a 1 mm continuum counterpart at the level. Most of these sources have an accurate spectroscopic redshift from MUSE or ALMA spectroscopy.
-
•
For all sources with reliable counterparts, we derived physical properties using magphys. We find a large range in stellar masses and SFRs for the ASPECS galaxies in the main sample, with median values of and yr-1, and interquartile ranges of and interquartile ranges of and yr-1, respectively.
-
•
The ASPECS 1.2 mm galaxies in the main sample are found to have a median redshift of , with an interquartile range of . The median redshift for the ASPECS galaxies is thus significantly lower than those found for brighter SMGs.
-
•
Overall, 59% of the ASPECS 1 mm galaxies in the main sample are consistent with the MS of star formation at their respective redshift, with 34% and 6% lying more than 0.4 dex below and above the MS, respectively. We find similar fractions for the secondary ASPECS sample. A wider spread in with respect to UDF galaxies and systematically lower values are found for ASPECS galaxies. A tentative trend of with stellar mass is found; however no trend is found with redshift. These results point to a relevant role of massive below-MS galaxies as molecular gas reservoirs.
-
•
The ASPECS 1.2 mm galaxies follow tightly the relationship between SFR and , consistent with that found for previous samples.
-
•
We find that the ASPECS 1.2 mm galaxies follow the trends of molecular gas depletion timescale and molecular-to-stellar ratio with expected from standard scaling relations. In particular, we find that sources significantly below the MS, with , have , consistent with recent findings from the literature.
-
•
The ASPECS 1.2 mm galaxies consistently follow the evolution of and with redshift expected from standard scaling relations. Our observations support the mild evolution of with redshift, yielding a typical depletion timescale of 0.7 Gyr at , and confirm the decrease by a factor of 5 in the molecular-gas-to-stellar mass ratio from to .
-
•
We find substantial evidence for a changing contribution from different classes of galaxies to the cosmic density of molecular gas as a function of redshift. While star-forming MS galaxies appear to dominate at all redshifts, galaxies below and above the MS significantly increase/decrease their contribution with decreasing redshift, from to . This is attributed to a higher abundance of passive galaxies at lower redshifts even though they are expected to have higher molecular gas reservoirs at , hinting at a cessation of star-formation activity in passive galaxies at lower redshifts.
The ASPECS LP survey has enabled a complementary view of the evolution of the ISM content through cosmic time in a unique flux-limited, dust-mass-selected sample of galaxies. Overall, the derived properties of these galaxies are consistent with standard scaling relations previously established through targeted observations of molecular gas and dust. The large fraction of sources classified to be below the MS, as well as the increasingly important role of these galaxies in the cosmic molecular gas density (), indicates that this population of galaxies has so far been overlooked.
Despite the importance of this complementary approach, and progress made so far, expanding significantly the current ASPECS LP observations beyond the XDF/HUDF (in either band-3 or 6) will be difficult with current instrumentation and facilities. Particularly, adding times more areal coverage to the current ASPECS footprint at similar depth (Jy at 1.2 mm continuum) will require hr of observing time with ALMA. Given the already large number of sources () for which global ISM properties have been derived (e.g., Tacconi et al., 2018; Liu et al., 2019), future observational efforts should concentrate on understanding the physics involved in galaxy build up, through high-resolution observations of molecular gas and dust continuum. Similarly, it will be critical to understand the accuracy and applicability of molecular gas mass estimators in the ASPECS galaxies through dedicated observations of the CO(1-0) and [CI] emission lines as additional key tracers of the ISM.
References
- Aravena et al. (2016a) Aravena, M., Spilker, J. S., Bethermin, M., et al. 2016a, MNRAS, 457, 4406
- Aravena et al. (2016b) Aravena, M., Decarli, R., Walter, F., et al. 2016b, ApJ, 833, 68
- Aravena et al. (2016c) —. 2016c, ApJ, 833, 71
- Aravena et al. (2019) Aravena, M., Decarli, R., Gónzalez-López, J., et al. 2019, ApJ, 882, 136
- Archibald et al. (2001) Archibald, E. N., Dunlop, J. S., Hughes, D. H., et al. 2001, MNRAS, 323, 417
- Aretxaga et al. (2011) Aretxaga, I., Wilson, G. W., Aguilar, E., et al. 2011, MNRAS, 415, 3831
- Austermann et al. (2010) Austermann, J. E., Dunlop, J. S., Perera, T. A., et al. 2010, MNRAS, 401, 160
- Bacon et al. (2017) Bacon, R., Conseil, S., Mary, D., et al. 2017, A&A, 608, A1
- Barger et al. (1998) Barger, A. J., Cowie, L. L., Sanders, D. B., et al. 1998, Nature, 394, 248
- Bertoldi et al. (2000) Bertoldi, F., Carilli, C. L., Menten, K. M., et al. 2000, A&A, 360, 92
- Bertoldi et al. (2007) Bertoldi, F., Carilli, C., Aravena, M., et al. 2007, ApJS, 172, 132
- Béthermin et al. (2015) Béthermin, M., De Breuck, C., Sargent, M., & Daddi, E. 2015, A&A, 576, L9
- Bezanson et al. (2019) Bezanson, R., Spilker, J., Williams, C. C., et al. 2019, ApJ, 873, L19
- Bolatto et al. (2013) Bolatto, A. D., Wolfire, M., & Leroy, A. K. 2013, ARA&A, 51, 207
- Boogaard et al. (2019) Boogaard, L. A., Decarli, R., González-López, J., et al. 2019, ApJ, 882, 140
- Boogaard et al. (2020) Boogaard, L. A., van der Werf, P., Weiß, A., et al. 2020, arXiv e-prints, arXiv:2009.04348
- Bouwens et al. (2020) Bouwens, R. J., Gonzalez-Lopez, J., Aravena, M., & et al. 2020, ApJ, ApJ submitted, arXiv:xxx.xxx:xxx
- Bouwens et al. (2014) Bouwens, R. J., Bradley, L., Zitrin, A., et al. 2014, ApJ, 795, 126
- Bouwens et al. (2016) Bouwens, R. J., Aravena, M., Decarli, R., et al. 2016, ApJ, 833, 72
- Brinchmann et al. (2004) Brinchmann, J., Charlot, S., White, S. D. M., et al. 2004, MNRAS, 351, 1151
- Brisbin et al. (2017) Brisbin, D., Miettinen, O., Aravena, M., et al. 2017, A&A, 608, A15
- Carilli & Walter (2013) Carilli, C. L., & Walter, F. 2013, ARA&A, 51, 105
- Carilli et al. (2016) Carilli, C. L., Chluba, J., Decarli, R., et al. 2016, ApJ, 833, 73
- Casey et al. (2014) Casey, C. M., Narayanan, D., & Cooray, A. 2014, Phys. Rep., 541, 45
- Chang et al. (2018) Chang, Y.-Y., Ferraro, N., Wang, W.-H., et al. 2018, ApJ, 865, 103
- Coe et al. (2006) Coe, D., Benítez, N., Sánchez, S. F., et al. 2006, AJ, 132, 926
- Coogan et al. (2019) Coogan, R. T., Sargent, M. T., Daddi, E., et al. 2019, MNRAS, 485, 2092
- Coppin et al. (2006) Coppin, K., Chapin, E. L., Mortier, A. M. J., et al. 2006, MNRAS, 372, 1621
- Cowie et al. (2002) Cowie, L. L., Barger, A. J., & Kneib, J. 2002, AJ, 123, 2197
- da Cunha et al. (2008) da Cunha, E., Charlot, S., & Elbaz, D. 2008, MNRAS, 388, 1595
- da Cunha et al. (2015) da Cunha, E., Walter, F., Smail, I. R., et al. 2015, ApJ, 806, 110
- Daddi et al. (2007) Daddi, E., Dickinson, M., Morrison, G., et al. 2007, ApJ, 670, 156
- Daddi et al. (2010a) Daddi, E., Elbaz, D., Walter, F., et al. 2010a, ApJ, 714, L118
- Daddi et al. (2010b) Daddi, E., Bournaud, F., Walter, F., et al. 2010b, ApJ, 713, 686
- Daddi et al. (2015) Daddi, E., Dannerbauer, H., Liu, D., et al. 2015, A&A, 577, A46
- De Vis et al. (2019) De Vis, P., Jones, A., Viaene, S., et al. 2019, A&A, 623, A5
- Decarli et al. (2016a) Decarli, R., Walter, F., Aravena, M., et al. 2016a, ApJ, 833, 69
- Decarli et al. (2016b) —. 2016b, ApJ, 833, 70
- Decarli et al. (2019) Decarli, R., Walter, F., Gónzalez-López, J., et al. 2019, ApJ, 882, 138
- Dudzevičiūtė et al. (2020) Dudzevičiūtė, U., Smail, I., Swinbank, A. M., et al. 2020, MNRAS, 494, 3828
- Dunlop et al. (2017) Dunlop, J. S., McLure, R. J., Biggs, A. D., et al. 2017, MNRAS, 466, 861
- Eales et al. (2000) Eales, S., Lilly, S., Webb, T., et al. 2000, AJ, 120, 2244
- Elbaz et al. (2007) Elbaz, D., Daddi, E., Le Borgne, D., et al. 2007, A&A, 468, 33
- Elbaz et al. (2011) Elbaz, D., Dickinson, M., Hwang, H. S., et al. 2011, A&A, 533, A119
- Erb et al. (2006) Erb, D. K., Steidel, C. C., Shapley, A. E., et al. 2006, ApJ, 646, 107
- Franco et al. (2018) Franco, M., Elbaz, D., Béthermin, M., et al. 2018, A&A, 620, A152
- Franco et al. (2020) Franco, M., Elbaz, D., Zhou, L., et al. 2020, arXiv e-prints, arXiv:2005.03040
- Freundlich et al. (2019) Freundlich, J., Combes, F., Tacconi, L. J., et al. 2019, A&A, 622, A105
- Geach et al. (2017) Geach, J. E., Dunlop, J. S., Halpern, M., et al. 2017, MNRAS, 465, 1789
- Genzel et al. (2010) Genzel, R., Tacconi, L. J., Gracia-Carpio, J., et al. 2010, MNRAS, 407, 2091
- Genzel et al. (2015) Genzel, R., Tacconi, L. J., Lutz, D., et al. 2015, ApJ, 800, 20
- Gobat et al. (2018) Gobat, R., Daddi, E., Magdis, G., et al. 2018, Nature Astronomy, 2, 239
- González-López et al. (2017) González-López, J., Bauer, F. E., Romero-Cañizales, C., et al. 2017, A&A, 597, A41
- González-López et al. (2019) González-López, J., Decarli, R., Pavesi, R., et al. 2019, ApJ, 882, 139
- González-López et al. (2020) González-López, J., Novak, M., Decarli, R., et al. 2020, ApJ, 897, 91
- Greve et al. (2008) Greve, T. R., Pope, A., Scott, D., et al. 2008, MNRAS, 389, 1489
- Hatsukade et al. (2011) Hatsukade, B., Kohno, K., Aretxaga, I., et al. 2011, MNRAS, 411, 102
- Hatsukade et al. (2018) Hatsukade, B., Kohno, K., Yamaguchi, Y., et al. 2018, PASJ, 70, 105
- Hodge et al. (2012) Hodge, J. A., Carilli, C. L., Walter, F., et al. 2012, ApJ, 760, 11
- Hughes et al. (1998) Hughes, D. H., Serjeant, S., Dunlop, J., et al. 1998, Nature, 394, 241
- Hughes et al. (2017) Hughes, T. M., Ibar, E., Villanueva, V., et al. 2017, MNRAS, 468, L103
- Illingworth et al. (2013) Illingworth, G. D., Magee, D., Oesch, P. A., et al. 2013, ApJS, 209, 6
- Inami et al. (2020) Inami, H., Decarli, R., Walter, F., & et al. 2020, ApJ, 99, 99
- Inami et al. (2017) Inami, H., Bacon, R., Brinchmann, J., et al. 2017, A&A, 608, A2
- Ivison et al. (2007) Ivison, R. J., Greve, T. R., Dunlop, J. S., et al. 2007, MNRAS, 380, 199
- Kaasinen et al. (2019) Kaasinen, M., Scoville, N., Walter, F., et al. 2019, ApJ, 880, 15
- Koekemoer et al. (2013) Koekemoer, A. M., Ellis, R. S., McLure, R. J., et al. 2013, ApJS, 209, 3
- Leroy et al. (2011) Leroy, A. K., Bolatto, A., Gordon, K., et al. 2011, ApJ, 737, 12
- Leroy et al. (2013) Leroy, A. K., Walter, F., Sandstrom, K., et al. 2013, AJ, 146, 19
- Liu et al. (2019) Liu, D., Schinnerer, E., Groves, B., et al. 2019, ApJ, 887, 235
- Madau & Dickinson (2014) Madau, P., & Dickinson, M. 2014, ARA&A, 52, 415
- Magnelli et al. (2020) Magnelli, B., Boogaard, L., Decarli, R., et al. 2020, ApJ, 892, 66
- Maiolino et al. (2008) Maiolino, R., Nagao, T., Grazian, A., et al. 2008, in Astronomical Society of the Pacific Conference Series, Vol. 396, Formation and Evolution of Galaxy Disks, ed. J. G. Funes & E. M. Corsini, 409
- McLure et al. (2013) McLure, R. J., Dunlop, J. S., Bowler, R. A. A., et al. 2013, MNRAS, 432, 2696
- Mocanu et al. (2013) Mocanu, L. M., Crawford, T. M., Vieira, J. D., et al. 2013, ApJ, 779, 61
- Momcheva et al. (2016) Momcheva, I. G., Brammer, G. B., van Dokkum, P. G., et al. 2016, ApJS, 225, 27
- Morris et al. (2015) Morris, A. M., Kocevski, D. D., Trump, J. R., et al. 2015, AJ, 149, 178
- Negrello et al. (2010) Negrello, M., Hopwood, R., De Zotti, G., et al. 2010, Science, 330, 800
- Noeske et al. (2007) Noeske, K. G., Weiner, B. J., Faber, S. M., et al. 2007, ApJ, 660, L43
- Papovich et al. (2016) Papovich, C., Labbé, I., Glazebrook, K., et al. 2016, Nature Astronomy, 1, 0003
- Pavesi et al. (2018) Pavesi, R., Sharon, C. E., Riechers, D. A., et al. 2018, ApJ, 864, 49
- Peng et al. (2010) Peng, C. Y., Ho, L. C., Impey, C. D., & Rix, H.-W. 2010, AJ, 139, 2097
- Popping et al. (2017) Popping, G., Somerville, R. S., & Galametz, M. 2017, MNRAS, 471, 3152
- Popping et al. (2019) Popping, G., Pillepich, A., Somerville, R. S., et al. 2019, ApJ, 882, 137
- Popping et al. (2020) Popping, G., Walter, F., Behroozi, P., et al. 2020, ApJ, 891, 135
- Rafelski et al. (2015) Rafelski, M., Teplitz, H. I., Gardner, J. P., et al. 2015, AJ, 150, 31
- Rémy-Ruyer et al. (2014) Rémy-Ruyer, A., Madden, S. C., Galliano, F., et al. 2014, A&A, 563, A31
- Rhoads et al. (2009) Rhoads, J. E., Malhotra, S., Pirzkal, N., et al. 2009, ApJ, 697, 942
- Riechers et al. (2019) Riechers, D. A., Pavesi, R., Sharon, C. E., et al. 2019, ApJ, 872, 7
- Riechers et al. (2020) Riechers, D. A., Boogaard, L. A., Decarli, R., et al. 2020, ApJ, 896, L21
- Rodighiero et al. (2010) Rodighiero, G., Cimatti, A., Gruppioni, C., et al. 2010, A&A, 518, L25
- Saintonge et al. (2011) Saintonge, A., Kauffmann, G., Kramer, C., et al. 2011, MNRAS, 415, 32
- Saintonge et al. (2013) Saintonge, A., Lutz, D., Genzel, R., et al. 2013, ApJ, 778, 2
- Saintonge et al. (2016) Saintonge, A., Catinella, B., Cortese, L., et al. 2016, MNRAS, 462, 1749
- Santini et al. (2014) Santini, P., Maiolino, R., Magnelli, B., et al. 2014, A&A, 562, A30
- Sargent et al. (2012) Sargent, M. T., Béthermin, M., Daddi, E., & Elbaz, D. 2012, ApJ, 747, L31
- Sargent et al. (2014) Sargent, M. T., Daddi, E., Béthermin, M., et al. 2014, ApJ, 793, 19
- Sargent et al. (2015) Sargent, M. T., Daddi, E., Bournaud, F., et al. 2015, ApJ, 806, L20
- Schenker et al. (2013) Schenker, M. A., Robertson, B. E., Ellis, R. S., et al. 2013, ApJ, 768, 196
- Schinnerer et al. (2016) Schinnerer, E., Groves, B., Sargent, M. T., et al. 2016, ApJ, 833, 112
- Schreiber et al. (2015) Schreiber, C., Pannella, M., Elbaz, D., et al. 2015, A&A, 575, A74
- Scott et al. (2008) Scott, K. S., Austermann, J. E., Perera, T. A., et al. 2008, MNRAS, 385, 2225
- Scott et al. (2012) Scott, K. S., Wilson, G. W., Aretxaga, I., et al. 2012, MNRAS, 423, 575
- Scott et al. (2002) Scott, S. E., Fox, M. J., Dunlop, J. S., et al. 2002, MNRAS, 331, 817
- Scoville et al. (2014) Scoville, N., Aussel, H., Sheth, K., et al. 2014, ApJ, 783, 84
- Scoville et al. (2016) Scoville, N., Sheth, K., Aussel, H., et al. 2016, ApJ, 820, 83
- Scoville et al. (2017) Scoville, N., Lee, N., Vanden Bout, P., et al. 2017, ApJ, 837, 150
- Simpson et al. (2014) Simpson, J. M., Swinbank, A. M., Smail, I., et al. 2014, ApJ, 788, 125
- Simpson et al. (2019) Simpson, J. M., Smail, I., Swinbank, A. M., et al. 2019, ApJ, 880, 43
- Skelton et al. (2014) Skelton, R. E., Whitaker, K. E., Momcheva, I. G., et al. 2014, ApJS, 214, 24
- Speagle et al. (2014) Speagle, J. S., Steinhardt, C. L., Capak, P. L., & Silverman, J. D. 2014, ApJS, 214, 15
- Spilker et al. (2018) Spilker, J., Bezanson, R., Barišić, I., et al. 2018, ApJ, 860, 103
- Stach et al. (2019) Stach, S. M., Dudzevičiūtė, U., Smail, I., et al. 2019, MNRAS, 487, 4648
- Suess et al. (2017) Suess, K. A., Bezanson, R., Spilker, J. S., et al. 2017, ApJ, 846, L14
- Swinbank et al. (2014) Swinbank, A. M., Simpson, J. M., Smail, I., et al. 2014, MNRAS, 438, 1267
- Tacconi et al. (2010) Tacconi, L. J., Genzel, R., Neri, R., et al. 2010, Nature, 463, 781
- Tacconi et al. (2013) Tacconi, L. J., Neri, R., Genzel, R., et al. 2013, ApJ, 768, 74
- Tacconi et al. (2018) Tacconi, L. J., Genzel, R., Saintonge, A., et al. 2018, ApJ, 853, 179
- Umehata et al. (2018) Umehata, H., Hatsukade, B., Smail, I., et al. 2018, PASJ, 70, 65
- Uzgil et al. (2019) Uzgil, B. D., Carilli, C., Lidz, A., et al. 2019, ApJ, 887, 37
- Vieira et al. (2010) Vieira, J. D., Crawford, T. M., Switzer, E. R., et al. 2010, ApJ, 719, 763
- Walter et al. (2014) Walter, F., Decarli, R., Sargent, M., et al. 2014, ApJ, 782, 79
- Walter et al. (2016) Walter, F., Decarli, R., Aravena, M., et al. 2016, ApJ, 833, 67
- Wang et al. (2017) Wang, W.-H., Lin, W.-C., Lim, C.-F., et al. 2017, ApJ, 850, 37
- Weiß et al. (2009) Weiß, A., Kovács, A., Coppin, K., et al. 2009, ApJ, 707, 1201
- Whitaker et al. (2012) Whitaker, K. E., van Dokkum, P. G., Brammer, G., & Franx, M. 2012, ApJ, 754, L29
- Whitaker et al. (2014) Whitaker, K. E., Franx, M., Leja, J., et al. 2014, ApJ, 795, 104
- Wiklind et al. (2019) Wiklind, T., Ferguson, H. C., Guo, Y., et al. 2019, ApJ, 878, 83
- Wuyts et al. (2014) Wuyts, E., Kurk, J., Förster Schreiber, N. M., et al. 2014, ApJ, 789, L40
- Xu et al. (2007) Xu, C., Pirzkal, N., Malhotra, S., et al. 2007, AJ, 134, 169
- Zahid et al. (2014) Zahid, H. J., Dima, G. I., Kudritzki, R.-P., et al. 2014, ApJ, 791, 130
- Zavala et al. (2018) Zavala, J. A., Aretxaga, I., Dunlop, J. S., et al. 2018, MNRAS, 475, 5585
Appendix A Comparison of the various molecular gas mass estimates
The availability of a well-sampled multi-wavelength SED, dust continuum and CO line measurements for the ASPECS 1.2 mm sources allows us to compute the molecular gas mass of our galaxies in various ways. In the following, we describe the methods used to compute molecular gas masses and thereby present a comparison between these estimates. These various estimates are listed in Tables 2 and 4.
A.1 CO-based estimate
CO line detections () are available for a subsample of our sources from the ASPECS 3 mm line scan, and the associated flux densities can be used to obtain molecular gas masses (for details see Aravena et al., 2019; Boogaard et al., 2019). In short, the CO line flux densities are used to obtain CO line luminosities (). The luminosities are converted into the ground-state CO(1-0) line luminosities () using the average CO line ratios derived from the extended sample of ASPECS CO galaxies at and (Boogaard et al., 2020; Riechers et al., 2020). We use the following line ratios (for details see Boogaard et al., 2020): for galaxies at , we use , and ; for galaxies at , we use , and . These line ratios are consistent with a higher excitation (close to local thermal equilibrium up to ) than the average CO spectral line energy distribution (SLED) of (typically more massive) BzK galaxies at previously studied by Daddi et al. (2015). We thus convert the line luminosities to molecular gas masses using , where is the CO-luminosity-to-gas-mass conversion factor, assumed to be equal to (K km s-1 pc2)-1 (Daddi et al., 2010b).
In the next section, we discuss the effect of assuming a metallicity () dependence of . As explained in Aravena et al. (2019), assuming a metallicity-dependent yields a factor +0.1 dex larger . Since only a handful of our sources have any estimate of their metallicity based on optical spectroscopy (Boogaard et al., 2019), we use the range of stellar masses of our galaxies and the well-known stellar-massmetallicity (MZ) relation to provide a rough estimate of . For this, we adopt the MZ relationship computed by Genzel et al. (2015), who combined the MZ relations at different redshifts presented by Erb et al. (2006), Maiolino et al. (2008), Zahid et al. (2014) and Wuyts et al. (2014). This prescription, also recently used by Tacconi et al. (2018), is given by
| (A1) |
where and . Similarly, we adopt a metallicity-dependent prescription from Bolatto et al. (2013), with the form
| (A2) |
where is the galaxy metallicity.
A.2 magphys SED Dust-based Estimate
The magphys SED fitting routine uses a prescription to balance the energy output at various wavelengths, thus producing estimates of the dust mass () based on the best SED fit model (for additional details see Section 4.3). We thus used together with an assumption of the molecular gas-to-dust ratio () to compute the molecular gas mass as .
The value of is known to depend on based on observations of local galaxies and simulations out to higher redshifts (Popping et al., 2017; Coogan et al., 2019). We adopt the broken power-law form of the Z relation prescribed by Rémy-Ruyer et al. (2014). For the mass range of the ASPECS galaxies, this form is given by
| (A3) |
For the median stellar mass and redshift of the ASPECS sample, and , respectively, we find metallicities in the range 12+log10(O/H). For this metallicity range, we thus expect (e.g. Rémy-Ruyer et al., 2014; De Vis et al., 2019). We note that using the -Z relationship found by Leroy et al. (2011), would yield for the median stellar mass and redshift values for the ASPECS sample, corresponding to a factor of dex lower.
A.3 Rayleigh-Jeans Dust-based Estimate
Various studies have shown that the cold dust emission from distant galaxies in the Rayleigh-Jeans (RJ) long-wavelength regime can be used as a reliable tracer of the ISM molecular gas mass, under reasonable assumptions on the dust properties (Scoville et al., 2014, 2016; Hughes et al., 2017; Kaasinen et al., 2019). Although the method comes in different flavors, the dust temperatures are expected to have little effect on the dust content measurements, and it is assumed to be fixed at K, which corresponds to the typical value for local star forming galaxies. Following Scoville et al. (2014), the dust emissivity index is assumed fixed at , which corresponds to the value measured in our Galaxy. Instead of assuming a dust-to-gas ratio, as usually done for molecular gas estimates based on dust continuum emission (see below), this method was independently calibrated to a value of , expected to be fairly constant for a relatively ample range of galaxy properties, and using a fixed of (K km s-1 pc2)-1 (Scoville et al., 2016, 2017). Hereafter, we refer to this method as “RJ”. Thus, assuming that most of the ISM content is molecular, the molecular gas mass as a function of the measured flux density (in mJy) is thus given by
| (A4) |
where is the luminosity distance at the source redshift , in units of Gpc; is the observed frequency, which in our case corresponds to 242 GHz; and is a factor to correct for the deviation from the RJ limit at increasing redshifts.
A.4 Comparison
Each of the three methods described in the previous section has its own uncertainties owing to the assumption of various conversion factors or metallicity-dependent prescriptions. Here, we briefly contrast the results obtained by these methods, applied on the ASPECS 1.2 mm galaxy sample.
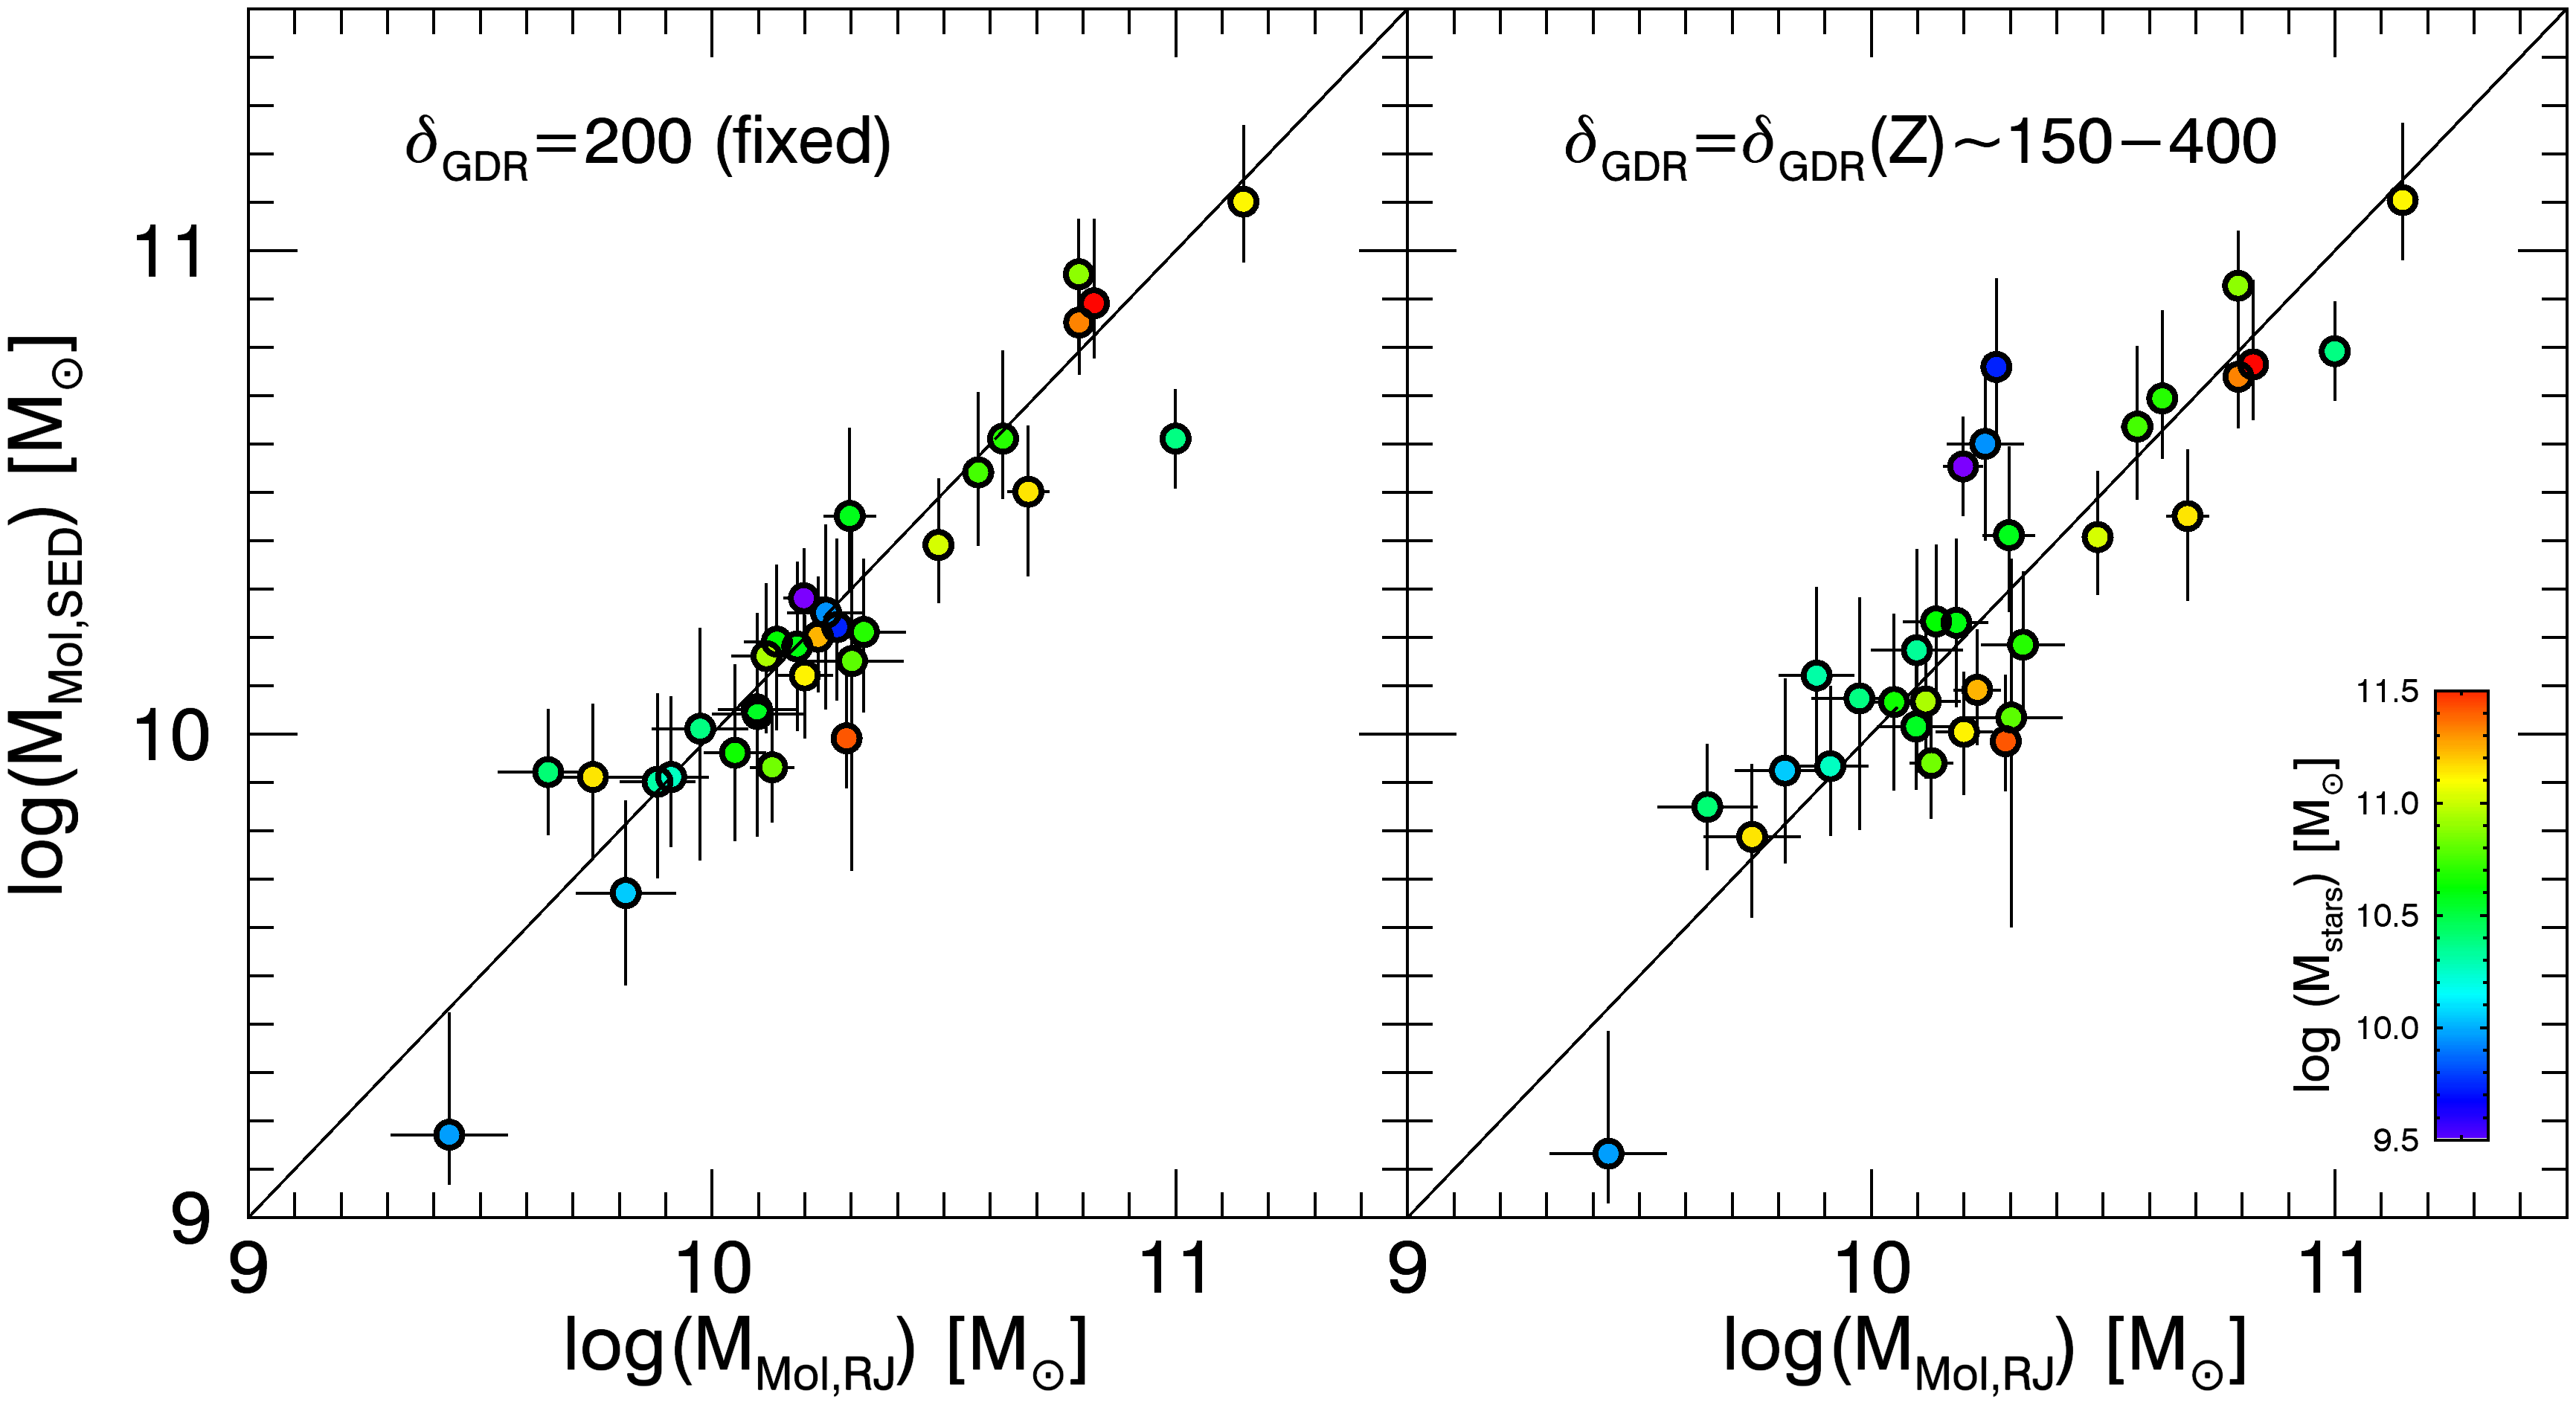
Figure 13 shows the comparison of molecular gas mass estimates for the ASPECS 1.2 mm sources, between the RJ and magphys SED methods, using two different assumptions for in the latter approach. In the first case (left panel), we use a fixed value for of 200, following the expected typical (median) metallicity for our sample, as well as previous estimates for the ASPECS pilot survey (Aravena et al., 2016b). In the second case (right panel), we compute a metallicity-dependent individually for each source. Here, we use the stellar mass of each source, the MZ relation, and the adopted prescription of .
From this comparison, we find that there is remarkable agreement in the molecular gas mass values obtained through the RJ and magphys methods when using a fixed (Fig. 13, left panel). This agreement is somewhat expected since both estimates essentially come from the same dust measurements, even though the magphys method includes more information from the SED photometry.
These methods use different combinations of (, , ) parameter values. For the magphys SED method, we assume and emissivity index , whereas the RJ method uses and . The large factor used in the RJ approach implies a factor of dex larger molecular gas masses, compared to assuming 3.6 for example. However, this is compensated by the larger , compared to a typical , and lower value used in the magphys method, which yield 0.3 dex and 0.05 dex (assuming ) larger magphys molecular gas mass estimates.
If we now, instead of fixing the parameters, allow the value to vary with metallicity individually for each source (Fig. 13, right panel), we find little variation in the relationship, yielding a very similar scatter and location of individual sources, well within the uncertainties of individual measurements. This indicates that using a fixed or metallicity-dependent does not affect the resulting molecular gas masses significantly. Moreover, this hints that the most massive ASPECS galaxies have relatively uniform metallicities (as previously found by Boogaard et al., 2019).
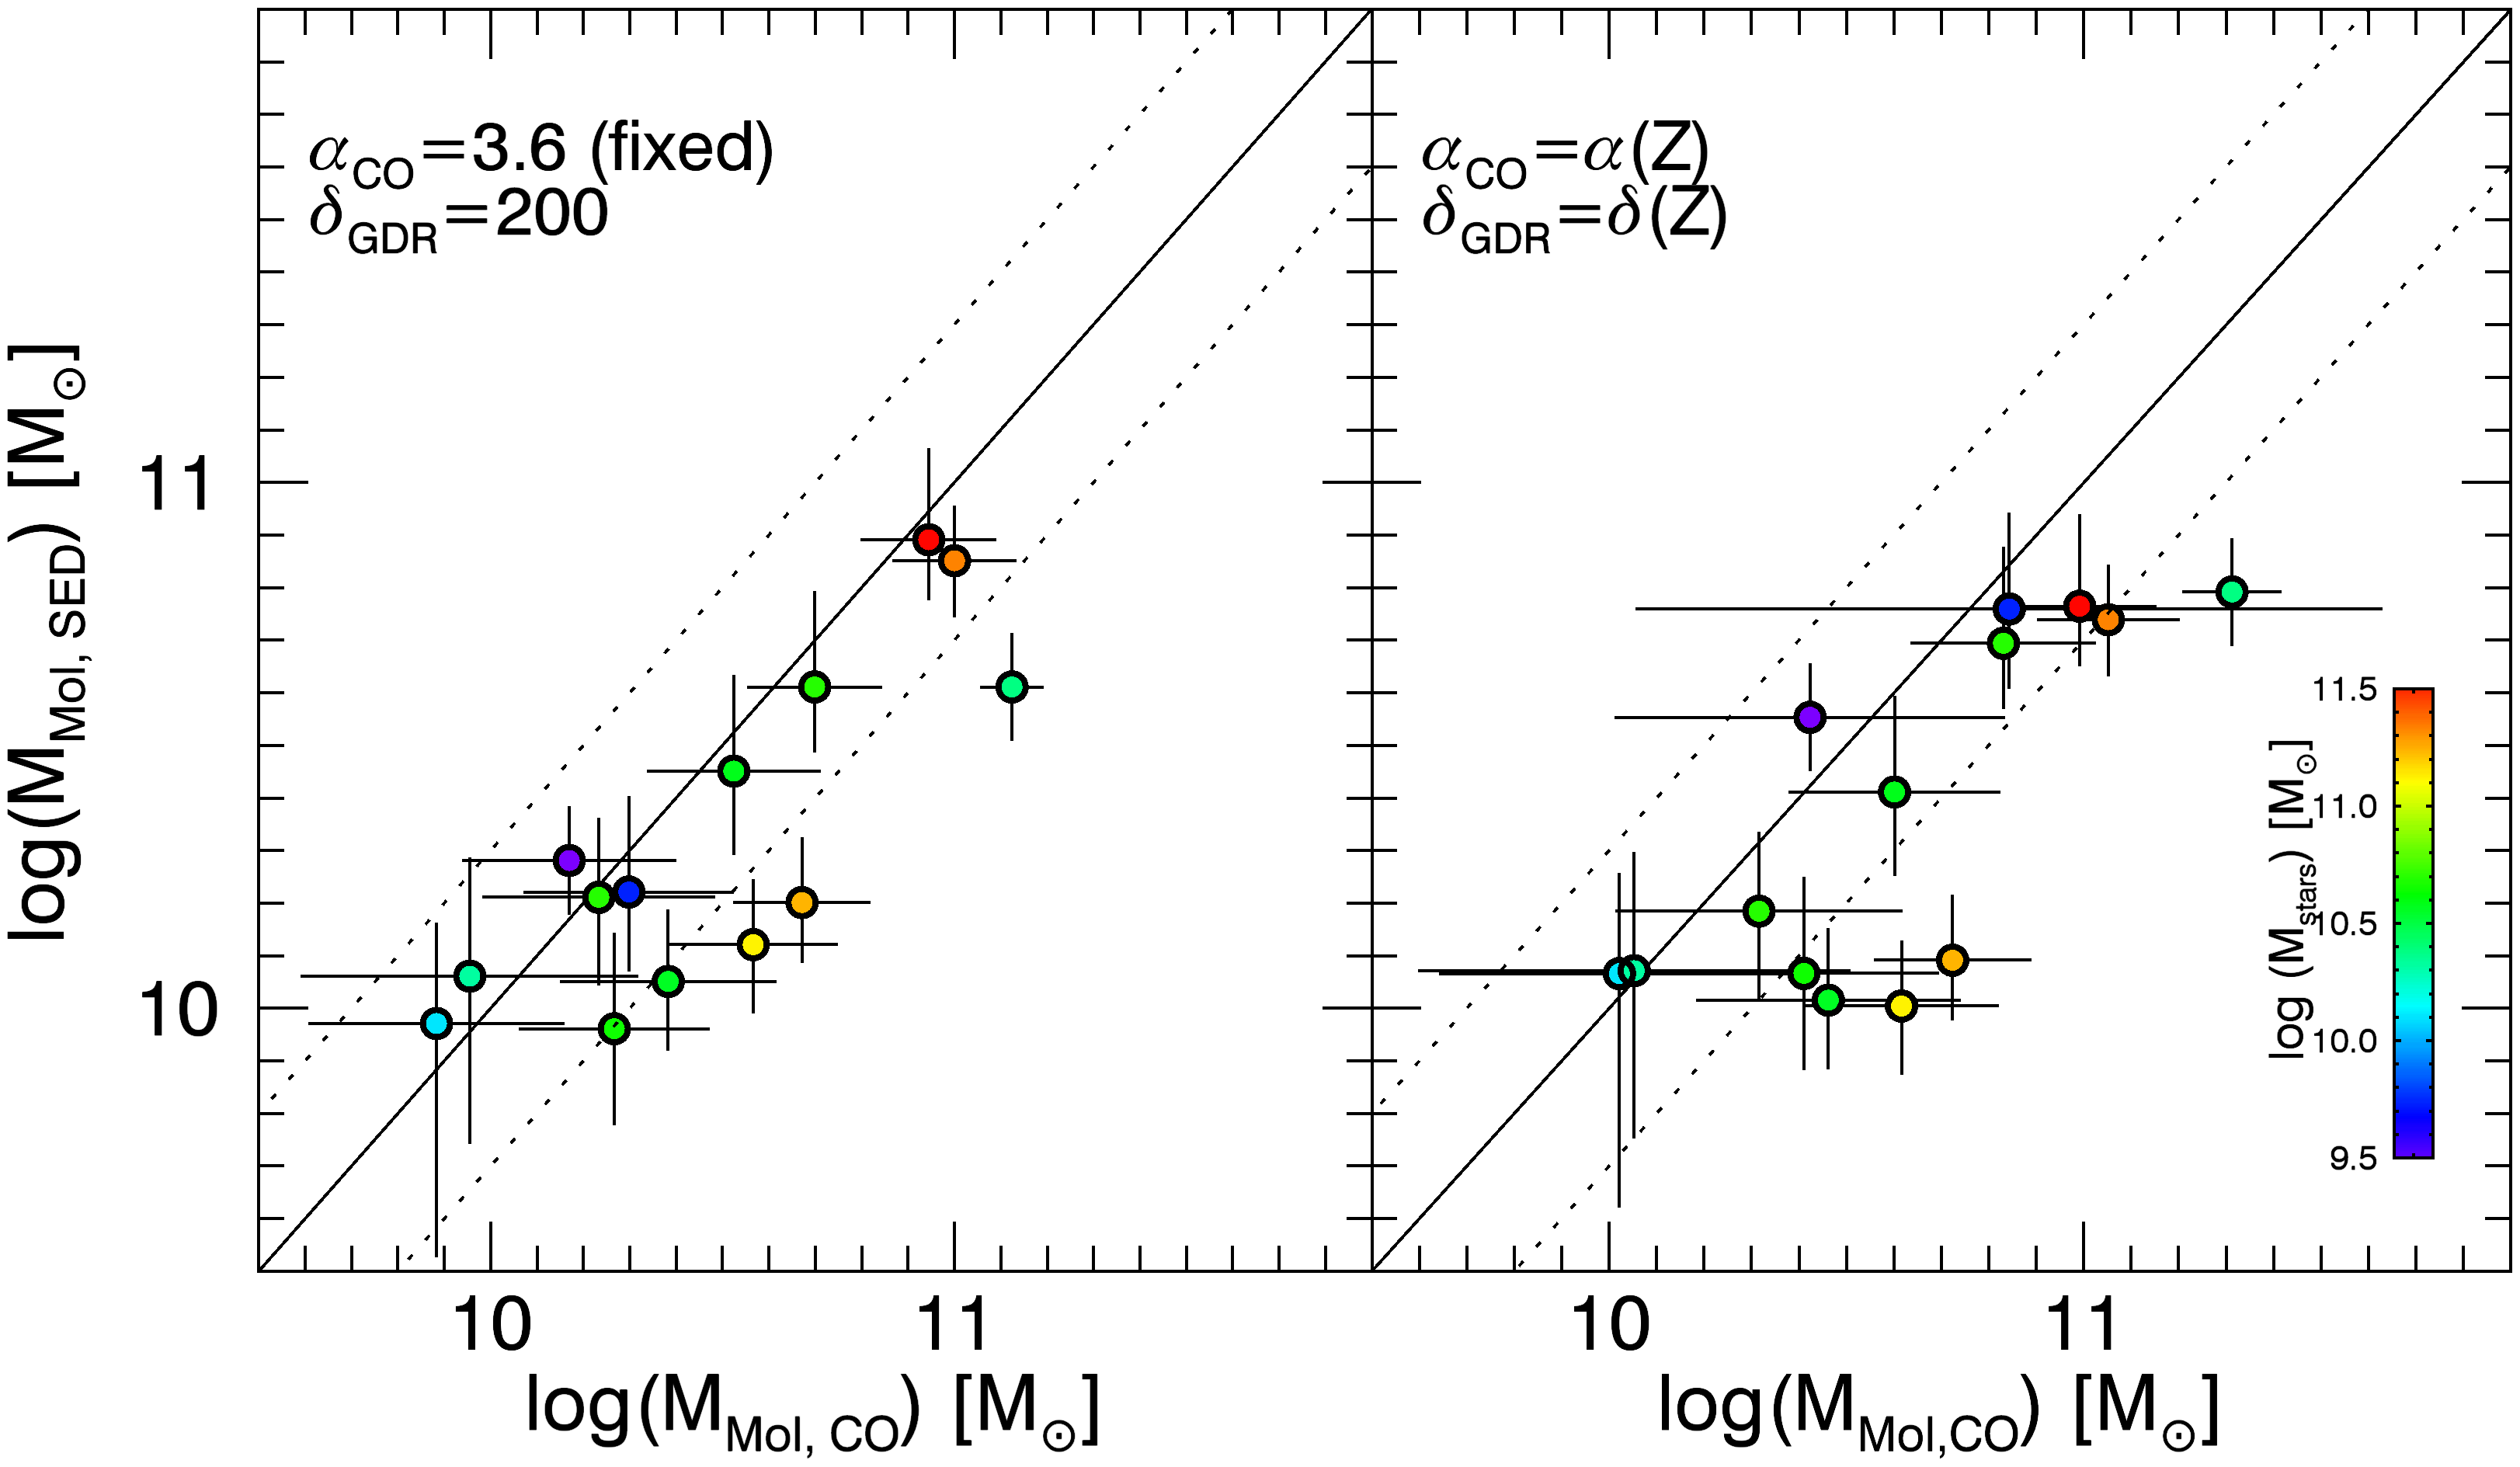
As a reference, we also compare the magphys SED-based molecular gas mass estimates with the CO-based molecular gas masses for those 1.2 mm continuum sources that were also previously detected in CO line emission in the ASPECS 3mm line scan (González-López et al., 2019; Aravena et al., 2019; Boogaard et al., 2019). We note that the magphys method mostly relies on the assumed prescription for , whereas the CO-based molecular gas masses are subject to assumptions for and the CO SLED shape (CO excitation). As mentioned earlier, we use the average CO SLED obtained for a significant fraction of the galaxies in our sample based on recent observations obtained with the VLA (Riechers et al., 2020) and by the ASPECS 3 mm and 1 mm line survey (Boogaard et al., 2020).
By fixing and to the canonical values of 200 and 3.6, respectively, we find a clear correlation between both estimates (Fig. 14, left panel), indicating that both methods yield consistent molecular gas masses. Allowing both parameters to vary with metallicity (i.e., with stellar mass) as shown in Fig. 14 (right panel), we find a slightly larger scatter, yet the results compared with the fixed-metallicity approach are qualitatively similar.
In summary, we find that there is overall good agreement between the various methods to compute the molecular gas masses, supporting our choice for the magphys SED method. Using the RJ method for our 1.2 mm continuum sample would yield mostly negligible differences in the molecular gas masses. The use of a metallicity-based approach using standard prescriptions for the mass-metallicity, and relations does not produce a substantial difference compared to using (well informed) fixed parameters for and . The use of metallicity-based estimates yields mostly an increase of the scatter when comparing different estimates.
Appendix B Multi-wavelength thumbnails
Figure 15 shows multi-wavelength image cutouts centered at the location of the ASPECS 1.2 mm sources.
Appendix C Spectral energy distribution fits
Figures 20 and 23 show the multi-wavelength photometry (from UV to mm wavelengths) and the best-fit SEDs obtained with MAGPHYS for 1.2 mm galaxies in the main and secondary samples, respectively.
Appendix D Properties of Faint Prior-based Sample
Tables 3 and 4 list the main derived properties for the ASPECS 1.2 mm galaxies in the secondary sample.
| ID | R.A. | Dec. | S/N | CO ID | OIR? | Reference | |||
|---|---|---|---|---|---|---|---|---|---|
| Faint. | (J2000) | (J2000) | (Jy) | (Jy) | (Y/N) | ||||
| (1) | (2) | (3) | (4) | (5) | (6) | (7) | (8) | (9) | (10) |
| FC01 | 03:32:34.66 | 27:47:21.2 | 3.9 | 0.91 | Y | M | |||
| FC02 | 03:32:35.74 | 27:46:39.6 | 3.8 | 0.90 | Y | M | |||
| FC03 | 03:32:41.32 | 27:47:06.6 | 3.7 | 0.91 | Y | 3D | |||
| FC04 | 03:32:41.47 | 27:47:29.2 | 3.7 | 0.92 | Y | M | |||
| FC05 | 03:32:37.51 | 27:47:56.6 | 3.6 | 0.90 | Y | M | |||
| FC06 | 03:32:41.63 | 27:46:25.8 | 3.6 | 0.90 | Y | M | |||
| FC07 | 03:32:40.01 | 27:47:51.2 | 3.5 | 0.83 | Y | M | |||
| FC08 | 03:32:35.85 | 27:47:18.6 | 3.5 | 0.90 | Y | M | |||
| FC09 | 03:32:38.56 | 27:47:30.6 | 3.4 | 0.90 | Y | 3D | |||
| FC10 | 03:32:38.62 | 27:47:34.4 | 3.4 | 0.85 | Y | M | |||
| FC11 | 03:32:36.66 | 27:46:31.2 | 3.3 | 0.87 | Y | M | |||
| FC12 | 03:32:37.17 | 27:46:26.2 | 3.3 | 0.85 | Y | M | |||
| FC13 | 03:32:37.85 | 27:47:51.8 | 3.2 | 0.85 | Y | M | |||
| FC14 | 03:32:35.37 | 27:47:17.0 | 3.2 | 0.81 | Y | 3D | |||
| FC15 | 03:32:38.36 | 27:46:00.2 | 3.1 | 0.81 | Y | M | |||
| FC16 | 03:32:35.79 | 27:46:55.4 | 3.1 | 0.82 | Y | 3D | |||
| FC17 | 03:32:38.56 | 27:46:31.0 | 3.0 | 0.80 | Y | M | |||
| FC18 | 03:32:37.33 | 27:45:57.8 | 3.0 | 0.80 | MP01 | Y | CM | ||
| FC19 | 03:32:38.98 | 27:46:31.0 | 3.8 | 0.80 | Y | M | |||
| FC20 | 03:32:39.89 | 27:46:07.4 | 3.6 | 0.82 | 16 | Y | CM | ||
| FC21 | 03:32:41.35 | 27:46:52.0 | 3.5 | 0.84 | Y | M | |||
| FC22 | 03:32:37.60 | 27:47:40.6 | 3.4 | 0.85 | Y | M | |||
| FC23 | 03:32:42.37 | 27:46:57.8 | 3.0 | 0.81 | Y | M | |||
| FC24 | 03:32:36.86 | 27:46:35.0 | 3.0 | 0.82 | Y | M | |||
| FC25 | 03:32:41.80 | 27:47:39.0 | 3.0 | 0.83 | Y | 3D | |||
| FC26† | 03:32:38.09 | 3.0 | 0.50 | N | M |
| ID | SFR | |||||||||
|---|---|---|---|---|---|---|---|---|---|---|
| Faint. | (AB mag) | ( yr-1) | () | (K) | () | () | () | () | ||
| (1) | (2) | (3) | (4) | (5) | (6) | (7) | (8) | (9) | (10) | (11) |
| FC01 | 1.315 | 23.3 | ||||||||
| FC02 | 2.067 | 23.8 | ||||||||
| FC03 | 1.640 | 25.4 | ||||||||
| FC04 | 0.338 | 24.1 | ||||||||
| FC05 | 2.674 | 27.0 | ||||||||
| FC06 | 2.981 | 25.1 | ||||||||
| FC07 | 0.980 | 23.6 | ||||||||
| FC08 | 1.906 | 22.4 | ||||||||
| FC09 | 2.700 | 23.4 | ||||||||
| FC10 | 4.752 | |||||||||
| FC11 | 0.997 | 21.3 | ||||||||
| FC12 | 1.096 | 23.2 | ||||||||
| FC13 | 0.768 | 22.1 | ||||||||
| FC14 | 0.900 | 26.2 | ||||||||
| FC15 | 1.036 | 23.3 | ||||||||
| FC16 | 1.720 | 23.3 | ||||||||
| FC17 | 0.622 | 20.8 | ||||||||
| FC18 | 1.096 | 22.3 | ||||||||
| FC19 | 0.419 | 20.2 | ||||||||
| FC20 | 1.294 | 21.8 | ||||||||
| FC21 | 0.620 | 20.9 | ||||||||
| FC22 | 0.664 | 24.2 | ||||||||
| FC23 | 0.332 | 23.8 | ||||||||
| FC24 | 1.610 | 23.7 | ||||||||
| FC25 | 2.330 | 24.2 | ||||||||
| FC26 | 0.997 | 22.0 |