Resolution-dependent Subsonic Non-thermal Line Dispersion Revealed by ALMA
Abstract
We report here Atacama Large Millimeter/submillimeter Array (ALMA) N2H+ (1-0) images of the Orion Molecular Cloud 2 and 3 (OMC-2/3) with high angular resolution (3\arcsec or 1200 au) and high spatial dynamic range. Combining dataset from the ALMA main array, ALMA Compact Array (ACA), the Nobeyama 45m Telescope, and the JVLA (providing temperature measurement on matching scales), we find that most of the dense gas in OMC-2/3 is subsonic (= 0.62) with a mean line width () of 0.39 km s-1 FWHM. This is markedly different from the majority of previous observations of massive star-forming regions. In contrast, line widths from the Nobeyama Telescope are transonic at 0.69 km s-1 (= 1.08). We demonstrated that the larger line widths obtained by the single-dish telescope arose from unresolved sub-structures within their respective beams. The dispersions from larger scales (as traced by the Nobeyama Telescope) can be decomposed into three components , where small-scale is the line dispersion of each ALMA beam, bulk motion is dispersion between peak velocity of each ALMA beam, and is the residual dispersion. Such decomposition, though purely empirical, appears to be robust throughout our data cubes. Apparent supersonic line widths, commonly found in massive molecular clouds, are thus likely due to the effect of poor spatial resolution. The observed non-thermal line dispersion (sometimes referred to as ‘turbulence’) transits from supersonic to subsonic at pc scales in OMC-2/3 region. Such transition could be commonly found with sufficient spatial (not just angular) resolution, even in regions with massive young clusters, such as Orion molecular clouds studied here.
keywords:
stars: formation - ISM: clouds- ISM: molecules - ISM: kinematics and dynamics1 Introduction
Turbulence is omnipresent in star-forming clouds. The common proxy for the measurement of astrophysical turbulence is line-of-sight non-thermal spectral line dispersion, i.e., the observed line dispersion subtracted by the contribution from thermal motion (Larson 1981). One of the key distinctions between clouds forming low-mass stars and those forming high-mass ones, is their line width. Surveys of dense cores harboring low-mass protostars found the non-thermal line dispersion to be often smaller than the sound speed (Myers 1983; Caselli et al. 2002; Rosolowsky et al. 2008). On the other hand, the massive cores exhibit the non-thermal line dispersion consistently larger than the sound speed (Goldsmith 1987; Caselli & Myers 1995). For example, the turbulent line width of a survey toward 63 high-mass star-forming cores associated with water masers (Shirley et al. (2003), with a resolution of 0.6 pc), is found to be highly supersonic, at least 4 times more turbulent than low-mass star-forming regions (Mardones et al. (1997); Gregersen et al. (1997); with resolutions of around 0.06 pc).
The larger line widths observed in high-mass star-forming regions led to a theoretical picture of massive formation in which massive cores are supported by turbulence in quasi-equilibrium (see Tan & McKee (2004)). A strong turbulent support manifested by larger line widths allows cores to assemble more materials to fuel high-mass star formation. The accretion rate scales as
| (1) |
where the effective sound speed incorporates thermal gas pressure, magnetic pressure, and turbulence (McKee & Ostriker 2007).
The Orion Molecular Cloud (OMC) is the closest region containing massive young stellar cluster, i.e., OB cluster (Genzel & Stutzki 1989; Peterson & Megeath 2008). Multiple CO surveys of OMC have been published (Shimajiri et al. 2011; Kong et al. 2018). Large maps of dense gas tracers are also becoming common place (e.g. Tatematsu et al. (2008)). Recent interferometric observations of dense gas tracers prove to be particularly useful for studying the evolution of line width, down to thermal Jeans scale. Friesen et al. (2017) released the data of GBT survey of Gould Belt clouds with a beam size of 32\arcsec, and found that the velocity dispersion and gas kinetic temperature of increase with increasing star formation activity. Li et al. (2013) presented observations of to OMC2 and OMC3 by VLA and GBT with a resolution of 5\arcsec and reported the temperatures for a total 30 relatively quiescent cores. They found these cores have a mean temperature of 17 K and 83% of cores are gravitational bound. Svoboda et al. (2019) surveyed 12 of high-mass starless clump candidates with a beam of 0.8\arcsec from ALMA band 6 (1.3 mm). They suggested that the highest-density regions are not strongly supported against thermal gravitational fragmentation by turbulence nor magnetic fields. Hacar et al. (2018) investigated the Integral Shape Filament using the dense gas tracer with ALMA and IRAM 30m observations and identified 55 dense fibers with a median filament width FWHM of 0.035 pc.
The proximity of OMC and the increasing availability of spectral images allow for a systematic probe into the velocity dispersions of star forming clouds containing OB clusters. We follow up our previous high-resolution studies of the OMC-2 and OMC-3 regions (Li et al. 2013) with ALMA observations covering the same regions. The combined data sets thus provide both thermal and non-thermal line dispersion at a comparable spatial resolution and with 100 linear spatial dynamic range. Compared to Hacar et al. (2018), our analysis utilizes temperature information at higher spatial resolution closer to that of ALMA, % more sky area in OMC-2 and OMC-3, and less than half of the noise. The line widths are found to cross the crucial values of the sound speed as measured by our JVLA observations (Li et al. 2013) at scales probed by ALMA.
Such analysis of the transition from supersonic non-thermal to sub-sonic non-thermal motion is only possible now due to the comprehensive coverage of spatial scales of this set of images of dense gases, which covers from 0.05 pc with Nobeyama to 0.006 pc with ALMA. More commonly used gas tracers, such as CO, suffer from depletion and/or optical depth effects, which prevent an accurate measurement of varying line widths. is one of the best dense gas tracer for studying line width since it has an isolated hyperfine component, allowing us to avoid line blending issues of as well as quantifying line opacities. Furthermore, it is critical to have temperature measurements on matching spatial scales to separate the thermal component from line dispersion.
We present our results as follows. Section 2 describes new observations and archival data sets, followed by analysis in Section 3 and discussions in Section 4. In Section 5, we present our main conclusions.
2 Observations and Data Reduction
The ALMA observations of OMC-2/3 (proposal ID 2013.1.00662.S) were carried out between November 2014 and August 2015 in Band 3. Four basebands were used, one of which covered the transition at 93.173 GHz with a 0.11 velocity resolution. Both the 12-m main array and ACA were used to mosaic this region with 11 pointings towards OMC-3, 7 pointings towards OMC-2N and 7 pointings towards OMC-2S. The 12-m array observations consist of 14 execution blocks (EBs) in total, half of which on the OMC-2 region (on-source time of 175 minutes) and the other half on the OMC-3 region (on-source time of 174 minutes). The ACA observations include 13 EBs for OMC-3 region with an on-source time of 340 minutes, and three EBs for the OMC-2 region with an on-source time of 97 minutes. The baselines of the 12-m array observations range from 13.6 to 340.0 m, and for ACA observations the baselines are from 6.8 to 87.4 m.
The visibility data were manually calibrated for each EB with CASA 5.4.0. The datasets of the 12-m array and ACA were combined and images were synthesized with the ‘tclean’ task using the interactive mode. The threshold of 3 mJy and the iteration number of 1000 were used for CLEAN. Briggs weighting was set with robust of 0.5. The velocity of the data cube was centered at the rest frequency of 93.17340 GHz. The output image had a total of 200 channels with the width of 0.1 km s-1 and the pixels had a size of 0.4\arcsec. Primary-beam correction was applied to the restored images. The representative FWHM of the synthesized beam for the images is 3.57\arcsec2.20\arcsec, P.A. = 82.40∘. The rms noise level is 8.3 mJy/beam in a 0.1 km s-1 channel width. Furthermore, in order to recover the missing flux in the ALMA data, we combine the single-dish (1-0) image (Nakamura et al. 2019) from the Nobeyama observations with the ALMA images using “casafeather” in the CASA package. The sdfactor used in casafeather is 0.25 in OMC-3 region and 0.5 in OMC-2N and OMC-2S. The resulting beam size is 3.46\arcsec2.20\arcsec, P.A. = 87.04∘ and the rms is 11 mJy/beam in a 0.11 km s-1 channel width.
The single-dish data used in the combination were taken with the Nobeyama 45m telescope in NRO Star Formation Legacy Project (PI; Fumitaka Nakamura)111 The data is from NRO Star Formation Legacy Project and retrieved from the JVO portal (http://jvo.nao.ac.jp/portal/nobeyama/sfp.do) operated by ADC/NAOJ. Nobeyama Radio Observatory(NRO) is a branch of the National Astronomical Observatory of Japan, National Institutes of Natural Sciences., with a 23.4\arcsecbeam. The spectral resolution is 0.11 km s-1. The details of this project are described by Nakamura et al. (2019). The molecular line of Orion A was mapped in 2016 with the powerful new receiver FOREST. FOREST is a newly-developed 100 GHz-band 4-beam dual-polarization receive and is well suited for conducting large-scale mapping observations.
The kinetic temperature map was derived from the combined Very Large Array (VLA) -Green Bank Telescope (GBT) images of the NH3 (J, K ) = (1,1) and (2,2) inversion transitions (Li et al. 2013). The combined data have a channel width of 0.62 km s-1 and a synthesized beam size of 5\arcsec FWHM. Adopted from Li et al. (2013), the temperature maps used in this work were derived though an analytical recipe based on two line ratios, namely, the intensity ratio between the main and satellite groups within the (1,1) transition and the ratio between the integrated intensities of the (1,1) and (2,2) lines. Unlike most other such pipelines, this method requires no hyperfine fitting and naturally produces statistical uncertainties of the fitted temperatures, with dependence on spectral noise. In this data set, the representative 1 uncertainty of the resulting Tk is about 1 to 2 K. The detailed procedure was described in Li et al. (2013).
3 Analysis
At a distance of 399+/-19 pc (Zucker et al. 2020), Orion Molecular Cloud (OMC) is the nearest giant molecular cloud (GMC) hosting OB clusters. With ALMA, our 3\arcsec resolution corresponds to 1200 au, among the highest spatial resolution ever achieved for a high mass star forming region. We estimate the Jeans scale of the dense filament in Orion as
| (2) |
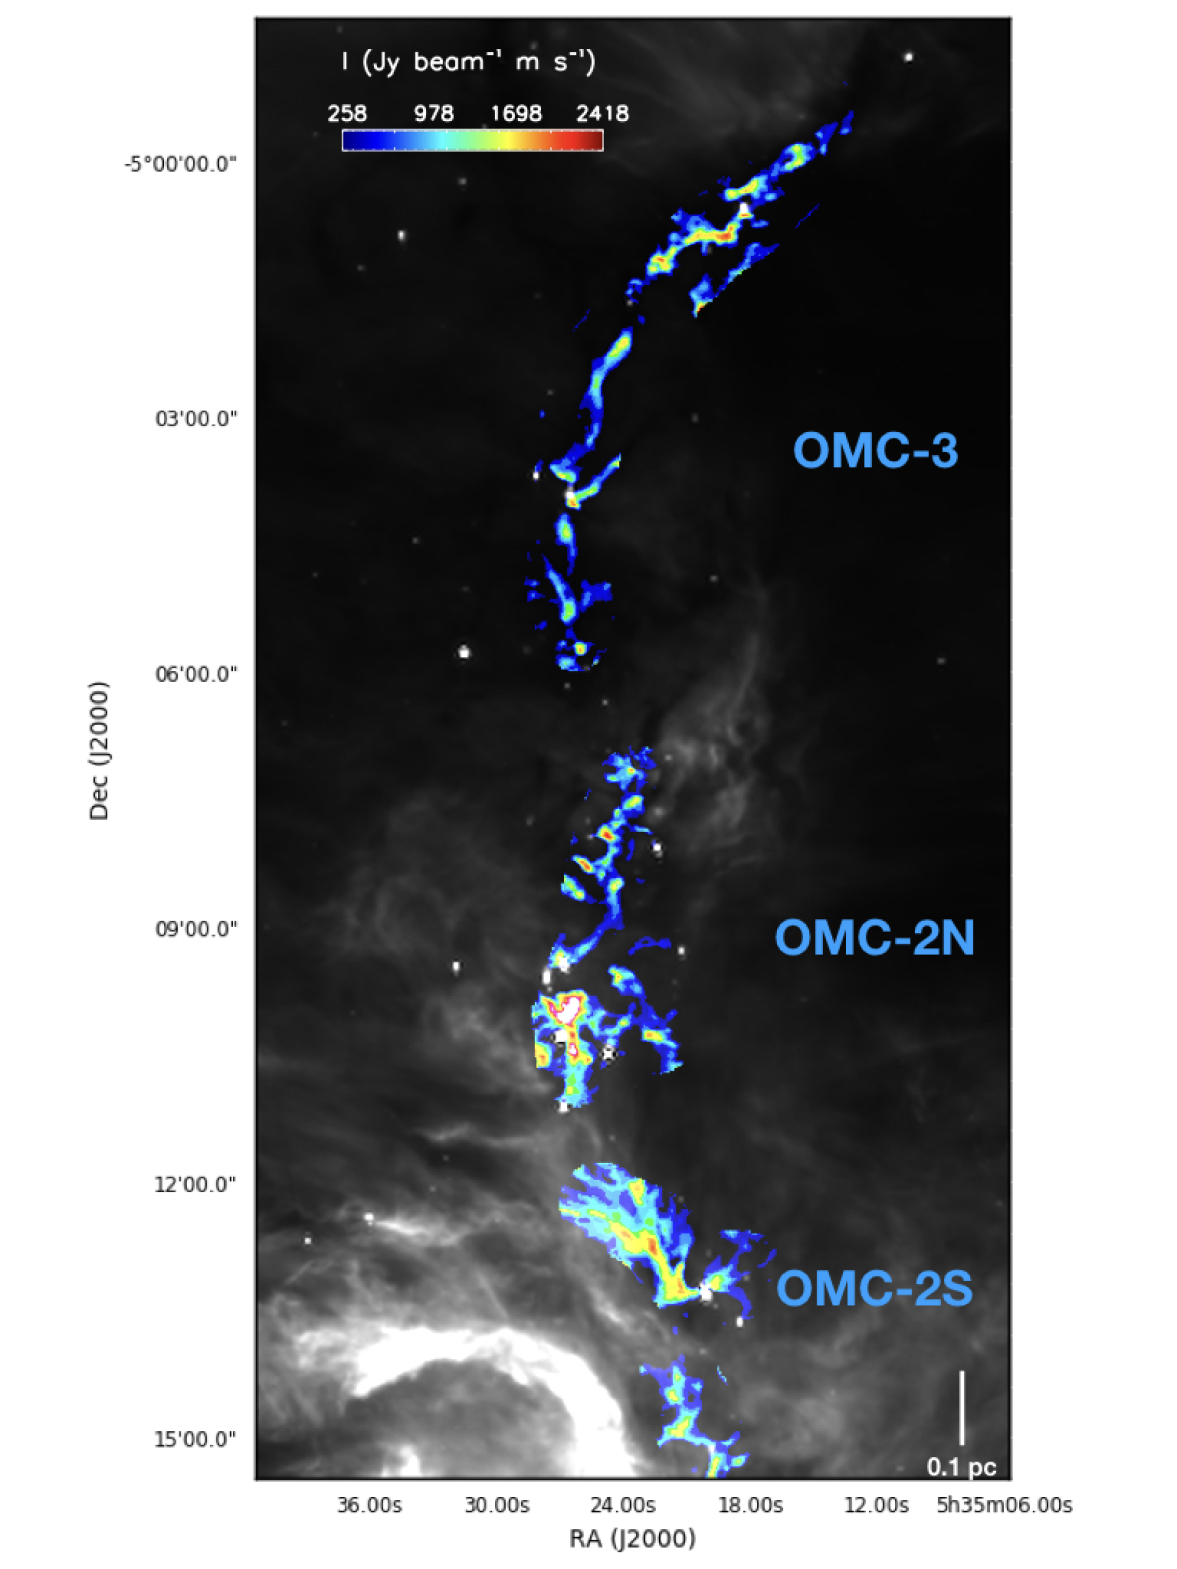
where the number density was estimated to be about based on our ALMA 3mm continuum images (Zhu et al. in preparation). The proximity of Orion and the high resolution of ALMA allow us to probe dense gas in a massive star-forming GMC down to the thermal Jeans scales. The integrated intensity map of based on the combined ALMA and Nobeyama images is shown in Fig 1,which is calculated over all hyperfine components.
We fitted the spectra with a modified version of Semi-automated multi-COmponent Universal Spectral-line fitting Engine (scouse222scouse is available at https://github.com/jdhenshaw/SCOUSE)(Henshaw et al. 2016). scouse is an IDL package to fit complex spectra line data in a robust, systematic, and efficient way, by manually fitting the spatially-averaged spectra into Gaussian components and then using them as input to the subsequent fitting on each individual spectrum. (1-0) has hyperfine structure (HFS). We adopted the hyperfine frequencies from Pagani et al. (2009) and modified scouse by following the HFS fitting program in CLASS (Forveille et al. 1989) to fit the hyperfine structure. Central velocity, intrinsic line width, total optical depth and excitation temperature are fitted.
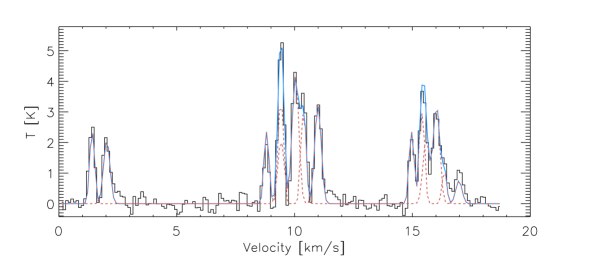
We applied the fitting procedure on different datasets, including the ALMA data, Nobeyama data, and the combined data. Multiple velocity components are fitted, see one example in Fig. 2. Thirteen percent of the ALMA-combined data have more than one gas component, which are treated independently in the following analysis. The signal-to-noise ratio of the isolated line in () used as the fitting condition is 3. The mean optical depths value of total seven hyperfine lines is 7.5 (ALMA data), 8.0 (ALMA-combined) and 2.7 (Nobeyama). We corrected the resulting line width by removing the smearing effect due to the channel width according to , where is the fitted line width (FWHM) and is the channel width.
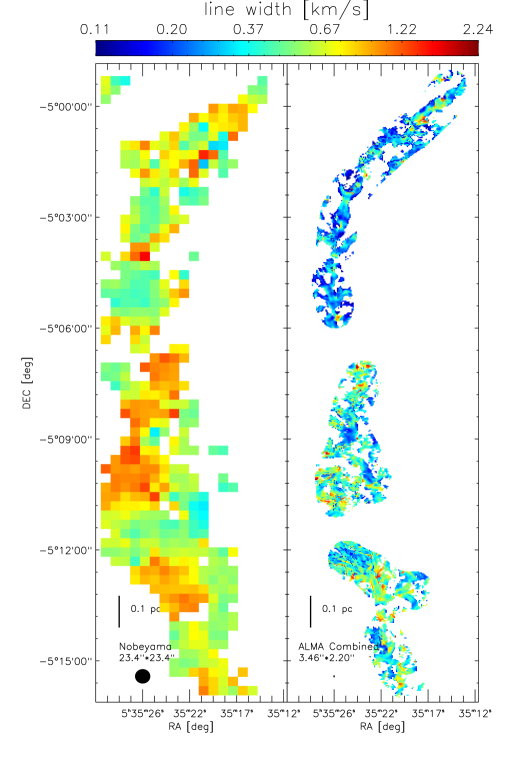
Table 1 shows the obtained mean line width (FWHM) of each region. For the entire OMC-2 and OMC-3 region, the mean line widths from the dataset of ALMA, ALMA+Nobeyama, and Nobeyama are 0.30 km s-1, 0.39 km s-1, and 0.69 km s-1, respectively. The line width from ALMA is slightly smaller than that of ALMA-combined data, which suggests that the extended structures revealed by combination contribute broader line widths. The histograms of line widths obtained from each dataset are shown in Fig. 4. The maps of line widths from Nobeyama and the ALMA-combined are presented in Fig. 3. It shows that the values of line widths from Nobeyama are mostly larger than those from the ALMA-combined data.
The non-thermal velocity dispersion and the sound speed are also calculated using the following equations (Myers 1983):
| (3) | |||
| (4) | |||
| (5) |
where and refer to the observed and the thermal dispersion, respectively. refers to the observed line width (FWHM), is the Boltzmann constant, is the kinetic temperature of the gas, refers to the mass of the observed molecule (29 a.m.u for ), and refers to the ISM mean molecular weight (2.37 a.m.u., Kauffmann et al. (2008)). The kinetic temperature is derived from the NH3 inversion transitions (1,1) and (2, 2), obtained by combining JVLA and GBT observations (Li et al. 2013). The used in each component is determined by the nearest position in the map. There are certain caveats in subtracting the sound speed. The NH3 data have a beam of 5\arcsec, while the data has a beam of 3\arcsec. It is possible that the temperature may further vary within the 5\arcsec beam. However, within corresponding physical scale of pc, the temperature variation does not produce significant line width fluctuation. Within dense gas where the gas and dust are well coupled, the gas temperatures in dense gas at that small scale only vary by a couple of kelvins at most (see e.g. Li et al. (2013)). Thus if assuming the temperature at 5\arcsec beam is overestimate to be 14K from a real temperature of 12K, the sonic portion of the line width changes from 0.22 km s-1 to 0.21 km s-1. This does not affect the subsequent analysis of this paper.
A comparison of different datasets is shown in Fig. 5. For the dataset of ALMA, Combined, and Nobeyama, mean / values are 0.49, 0.62, and 1.08, respectively. This indicates that the line widths in the filaments from ALMA are subsonic. The line widths from the combined observations of ALMA and Nobeyama are larger but remain subsonic. In contrast, the line widths obtained from the Nobeyama data are transonic (). The commonly observed supersonic or transonic line width, mostly referred to as turbulence, is a superposition of motions at different scales, which starts to be resolved by ALMA.
| OMC-3 | OMC-2N | OMC-2S | OMC23(1) | |
|---|---|---|---|---|
| ALMAa | 0.27 | 0.34 | 0.29 | 0.30 |
| Combinedb | 0.30 | 0.45 | 0.45 | 0.39 |
| Nobeyamac | 0.65 | 0.78 | 0.69 | 0.69 |
0.86Line width here is as the full width at half maximum, FWHM. OMC23 represents the entire region including OMC-2S, OMC-2N, and OMC-3. The line widths in this column show the collections from these three regions. Results from the ALMA (the 12-m main array and ACA ) observations, with a beam of \arcsec. Results from the combined ALMA (the 12-m main array and ACA) and Nobeyama observations, with a beam of \arcsec. Results from the Nobeyama 45m Telescope, with a beam of \arcsec.


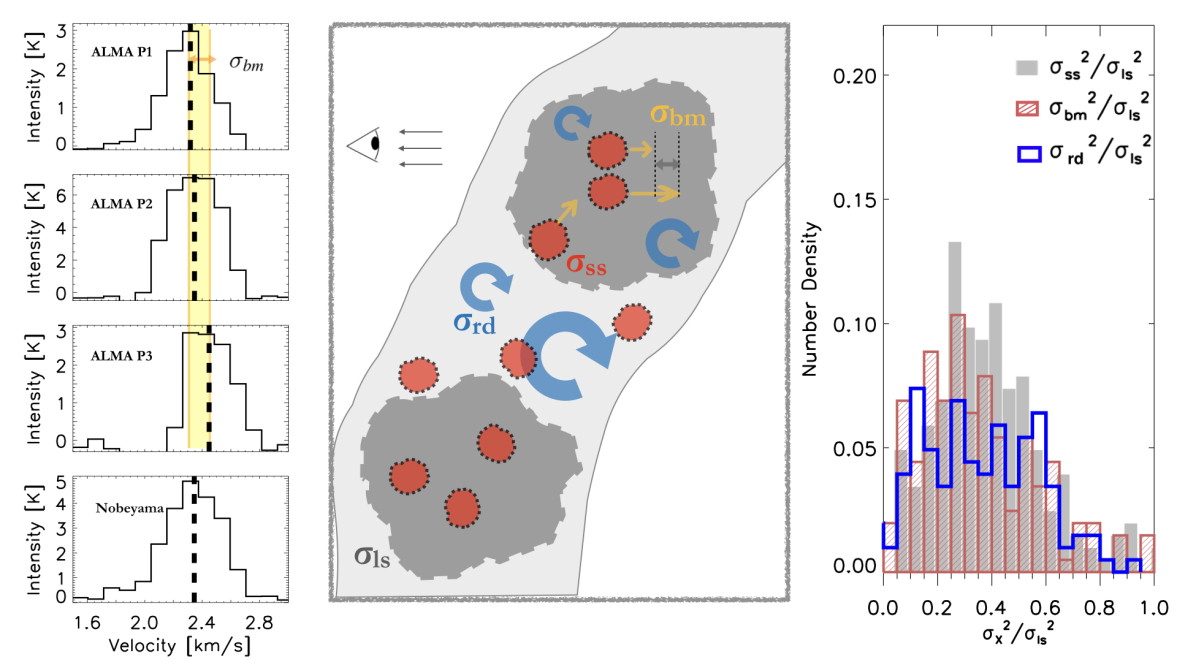
Further inspections of the ALMA data reveal that the line dispersion can be consistently decomposed into three components (Fig. 6)
| (6) |
where and refer to the line dispersion at large and small scales as measured by Nobeyama and ALMA-combined, respectively; bulk-motions is the standard derivation of centroid velocities of the ALMA spectra within a single Nobeyama beam; residual represents the residual part by subtracting and from . These components are calculated by the following equations:
| (7) | |||
| (8) | |||
| (9) |
is the line dispersion observed by Nobeyama, whose beam covers N pixels in ALMA observation (). The line dispersion at small scales, , is the mean line dispersion among N ALMA pixels weighted by the factor . refers to the integrated total intensity in pixel from ALMA and is the sum of integrated intensities from N ALMA pixels within the corresponding Nobeyama area (). The bulk-motions, , is described by the derivation of centroid velocities of the ALMA spectra from the mean velocity (). is the remaining part subtracting and from . Averaged over the whole map, the three components all have a significant contribution to the line dispersion, specifically, with mean values of at , the bulk motion at , and at .
Although the exact makeup of line widths varies from beam to beam (see in the right panel of Fig. 6), the three components are omnipresent. Checking the whole region, where the quality of combination may change from a total flux recovery at strong emission points to lower flux recovery () at diffuse regions, the residual part, is still present. This may, to some extent, show that the existence of the residual part is not because of the imperfection of data reduction. We further postulate that, when the ALMA beam is resolved with finer resolution, can be broken into three components, i.e., the non-thermal line dispersion currently obtained at 1200 au scales (albeit subsonic) can still be further decomposed into relative motions and seemingly ‘intrinsic’ line width. Such a testable hypothesis could help reveal a fundamental quality of the dense gas motion in a massive star-forming cloud, namely, the turbulence (as seen by line width) seems to be self-similar, but resolution-dependent to observers.
4 Discussion
Massive stars can form in supersonically turbulent gas through turbulent core accretion (McKee, & Tan 2002, 2003). Myers et al. (2014) also simulated star formation in turbulent, magnetized dense clumps with radiative and outflow feedback. In their simulations, the turbulence creates a network of overdense filamentary structures, where stars are born.
Recent high-resolution observations, however, consistently find narrow line width. Sokolov et al. (2018) found 1/3 of pixels in their images with subsonic non-thermal line dispersion. Compared to this work, that data set has one order of magnitude coarser spatial resolution at about 0.07 pc. This corresponds to the transition scale found in this work. Furthermore, the line width analysis in Sokolov et al. (2018)’s was largely based on hyperfine fitting of (1,1), which has unresolved components. Previous work (Stutzki & Winnewisser 1985; Li et al. 2013) have shown that the fitted opacity and line width can be coupled and affected by blending. Hacar et al. (2018) did observe the N2H+ (1-0) line toward OMC-1 and OMC-2 with ALMA and also found the non-thermal velocity dispersion similar to or smaller than that of the thermal motion. They combined ALMA and IRAM 30m data and found a mean of 0.81 ( of the positions are subsonic). Our observation is consistent with this trend, but yet have substantially better fidelity at finding subsonic turbulence. In direct comparison with Hacar et al. (2018), our work utilized combined GBT+VLA NH3 data images (5\arcsec) vs. GBT-only ones with a 32\arcsec beam in Hacar et al. (2018), which could result in overestimation of sound speed. Our ALMA data are also more than 2 times deeper ( 11 mJy/beam) than those in Hacar et al. (2018) (25 mJy/beam) and thus provide better dynamic range.
Megeath et al. (2016) presented more than 5000 YSOs in both Orion A and Orion B. Based on the same data sets, we have discussed a subset of protostars in OMC2/3 in Li et al. (2013). These protostars are predominantly low mass objects, although the thermal structure of the whole Orion-A cloud is purportedly determined by the UV field from the OB cluster (Stacey et al. 1993; Li et al. 2013). The influence of the Trapezium cluster is manifested in elevated cloud surface temperatures, which appear to be decreasing with distance to the cluster. Even under the influence of an OB cluster, the dense gas in Orion still transits to subsonic non-thermal line widths, when properly resolved. The unequivocally detected subsonic non-thermal line dispersion here shows that Orion, an OB cluster hosting region, has similar dependence of line dispersion on spatial scales to that in low mass star forming regions (Goldsmith 1987; Caselli et al. 2002).
Previous studies, mostly in low mass star forming regions, seem to be able to identify spatially coherent features, where the transition of subsonic line width happen. Pineda et al. (2010) presented a transition to the velocity dispersion between a subsonic dense core and its surrounding gas by observing towards B5 region in Perseus with GBT. They found a factor of 2 more turbulent gas in the surrounding environment than in the dense core. Further high resolution observations found an subsonic filament and dense gas condensations embedded within this region (Pineda et al. 2010) and suggested that filament fragmentation can lead to multiple stellar systems by Pineda et al. (2011). Hacar et al. (2013) found transonic filament bundles in the L1495/B213 Taurus region. No such transition feature, either in filaments or core envelopes, can be clearly seen in OMC2 and OMC3. More detailed analyses are being carried out.
5 Conclusions
In this paper, we report ALMA observations of the J=(1-0) transition toward OMC2 and OMC3, the relatively quiescent region in the Orion molecular cloud, which is the nearest giant molecular cloud with OB clusters. . Our main results are as follows:
1 We obtained high-quality ALMA images of dense gas () in Orion Molecular Cloud 2 and 3 with an RMS of 11 mJy per \arcsec beam (0.006 pc) per 0.11 km s-1 channel, which are more sensitive than previous works of comparable spatial resolution (cf. Hacar et al. (2018); Ren et al. (2014)). We were able to probe density peaks as well as extended structures down to the thermal Jeans scale (0.005 pc), with unprecedented spatial dynamic range.
2 We analyzed the non-thermal component of the line width, based on a combined analysis of both ALMA+Nobeyama data and GBT+VLA images with comparable resolution. There exists a clear transition from transonic non-thermal line dispersion (/=1.08) to subsonic line dispersion (/=0.62) between the scales of pc and pc.
3 The line dispersion of each single-dish beam (Nobeyama) can be decomposed into three components, namely, small-scale line dispersion (based on ALMA-combined) of , bulk motion (based on the dispersion among the centroid velocities of each ALMA-combined beam) of , and the residual part of 8 % being the persistent difference between the sum of the two aforementioned components and the full line width from the single-dish beam.
4 The transition from supersonic to subsonic line width (‘turbulence’) suggests that supersonic turbulence may be not necessary in massive star formation at certain scales.
Acknowledgements.
This work is supported by the National Natural Science Foundation of China Grant No. 11988101, No. 11725313 and No. 11629302, the CAS International Partnership Program No.114A11KYSB20160008, This work was carried out in part at the Harvard-Smithsonian Center for Astrophysics .References
- Caselli & Myers (1995) Caselli, P., & Myers, P. C. 1995, ApJ, 446, 665.
- Caselli et al. (2002) Caselli, P., Benson, P. J., Myers, P. C., & Tafalla, M. 2002, ApJ, 572, 238.
- Forveille et al. (1989) Forveille, T., Guilloteau, S., & Lucas, R., 1989, CLASS Manual (Grenoble: IRAM)
- Friesen et al. (2017) Friesen, R. K., Pineda, J. E., co-PIs, et al. 2017, ApJ, 843, 63
- Genzel & Stutzki (1989) Genzel, R., & Stutzki, J. 1989, ARA&A, 27, 41.
- Goldsmith (1987) Goldsmith, P. F. 1987, Interstellar Processes, 134, 51.
- Gregersen et al. (1997) Gregersen, E. M., Evans, N. J., Zhou, S., & Choi, M. 1997, ApJ, 484, 256.
- Hacar et al. (2013) Hacar, A., Tafalla, M., Kauffmann, J., et al. 2013, A&A, 554, A55
- Hacar et al. (2018) Hacar, A., Tafalla, M., Forbrich, J., et al. 2018, A&A, 610, A77.
- Henshaw et al. (2016) Henshaw, J. D., Longmore, S. N., Kruijssen, J. M. D., et al. 2016, MNRAS, 457, 2675.
- Kauffmann et al. (2008) Kauffmann, J., Bertoldi, F., Bourke, T. L., et al. 2008, A&A, 487, 993
- Kong et al. (2018) Kong, S., Arce, H. G., Feddersen, J. R., et al. 2018, ApJS, 236, 25
- Larson (1981) Larson, R. B. 1981, MNRAS, 194, 809.
- Li et al. (2013) Li, D., Kauffmann, J., Zhang, Q., & Chen, W. 2013, ApJ, 768, L5.
- Mardones et al. (1997) Mardones, D., Myers, P. C., Tafalla, M., et al. 1997, ApJ, 489, 719.
- McKee, & Tan (2003) McKee, C. F., & Tan, J. C. 2003, ApJ, 585, 850
- McKee, & Tan (2002) McKee, C. F., & Tan, J. C. 2002, Nature, 416, 59
- McKee & Ostriker (2007) McKee, C. F., & Ostriker, E. C. 2007, ARA&A, 45, 565.
- Megeath et al. (2016) Megeath, S. T., Gutermuth, R., Muzerolle, J., et al. 2016, AJ, 151, 5.
- Myers et al. (2014) Myers, A. T., Klein, R. I., Krumholz, M. R., et al. 2014, MNRAS, 439, 3420
- Myers (1983) Myers, P. C. 1983, ApJ, 270, 105.
- Nakamura et al. (2019) Nakamura, F., Oyamada, S., Okumura, S., et al. 2019, PASJ, 32.
- Pagani et al. (2009) Pagani, L., Daniel, F., & Dubernet, M.-L. 2009, A&A, 494, 719
- Peterson & Megeath (2008) Peterson, D. E., & Megeath, S. T. 2008, Handbook of Star Forming Regions, Volume I, 4, 590.
- Pineda et al. (2010) Pineda, J. E., Goodman, A. A., Arce, H. G., et al. 2010, ApJ, 712, L116
- Pineda et al. (2011) Pineda, J. E., Goodman, A. A., Arce, H. G., et al. 2011, ApJ, 739, L2
- Ren et al. (2014) Ren, Z., Li, D., & Chapman, N. 2014, ApJ, 788, 172
- Rosolowsky et al. (2008) Rosolowsky, E. W., Pineda, J. E., Foster, J. B., et al. 2008, ApJS, 175, 509
- Shimajiri et al. (2011) Shimajiri, Y., Kawabe, R., Takakuwa, S., et al. 2011, PASJ, 63, 105.
- Shirley et al. (2003) Shirley, Y. L., Evans, N. J., Young, K. E., Knez, C., & Jaffe, D. T. 2003, ApJS, 149, 375.
- Sokolov et al. (2018) Sokolov, V., Wang, K., Pineda, J. E., et al. 2018, A&A, 611, L3.
- Stacey et al. (1993) Stacey, G. J., Jaffe, D. T., Geis, N., et al. 1993, ApJ, 404, 219.
- Stutzki & Winnewisser (1985) Stutzki, J., & Winnewisser, G. 1985, A&A, 144, 1.
- Svoboda et al. (2019) Svoboda, B. E., Shirley, Y. L., Traficante, A., et al. 2019, ApJ, 886, 36.
- Tan & McKee (2004) Tan, J. C., & McKee, C. F. 2004, ApJ, 603, 383.
- Tatematsu et al. (2008) Tatematsu, K., Kandori, R., Umemoto, T., & Sekimoto, Y. 2008, PASJ, 60, 407.
- Zucker et al. (2020) Zucker, C., Speagle, J. S., Schlafly, E. F., et al. 2020, A&A, 633, A51