DFT Modelling of Explicit Solid-Solid Interfaces in Batteries: Methods and Challenges
Abstract
Density Functional Theory (DFT) calculations of electrode material properties in high energy density storage devices like lithium batteries have been standard practice for decades. In contrast, DFT modelling of explicit interfaces in batteries arguably lacks universally adopted methodology and needs further conceptual development. In this paper, we focus on solid-solid interfaces, which are ubiquitous not just in all-solid state batteries; liquid-electrolyte-based batteries often rely on thin, solid passivating films on electrode surfaces to function. We use metal anode calculations to illustrate that explicit interface models are critical for elucidating contact potentials, electric fields at interfaces, and kinetic stability with respect to parasitic reactions. The examples emphasize three key challenges: (1) the “dirty” nature of most battery electrode surfaces; (2) voltage calibration and control; and (3) the fact that interfacial structures are governed by kinetics, not thermodynamics. To meet these challenges, developing new computational techniques and importing insights from other electrochemical disciplines will be beneficial.
I Introduction
High energy density batteries are instrumental to vehicle electrification and to grid storage which helps alleviate intermittency in solar and wind energy generation. Deeper understanding of existing materials and the search of new electrode and electrolyte materials are crucial for developing higher capacity, faster-charging, safer, and longer-lasting batteries.whittingham Battery interfaces are also universally acknowledged to be critical for governing battery rate capability and stability.bes Charge/discharge processes, as well as many side reactions that lead to degradation, self-discharge, and thermal runaway, initiate at interfaces.
Electronic structure Density Functional Theory (DFT) modelling of the crystalline interior of electrodes, for the purpose of predictng phase stability, equilibrium voltages, and lithium diffusion kinetics, has been widely practised for decades.ceder ; ceder1 ; islam1 ; islam2 ; islam3 It provides important guidance to experiments. In contrast, DFT modelling of explicit battery interfaces arguably needs further conceptual development and systematization. Here we distinguish explicit interfaces where two phases are in contact in the same simulation cell, from single-phase DFT calculations used to infer interfacial properties indirectly.phase The present work focuses on modelling methods, offers somewhat pedagogical discussions on the rationale behind the DFT approaches used in our group, and examines future directions and improvements. Simple material interfaces, mainly involving lithium metal, are used as illustrations, but the principles involved should be broadly applicable to other electrodes. Even simple materials exhibit complex interfaces that require substantial approximations; the nature and consequences of some key implicit approximations are highlighted. We restrict ourselves to vanishing current densities.prendergast This paper is intended to be a topical, critical overview, not a comprehensive review of battery interface DFT modelling.qi_review ; borodin17 ; butler
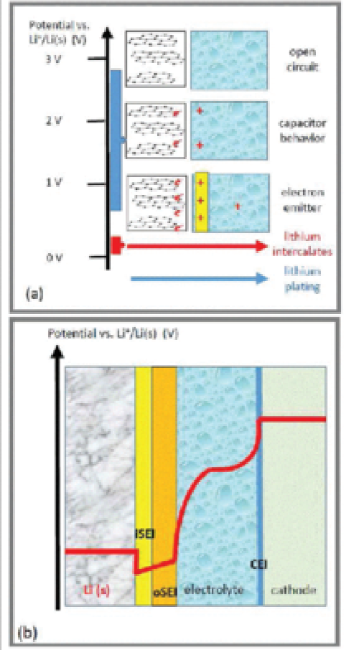
A useful illustration of the multiplicity of interfacial processes is the first charge of graphite anodes used in commercial liquid electrolyte-based lithium ion batteries (Fig. 1a). The “open circuit” potential (OCP) of pristine graphite in organic carbonates, e.g., ethylene carbonate, EC, mixed with salts and cosolvents, is 3 V vs. Li+/Li(s) (henceforth this is the reference used unless noted). We stress that OCP is measured by immersing the electrode in the electrolyte over experimental time scale, impling that the interface is well-equilibrated. As charging begins and the voltage drops, graphite acts as an inert electrode like those in electrochemical capacitors. Excess go to the surface and their negative charges are compensated by an enhanced local concentration of cations in the electrolyte near the interface; the familiar electric double layer (EDL, effectively a dipole sheet) is formed. As the voltage approach 0.7 V, graphite acts as an electron emitter — possibly also as an electrocatalyst at its edge site functional groups — and the organic solvent is electrochemically reduced in what will be called “parasitic reactions.” This is because high energy batteries typically operate at voltages outside the electrochemical stability limit of electrolytes.xu2004 ; stability ; batt (Counterions can be reduced at higher voltages, more slowly and to a lesser extent.borodin11 ; borodin15 ; vedge ) The passivating “solid electrolyte interphase” (SEI)xu2004 ; qi_review ; aurbach_mg grows from these decomposed electrolyte fragments, but can tunnel or diffuse through the nascent film, possibly as part of Li atoms, until later charging cycles. The EDL, which sustains the applied voltage, may now partly reside in the solid film, not just in the liquid (Fig. 1b). Li+ does not intercalate into graphite sheets until 0.2-0.1 V (not counting edge sites). This small 0.1 V voltage window has seen the majority of DFT studies,persson in the bulk LixC6 region. By continuity, in this regime, the voltage must be a manifestation of both the graphite electronic structure which changes with , and the EDL contribution. The SEI continues to grow/evolve in this window. When a LiC6 stoichiometry is attained, the fully charged graphite reverts to an inert electrode, albeit coated with SEI, that may plate lithium metal at negative voltages. Lithium plating is detrimental to battery life and safety. Related processes occur on transition metal oxide cathode surfaces, on which “cathode electrolyte interphase” (CEI) is formed (Fig. 1b); however, the voltage-dependent parasitic reactions there most likely involve species in contact with the surface, just like in water splitting, rather than long-range electron transfer like on the anode.
Thus, as our previous overview emphasized,interface1 batteries interfaces embody the rich physics of mulitple electrochemical devices, and DFT-based battery modelling benefits from borrowing from diverse computational disciplines. Electrified liquid/solid interfaces on passive, pristine carbon or platinum surfaces are relevant to electrochemical capacitors and electrocatalysis; these areas have well-established DFT modelling protocols.otani ; otani12 ; otani13 ; mira ; mira2014 ; neurock ; sugino1 ; arias ; dabo1 ; marzari ; sprik Transition metal oxide/liquid interfaces in batteries are in some ways related to electrochemical and photoelectrochemical water splitting.sprik_tio2 ; sprik_tio2a ; selloni_tio2 ; galli_tio2 Electrodes covered with passivating solid films are relevant to breakdown of surface oxide films which protect metal surfaces against corrosion, and constructions similar to Fig. 1b have been invoked in corrosion studies.macdonald ; marks ; costa Electroplating studies are also of obvious interest to batteries.schmickler
Passivating films on organic-solvent-based battery anode surfaces have inorganic (iSEI) and organic (oSEI) components (Fig. 1b),aurbach_two_layer leading to multiple solid-solid interfaces. We argue that it is as urgent to model these comparatively neglected inorganic solid interfaces as the solid-liquid interfaces which have been the mainstay of computational electrochemistry. DFT simulations have been conducted on explicit battery solid-solid interfaces relatively recently,santosh ; holzwarth ; solid ; gb ; batt ; ucsd ; sodeyama ; tateyama1 ; tateyama2 ; sumita partly because all-solid-state batteries with ceramic- or sulfide-based solid electrolytes constitute a timely research area. Many aspects of solid-solid interface studies in liquid-electrolyte batteries are informed by and are transferrable to these solid electrolytes.batt ; gb The main difference is the solid film/electrolyte thickness — nanometers vs. microns. The much thicker solid electrolytes come with a wider “space charge” regionvoltage_map ; kpfm which can potentially be modelled using continuum methods coupled to DFT currently applied to the Mott-Schottky layer at semiconductor interfaces.dabo1 One theme common to both is that the charge carrying cation M+ (Li+ and Na+) is highly mobile by solid state conductivity standards (otherwise the material would not be used in batteries). Hence the total number of M atoms should vary with voltage at the interface as well as inside electrodes.
We identify three computational challenges somewhat unique to battery interfaces. One is the ubiquity of the aforementioned solid-solid interfaces. Solid surface films in which M+ can diffuse limit the utility of modelling techniques traditionally used in the liquid state like DFT-based molecular dynamics (also called ab initio molecular dynamics or AIMD).qi_review ; nasa ; goddard ; bal_lioh ; budzien This is because of time scale mismatch: ionic motion and relaxation in solid occur many orders of magnitude slower than liquid state diffusion.
Another critical issue is voltage determination and control. First we stress that an assumption often invoked when modelling explicit battery interfaces, namely that voltages in interfacial simulation cells are determined by the lithium content/energetics, is incorrect. Instead, we adopt the definition used in other electrochemical disciplinesotani ; otani12 ; otani13 ; mira ; mira2014 ; arias ; dabo1 ; marzari ; voltage ; sprik and reconcile it with traditional battery modelling approaches. Using the correct definitions is necessary to estabilish equilibrium, and to construct simulation cells at overpotentials conditions.
Finally, battery interfaces are determined by kinetics, not thermodynamics. Inorganic electrode and electrolyte materials are often sintered for hours at 900 oC. A phase diagram, thermodynamics modelling approach suffices under those conditions.phase In constrast, interfaces that involve organic solvents are assembled at room temperatures where chemical reactions are slow. Even all-solid-state battery interfaces are usually created at modest (200 oC) temperatures, where thermodynamic equilibrium does not always apply,lipon although thermodynamic phase diagrams for bulkphase and surfacesmira2018b provide the foundation for kinetics investigations. Thermodynamic (single-phase) calculations are elegant and systematic.butler ; phase Interfacial kinetics calculations tend to be idiosyncratic. They depend on the realism of the model interface, lattice matching, and other issues common to all interface modelling efforts. Here we focus on issues unique to electrochemical interfaces.
It must be stressed that a reaction with a large exothermicity () does not necessarily exhibit a low barrier (). One famous example is the Grotthuss mechanism for proton exchange in water:
The left and right side are the same, and is exactly zero. Thus the thermodynamic driving force is the lowest possible; a more unfavorable would stop the reaction from occurring. Yet the reaction is almost barrierless (=0).tuckerman Hence kinetics and thermodynamics are not always correlated.
Kinetics is particularly relevant to the viability of conversion cathode materialswolverton and to stability against parasitic reactions.qi_review Currently DFT modelling of conversion cathodes is focused on elucidating metastable intermediate states,wolverton not on computing voltage-dependent reaction barriers;chan in electrocatalysis, both intermediates and barriers are known contribute to overpotentials.chan Finally, kinetics approaches may not identify the final products. To circumvent this, whenever possible, we have focused on elucidating the stability of proposed surface film components rather than start parasitic reaction calculations from pristine electrode surfaces.batt
II Methods and Models
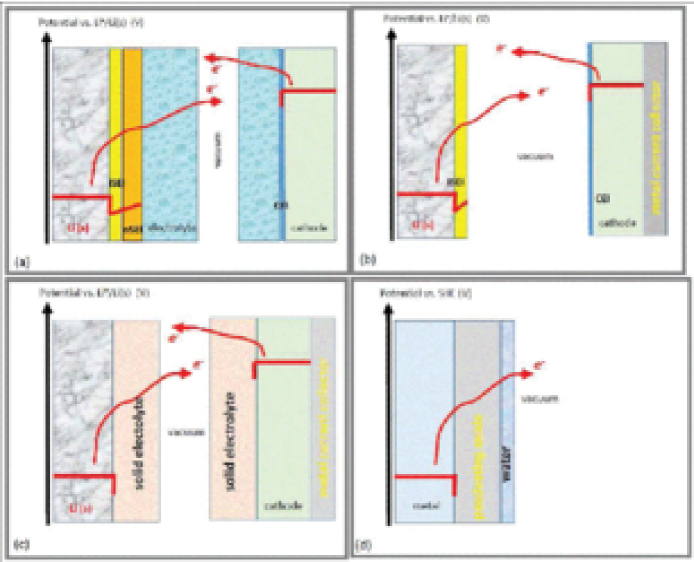
DFT calculations only deal with half cells because DFT is a ground state theory which supports a single Fermi level (). Hence we insert a vacuum region into Fig. 1b, generating two half cells (Fig. 2a). This construction is rigorous for liquid electrolyte systemstrasatti and has been applied in DFT modelling work.neurock ; sugino1
II.1 Models of Thin-Film-Covered Anode Interfaces
Focusing on the anode, the multilayer SEI modelaurbach_two_layer suggests that inorganic products coat the active anode material, separating it from the thicker, amorphous, and porous organic/polymeric layer outside. The organic SEI is complex, and likely exhibits a low dielectric constant. Its micro- and even atomic-structures are subjects of current studies and debate.luning ; villanova ; utaustin SEI chemical compositions also evolve with time.evolve1 ; evolve2
To make progress, we replace the outer organic SEI (oSEI), with vacuum (Fig. 2b). This model focuses on the anode active material/innermost inorganic SEI (iSEI) interface, expected to play a main role in blockage of tunneling to the electrolyte. Our liquid-free, charge-neutral simulation cells resemble those we use to model all-solid-state battery interfaces (Fig. 2c).lipon In principle, the omitted electrostatic contribution from a liquid electrolyte can be computed using classical force-field-based molecular dynamics, but this is not applicable when an organic SEI covers the inorganic film. (To give an order-of-magnitude estimate, the liquid EC/vacuum interface exhibits a 0.3 V surface potential,voltage dwarfed in magnitude by solid-solid interface effects discussed below.) Another approach might be to replace the vacuum in Fig. 2b with implicit solvation.otani ; arias ; austrian While noble metal-liquid interactions have been calibrated in implicit solvation models, oxide/water or oxide/organic liquid interactions have not. Currently no dielectric solvation model is universally available or uniformally implemented into every DFT code. To enhance reproducibility, we work with vacuum interfaces. The EDL resides entirely within the thin solid film regions in our models. Our approach is clearly a limiting-case approximation, to be improved upon in the future.
Our half-cell model for solid-electrolyte/electrode interfaces (Fig. 2c) has an unavoidable ambiguity: the absolute work function (and hence the estimated voltage, see below) depends on the nature of the cleaved facet, unlike liquids which relax to universal liquid-vapor interfaces. Kelvin Probe Force Microscopy (KPFM) measurements of voltages in solids share this ambiguity.kpfm The voltage difference between cathode and anode does not depend on the cleaved surface provided the two vacuum-solid electrolyte interfaces are identical. Vacuum regions in fact exist in solid electrolytes, inside pores and cracks.pores
II.2 Voltage Definitions for Metallic Electrodes
Unique among electrochemical devices, battery electrodes can emit both electrons and the charge-carrying cation M+. The primary battery functions are charge and discharge, which involve M+ intercalation and exit from electrodes into the electrolyte, accompanied by flow in the external circuit. However, as discussed above, can also be emitted into (reduction) or captured from (oxidation) the electrolyte, accompanied by local M+ redistribution but not M+ transfer between electrodes.
To account for these separate functions, we define two voltages, and .voltage The “ionic” voltage is the canonical definition in the battery DFT literature.ceder It measures the energy gain by inserting an M atom, referenced to M(s)M(atom):
| (1) |
where is the total energy of simulation cell with an electrode with M atoms, is the M chemical potential in its bulk metal phase, and is the electronic charge. The entropy change is small in solids and is generally neglected in Eq. 1. is the widely used definition of voltages in computational electrochemistry; it is =-)/ modulo a constant, where is the vacuum level in the same simulation cell that there Fermi level is computed. is the prime mover in electrochemistry; potentiostats and voltmeters control and measure energy (), not M content.
is notoriously difficult to define and control in DFT calculations. For liquid electrolytes associated with corrosion, fuel cells, and batteries, AIMD-based thermodynamic integration approaches have been applied to calibrate the voltage in condensed phase simulation cells without vacuum regions.otani ; mira ; mira2014 ; voltage ; vedge (At least some of these worksvoltage ; vedge were influenced by the pioneering research of Sprik and coworkers.sprik2012 ; sprik2008 ) Such methods calculate half-cell electrochemical potentials via free energy changes; the predictions are solvent-dependent.
The majority of calculations rely on having a vacuum region (or a quasi-vacuum containing an implicit solvent) in the simulation cell. Vacuum is in effect the reference electrode. In periodic boundary DFT calculations, both finite temperature AIMDotani12 and T=0 K configuration optimization calculationsneurock ; arias have used vacuum to compute absolute voltages. The Berry’s phase method, under development for liquid electrolytes,sprik can potentially circumvent the need for vacuum.
The relation between voltage referenced to Standard Hydrogen Electrode (SHE), and the work function (), was famously quantified by Trassati for liquid electrolytes.trasatti It is minus 4.44 eV divided by . This relation has been incorporated into or used as calibration for implicit solvent formulations of voltage calculations.otani ; marzari ; arias In cluster-based quantum chemistry and DFT calculations, where only a solute and sometimes a few solvent molecules are surrounded with implicit solvent, calibration is not possible, and the Trasatti relation is directly applied to relate electron affinities (EA) and ionization potentials (IP) to redox potentials.homo ; borodin11 When the SHE reference is replaced with Li+/Li(s), the shift is changed from 4.44 eV to between 1.37 and 1.40 eV. The O(0.01 eV) differences are within DFT uncertainties.
A metallic electrode is just a large molecule where EA=IP, with the exception that different facets may have different ’s which are reconciled by charge transfer and/or geometric considerations.mermin The complex organic SEI (Fig. 2a) precludes calibration calculations here. Hence in this and our previous work, we simply assign
| (2) |
to electrodes in our overall charge-neutral simulation cells, just like for small molecules, and acknowledge the approximation in omitting the material outside the inorganic solid. Trasatti likely never intended the use of Eq. 2 in vacuum, but one can substitute a low dielectric electrolyte, like argon at low density. We also use this relation for pitting corrosion calculations, where water is optimized at T=0 K. In the future, we will switch to sampling H2O at T=300 K, which is the more rigorous approach. Unlike Ref. neurock, , which also opens a vacuum gap in the frozen bulk liquid electrolyte region, we include at most a sub-monolayer of water molecules. Like Refs. mira, ; voltage, ; vedge, and unlike Refs. otani, ; arias, , we control using atoms and , not with effective medium approaches extrinsic to standard DFT.
II.3 -Equilibrium
We define “-equilibrium” to be established when =. Rigorously speaking, -equilibrium is required for comparison with constant-voltage condition experiments. The exact -equilibrium condition is affected by the accuracy of the DFT functional used, which is neglected herein. Since the two electrochemical potentials follow the relation = + = implies a specific in the electrolytevoltage which can be used for future calibration calculations. When -equilibrium is violated, the system is at an overpotential with respect to at least one process. Overpotentials often occur in batteries because M+ and motions are generally separated by orders of magnitude in time scales. Experimentally, M+=Li+ relaxation times in cathode materials can be minutes.gitt For this reason, we also call and the “instantaneous” and “equilbrium” voltages, respectively. In DFT calculations, Li+ relaxation and motion are far more limited than in experiments because the time scale (if using AIMD) is much shorter, and there is no Li reservoir. Therefore DFT modelling of interfaces is even more susceptable to overpotentials. As long as the “electrode” (a large clump of atoms) is metallic, is instantaneously well defined, even if there are forces on atoms. is in contrast only well-defined when atomic forces are zero at zero temperature, or when the Boltzmann distribution is satisfied at finite .
An incorrect assumption often madeucsd (including in our early workbudzien ) is that simulation cells containing an interface is automatically at “open-circuit” voltage equal to . This ignores the possibility that -equilibrium can be violated. In fact, is seldom discussed or reported when modelling batteries. The reason is likely historical. The majority of DFT calculations on electrode materials deal with the crystal interior (i.e., they are “single phase”). In the absence of interfaces, the average electrostatic potential in the simulation cell is undefined to a constantdutch except in special cases. Hence the absolute , which depends the average potential, is also underfined — as is via Eq. 2. The only logical recourse then is to assume -equilibrium. When an electrode/electrolyte interface exists in the simulation cell, however, a potential drop occurs that can in principle be computed (Fig. 2). Other reasons interfaces may be out of equilibrium include the presence of high current densities, and electrode polarization whereby a liquid electrolyte responds too slowly to voltage changes. These are not addressed herein.
II.4 Grand Canonical Ensemble for and Li+
Excess surface densities on pristine electrode surfaces vary during charge and discharge of EDL capacitors, fuel cell electrodes, and other devices. As a result, mobile ions redistribute at interfaces and EDL’s are modified. Grand canonical treatments of , which permits fractional compensated by an effective medium, have been developed for this purpose.otani ; marzari
In batteries, charge carriers M+ are also mobile; their concentrations evolve as voltage varies not only inside battery anodes and cathodes, but also at interfaces where there is often less crystalline order. To model changing M+ content calls for Grand Canonical Monte Carlo (GCMC) or related methods, in conjunction with electronic structure calculations. AIMD simulations, one of the mainstays in battery interfacial calculations, lack this capability. MC is time-independent and can in principle circumvent the orders-of-magnitude solid-liquid time scale mismatch. In the past, DFT/MC calculations were costly because the global DFT energy was recomputed after each single-atom motion in a MC trial.siepmann GCMC/DFT-like calculations are being implemented;rappe ; sugino they are extremely promising for future studies of battery interfaces. Until such methods become widely available, the interfacial M+ content has to be varied manually or via high-throughput calculations, as it has been done in single phase battery electrode calculations.ceder ; ceder1
Many battery cathode materials are polaron-conducting transition metal oxides with finite band gaps. Rigorously speaking, is undefined such materials (unless surface/interface regions become metallicliverpool ); is pinned by defect/dopants levels not typically included in the simulation cell, and it cannot be said that all regions of the electrode are at the same voltage. Constant voltage methods which allow fractional in DFT calculationsotani ; marzari cannot be used because fractional occupancy of transition metal - or -orbitals is unphysical. Here one can look to experiments for guidance. In practical batteries, the cathode is a composite with active oxides mixed with conductive components. By adding a metallic slab like lattice-matched Au(001) to the bottom of spinel LixMn2O4, one can recover metal-like behavior (Fig. 2a).solid Regarding the structure of cathode surface films, much less is known about thinner, hard-to-characterize CEI on battery cathode surfaces in liquid-electrolyte batteries. Further discussions of cathode interfaces will be left to future overviews.
II.5 Modelling Kinetics and AIMD Simulations
At least three general approaches have been applied to model interfacial kinetics in batteries: (1) unconstrained AIMD simulations at or near room temperature; (2) high temperature AIMD; (3) barrier predictions. (1) and (2) are both unconstrained and only differ in intention; the former is meant to directly mimic near-experimental and -device conditions while the latter is explicitly understood to artificially accelerate timescales. Because of the computational expense, current AIMD simulations seldom exceed 1 ns in trajectory lengths.goddard So unconstrained AIMD trajectoriesgoddard ; bal_lioh ; budzien are at least 1012 times shorter than experimental time scales. M+-motion and bond-breaking reactions revealed in such AIMD trajectories are the initial steps. Even if AIMD predicts that the electrolyte is atomized,goddard nucleation of these products to SEI solid phases takes more time. Logically, if a change is observed in an AIMD trajectory, it provides important insights about the mechanism. If no change occurs, it is possible AIMD trajectories are just not long enough.
Alternatively, parasitic reactions at interfaces have been examined using AIMD at substantially elevated temperatures.nasa This accelerates reaction rates, but extrapolating predictions to target conditions (usually room temperature) is non-trivial. This approach can be extremely useful for discovering mechanisms that are subsequently quantified via barrier-finding calculations.
Reaction barrier calculations like umbrella sampling and metadynamics bypass trajectory length limits at the cost of having to choose pathways.meta ; tateyama ; benedek ; vedge In purely solid state calculations, zero-temperature nudged-elastic-band (NEB) calculations have become standard.neb From barrier calculations, we estimate mean reaction rates using the standard transition state theory expression
| (3) |
where is the activation energy and is the thermal energy at room temperature. At finite temperatures, free energy barriers () should be used in Eq. 3. We adopt =1012/s, within a factor of ten of prefactors used in the literature. Any step in a proposed multi-step reaction mechanisms is considered viable if it is exothermic (0) and if is less than one hour – which translates into 1 eV.batt
Rates may depend on voltages, while voltages are modified by atomic motion in finite sized simulation cells. This is because the work function is altered by the effective dipole moment via
| (4) |
is the surface density of a uniform point dipole sheet, is the average dipole magnitude and includes screening effects, and atomic units are used. This is an “interface” effect but the magnitude does not decay with distance from the interface. M+ displacement or the transfer of an following an electrochemical reaction changes , , and hence via Eq. 4 in finite simulation cells. Under constant voltage conditions, should be zero over the course of a reaction. To achieve this condition, constant ensemblespeterson or extrapolation to large cell sizesiceland have been applied in electrocatalysis calculations. Related methods have recently been applied to battery interfaces.otani_batt
In some cases, apparent degradation or “disordering” reactions can extend to micron depth beyond the interfacelipon_lco — far beyond DFT length scales. Fitting reactive force fields can extend the time- and length-scale associated with the battery interface reaction zone.bedrov_reaxff However, spin-dependent reactive potentials have not been devised for transition metal oxides. Standard modelling protocols like the “master equation” exist to deal with kinetics-controlled, multistep reactions in catalysis and gas phase reactions.kinetics So far the complexity of battery reactions has precluded their use.
To avoid challenging prospect of calculating all possible reaction mechanisms, whenever possible, we have focused on elucidating the stability of proposed surface film components.batt We call this the “surface film instability paradigm.” Recent application of artificial intelligence to determine locally optimal interfacial atomic structurestateyama2 can yield interfaces stable against bond-breaking. This promising approach may efficiently satisfy our stability criterion if quasi-kinetic constraints can be added.
II.6 Non-DFT and non-planewave Methods
We briefly mention non-DFT electronic structure methods which are not our focus. Quantum mechanics/molecular mechanics (QM/MM) methods have accelerated solution phase reactions by confining DFT to a small “QM” spatial region.qmmm1 ; qmmm2 Since electrochemical calculations involve voltages which require metallic electrodes, the “QM” required may still be substantial. Tight-binding methods have been long proposed for aqueous phase electrochemistry but require more development; tight-binding treatment of organic species and materials associated with battery o-SEI has yet to be developed. We apply a plane-wave plus projector-augmented wave (PAW) basis set, but the discussions above are applicable to all DFT basis sets, including mixed-planewave/atomic basis.siepmann
II.7 DFT Details
All DFT calculations are conducted under T=0 K ultrahigh vacuum (UHV) condition, using periodically replicated simulation cells and the Vienna Atomic Simulation Package (VASP) version 5.3.vasp1 ; vasp1a ; vasp2 ; vasp3 A 400 eV planewave energy cutoff and a 10-4 eV convergence criterion are enforced. Most calculations apply the PBE functional.pbe In one case, HSE06 is used as a spot check.hse06a ; hse06b ; hse06c The standard dipole correction is applied.dipole
We consider Li metal (001)/LiF (001) interfaces as exemplars of Fig. 2b. The base model has a 17.2817.2836 Å3 simulation cell with stoichiometric Li294F144. We conduct a 10 ps AIMD trajectory at T=400 K to equilibrate the interface, and then optimize the final MD configuration. The bottom two Li metal layers are held fixed throughout. When an O2 molecule is added to the surface, the lattice constant is expanded by 4 Å. 22 Brillouin sampling is used. For the purpose of checking PBE results with the HSE06 functional in this model, -point sampling is employed; decreasing the -point grid changes by less than 0.12 V.
To make connection with corrosion research, Al (111)/-Al2O3 (0001) interfaces are also considered. No definitive metal-oxide interfacial structure is known in the experimental literature, and proposed DFT-configurations with subtle differences yield significant changes in .bredas ; wang This is unlike the weakly interacting and more robust Li-metal/LiF interface. Like Ref. costa, , we apply AIMD simulations to equilibrate this interface. Our AIMD is conducted on a primitive surface cell with dimensions 4.818.3350 Å3 and Al70O54(H2O)6 stoichiometry. This is the size of a single surface unit cell, chosen to be commensurate with those of Refs. bredas, and wang, , so that a direct comparison of the respective properties with those work can be made. We aim to provide more relaxation than the purely T=0 K configuration relaxation of these two work. Our cell size is smaller than that in Ref. costa, . We do not claim our procedure yields the definitive structure of this complex interface, which likely depends on material preparation conditions.
Unlike previous DFT work, we add 3 H2O atop each surface Al3+ in an attempt to make surface Al ions 6-coorindated. After a 0.8 ps AIMD trajectory at T=400 K, the system is cooled to T=100 K in 0.15 ps. We find that one-third of the added water evaporates/detaches from the surface; they are removed. Another third dissociates into H+ and OH-. The atomic configuration is then optimized at T=0 K, resulting in a configuration where each surface Al is 4-coordinated, and the intact H2O per surface Al lies parallel to the surface, coordinated only to other surface O or OH groups. A 32 surface supercell is constructed from this primitive cell and is applied to examine oxygen vacancies with 221 Brillouin sampling.
The LiOH (001)/Li (111) interface is examined for kinetics purposes. Here the base model has a 13.5314.3340 Å3 simulation cell and a Li224O06H96 stoichiometry, and 221 Brillouin sampling is applied. In all cases Li and Al metals, softer than fluorides and oxides, are strained to match the fluoride or oxide supercell lattice constants. This changes the pure metal work function by 0.1 V. All simulation cells are charge neutral.
III Results
III.1 Lithium Metal in Vacuum
Consider a BCC lithium solid cleaved in the (001) direction in vacuum. The cohesive energy is that of Li-metal, and =0.00 V vs. Li+/Li as we remove one entire layer of Li atoms, according to Eq. 1. (The small strain energy is neglected.) The PBE-predicted work function is =3.02 eV, close to the experimental value of 2.93 eV.crc From Eq. 2, =1.65 V vs. Li+/Li(s). Hence the system is out of -equilibrium, at overpotential against Li dissolution. If there were a Li reservoir and an electrolyte, and =1.65 V were enforced by a potentiostat, the Li slab would completely dissolve.
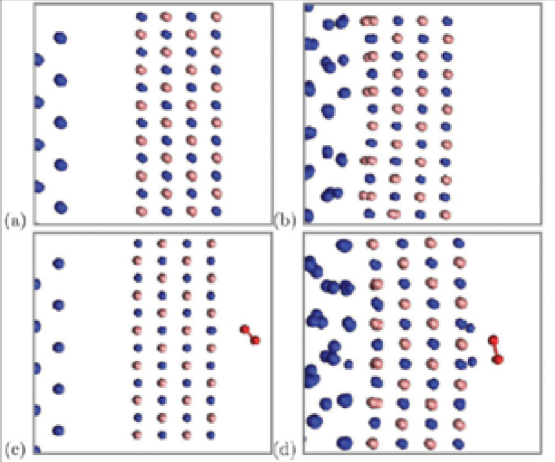
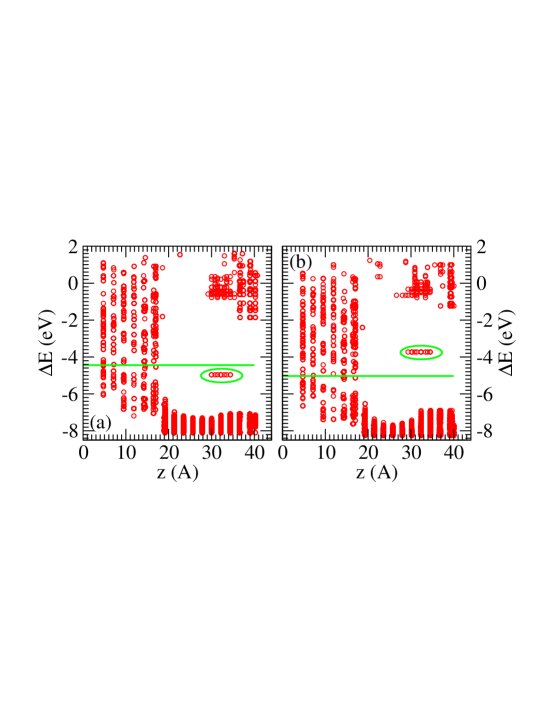
Fig. 3a reinforces this conclusion. A 8 Å -thick LiF slab with its (001) facet exposed is located 5 Å apart from the Li (001) slab. Neither the Li nor the LiF slab has a net charge or a net dipole moment when isolated. Fig. 4a depicts -axis-resolved orbital positions showing no electronic overlap between the slabs separated by vacuum. The electrostatic potential profile (Fig. 4c) suggests that the 5 Å -separated slabs remain largely dipole free. =1.65 V, only weakly perturbed from that of isolated Li-metal slab. Once again, .
This finding cannot be over-emphasized: it is incorrect to assume that Li metal is always at -equilibrium, i.e., at 0.0 V vs. Li+/Li(s), in an interfacial simulation cell. Experimentally, lithium is stable at or below 0.0 V; when stripping Li under overpotential conditions, Li also exists above 0.0 V. No conclusion about can be drawn from the existence of Li metal in a simulation cell. The same is true of other electrodes, including intercalation and conversion electrodes. The overpotential associated with plating and stripping of Mg anodes can approach 1 V.aurbach_mg Au electrodes are featured in numerous DFT interfacial simulation cells.arias Reported voltages () in that literature are correctly pegged to () modulated by the electric double layer,arias not assumed to be at the Au3++3Au(s) half cell voltage. Distinguishing and establishes electrochemical equilibrium and permits the modelling of overpotential effects.
(a) 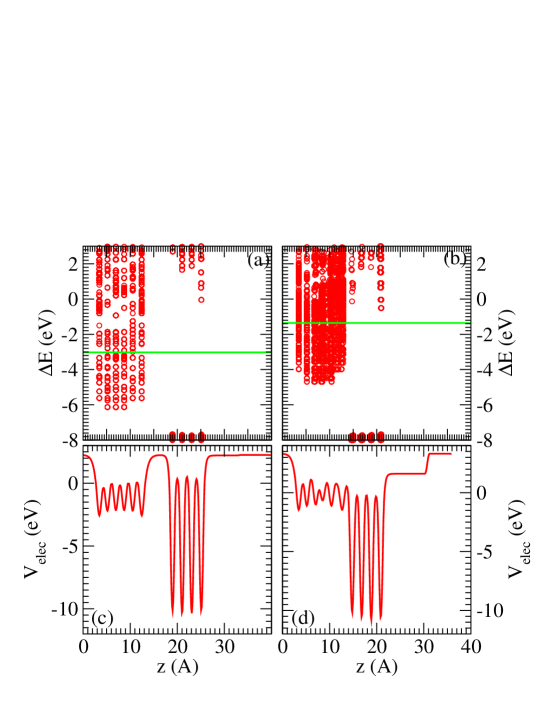
III.2 Surface Films Strongly Affect
Fig. 3b depicts the configuration obtained after we put the LiF and Li surface slabs in contact. The system develops a large dipole moment, and drops from the vacuum value of 3.02 eV to 1.54 eV. becomes 0.17 V (Eq. 2), much closer to =0.0 V than bare Li (001). The surface film brings it close to -equilibrium — without adding surface charges or liquid electrolyte. Similar, significant “contact potential” drops upon adding an inorganic film, which reduces (and hence via Eq. 2), have been noted in the corrosion,marks electronics,kondo , solid electrolyte,solid ; maier and Li-air batterynorskov modelling literature. They are partly caused by density rearranging within each material at the interface, creating a dipole layer (Eq. 4). The reduction in is reminiscent of the effect of a water monolayer on inert metal surfaces,gross except that the LiF film exhibits an induced, not permanent, dipole moment. Significant contact potentials can also be inferred from experiments,voltage_map ; kpfm although they are conducted at less than atomic resolution.
We can further reduce to -0.01 V in Fig. 3b (-equilibrium condition) by manually adding an interlayer of Li atoms directly underneath some of the F- anions at the interface.gb Adding Li atoms in this way is found to be thermoneutral to within 0.05 eV after accounting for Li chemical potential (Eq. 1). It suggests that the energy/voltage landscape at the interface has many similar local minima. This interlayer approach, which reflects the grand canonical ensemble environment, is motivated by the “interfacial charge storage” idea.maier Fig. 4b and 4d depict the resulting orbital alignment and electrostatic potential. A finite band gap remains in the LiF region, and no LiF surface state is occupied.
Doubling the LiF slab thickness to 18 Å without the Li-interlayer atoms yields a slightly larger by 0.05 eV, leading to =0.22 V. The somewhat different partly reflects system size effect, but is likely within the uncertainty margin. The Li2O (111)/Li (001) interface yields a contact potential drop of roughly the same size; however, there is small amount of leakage to the outer Li2O surface,gb which in reality would have led to further passivation by the organic materials outside. The PBE functional used herein has delocalization errorswtyang which may permit unphysical leakage from Li metal into LiF. To check that this does not overestimate the contact potential, we also apply the more accurate HSE06 functional to the Li/8-Å-LiF interface. The resulting is in fact 10% larger than the PBE prediction, showing that our PBE calculations most likely do not exaggerate the contact potential drop.
The flatness of the valence band edge (Fig. 4b) emphasizes that we are at “potential-of-zero-charge”-like conditions. Our focus is the near-anode region, not the voltage profile over long length scales (Fig. 1b). Nevertheless, if in real-life batteries the lithium anode behaves like Fig. 4b, the voltage profile in Fig. 1b would remain flat in the liquid electrolyte region until it reaches the cathode EDL. This ignores the fact that LiF is not the only SEI component. Charges at defect sites and other factors may also introduce electric fields near the anode surface and creates an EDL, part of which may now reside at the solid-solid interface. The exact partitioning of solid state vs. liquid state EDL depends on the free energy cost of developing those EDL’s. This little-explored EDL partitioning offers a potential design principle for improving battery interfaces.
III.3 How -Equilibrium and Affect DFT Predictions
is seldom reported or controlled in DFT modelling of battery interfaces. Some reported DFT interface simulations are likely out of -equilibrium;budzien ; ucsd they are at as-synthesized rather than battery cycling conditions with well-defined voltages. What are the consequences?
is crucial for determining the electrochemical equilibrium conditions where M+ insertion from liquid electrolyte into metallic electrode is not at an overpotential.voltage ; otani_batt ; tb The properties under these conditions, e.g., M+ insertion kinetics and barrier, is expected to strongly depend on . is also crucial for passive electrodes acting as emitter. The correct value yields redox event onset at the right voltage. In this light, the edge-termination dependence of LiC6 on electrolyte redox behavior in our early workbudzien is likely the result of the graphite edge sites giving different , not computed at that time.
Fig. 3c-d qualitatively illustrate this effect by placing a O2 molecule on to the outer LiF surfaces of Fig. 3a and 3b. This example draws on DFT modelling of O2 reduction on Al2O3-coated Al surfaces,costa relevant to the growth of a passivating film there, and sidesteps more complex organic molecule redox demonstrations.vedge ; gb When LiF is coated on Li with an “interlayer Li” (Fig. 3b), =0.0 V, and an readily transfers through the LiF film to the adsorbed O2. Bader analysisbader confirms that a -1.00 net charge exists on the oxygen species, i.e., it is a superoxide (O). When the Li and LiF slabs are well-separated (Fig. 3a), is much less reductive (1.67 V), and the O2 weakly physisorbs instead. Magnetic moment analysis suggests that O2 is a triplet molecule. Bader analysis yields a -0.31 net charge. The non-integer value is unphysical and is likely due to DFT/PBE localization errorwtyang for this space-separated configuration, which is challenging for DFT methods.
In the literature, it has been reported LiF-coated Li metal rapidly decomposes EC molecules in AIMD simulations.borodin_lif ; bal_lioh Fig. 3 suggests the reason is that LiF lowers to values which initiate electrochemical reduction. On bare Li metal surfaces, is significantly higher. Despite this, many organic species also rapidly decomposes on bare Li in AIMD simulations.goddard ; nasa But these reactions are likely chemical, featuring reactants in contact, rather than electrochemical (i.e., long range transfer) in nature. We will return to this theme in Sec. III.6.
and electric fields associated with it should affect charged carriers transport properties.santosh Here we use a negative example and examine how Li+ vacancy motion towards the metallic electrode affect computed voltages. Again we consider a Li metal slab as in Fig. 3b, with a LiF layer with twice the thickness (18 Å thick, not shown). Without Li-vacancy, =0.19 V. With a Li-vacancy 10 Å from the lithium metal surface, increases and rises to 0.98 V. When the vacancy is 4 Å away from the surface, =0.54 V, still higher than the no-vacancy configuration. Hence the system is not at constant potential during Li-vacancy transport. This is an artifact of the finite surface area of the simulation cell (Eq. 4). The need to move atoms while keeping constant is known in electrocatalysis modelling.rossmeisl13 ; otani ; peterson ; iceland Battery calculations generally have larger lateral surface areas than electrocatalysis and smaller (Eq. 4), but can be much larger unless M+ moves in a high-dielectric liquid electrolytevoltage ; vedge ; otani_batt instead of a relatively low dielectric solid film. In general, if there are large changes in along a Li diffusion pathway, substantial corrections may be needed to recover the constant potential energy landscape.
III.4 Relation to Atmospheric Corrosion
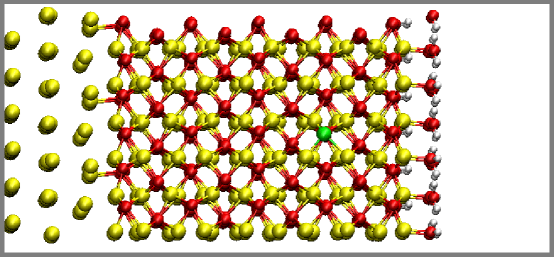
Next we consider contact potential and electric field effects on the occupation of orbitals associated with defects. In battery modelling, related studies have been treated mostly at a flat-band level without explicitly considering electrified interfaces.tian2019 ; gb Because more prior relevant work exists in the Al2O3 literature, we use the Al(111)/-Al2O3 (0001) interfacecosta relevant to atmospheric pitting corrosion of aluminum, as example. Of particular interest is the charge state of oxygen vacancies. The “point-defect model” (PDM),macdonald a widely used approach for predicting passivating oxide breakdown that leads to pitting, proposes doubly positively charged O-vacancies. When Al metal is present in a DFT simulation cell, the charges of defect states are determined by and .
Fig. 5a depicts the orbital alignment of this interface with an oxygen vacancy at position shown in Fig. 5c. By comparing with a slab without vacancies, we identify orbitals circled in green as those associated with the O-vacancy. They lie below the Fermi level , indicating that the vacancy is uncharged. Consistent with this, the valence band edge is relatively flat, showing little electric field. =0.16 V.
To recover positively charged oxygen vacancies, we remove H atoms from two of the twelve surface AlOH groups. As expected, DFT predicts that the H-vacancies carry negative charges, which should be compensated by positive charges on Al metal surfaces in the charge-neutral simulation cell. This raises to a more oxidizing 0.59 V, and raises the local valence band edge near the surface (Fig. 5b). Now creating the same O-vacancy as before yields unoccupied orbital levels above (Fig. 5b), and a doubly positively charged defect which dovetails with PDMmacdonald emerges. A more significant electric field can be inferred from the valence band edge in the range 2430 Å.
The O-vacancy is periodically replicated in Fig. 5c. In reality, a spatial distribution of O-vacancies should exist over a range of values. In pitting corrosion, adsorbed anions are likely to play the electrostatic role of negatively charged H vacancy in Fig. 5c. Adsorbed halide ions are indeed strongly linked with pitting corrosion onset. The ’s constructed for these slabs are too high compared with Al pitting onset voltages. Nevertheless, this slab model appears a promising platform for investigating voltage effects in Al2O3 passivating films. Another fruitful connection between battery and corrosion is the possible galvanic lithium corrosion.cui2019
III.5 The Li(s)/LiOH Interface, a Kinetics Case Study
To illustrate the kinetics-controlled nature of battery interfaces, we consider lithium hydroxide on lithium metal surface. LiOH has occasionally been cited as a SEI component, both experimentally and theoretically.aurbach_two_layer ; bal_lioh In Ref. bal_lioh, , AIMD simulations show that organic solvent decomposes on LiOH (010)-coated Li metal (001) surfaces; the LiOH film itself does not react. However, OH groups are expected to give off H2 gas at low voltages.aurbach_two_layer Here we explicitly re-examine LiOH stability.
First we consider thermodynamics. At T=0 K, both
| (5) | |||||
| (6) |
are exothermic, by -1.74 and -1.70 eV, respectively. The reaction
| (7) |
is also exothermic by -1.65 eV. H2 gas release is favored by a 0.4 eV entropy gain at room temperature over that at T=0 K, but this is insufficient to reverse the exothermicity of Eq. 7. LiHaurbach_two_layer has indeed been observed using cryo-TEM,cryo-tem although its presence may depend on electrolyte water content.cryo-tem1 Thermodynamically, LiOH solid is predicted to be unstable against lithium metal. Kinetically, both the LiOH film and isolated OH- units, which come from reaction with water, are stable within 100 ps AIMD trajectory lengths.bal_lioh Here we turn to activation barrier () calculations to extrapolate to longer time scales.
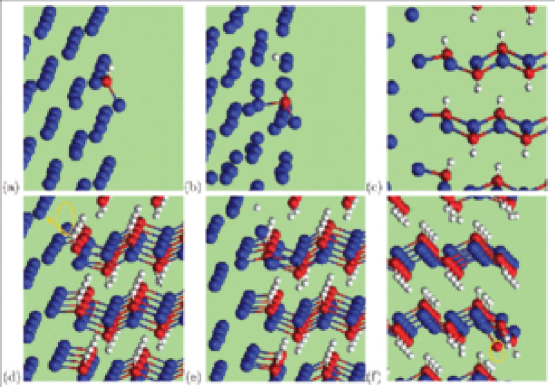
Fig. 6a depicts an isolated LiOH unit optimized on the Li (001) surface. In Fig. 6b, the proton is detached to the Li surface, with a favorable =-1.29 eV released. NEB calculations reveal that =0.72 eV. From Eq. 3, this translates into an average reaction time of 0.82 s. This is fast on battery time scales, but too slow to be observed in unconstrained AIMD simulations (10-9s in duration). We conclude that isolated LiOH is kinetically unstable on Li (001).
Next we consider the Li (001)/LiOH (010) interface. Its proposed existence assumes that adsorbed LiOH monomers can nucleate in sub-second time scales before they decompose. The lattice matching is such that all OH groups at the interface are coordinated to surface Li metal atoms (Fig. 6c), unlike LiF and Li2O.gb Breaking one of the three inequivalent OH bonds to form a H- on the lithium metal surface releases =-0.79 eV, favorable for reaction. The barrier is =1.27 eV, which indicates a reaction exceeding experimental time scales. The other two inequivalent OH groups at the interface exhibit =-0.60 eV but are similar at 1.20 eV. If one were to deposit Li vapor on defect-free LiOH (010), reactions are expected only at elevated temperatures.
However, the above calculations ignore the grand canonical nature of the interface during cycling. A metastable configuration can be created by adding a Li atom to the surface (Fig. 6d). is 0.22 eV after accounting for lithium chemical potential. From this configuration, breaking the O-H bond (Fig. 6e) releases =-1.07 eV and =0.76 eV. Accounting for but not zero point energy (ZPE) that further reduces in proton transfer reactions,tuckerman the energy at the transition state is 0.98 eV above that of Fig. 6c. From Eq. 4, this is one reaction per 8 hours at T=300 K. Without mapping out all possible reaction paths via the master equation,kinetics DFT/PBE calculations predict at least one pathway whereby that a pristine LiOH (010) slab should react with lithium metal on an experimentally observable time scale, likely forming Li2O on Li metal surfaces. We conclude that the LiOH SEI component seen in experiments are likely not in contact with Li metal. It is more likely lodged on other, more stable SEI components such as Li2O.
Thus AIMD simulations of liquid or solid electrolyte decomposition on Li metal surfaces are extremely useful for giving qualitative insights about possible reaction mechanisms, especially at the initial stages of interfacial degradation reactions. But they currently cannot rule out that reactions can occur at 1 ns time scales.
III.6 Voltage and Electric Field Effects on Kinetics
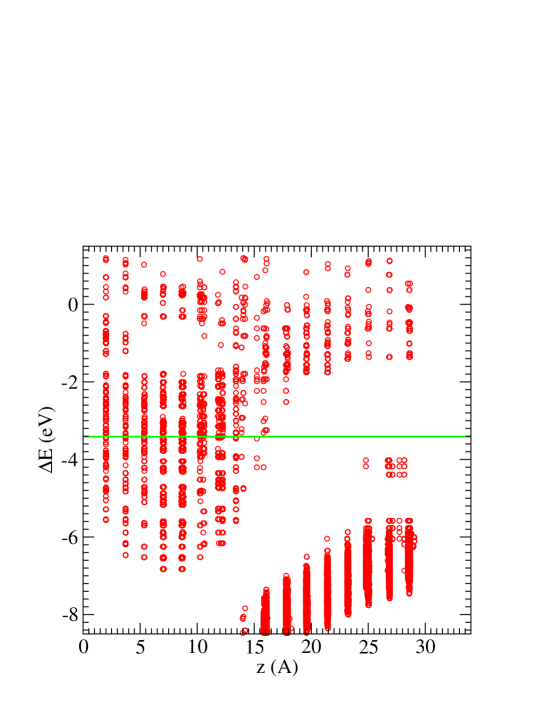
This LiOH (010) example permits an in-depth exploration of the effect of on and associated with parasitic reactions. Fig. 6c, d, and e are consistent with =0.42 V, 0.46 V, and 0.45 V, respectively. Unlike the LiF interface (Fig. 3a), all O atoms at the surface are coordinated to Li metal atoms, and attempts at adding an interlayer like in Ref. gb, fail to lower . To achieve -equilibrium (=0.0 V) requires cations outside the LiOH slab to reduce via Eq. 4. Here we take an opposite approach. Motivated by our Al2O3 analysis (Fig. 5), we create a H vacancy at the LiOH outer surface (Fig. 6f). As expected, DFT calculations yield a negatively charged H-vacancy in the neutral cell, which makes more positive in Eq. 4 and increases from 0.42 V to 2.17 V while remains 0.0 V. The system is now at a significant overpotential with respect to Li dissolution from the anode. The valence band edge shown in Fig. 7 suggests a significant electric field of 0.22 V/Å.
Remarkably, and are almost unchanged. They are now -1.09 eV and +0.77 eV, within 0.02 eV of the values at =0.46 V. This is despite the fact that Bader charge analysis suggests the H transferred to the surface now has a charge (i.e., it is a hydride). In electrocatalysis modelling, — times changes in (designated as “”) is often added post-processing to on metal surfaces in reaction steps that involve transfer, and have larger field-dependence.chan In Fig. 6, an added should emerge in only if a charged species transverse the entire solid state EDL. The lack of change in is however unusual, and may reflect strong metal surface screening.
Other parasitic reactions on Li metal we have considered, like those at the Li/LiPONlipon (oxy-phosphorus nitride inorganic polymers) and Li/Li2CO3batt interfaces, exhibit similarly small voltage dependences until the field strengths imposed by localized defects are sufficient to initiate different degradation mechanisms that involve long-range transfer.batt Experimentally, it is known that storage (without applied voltage) and cycling conditions (applying voltages) yield different behavior in metal anodes; the dendrite growth in particular depends on charging rate and overpotentials applied.gross1 If our anecdotal DFT evidence is true in general, it suggests that the difference between storage and cycling conditions does not stem from primary reaction rates, but originates from long range transfer to defects which may occur in unison with strictly chemical reactions at the interface, and/or Li+ transport effects. At other electrode interfaces, electric field- and voltage- effects remain to be distinguished and elucidated.
IV Conclusions and Outlook
In this work, we apply simple examples with explicit model electrode/surface film interfaces to illustrate some key challenges specific to electronic structure DFT modelling of interfaces in high energy density batteries. These include voltage calibration/control, the thin-film covered (“dirty”) nature of electrodes in monovalent cation (M+) batteries where M=Li or Na, and the fact that interfaces are kinetics-controlled. We find that contact potentials at metal-solid electrolyte interfaces, which can only be computed with explicit interfaces in DFT models, cannot be neglected in understanding the voltage profile across interfaces. The ionic (“open circuit”) voltage , which implies equilibrium conditions, and electronic (“instantaneous”) voltage , must be distinguished. These two quantities determine whether interfaces are at equilibrium, and enable modelling of interfaces at overpotential conditions. is shown to govern long range transfer and electric fields that modify transport properties. It appears to play little role in chemical reactions where reactants are in direct contact with lithium metals anodes. However, the roles of voltage and electric fields on reactions at other battery interfaces need further clarification.
The surface-film covered nature of electrodes is not an inconvenience; it is a major part of the interfacial physics of batteries, and should be regarded as a new basic science paradigm and opportunity. In contrast, modelling pristine metal electrode surfaces of M+ batteries, is mainly relevant to the initial stages of battery assembly. Unconstrained ab initio molecular dynamics (AIMD) simulations cannot conclusively prove the stability of interfacial components because trajectory lengths are 12 orders of magnitude shorter than battery operational time scales; barrier finding computational techniques are needed to understand kinetics-controlled interfaces. The M+ content across the entire interface follows the grand canonical ensemble. Cathode interfaces are challenging because of the polaron-conducting nature of cathode materials. Borrowing from other branches of computional electrochemistry like corrosion, supercapacitors, and electrocatalysis presents good opportunities for advancing the current state of battery interface modelling.
We have avoided exploring a wide variety of battery electrode/electrolyte materials and battery concepts such as lithium-sulfur (Li-S), lithium-oxygen (Li-O2), and conversion cathode materials on purpose. The latter areas have been subjects of modelling overviews, while a critical review of modelling methods has been lacking. The unifying modelling concepts discussed in this work focus on metallic conductor electrodes and reasonably well-characterized surface films or solid electrolytes. These should be broadly applicable to all battery electrodees like Na anodes, lithiated graphite, and lithiated silicon. One exception is multivalent (e.g., Mg) batteries, where surface films have been avoided to prevent slow multivalent ion transport. Li-S battery apply Li-metal cathodes and often carbon-based cathodes that trap sulfur; these electrodes are metallic and contain surface CEI films too. Carbon cathode/Li2O2 interfaces in Li-air batteries also fit this category. All-solid state with metallic anodes would be prototype systems to apply these computational ideas, but the thicker solid electrolyte compared to surface films in liquid electrolyte batteries may require special treatment (e.g., those devised for DFT modelling of Mott-Schottky contacts) address the larger space charge region. Computing overpotential effects on kinetics in kinetics-limited conversion cathode materials may be a particularly fruitful area to apply our approach; the calculations of reaction barriers at non-overpotential conditions require careful tuning of the electronic voltage at the interface. Interfaces between transition metal oxide cathodes and liquid electrolytes may present the most significant challenges. While the non-metallic nature in many such oxides can be circumvented with by adding a computational “current collector” at the bottom, the very thin surface film (“CEI”) covering oxide surfaces, which has mostly unknown atomic structures, hinders assignment of voltages and predictions of degradation and transport reaction kinetics. In the final analysis, at this and all other battery interfaces, the voltage is an imposed, DFT-constructed quantify; the question is whether model interfacial structures that provide the imposed voltages yield electric fields that reflect experimental conditions.
Acknowledgement
We thank Mira Todorova, Minoru Otani, Axel Gross, Harald Oberhofer, and De-en Jiang for discussions during the 2019 Telluride Workshop on Electrochemical Interfaces. We also thank Quinn Campbell and Catalin Spataru for commenting on the manuscript. Above all, we gratefully acknowledge Michiel Sprik’s pioneering research.
The Li/LiOH work is funded by Nanostructures for Electrical Energy Storage (NEES), an Energy Frontier Research Center funded by the U.S. Department of Energy, Office of Science, Office of Basic Energy Sciences under Award Number DESC0001160. The Li/LiF work is funded by the Laboratory Directed Research and Development Program at Sandia National Laboratories. The Al/Al2O3 work is funded by the Advanced Strategic Computing (ASC) Program. Sandia National Laboratories is a multi-mission laboratory managed and operated by National Technology and Engineering Solutions of Sandia, LLC, a wholly owned subsidiary of Honeywell International, Inc., for the U.S. Department of Energy’s National Nuclear Security Administration under contract DE-NA0003525. This paper describes objective technical results and analysis. Any subjective views or opinions that might be expressed in the document do not necessarily represent the views of the U.S. Department of Energy or the United States Government.
References
- (1) J. Liu et al., Nature Energy, 2017, 4, 180-186.
- (2) Basic Research Needs for Next Generation Electrical Energy Storage, http://science.energy.gov/community/resources/report.
- (3) M.K. Aydinol, A.F. Kohan, G. Ceder, K. Cho, and J. Joannopoulos, Phys. Rev. B, 1997, 56, 1354-1365.
- (4) G. Ceder, G. Hautier, A. Jain, and S.P. Ong, MRS Bull., 2011, 36, 185-191.
- (5) J.A. Dawson, P. Canepa, T. Famprikis, C. Masquelier, and M.S. Islam, J. Am. Chem. Soc. 2018, 140, 362-368.
- (6) P. Canepa, J.A. Dawson, G.S. Gautam, J.M. Statham, S.C. Parker and M.S. Islam, Chem. Mater. 2018, 30, 3019-3027.
- (7) T. Famprikis, P. Canepa, J.A. Dawson, M.S. Islam and C. Masquelier, Nat. Mater. 2019, 18, 1278-1291.
- (8) Y. Zhu, X. He, and Y. Mo, ACS Appl. Mater. Interface 2015, 7, 23685-23693.
- (9) A. Baskin and D. Prendergast, J. Electrochem. Soc., 2017, 164, E3834-E3447.
- (10) See A. Wang, S. Kadam, H. Li, S. Shi, and Y. Qi, NPJ Computational Materials, 2018, 4, 15, for a comprehensive review.
- (11) O. Borodin, X. Ren, J. Vatamanu, A.v.W. Cresce, J. Knap, and K. Xu. Acc. Chem. Res., 2017, 50, 2886-2894.
- (12) K.T. Butler, G.S. Gautam, and P. Canepa, NPJ Comput. Mater., 2019, 5, 19.
- (13) K. Xu, Chem. Rev., 2014, 114, 11503-11618.
- (14) Here “electrochemical stability” is defined as the empirically-determined voltage range over which interfaces are stable. It involves a mixture of thermodynamics, kinetics, and electron transfer considerations.batt
- (15) K. Leung, F. Soto, K. Hankins, P.B. Balbuena, and K.L. Harrison. J. Phys. Chem. C, 2016, 120, 6302-6313.
- (16) L. Xing, O. Borodin, G.D. Smith, and W. Li, J. Phys. Chem. A, 2011, 115, 13896-13905.
- (17) O. Borodin, M. Olguin, C.E. Spear, K.W. Leiter, J. Knap, Nanotechnology, 2015, 26, 354003.
- (18) K. Leung, Phys. Chem. Chem. Phys. 2015, 17, 1637-1643.
- (19) Exceptions include metal anodes for divalent cations (e.g., Mg2+) which must avoid solid-state SEI that drastically slow down cation transport. see, e.g., H.D. Yoo, I. Shterenberg, Y. Gofer, G. Gershinsky, N. Pour, and D. Aurbach, Energy Environ. Sci. 2013, 6, 2265-2279.
- (20) K. Persson, Y. Hinuma, Y.S. Meng, A. Van der Ven, and G. Ceder, Phys. Rev. B 2010, 82, 125416.
- (21) K. Leung. J. Phys. Chem. C, 2013, 117, 1539-1547.
- (22) J. Haruyama, T. Ikeshoji, and M. Otani, Phys. Rev. Mater. 2018, 2, 095801.
- (23) N. Bonnet, T. Morishita, O. Sugino, and M. Otani, Phys. Rev. Lett., 2012, 109, 266101.
- (24) I. Hamada, O. Sugino, N. Bonnet, M. Otani, Phys. Rev. B, 2013, 88, 155427.
- (25) S. Surendralal, M. Todorova, M.W. Finnis, and J. Neugebauer, Phys. Rev. Lett. 2018, 120, 246801.
- (26) M. Todorova and J. Neugebauer, Phys. Rev. Appl., 2014, 1, 014001.
- (27) K. Letchworth-Weaver and T.A. Arias, Phys. Rev. B, 2012, 86, 075140.
- (28) Q. Cambell and I. Dabo, Phys. Rev. B, 2017, 96, 205308.
- (29) N.G. Hörmann, O. Andreussi, and N. Marzari, J. Chem. Phys., 2019, 150, 041730.
- (30) T. Dufils, G. Jeanmairet, B. Rotenberg, M. Sprik, and M. Salanne, Phys. Rev. Lett., 2019, 123, 195501.
- (31) C.D. Taylor, S.A. Wasileski, J.-S. Filhol, and M. Neurock, Phys. Rev. B, 2006, 73, 165402.
- (32) M. Otani, I. Hamada, O. Sugino, Y. Morikawa, Y. Okamoto, and T. Ikeshoji, J. Phys. Soc. Jpn., 2008, 77, 024802.
- (33) J. Cheng and M. Sprik, Phys. Chem. Chem. Phys., 2012, 14, 11245-11267.
- (34) C. Zhang, J. Hutter, and M. Sprik, J. Phys. Chem. Lett., 2019, 10, 3871-3876.
- (35) B. Wen, W.J. Yin, A. Selloni, and L.M. Liu, J. Phys. Chem. Lett. 2018, 9, 5281-5287.
- (36) T.A. Pham; Y. Ping, Yuan and G. Galli, Nat. Mater., 2017, 16, 401-408.
- (37) C.Y. Chao, L.F. Lin, and D.D. Macdonald, J. Electrochem. Soc. 1981, 128, 1187-1194.
- (38) X.-X. Yu and L. Marks, Corrosion, 2019, 75, 152-166.
- (39) M. Kondo and T. Matsushita, ACS Omega, 2019, 4, 13426-13434.
- (40) D. Costa, T. Ribeiro, F. Mercuri, G. Pacchioni, and P. Marcus, Adv. Mater. Interfaces, 2014, 1, 1300072.
- (41) K.C. Santosh, R.C. Longo, K. Xiong, and K. Cho, J. Electrochem. Soc. 2014, 161, F3104-F3110.
- (42) N.D. Lepley and N.A.W. Holzwarth, Phys. Rev. B 2015, 92, 214201.
- (43) K. Leung, A. Leenheer, J. Phys. Chem. C 2015, 119, 10234-10246.
- (44) K. Leung and K.L. Jungjohann, J. Phys. Chem. C 2018, 121, 20188-20196.
- (45) H.M. Tang, Z. Deng, Z.N. Lin, Z.B. Wang, I.H. Chu, C. Chen, Z.Y. Zhu, C. Zheng, and S.P. Ong, Chem. Mater. 2018, 30, 163-173.
- (46) J. Haruyama, K. Sodeyama, L. Han, K. Takada, and Y. Tateyama, Chem. Mater. 2014, 26, 4248-4255.
- (47) J. Haruyama, K. Sodeyama, and Y. Tateyama, ACS Appl. Mater. Interfaces 2017, 9, 286-292.
- (48) B. Gao, R. Jalem, Y. Ma, and Y. Tateyama, Chem. Mater. DOI: 10.1021/acs.chemmater.9b02311
- (49) M. Sumita, Y. Tanaka, M. Ikeda, and T. Ohno, J. Phys. Chem. C, 2015, 119, 14-22.
- (50) K. Yamamoto, Y. Iriyama, T. Asaka, T. Hirayama, H. Fujita, C.A.J. Fisher, K. Nonaka, Y. Sugita, and Z. Ogumi, Angew. Chem. Int. Ed., 2010, 49, 4414-4417.
- (51) H. Yildirim, J.B. Haskins, C.W. Bauschlicher, and J.W. Lawson, J. Phys. Chem. C, 2017, 121, 28214-28234.
- (52) B.V. Merinov, S.V. Zybin, S. Naserifar, S. Morozov, J. Oppenheim, W.A. Goddard, J. Lee, J.H. Lee, H.E. Han, Y.C. Choi, and S.H. Kim, J. Phys. Chem. Lett. 2019, 10, 4577-4586.
- (53) E.P. Kamphaus, S. Angarita-Gomez, X. Qin, M. Shao, M. Engelhard, K.T. Mueller, V. Murugesan, and P.B. Balbuena, ACS Adv. Mater. Interfaces, 2019, 11, 31467-31476.
- (54) K. Leung and J.L. Budzien, Phys. Chem. Chem. Phys. 2010, 12, 6583-6586.
- (55) K. Leung and C.M. Tenney, J. Phys. Chem. C, 2013, 117, 24224-24235.
- (56) K. Leung, A.J. Pearse, A.A. Talin, E.J. Fuller, G.W. Rubloff, and N.A. Modine, ChemSusChem, 2018, 11, 1956-1969.
- (57) S.-H. Yoo, M. Todorova, and J. Beugebauer, Phys. Rev. Lett. 2018, 120, 066101.
- (58) M.E. Tuckerman, D. Marx, and M. Parrinello, Nature, 2002, 417, 925-929.
- (59) M. Fu, Z. Yao, X. Ma, H. Dong, K. Sun, S. Hwang, E. Hu, H. Gan, Y. Yao, E.A. Stach, C. Wolverton, and D. Su, Nano Energy, 2019, 63, 103882.
- (60) K. Chan and J.K. Norskov, J. Phys. Chem. Lett. 2015, 14, 2663-2668.
- (61) S. Trasatti, J. Electroanal. Chem. 1986, 209, 417-428.
- (62) A. Schechter, D. Aurbach, and H. Cohen, Langmuir, 1999, 15, 3334-3342.
- (63) L. Wang, A. Menakath, F.D. Han, Y. Wang, P.Y. Zavalij, K.J. Gaskell, O. Borodin, D. Iuga, S.P. Brown, C.S. Wang, K. Xu, and B.W. Eichhorn, Nat. Chem. 2019, 11, 789-796.
- (64) R. Jorn, R. Kumar, D.P. Abraham, and G.A. Voth, J. Phys. Chem. C 2013, 117, 3747−3761.
- (65) M.J. Boyer and G.S. Hwang, Phys. Chem. Chem. Phys., 2019, 40, 22449-22455.
- (66) Z. Zhuo, P. Lu, C. Delacourt, R. Qiao, K. Xu, F. Pan, S.J. Harris, and W. Yang, Chem. Commun., 2018, 54, 814-817.
- (67) G.M. Veith, M. Doucet, J.K. Baldwin, R.L. Sacci, T.M. Fears, Y. Wang, and J.F. Browning, J. Phys. Chem. C, 2015, 119, 20339-20349.
- (68) S. Ringe, H. Oberhofer, and K. Reuter, J. Chem. Phys. 2017, 146, 134103.
- (69) H. Musada, N. Ishida, Y. Ogata, D. Ito, and D. Fujita, Nanoscale, 2017, 9, 893-898.
- (70) E.J. Cheng, A. Sharafi, and J. Sakamoto, Electrochim. Acta, 2017, 223, 85-91.
- (71) C. Adriaanse, J. Cheng, V. Chau, M. Sulpizi, J. VandeVondele and M. Sprik, J. Phys. Chem. Lett., 2012, 3, 3411-3415.
- (72) F. Costanzo, M. Sulpizi, R.G. Della Valle, and M. Sprik, J. Chem. Theory Comput. 2008, 4, 1049.
- (73) In contrast, multivalent batteries with M2+ and M3+ charge carriers must use electrolyte that does not form surface films, because these ions moves slowly through solid films. These battery concepts requires substantial development.
- (74) P. Peljo and H.H. Girault, Energy Environ. Sci. 2018, 11, 2306-2309.
- (75) N.W. Ascroft and N.D. Mermin, Solid State Physics (CBS Publishing, Tokyo, 1976).
- (76) A. Barai, K. Uddin, M. Dubarry, L. Somerville, A. McGordon, P. Jennings, and I. Bloom, Prog. Energy Combustion Sci., 2019, 72, 1-31, and references therein.
- (77) S.W. de Leeuw, J.W. Parram, and E.R. Smith, Proc. Royal Soc. London, 1980, 373, 27-56.
- (78) M.J. McGrath, J.I. Siepmann, I.F.W. Kuo, C.J. Mundy, J. VandeVondele, J. Hutter, F. Mohamed, and M. Krack, ChemPhysChem, 2005, 6, 1894-1901.
- (79) R.B. Wexler, T. Qiu, and A.M. Rappe, J. Phys. Chem. C, 2019, 123, 2321-2328.
- (80) S. Kasamatsu and O. Sugino, J. Phys. Condens. Matter, 2019, 31, 085901.
- (81) I. Scivetti and G. Teobaldi, J. Phys. Chem. C, 2015, 119, 21358-21368.
- (82) See, e.g., Z. Jiang, K. Klyukin, and V. Alexandrov, Phys. Chem. Chem. Phys., 2017, 19, 14897-14901.
- (83) Y. Okuno, K. Ushirogata, K. Sodeyama, G. Shukri, and T. Tateyama, J. Phys. Chem. C, 2019, 123, 2267-2277.
- (84) R. Benedek, J. Phys. Chem. C, 2017, 121, 22049-22053.
- (85) G. Henkelman, B.P. Uberuaga, and H. Jonsson. J. Chem. Phys. 113, 9901-9904 (2000).
- (86) G. Kastlunger, P. Lindgren, and A.A. Peterson, J. Phys. Chem. C, 2018, 122, 12771-12781.
- (87) M. Van den Bossche, E. Skulason, C. Rose-Petruck, and H. Jonsson, H J. Phys. Chem. C, 2019, 123 4116-4124.
- (88) T. Ohwaki, T. Ozaki, Y. Okuno, T. Ikeshoji, H. Imai, and M. Otani, Phys. Chem. Chem. Phys., 2018, 20, 11586-11591.
- (89) Z. Wang, D. Santhanagopalan, W. Zhang, F. Wang, H.L. Xin, K. He, J. Li, N.J. Dudney, and Y.S. Meng, Nano Lett. 2016, 16, 3760-3767.
- (90) D. Bedrov, G.D. Smith, and A.C.T. Van Duin, J. Phys. Chem. A, 2012, 116, 2978-2985.
- (91) X.H. Li, A.W. Jasper, J. Zador, J.A. Miller, and S.J. Klippenstein, Proc. Combustion Institute, 2017, 36, 219-227.
- (92) S. Dohm, E. Spohr and M. Korth, J. Comput. Chem., 2017, 38, 51-58.
- (93) T. Fujie, N. Takenaka, Y. Suzuki and N. Nagaoka, J. Chem. Phys., 2018, 149, 044113.
- (94) Y. Li and Y. Qi, Energy Environ. Sci., 2019, 12, 1286-1295.
- (95) G. Kresse, and J. Furthmüller, Phys. Rev. B, 1996, 54, 11169.
- (96) G. Kresse and J. Furthmüller, Comput. Mater. Sci., 1996, 6, 15-50.
- (97) G. Kresse and D. Joubert, Phys. Rev. B, 1999, 59, 1758-1775.
- (98) J. Paier, M. Marsman, and G. Kresse, J. Chem. Phys., 2007, 127, 024103.
- (99) J.P. Perdew, K. Burke, and M. Ernzerhof, Phys. Rev. Lett., 1996, 77, 3865-3868.
- (100) J. Heyd, G.E. Scuseria, and M. Ernzerhof, J. Chem. Phys., 2003, 118, 8207-8215.
- (101) J. Heyd, G.E. Scuseria, and M. Ernzerhof, J. Chem. Phys., 2006, 124, 219906.
- (102) O.A. Vydrov, J. Heyd, A.V. Krukau, G.E. Scuseria, J. Chem. Phys., 2006, 125, 074106.
- (103) J. Neugebauer and M. Scheffler, Phys. Rev. B, 1992, 46, 16067-16080.
- (104) E.-G. Kim and J.-L. Bredas, Organic Electronics, 2013, 14, 569-574.
- (105) X.-G. Wang, J.R. Smith, and A. Evans, Phys. Rev. Lett., 2002, 89. 286102.
- (106) CRC Handbook for Chemistry and Physics, Ch. 12 (CRC Press, 2012). Recall the DFT/PBE result quoted is for strained lithium.
- (107) L. Fu, C.-C. Chen, D. Samuelis, and J. Maier, Phys. Rev. Lett. 2014, 112, 208301.
- (108) A.C. Luntz, V. Viswanathan, J. Voss, J.B. Varley, J.K. Norskov, R. Scheffler, and A. Speidel, J. Phys. Chem. Lett. 2013, 4, 3494-3499.
- (109) S. Schnur and A. Gross, Catalysis Today, 2011, 165, 129-137.
- (110) G. Henkelman, A. Arnaldsson, and H. Jónsson, Comput. Mater. Sci. 2006, 36, 354-360. Note that charge decomposition schemes like Bader are approximate.
- (111) A.J. Cohen, P. Mori-Sanchez, and W.T. Yang, Science, 2008, 321, 792-794.
- (112) J. Alvarado, M.A. Schroeder, M.H. Zhang, O. Borodin, E. Gobrogge, M. Olguin, M.S. Ding, M. Gobet, S. Greenbaum, Y.S. Meng, and K. Xu, Mater. Today, 2018, 21, 341-353.
- (113) M.E. Bjorketun, Z.H. Zeng, R. Ahmed, V. Tripkovic, K.S. Thygesen and J. Rossmeisl, Chem. Phys. Lett., 2013, 555, 145-148.
- (114) D. Lin, Y. Liu, Y. Li, Y. Li, A. Pei, J. Xie, W. Huahng and Y. Cui, Nat. Chem. 2019, 11, 382-389.
- (115) M.J. Zachman, Z. Tu, S. Choudhury, L.A. Archer, and L.F. Kourkoutis, Nature, 2018, 560, 345-351.
- (116) C. Fang, J. Li, M. Zhang, F. Yang, J.Z. Lee, M.-H. Lee, J. Alvarado, M.A. Schroeder, Y. Yang, B. Lu, Ni. Williams, M. Ceja, L. Yang, M. Cai, J. Gu, K. Xu, X. Wang and Y.S. Meng, Nature, 2019, 572, 511-515.
- (117) M. Jackle, K. Helmbrecht, M. Smits, D. Stottmeister, A. Gross, Energy Environ. Sci. 2018, 11, 3400-3407.
- (118) H. Tian, Z. Liu, Y.Z. Ji, L.Q. Chen, and Y. Qi, Chem. Mater. 2019, 31, 7351-7359.
- (119) R.C. Longo, L.E. Camacho-Forero and P.B. Balbuena, J. Mater. Chem. A 2019, 7, 8527-8539.
- (120) A.A. Franco, A. Ricci, D. Brandell, C. Frayret, M. Gaberscek, P. Jankowski and P. Johansson, Chem. Rev. 2019, 119, 4569-4627.
- (121) L.M.C. Pinto, E. Spohr, P. Quaino, E. Santos, and W. Schmickler, Angew. Chem. Int. Ed. 2013, 52, 7883-7885.