Correlative infrared optical coherence tomography and hyperspectral chemical imaging
Abstract
Optical coherence tomography (OCT) is a high-resolution three-dimensional imaging technique that enables non-destructive measurements of surface and subsurface microstructures. Recent developments of OCT operating in the mid-infrared (MIR) range (around 4 µm) lifted fundamental scattering limitations and initiated applied material research in formerly inaccessible fields. The MIR spectral region, however, is also of great interest for spectroscopy and hyperspectral imaging, which allow highly selective and sensitive chemical studies of materials. In this contribution, we introduce an OCT system (dual-band, central wavelengths of 2 µm and 4 µm) combined with MIR spectroscopy that is implemented as a raster scanning chemical imaging modality. The fully-integrated and cost-effective optical instrument is based on a single supercontinuum laser source (emission spectrum spanning from 1.1 µm to 4.4 µm). Capabilities of the in-situ correlative measurements are experimentally demonstrated by obtaining complex multidimensional material data, comprising morphological and chemical information, from a multi-layered composite ceramic-polymer specimen.
Keywords mid-infrared • optical coherence tomography • spectroscopy • supercontinuum source • hyperspectral imaging • multimodal system • correlative imaging • non-destructive testing
1. Introduction
Optical coherence tomography (OCT) is a well-established non-invasive measurement technique that allows to obtain and visualize three-dimensional structural information of morphologically complex samples. Operating in the visible and near-infrared (NIR) ranges, OCT-based diagnostic methods and systems have demonstrated outstanding efficiency and capabilities in various biomedical scenarios and ophthalmology [1]. Nevertheless, the focus of interest within the OCT community is consequentially extending, covering non-destructive testing (NDT) applications in industrial metrology and material sciences [2, 3]. Significant advances in OCT technology have been enabled by the rapid evolution of bright and spatially coherent mid-infrared (MIR) supercontinuum light sources [4] that allowed to extend the operating wavelength range and reduce scattering effects [5]. Thus, recently reported results on the expansion of OCT into the MIR [6, 7] spectral region verified a hypothesis of an enhanced penetration depth into turbid materials. These solutions opened up opportunities for sub-surface dimensional measurements in the fields of, for instance, additive manufacturing [8], pharmaceutical industry [9, 10], cultural heritage diagnosis and art preservation [11, 12, 13]. In general, a further increase in the central wavelength causes reduction of the axial resolution that is correlated with the coherence length and, thus, proportional to the ratio of squared wavelength and spectral bandwidth. However, a rational extension of the bandwidth, which shortens the coherence length, is also limited in practice since this may cause a degradation of the point-spread-function due to dispersion [14]. Therefore, in contrast to the terahertz range [15], the 3 µm - 7 µm part of the MIR spectral region represents a reasonable compromise, in particular, for industrial applications where high spatial resolution is a necessity.
Since their recent commercialization, MIR supercontinuum sources have been significantly optimized in terms of their noise performance, thereby attracting significant attention within the infrared (IR) spectroscopy community. Due to the broadband emission and peculiar properties of the radiation, these sources have already launched intensive applied research in the field. Through the particular advantages over conventional thermal emitters, their efficiency was demonstrated in attenuated total reflection spectroscopy [16], Fourier-transform infrared (FTIR) spectroscopy [17], MIR microspectroscopy[18, 19, 20, 21, 22], gas [23], environmental [24], and stand-off spectroscopic measurements [25, 26]. Operating in the so-called functional group region, where most of the molecules display distinct absorption lines, MIR supercontinuum sources allow to considerably extend the light-matter interaction length, thereby lowering detection limits compared to state-of-the-art FTIR instruments [27, 17]. Due to the prevailing brightness [28] and high beam quality, supercontinuum radiation enables diffraction-limited and sensitive chemical mapping realized in reflection geometry [20, 18], thus, representing a novel and attractive tool for chemical analysis. Moreover, studies of noise properties, emission parameters and extension of the broadband spectral coverage, which is far superior to quantum cascade lasers, are the subjects of ongoing research [29, 30, 31, 32, 33, 34, 35, 36]. Therefore, stable sources covering the entire MIR spectral range are expected to become commercially available soon.
The possible combination of these two NDT techniques – OCT and MIR spectroscopy – in one system is challenging and of particular interest. Spectroscopic-OCT, for instance, is a well-known and advantageous solution, which allows getting depth-resolved spectral information [37, 38]. The method employs a single detector array and it is based on numerical splitting of the bandwidth in a spectral-domain OCT (SD-OCT) configuration [14] into several sub-bands before performing the Fourier transform of the individual interferograms. This approach is feasible, however, impractical for a system that operates in the MIR range. One of the reasons is the absence of sensitive high-resolution detector arrays (focal plane arrays) – the crucial component of spectroscopic- and SD-OCT – operating in this spectral range; this technical gap is considered in detail in [6]. However, the fundamental problem is an insufficient spectral and spatial resolution due to the contradictory requirements in the spectroscopic-OCT system: a high spectral resolution requires a narrow spectral bandwidth but confines the axial resolution of SD-OCT. For example, in order to resolve CH (carbon hydrogen functional chemical group) stretching vibrations at around 3320 nm (center wavelength, corresponding to 3010 cm-1 center wavenumber), a spectral resolution of 50 nm of the spectroscopic mode (i.e. OCT sub-band after numerical splitting) would result in a spatial resolution of around 100 µm in the axial direction for the regular OCT imaging mode. For state-of-the-art OCT systems with low-NA (numerical aperture) focusing optics, such a resolution is inexpedient, since a maximum imaging depth, which is determined by the confocal gate, is on millimiter scale [14, 39].
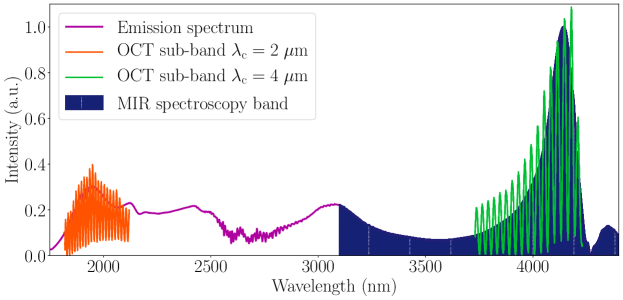
In this paper, we propose a reasonable and new solution for the combination of these techniques that allows to achieve both high morphological and chemical resolution. Since the raster scanning approach is identical for OCT and spectroscopic imaging, we implement a multimodal system integrated in a single measurement head. In contrast to Spectroscopic-OCT, the modalities use separate detection arms, therefore, the resolution matching condition described above is eliminated. The SD-OCT system uses a single supercontinuum laser source and operates in dual-band mode (reported in [8]), i.e. within the sub-bands of 1.85 µm - 2.1 µm (NIROCT) and 3.7 µm - 4.2 µm (MIROCT). It enables high-resolution imaging in the NIR regime and penetration-enhanced measurements in the MIR band. The MIR spectroscopy modality supplements the morphological information obtained by OCT with correlative spatially-resolved spectra that are integrated over depth. The operational window of the spectroscopic system is 3.1 µm - 4.4 µm (corresponds to 2275 cm-1 - 3225 cm-1). Being presented as a hyperspectral cube, the spectroscopic measurements reveal specimen features hidden for OCT; they enable chemical differentiation of constituent materials and analysis of their distribution. The detection systems are based on low-cost pyroelectric detectors [6].
2. Multimodal infrared OCT and spectroscopy system
A. Infrared supercontinuum source
The multimodal OCT and spectroscopy system reported in this study is based on a commercial pulsed supercontinuum light source from NKT Photonics (SuperK Compact Mid-IR). The supercontinua are deterministic and generated in a fluoride ZrF4-BaF2-LaF3-AlF3-NaF fiber (ZBLAN, step-index profile) pumped in the spectral band around 2050 nm (first zero dispersion wavelength) by a high-power erbium-ytterbium- and thulium-doped fiber amplifier. The broadband emission covers the range from 1.1 µm to 4.4 µm. Figure 1 shows the spectrum of the source measured using an FTIR spectrometer (Vertex 70, Bruker Optics); the bands employed for OCT and spectroscopic imaging are indicated. Edge-pass (1.65 µm cut-on wavelength) and neutral density filters were used to prevent oversaturation of the Mercury Cadmium Telluride (MCT) detector. A specific spectral sensitivity of the detector was applied to reconstruct the displayed spectrum.
The beam of the laser is specified by the quality factor M2 1.1; the transverse profile is the fundamental (TEM00) Gaussian mode. A parabolic mirror is used as an output collimator. The outgoing beam diameter is in the range of 3 mm - 6 mm, measured using band-pass filters at 2 µm and 4 µm wavelengths correspondingly.
The repetition rate of the source is 2.5 MHz. The corresponding supercontinua pulse duration is below one nanosecond. The total average power is about 490 mW, which, in conjunction with the high quality of the beam, provides superior brightness - an essential feature for active imaging systems [40]. Relative pulse-to-pulse energy fluctuations were characterized using a monochromator (reported in [17]); the measurements yield the mean value of around 5.8 % over the exploited spectral range. The default operating frequency of the pyroelectric detectors depends on the sample reflectivity and magnitudes of the surface and bulk scattering and is in the range of 40 Hz - 100 Hz. Therefore, due to the prevailing averaging, the pulse-to-pulse intensity fluctuations [41, 42] are negligible.
B. Experimental system
The principal optical arrangement of the multimodal IR OCT and spectroscopy system is shown in Figure 2.
The experimental setup consists of a free-space Michelson interferometer, a measurement head (sample scanning system, focusing optics, and chopper), OCT and spectroscopy detection systems (indicated in Figure 2). The arms of the interferometer are formed by an IR pellicle beam splitter. In the reference arm, an unprotected gold mirror is used. Due to optimal dispersion and transmission profiles, a BaF2 lens (50 mm focal length) is employed in the sample arm to focus the probing beam onto the specimen. The measurement head also includes a mechanical chopper to perform light intensity modulation as required for pyroelectric detectors to operate [43, 44]. The modulation system is internally synchronized with both modalities.
The detection systems of the two modalities are optically separated, therefore, the beam exiting the interferometer is reflected by a motorized mirror (synchronized with a shutter) either to a wide-band Fabry-Pérot tunable filter spectrometer (FPTF, LFP-3144C, InfraTec GmbH) or to a grating-based OCT spectrometer. The mirror is replaceable by e.g. an IR beamsplitter, thus, allowing to perform independent measurements, but in trade-off with a magnitude of the signal. Besides, the flexibility of such a solution is limited due to the specification lag of optics and filters in this spectral range, a standard splitting ratio for the MIR beam splitters is 50:50 and invariant due to the current technology state.
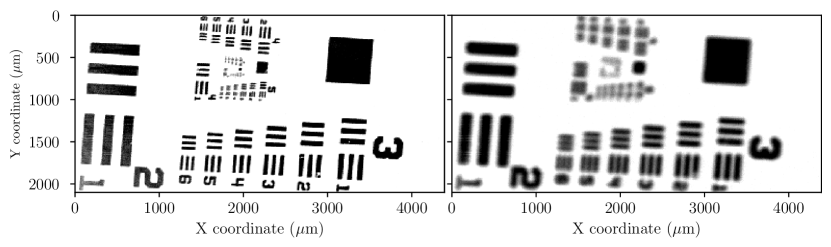
The spatial resolution of the imaging system is identical for both modalities and determined by the quality of the beam and focusing optics, and, in general, is wavelength dependent. To specify the maximum and minimum resolution, a 1951 USAF resolution test target was measured at spectral extremes (around 2 µm and 4 µm) by means of the OCT detection modality (see details in section D); the results yield the spatial resolution (Rayleigh criterion) between 39.37 µm (3rd group, width of 5th element) and 11.05 µm (5th group, width of 4th element).
C. Spectroscopy modality
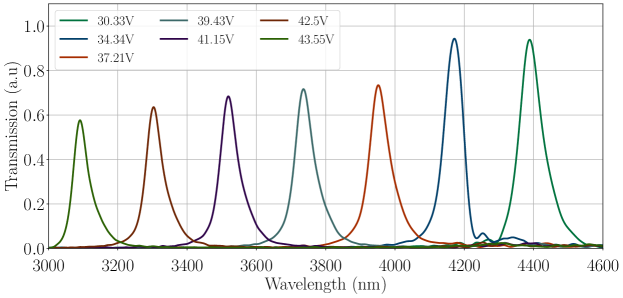
The compact and low-cost FPTF spectrometer used in the spectroscopy modality (SM) is based on a fully-integrated MEMS-based Fabry-Pérot etalon with an electrically controllable cavity length. Acting as a filter, it allows to precisely tune the transmitted spectral band that satisfies the resonance condition within the wavelength range of 3.1 µm to 4.4 µm (corresponds to 2275 cm-1 - 3225 cm-1 in wavenumbers). Figure 3 shows the transmission behavior with respect to the applied voltage, recorded using an FTIR spectrometer (Vertex 70, Bruker Optics). The characterized spectral resolution is defined by the full-width at half maximum (FWHM) of the transmitted band yielding 50 nm - 75 nm (corresponds to 40 cm-1).
The mechanical time constant of the filter is 2 ms - 20 ms. A pyroelectric LiTaO3 point detector (22 mm2 area) that is located behind the tunable filter is used to record spatially resolved reflectance spectra. Thus, the chopper used in the OCT detection system switches optimally between the modes without causing delays, asynchronization or the need to deactivate the modulator when changing to another measurement cycle. The detector detectivity of 3.6106 is specified for 10 Hz modulation frequency at a temperature of 25 °C.
To perform the correlative spectroscopic measurements, the reference arm of the interferometer is blocked by a shutter. Therefore, a strong reference field is excluded to protect the system from possible optical damage. The mirror directs the collected light into the FPTF-based spectrometer, where it is focused onto the point detector using suitable optics. The spectrum of the probing beam, which is reflected by the sample, is measured by spectral tuning of the filter transmission.
D. Optical coherence tomography modality
The OCT measurement cycle is triggered, when the shutter opens and the SD-OCT modality is activated by the motorized mirror. Therefore, in-situ structural and spectral information is obtained. A Czerny-Turner type spectrometer is used to record spectral interferograms for the OCT modality. It is based on a blazed diffraction grating (300 lines/mm) and a pyroelectric linear array (PYROSENS, DIAS Infrared GmbH); a spherical mirror (100 mm focal length) is used to focus the light onto the detector. The array has 510 rectangular shaped pixels with a dimension of 20500 µm2, optimally suited for mirror-based design with non-toroidal surfaces [6].
The dual-band operation mode of SD-OCT is implemented using the grating spectrometer based on a single array. Thereby, the detection of the overlapped diffraction orders of the sub-bands with doubled center wavelengths is exploited. Ghost spectra in the NIR region (1850 nm - 2150 nm, second diffraction order) overlap with the MIR part (3750 nm -4250 nm, first diffraction order), thus, the required band could be accessed using corresponding band-pass filters (indicated in Fig. 2), while the second spectral region is suppressed. The axial resolution of the dual-band OCT system was characterized in [8] and is around 17 µm and 37 µm within the NIR and MIR ranges correspondingly; the characterization of the lateral resolution (around 11 µm and 39 µm respectively) is demonstrated in Figure 4.
The OCT A-scan rate (depth scan at a fixed lateral position) is theoretically limited by spectra acquisition speed, i.e. defined by the detection and modulation system. In practice, however, a reasonable signal-to-noise ratio is observed at chopping frequencies of 40 Hz - 100 Hz depending on the sample reflectivity and scattering [8]. Due to the unique features of the pyroelectric detectors, namely their sensitivity only to alternating radiation [45, 43], the chopper is set in the sample arm of the interferometer. Thereby, a DC component or spectral offset usually subtracted in OCT imaging is naturally eliminated.
The post-processing algorithm employed in SD-OCT imaging is based on the method reported in [6] and was upgraded since the reference spectrum (represents a constant signal component) is undetectable for the pyroelectric detector, thus, fewer steps are implemented. They include interpolation of the spectral interferogram to be equidistant in wavenumbers, filtering of a signal with further multiplication by a Gaussian-window. The last step involves a discrete Fourier transform of the processed interferograms for generating images in the spatial domain. A more detailed description of the principles of OCT techniques can be found in [14].
3. Sample preparation
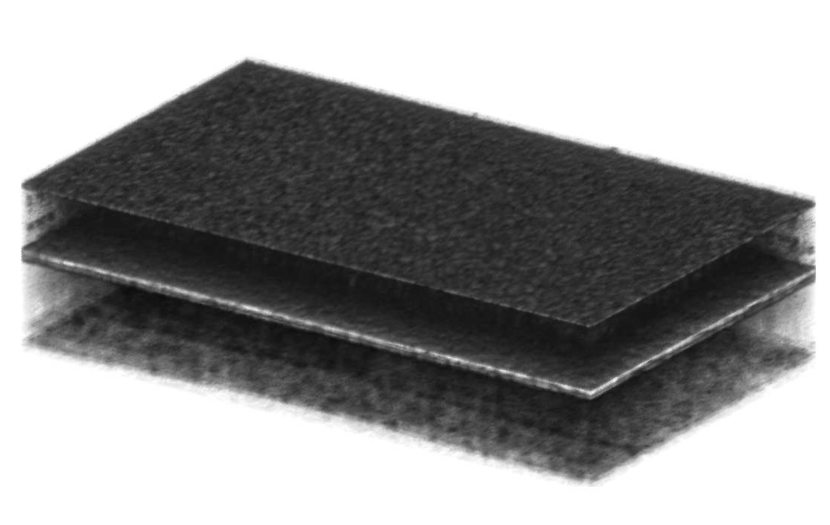
In order to demonstrate the capabilities of multimodal morphological and chemical imaging, a sample based on various practically relevant industrial materials that exhibit distinct structural and spectral features was prepared. Due to the enhanced penetration of MIROCT into scattering media, a ceramic stack was selected as a basic assembly. The specimen was formed by two single-crystal Al2O3 plates (0.4 mm thick), one was positioned on top of another. The top surfaces of the plates have a mean roughness 0.5 µm < < 1.2 µm, thus, causing strong surface scattering in the VIS and NIR ranges, where standard OCT systems are operating. Since these interfaces were positioned first to the incident light, strong specular reflection at these boundaries is reduced. The rear surfaces of the plates are epi-polished with < 0.2 nm.
The spectral and spatial diversification of the stack was implemented employing different visible-transparent, non-scattering polymer films that were inserted in the gap between the plates. Polyethylene terephthalate (PET), polystyrene (PS), and polypropylene (PP) were selected to be accessed and measured through the turbid ceramic media. The films have specific spectral signatures in the exploited range: PET exhibits absorption lines induced by Phenyl-H and CH2 bond stretching [46]; for PP a slightly wider band is observed due to symmetric and asymmetric stretching vibration of CH3 and CH2 functional groups, and a CH shoulder-type band [47]. PS has distinctive and relatively strong absorption bands at higher frequencies (3082 cm-1 - 3026 cm-1) due to the aromatic CH stretching. Besides, asymmetric and symmetric stretching vibrations of methylene groups CH2 are also observed in the absorption spectrum of PS [48]. The thicknesses of the different polymer films were the same (around 50 µm). Figure 5 illustrates the schematic three-dimensional model of the resulting composite sample; the constituent layers and details are indicated.
4. Results
In order to demonstrate the performance of the system, correlative NIROCT, MIROCT and MIR spectroscopic measurements (area scan, 86 mm2) of the ceramic-polymer stack were carried out. The experimental results allow to visualize the structure and enable in-situ identification of the embedded polymers.
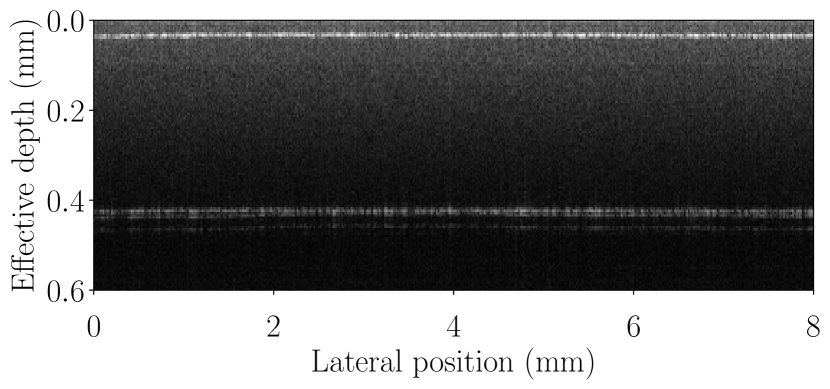
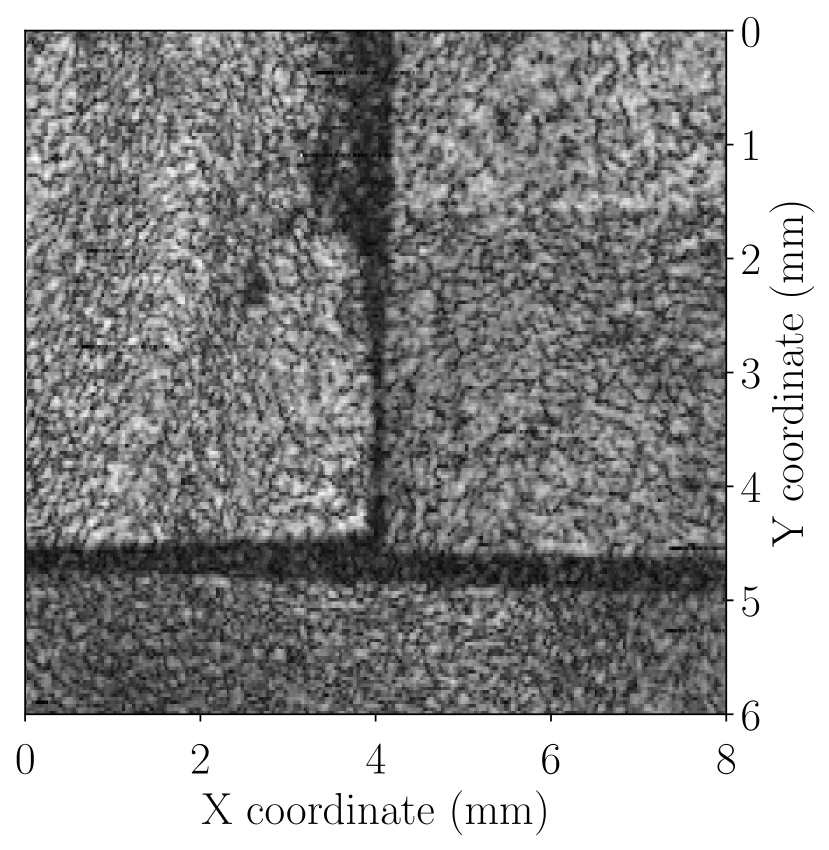
The dual-band OCT measurements - depicted in Figure 6 - reveal the entire three-dimensional volume of the multi-layered sample. The top surfaces of the plates cause no image artefacts due to the high roughness and absence of specular reflection. The polymer films that are positioned at a depth of around 400 µm are effectively detected and can be displayed using an en-face MIROCT image as shown in Figure 6(c). The thicknesses of the plates and films can be calculated for defined refractive indexes using high-resolution NIROCT cross-sectional images (B-scans); a typical B-scan is presented in Figure 6(a).
The air gap between the rear polished surface of the ceramic plate and the polymer films is on the same scale as the axial resolution and can be detected depending on the actual topology (i.e. at certain positions where it can be resolved). The rough top interface of the bottom plate is not detectable for NIROCT due to strong surface scattering.
Nevertheless, the complete sample morphology, which was obtained using OCT modality, does not allow differentiation of polymers due to the equal thickness and the absence of any characteristic scattering, the magnitudes of back-reflections from the different polymer interfaces are equal.
Using the MIR spectroscopy modality, spatially resolved and OCT-co-registered reflection spectra were collected, thereby a hyperspectral cube has been recorded; the acquisition time per single spectrum was around 3 sec. In order to calculate absorbance using the Beer-Lambert law [49], a single reflection spectrum from the blank plates stack (no polymers inserted) was recorded as a background. In practice, the same hyperspectral data set can be used to retrieve background spectra selecting particular spatial coordinates, where e.g. no polymers are presented. As post-processing steps, a baseline correction, denoising based on principal component analysis and spectral smoothing (Savitzky-Golay filter) were applied using an open-source python-based software (Orange [50]). The correlative MIR spectroscopic measurements are visualized as false-color absorbance images integrated within different spectral regions that are characteristic for chemical differentiation (Figure 7). A small and varying air gap between the polymer films and rear polished surface of the plate ( < 0.2 nm) causes interference due to multiple reflections. These effects introduce fringes in the spectroscopic images and can be also observed as an equidistant modulation in each reflection spectrum, frequencies of the modulation depend on the thickness of the air gap.
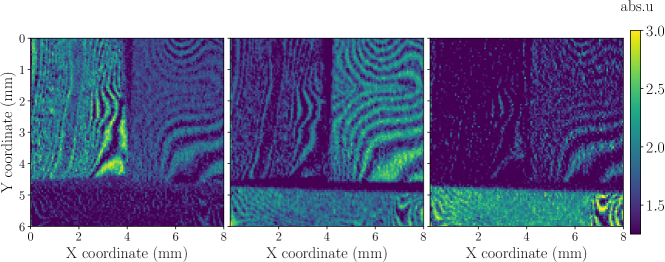
As demonstrated in Figure 7, due to the material-dependent spectral response the evaluation of the absorbance spectra enables unambiguous differentiation of the polymers embedded in the turbid environment. Besides, each individual pixel of the recorded hyperspectral cube contains the full absorbance spectrum at the pixel’s position. Spatially averaged spectra for each polymer are shown in Figure 8. Effects due to thin-film interference average out in this representation. Therefore, the measurements enable identification of the polymers that display different signatures in the exploited spectral bandwidth.
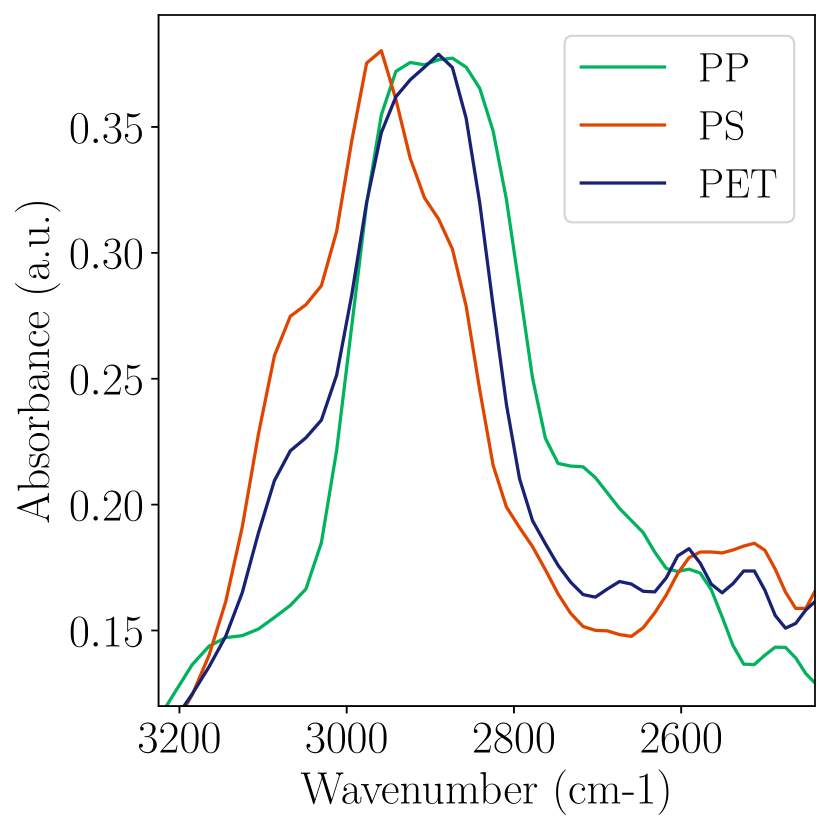
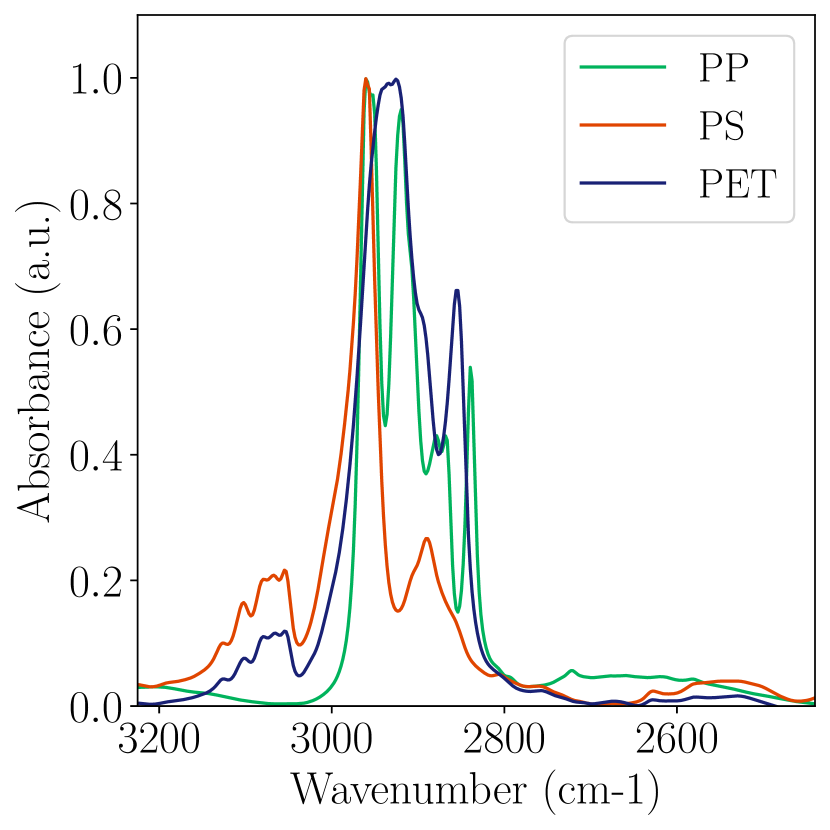
In order to verify the acquired spectra, reference spectra of the polymer films were measured using a high-resolution (4 cm-1) FTIR instrument (Lumos, Bruker Optics) that was operated in reflection mode to provide accurate data on the spectral positions of the observed absorption bands. Thus, reflectance spectra were recorded for the blank films outside the ceramic stack; back-reflected light was collected from an area of 100100 µm2 and absorbance was calculated using a measured background spectrum (mirror). The normalized spectra – depicted in Figure 8(b) – are in a good agreement with the results obtained with the developed multimodal system. Due to the lower resolution, the FPTF-based spectrometer is not able to resolve individual vibrational modes, however, the position of the bands, the envelope and trends are observed: PET and PS demonstrate absorption in the range beyond 3000 cm-1; the width of absorption bands for PP and PET are very well consistent with FTIR measurements, especially in the range around 2800 cm-1.
Taking into account the spectral features and selecting a suitable spectral range to integrate absorbance (according to specific chemical signatures, as done for images in Figure 7), the chemical analysis of the components and their spatial distribution can be visualized for complex and spectrally diverse samples. The obtained data effectively supplement the structural information obtained by the OCT modality and reveal details that are commonly inaccessible. We would like to emphasize that the spectra were collected in reflection mode, through the 400 µm thick ceramic plate with a rough surface (corresponding to 800 µm, double propagation, thus, the contrast of the images can be affected. The spectral shape of the bands can also be influenced by artefacts due to interference and varying magnitude of scattering.
Additionally, the observed interference effects (known as an autocorrelation term within OCT community [14]) that, at first glance, introduce unwanted distortions in the spectra and hyperspectral images can be elegantly exploited to reconstruct the thicknesses of underlying layers using methods well-known in IR spectroscopy. Due to the significantly wider spectral bandwidth of the MIR spectroscopy modality (Fig. 1), the reconstruction enables sub-OCT spatial resolution (using the standard definition for OCT [14], of approximately 5 µm). Acquired reflection spectra carry distinct and singular frequencies (usually referred to by the term “fringes”) originating from constructive and destructive interference due to multiple reflections between the highly reflective polished ceramic interface (bottom surface of the top plate) and top interface of the polymers. Other possible reflections were not detected as they are significantly weaker, suppressed by e.g. strong surface scattering; the sensitivity of the SM-based reconstruction approach is weaker than that of OCT due to the absence of the strong reference field, i.e. the coherent amplification. Besides, despite the higher resolution, the maximum thickness (imaging depth) that can be accessed using this indirectly formed system of a common-path interferometer and the FPTF spectrometer (as a detector) is limited. The limitations are imposed by the lower spectral resolution of the latter, i.e. they are governed by the Nyquist-Shannon-Kotelnikov theorem; so this extension is well suited and feasible especially for measurements of relatively thin layers.
Thus, the thickness of the air gap between the top ceramic plate and the polymer films at the particular spatial coordinates can be obtained as follows [51]:
| (1) |
where N is a number of fringes observed in the spectral bandwidth between and (in wavenumbers), is the refractive index ( for air) of the media between the interfaces causing interference.
Figure 9 depicts the spatially resolved thickness map of the air gap between the top ceramic plate and the polymer films. The profile was reconstructed using (1). In prior to fringes counting according to [51], an interference-free background spectrum was subtracted from the raw spectra (for each pixel) to increase contrast and reveal pure interference patterns. Then the number of peaks was determined using a robust peak finder algorithm [52]; a calculated period of the frequencies was used to access the exact fractional number of fringes.
Thereby, the developed orthogonal modalities integrated into the single optical instrument do not only complement the data while operating with chemical and structural analysis of materials, but can successfully enhance and correct each other. The present demonstration reveals the potentials of the multimodal systems to obtain more detailed information about the samples under study – which is of great interest for various scenarios.
5. Conclusion and Outlook
In this contribution, we have introduced in-situ correlative near- and mid-infrared (NIR, MIR) optical coherence tomography (OCT) and MIR hyperspectral chemical imaging; relevant key-aspects of this unique combination were discussed in details. The developed multimodal optical system has been evaluated and experimentally demonstrated, to the best of our knowledge, for the first time. The metrogological capabilities of the presented solution were verified by investigating a complex specimen with distinct morphology as well as chemical signatures.
The two modalities (OCT and MIR hyperspectral imaging) were united in a single measurement head and complement each other, revealing sample details that would usually be hidden for a stand-alone technique. A single supercontinuum laser has been employed as a light source covering parts of the NIR and MIR region (1.1 µm - 4.4 µm emission range).
The OCT modality operated in spectral-domain configuration (SD-OCT) exploiting a dual-band detection scheme (2 µm and 4 µm center wavelengths), reported in [8], which enabled high-resolution and penetration-enhanced imaging for inspection of highly scattering samples. Using a cost-effective pyroelectric array in the MIR band, the system able to resolve sub-interfaces and detect structures embedded in a benchmark ceramic-based composite sample.
The MIR spectroscopy modality has been implemented in the attractive spectral region (3.1 µm - 4.4 µm), where functional organic groups display valuable and strong absorption bands. The detection system is based on a low-cost electrically tunable Fabry-Pérot filter equipped with a pyroelectric point detector. The spectral resolution of around 50 nm - 75 nm ( 40 cm-1) allowed to uniquely distinguish and chemically identify the 50 µm thin polymer films (polyethylene terephthalate, polystyrene, and polypropylene) embedded in a highly scattering ceramic stack. Therefore, the spectroscopic imaging modality is particularly advantageous and feasible, as it is independent on the OCT modality; thus, no matching condition between spectral and axial resolution has to be considered.
The correlative morphological and hyperspectral imaging data set delivered by the developed system provides multidimensional information of the sample under investigation. Thereby, the emission spectrum of the single supercontinuum source is effectively and expediently exploited. Moreover, this kind of source is, in fact, an enabling technology for the presented dual-modality correlative imaging setup. Due to the current developments in the field of MIR supercontinua generation, further expansion of spectral coverage into the MIR fingerprint region, enhanced brightness, as well as decreasing prices of this novel type of laser-based light sources, are expected. Therefore, we anticipate a substantial application potential of supercontinuum laser sources for both OCT and spectroscopy in the fields of non-destructive testing, biomedical optics and beyond.
Funding
Horizon 2020 Framework Programme (722380); Province of Upper Austria (Innovative Upper Austria 2020); EFRE Urban Innovative Actions (IWB2020); Österreichische Forschungsförderungsgesellschaft (FFG) (871974).
References
- [1] Adam M. Zysk, Freddy T. Nguyen, Amy L. Oldenburg, Daniel L. Marks, and Stephen A. Boppart M.D. Optical coherence tomography: a review of clinical development from bench to bedside. Journal of Biomedical Optics, 12(5):1 – 21, 2007.
- [2] Stifter David. Beyond biomedicine: a review of alternative applications and developments for optical coherence tomography. Applied Physics B, 88(3):337–357, Aug 2007.
- [3] Jonas Golde, Lars Kirsten, Christian Schnabel, Julia Walther, and Edmund Koch. Optical Coherence Tomography for NDE, pages 1–44. Springer International Publishing, Cham, 2018.
- [4] Shixun Dai, Yingying Wang, Xuefeng Peng, Peiqing Zhang, Xunsi Wang, and Yinsheng Xu. A review of mid-infrared supercontinuum generation in chalcogenide glass fibers. Applied Sciences, 8(5), 2018.
- [5] Rong Su, Mikhail Kirillin, Ernest W. Chang, Ekaterina Sergeeva, Seok H. Yun, and Lars Mattsson. Perspectives of mid-infrared optical coherence tomography for inspection and micrometrology of industrial ceramics. Opt. Express, 22(13):15804–15819, Jun 2014.
- [6] Ivan Zorin, Rong Su, Andrii Prylepa, Jakob Kilgus, Markus Brandstetter, and Bettina Heise. Mid-infrared fourier-domain optical coherence tomography with a pyroelectric linear array. Opt. Express, 26(25):33428–33439, Dec 2018.
- [7] Niels M. Israelsen, Christian R. Petersen, Ajanta Barh, Deepak Jain, Mikkel Jensen, Günther Hannesschläger, Peter Tidemand-Lichtenberg, Christian Pedersen, Adrian Podoleanu, and Ole Bang. Real-time high-resolution mid-infrared optical coherence tomography. Light: Science & Applications, 8(11):2047–7538, Jan 2019.
- [8] Ivan Zorin, Paul Gattinger, Markus Brandstetter, and Bettina Heise. Dual-band infrared optical coherence tomography using a single supercontinuum source. Opt. Express, 28(6):7858–7874, Mar 2020.
- [9] D.M. Koller, G. Hannesschläger, M. Leitner, and J.G. Khinast. Non-destructive analysis of tablet coatings with optical coherence tomography. European Journal of Pharmaceutical Sciences, 44(1):142 – 148, 2011.
- [10] Hungyen Lin, Yue Dong, Daniel Markl, Bryan M. Williams, Yalin Zheng, Yaochun Shen, and J. Axel Zeitler. Measurement of the Intertablet Coating Uniformity of a Pharmaceutical Pan Coating Process With Combined Terahertz and Optical Coherence Tomography In-Line Sensing. Journal of Pharmaceutical Sciences, 106(4):1075–1084, 04 2017.
- [11] C. S. Cheung, J. M. O. Daniel, M. Tokurakawa, W. A. Clarkson, and H. Liang. Optical coherence tomography in the 2 µm wavelength regime for paint and other high opacity materials. Opt. Lett., 39(22):6509–6512, Nov 2014.
- [12] C. S. Cheung, J. M. O. Daniel, M. Tokurakawa, W. A. Clarkson, and H. Liang. High resolution fourier domain optical coherence tomography in the 2 m wavelength range using a broadband supercontinuum source. Opt. Express, 23(3):1992–2001, Feb 2015.
- [13] Ivan Zorin, Jakob Kilgus, Rong Su, Bernhard Lendl, Markus Brandstetter, and Bettina Heise. Multimodal mid-infrared optical coherence tomography and spectroscopy for non-destructive testing and art diagnosis. In Haida Liang, Roger Groves, and Piotr Targowski, editors, Optics for Arts, Architecture, and Archaeology VII, volume 11058, pages 74 – 88. International Society for Optics and Photonics, SPIE, 2019.
- [14] Wolfgang Drexler and James G. Fujimoto. Optical Coherence Tomography, Technology and Applications. Springer International Publishing, 2008.
- [15] Hideaki Kitahara, Masahiko Tani, and Masanori Hangyo. Frequency-domain optical coherence tomography system in the terahertz region. Applied Physics B, 126(1):22, Jan 2020.
- [16] Christoph Gasser, Jakob Kilgus, Michael Harasek, Bernhard Lendl, and Markus Brandstetter. Enhanced mid-infrared multi-bounce atr spectroscopy for online detection of hydrogen peroxide using a supercontinuum laser. Opt. Express, 26(9):12169–12179, Apr 2018.
- [17] Ivan Zorin, Jakob Kilgus, Kristina Duswald, Bernhard Lendl, Bettina Heise, and Markus Brandstetter. Sensitivity-enhanced fourier transform mid-infrared spectroscopy using a supercontinuum laser source. Applied Spectroscopy, 74(4):485–493, 2020. PMID: 32096412.
- [18] Sune Dupont, Christian Petersen, Jan Thøgersen, Christian Agger, Ole Bang, and Søren Rud Keiding. Ir microscopy utilizing intense supercontinuum light source. Opt. Express, 20(5):4887–4892, Feb 2012.
- [19] F. Borondics, M. Jossent, C. Sandt, L. Lavoute, D. Gaponov, A. Hideur, P. Dumas, and S. Février. Supercontinuum-based fourier transform infrared spectromicroscopy. Optica, 5(4):378–381, Apr 2018.
- [20] Jakob Kilgus, Gregor Langer, Kristina Duswald, Robert Zimmerleiter, Ivan Zorin, Thomas Berer, and Markus Brandstetter. Diffraction limited mid-infrared reflectance microspectroscopy with a supercontinuum laser. Opt. Express, 26(23):30644–30654, Nov 2018.
- [21] Christian Rosenberg Petersen, Nikola Prtljaga, Mark Farries, Jon Ward, Bruce Napier, Gavin Rhys Lloyd, Jayakrupakar Nallala, Nick Stone, and Ole Bang. Mid-infrared multispectral tissue imaging using a chalcogenide fiber supercontinuum source. Opt. Lett., 43(5):999–1002, Mar 2018.
- [22] Manoj K. Dasa, Gianni Nteroli, Patrick Bowen, Giulia Messa, Yuyang Feng, Christian R. Petersen, Stella Koutsikou, Magalie Bondu, Peter M. Moselund, Adrian Podoleanu, Adrian Bradu, Christos Markos, and Ole Bang. All-fibre supercontinuum laser for in vivo multispectral photoacoustic microscopy of lipids in the extended near-infrared region. Photoacoustics, 18:100163, 2020.
- [23] Davide Grassani, Eirini Tagkoudi, Hairun Guo, Clemens Herkommer, Fan Yang, Tobias J. Kippenberg, and Camille-Sophie Brés. Mid infrared gas spectroscopy using efficient fiber laser driven photonic chip-based supercontinuum. Nature Communications, 10(1):1553, 2019.
- [24] Abba Saleh, Antti Aalto, Piotr Ryczkowski, Goery Genty, and Juha Toivonen. Short-range supercontinuum-based lidar for temperature profiling. Opt. Lett., 44(17):4223–4226, Sep 2019.
- [25] Malay Kumar, Mohammed N. Islam, Fred L. Terry, Michael J. Freeman, Allan Chan, Manickam Neelakandan, and Tariq Manzur. Stand-off detection of solid targets with diffuse reflection spectroscopy using a high-power mid-infrared supercontinuum source. Appl. Opt., 51(15):2794–2807, May 2012.
- [26] Jakob Kilgus, Kristina Duswald, Gregor Langer, and Markus Brandstetter. Mid-infrared standoff spectroscopy using a supercontinuum laser with compact fabry-pérot filter spectrometers. Appl. Spectrosc., 72(4):634–642, Apr 2018.
- [27] Julien Mandon, Evgeni Sorokin, Irina T. Sorokina, Guy Guelachvili, and Nathalie Picqué. Supercontinua for high-resolution absorption multiplex infrared spectroscopy. Opt. Lett., 33(3):285–287, Feb 2008.
- [28] Christian R. Petersen, Peter M. Moselund, Laurent Huot, Lucy Hooper, and Ole Bang. Towards a table-top synchrotron based on supercontinuum generation. Infrared Phys. Technol, 91:182 – 186, 2018.
- [29] Christian R. Petersen, Uffe Møller, Irnis Kubat, Binbin Zhou, Sune Dupont, Jacob Ramsay, Trevor Benson, Slawomir Sujecki, Nabil Abdel-Moneim, Zhuoqi Tang, David Furniss, Angela Seddon, and Ole Bang. Mid-infrared supercontinuum covering the 1.4-13.3 µm molecular fingerprint region using ultra-high na chalcogenide step-index fibre. Nature Photonics, 8:830–834, Sep 2014.
- [30] Kun Liu, Jiang Liu, Hongxing Shi, Fangzhou Tan, and Pu Wang. High power mid-infrared supercontinuum generation in a single-mode zblan fiber with up to 21.8 w average output power. Opt. Express, 22(20):24384–24391, Oct 2014.
- [31] Tonglei Cheng, Kenshiro Nagasaka, Tong Hoang Tuan, Xiaojie Xue, Morio Matsumoto, Hiroshige Tezuka, Takenobu Suzuki, and Yasutake Ohishi. Mid-infrared supercontinuum generation spanning 2.0 to 15.1 µm in a chalcogenide step-index fiber. Opt. Lett., 41(9):2117–2120, May 2016.
- [32] Yingying Wang, Shixun Dai, Guangtao Li, Dong Xu, Chenyang You, Xin Han, Peiqing Zhang, Xunsi Wang, and Peipeng Xu. 1.4-7.2 µm broadband supercontinuum generation in an as-s chalcogenide tapered fiber pumped in the normal dispersion regime. Opt. Lett., 42(17):3458–3461, Sep 2017.
- [33] Zheming Zhao, Bo Wu, Xunsi Wang, Zhanghao Pan, Zijun Liu, Peiqing Zhang, Xiang Shen, Qiuhua Nie, Shixun Dai, and Rongping Wang. Mid-infrared supercontinuum covering 2.0-16 µm in a low-loss telluride single-mode fiber. Laser & Photonics Reviews, 11(2):1700005, 2017.
- [34] Ramon A. Martinez, Genevieve Plant, Kaiwen Guo, Brian Janiszewski, Michael J. Freeman, Robert L. Maynard, Mohammed N. Islam, Fred L. Terry, Oseas Alvarez, Francois Chenard, Robert Bedford, Ricky Gibson, and Agustin I. Ifarraguerri. Mid-infrared supercontinuum generation from 1.6 to >11µm using concatenated step-index fluoride and chalcogenide fibers. Opt. Lett., 43(2):296–299, Jan 2018.
- [35] Etienne Genier, Patrick Bowen, Thibaut Sylvestre, John M. Dudley, Peter Moselund, and Ole Bang. Amplitude noise and coherence degradation of femtosecond supercontinuum generation in all-normal-dispersion fibers. J. Opt. Soc. Am. B, 36(2):A161–A167, Feb 2019.
- [36] A N Ghosh, M Meneghetti, C R Petersen, O Bang, L Brilland, S Venck, J Troles, J M Dudley, and T Sylvestre. Chalcogenide-glass polarization-maintaining photonic crystal fiber for mid-infrared supercontinuum generation. Journal of Physics: Photonics, 1(4):044003, sep 2019.
- [37] U. Morgner, W. Drexler, F. X. Kärtner, X. D. Li, C. Pitris, E. P. Ippen, and J. G. Fujimoto. Spectroscopic optical coherence tomography. Opt. Lett., 25(2):111–113, Jan 2000.
- [38] Hyeong Soo Nam and Hongki Yoo. Spectroscopic optical coherence tomography: A review of concepts and biomedical applications. Applied Spectroscopy Reviews, 53(2-4):91–111, 2018.
- [39] Dan P. Popescu, Lin-P’ing Choo-Smith, Costel Flueraru, Youxin Mao, Shoude Chang, John Disano, Sherif Sherif, and Michael G. Sowa. Optical coherence tomography: fundamental principles, instrumental designs and biomedical applications. Biophysical Reviews, 3(3):155, Aug 2011.
- [40] O. Svelto. Principles of Lasers. Springer US, 2010.
- [41] Michael Maria, Ivan Bravo Gonzalo, Thomas Feuchter, Mark Denninger, Peter M. Moselund, Lasse Leick, Ole Bang, and Adrian Podoleanu. Q-switch-pumped supercontinuum for ultra-high resolution optical coherence tomography. Opt. Lett., 42(22):4744–4747, Nov 2017.
- [42] Mikkel Jensen, Iván Bravo Gonzalo, Rasmus Dybbro Engelsholm, Michael Maria, Niels Møller Israelsen, Adrian Podoleanu, and Ole Bang. Noise of supercontinuum sources in spectral domain optical coherence tomography. J. Opt. Soc. Am. B, 36(2):A154–A160, Feb 2019.
- [43] Antonio Rogalski. Infrared Detectors 2nd Edition. CRC, 2011.
- [44] Donald E. Marshall. A review of pyroelectric detector technology. In Utilization of Infrared Detectors, volume 0132, 1978.
- [45] A. Hossain and M. H. Rashid. Pyroelectric detectors and their applications. IEEE Transactions on Industry Applications, 27(5):824–829, Sep. 1991.
- [46] W. W. Daniels and R. E. Kitson. Infrared spectroscopy of polyethylene terephthalate. Journal of Polymer Science, 33(126):161–170, 1958.
- [47] J. Karger-Kocsis, editor. Infrared and Raman spectroscopy of polypropylene, pages 320–328. Springer Netherlands, Dordrecht, 1999.
- [48] D. Olmos, E. V. Martín, and J. González-Benito. New molecular-scale information on polystyrene dynamics in ps and ps–batio3 composites from ftir spectroscopy. Phys. Chem. Chem. Phys., 16:24339–24349, 2014.
- [49] John M. Chalmers and Peter R. Griffiths, editors. Handbook of Vibrational Spectroscopy: Chalmers Vibrat 5V Set. John Wiley & Sons, Ltd, Chichester, UK, December 2001.
- [50] M. Toplak, G. Birarda, S. Read, C. Sandt, S. M. Rosendahl, L. Vaccari, J. Demšar, and F. Borondics. Infrared orange: Connecting hyperspectral data with machine learning. Synchrotron Radiation News, 30(4):40–45, 2017.
- [51] Peter R. Griffiths and James A. de Haseth. Conventional transmission spectrometry. In Fourier Transform Infrared Spectrometry, chapter 11, pages 251–260. John Wiley & Sons, Ltd, 2006.
- [52] Lucas Hermann Negri and Christophe Vestri. lucashn/peakutils: v1.1.0. https://doi.org/10.5281/zenodo.887917, September 2017.