Evaluating Text Coherence at Sentence and Paragraph Levels
Abstract
In this paper, to evaluate text coherence, we propose the paragraph ordering task as well as conducting sentence ordering.
We collected four distinct corpora from different domains on which we investigate the adaptation of existing sentence ordering methods to a paragraph ordering task.
We also compare the learnability and robustness of existing models by artificially creating mini datasets and noisy datasets respectively and verifying the efficiency of established models under these circumstances.
Furthermore, we carry out human evaluation on the rearranged passages from two competitive models and confirm that WLCS-l is a better metric performing significantly higher correlations with human rating than , the most prevalent metric used before.
Results from these evaluations show that except for certain extreme conditions, the recurrent graph neural network-based model is an optimal choice for coherence modeling.
Keywords: text ordering, coherence modeling, learnability verification, robustness assessment, human evaluation
languageresourceLanguage Resources
Evaluating Text Coherence at Sentence and Paragraph Levels
| Sennan Liu13, Shuang Zeng23, Sujian Li3 |
| 1Department of English and International Study, China Foreign Affairs University, Beijing, China |
| 2School of Software and Microelectronics, Peking University, Beijing, China |
| 3MOE Key Lab of Computational Linguistics, Peking University, Beijing, China |
| stan.x.liu.18@gmail.com, {zengs,lisujian}@pku.edu.cn |
Abstract content
1. Introduction
Coherence modeling has been a topic for discourse analysis for a long time [Lapata, 2003]. Text ordering is the standard task used to test a coherence model in NLP. While earlier work aims at distinguishing between a coherently ordered list of sentences and a random permutation thereof, recent studies attempt to generate a consecutive text from a set of given sentences.
Various frameworks exist, focusing on linguistic features via statistical models [Lapata, 2003, Barzilay and Lee, 2004, Barzilay and Lapata, 2005, Elsner and Charniak, 2011]. Especially, entity based models [Barzilay and Lapata, 2008, Guinaudeau and Strube, 2013] have shown the effectiveness of exploiting entities for this task. With the popularization of neural networks, studies formulate the problem as neural pair-wise discrimination [Li and Hovy, 2014, Chen et al., 2016], with a purpose on training a discriminator to separate coherent clique or pairs from non-coherent ones. Recently, thanks to the success of set-to-sequence framework [Vinyals et al., 2015, Vinyals et al., 2016], the focus shifts to generative ordering problem [Gong et al., 2016, Logeswaran et al., 2017, Cui et al., 2018, Yin et al., 2019], aiming at finding a framework to learn to generate an optimal order from a bunch of input sequences. However, most of these studies only focus on the sentence level task and experiment using the abstracts from academic papers, which is unrealistic in the real world where various lengths and text domains may be used. Moreover, none of them analyze the adaptability of models with respect to different qualities of language resource, which prevents further study to improve the models in a fine-grained aspect.
In this paper, we firstly propose to study text ordering at the paragraph level as a supplement of sentence ordering, with a purpose of comprehensively researching text coherence. We then compare the performance of the existing models on 4 prevalent sentence-level datasets and 4 paragraph-level datasets from diverse domains we collected. Then we design artificial datasets to evaluate their learnability and robustness by shrinking training size and adding artificial noise to the language source respectively, which leads to several conclusions that could contribute to further studies. Finally, we carry out human evaluation to assess coherence of machine-arranged text and find WLCS-l a much more reliable metric on sentence ordering task than the most prevailing metric before. We believe our discoveries will guide further research and application.
2. Datasets
In this section, we will briefly go through the prevalent datasets and introduce the corpus we compiled.
In order to fairly verify performance of the major approaches at both the sentence and the paragraph level, 8 datasets are used in total, among which 4 are at the sentence level and the rest are at the paragraph level.
| Dataset | Average sequence number | Average sequence length | Data split | Vocabulary | ||||||
|---|---|---|---|---|---|---|---|---|---|---|
| Train | Dev | Test | Train | Dev | Test | Train | Dev | Test | ||
| NIPS | 6.40 | 6.66 | 6.48 | 25.92 | 26.93 | 26.40 | 3519 | 196 | 195 | 19957 |
| AAN | 5.08 | 5.31 | 5.51 | 24.56 | 24.51 | 24.47 | 15961 | 892 | 893 | 55588 |
| arXiv | 6.69 | 6.98 | 7.23 | 25.19 | 25.69 | 25.17 | 36652 | 2045 | 2044 | 97305 |
| SIND | 5.00 | 5.00 | 5.00 | 11.49 | 11.62 | 11.42 | 40155 | 4990 | 5055 | 30952 |
| News | 7.97(3.16) | 7.96(3.16) | 8.07(3.15) | 77.45 | 77.46 | 75.78 | 12634 | 720 | 707 | 87067 |
| Statements | 5.58(3.23) | 5.47(3.54) | 4.85(3.65) | 66.30 | 86.99 | 85.76 | 12530 | 712 | 715 | 53708 |
| Economist | 9.73(4.31) | 10.04(4.69) | 9.94(4.78) | 94.81 | 97.53 | 97.36 | 70728 | 3929 | 3929 | 535345 |
| Lyrics | 29.51(2.21) | 29.42(2.23) | 29.51(2.25) | 7.28 | 7.27 | 7.27 | 43858 | 2436 | 2436 | 77021 |
2.1. Datasets for sentence ordering
Four existing datasets are adopted to evaluate model performance at the sentence level.
-
1.
NIPS Abstract. This dataset contains roughly 3K abstracts from NIPS papers from 2005 to 2015.111https://www.kaggle.com/benhamner/nips-papers.
-
2.
ANN Abstract. It includes about 13K abstracts extracted from the papers in the ACL Anthology Network (AAN) corpus[Radev et al., 2016].
-
3.
arXiv Abstract. We further consider another source of abstracts collected from arXiv. It consists of around 40k instances222https://www.kaggle.com/neelshah18/arxivdataset.
-
4.
SIND. It has 50K stories for the visual storytelling task[Huang et al., 2016], which are from a different domain.
Statistics of the datasets are listed in Table 1.
2.2. Datasets for document ordering
To assess existing approaches at the paragraph level and in broader domains, we collect four datasets for paragraph ordering.
-
1.
News. This dataset consists of news releases of U.S. Department of Justice(DOJ), from January 2009 to August 2019. We create the corpus by first crawling data333Scraper repo: https://github.com/jbencina/dojreleases. We removed the speeches when scraping. from the DOJ website and then parse and filter the disqualified articles. For the bullet points or numbering lists, we link them to the tail of the previous paragraph successively.
-
2.
Statements. This dataset contains American presidential written statements. The data source is from the website of UCSB presidency project444 https://www.presidency.ucsb.edu/documents/app-categories/presidential/written-statements. We integrate all the bullet points and numbering lists with their starting paragraph.
-
3.
Economist. This dataset contains the articles from the famous journal Economist from 1990 to 2018. Ads are removed with only texts left.555 https://tea.share2china.com/.
-
4.
Lyrics. This dataset is made of the lyrics of pop songs666https://www.kaggle.com/mousehead/songlyrics. Each line of lyrics is perceived as a sequence in our experiments. Although they are not strictly paragraphs, the weak connect between each sequence makes it hard to find a logical order as sentence ordering.
Our datasets differ from the previous ones in two ways. First, each sequence is less connected semantically and there are not as much conjunctive tokens as hint as in abstracts. Second, they are from diverse domains, resulting in a good chance to examine the adaptability of models assessed in different themes. Each dataset we collected is split in the same ratios - 90% for training and each 5% for development and testing. Except for Lyrics, we split all other corpus in a chronological order, which means the models are trained and tuned on the text released in an earlier time and tested on the ones released afterward. The statistics of the four are displayed in Table 1.
3. Method
In this work, to evaluate the performance of text ordering, we choose four state-of-the-art generative models which outperform earlier discriminative models. These four models are: (1)LSTM+Ptr-Net [Gong et al., 2016], (2)Variant-LSTM+Ptr-Net [Logeswaran et al., 2017], (3)ATTOrderNet [Cui et al., 2018], (4) SE-Graph [Yin et al., 2019]. Their decoders are all based on the Ptr-Net framework [Vinyals et al., 2015].Through the use of attention [Bahdanau et al., 2014, Luong et al., 2015], Ptr-Net works as a type of new decoder for sequence generation.
While a normal attention network picks the weighted average of all vectors (e.g. word embeddings of a sentence) as the input for the current time step, Ptr-Net simply uses the attention value as the pointer and picks out one tensor from all input tensors. In this way, attention is used to retrieve the most likely vector as input for RNN and as a probability index when generating the output pointer. Formally, Ptr-Net can be described as:
| (1) | ||||
| (2) | ||||
| (3) |
All the models based on a hierarchical architecture [Yang et al., 2016], in which LSTM [Hochreiter and Schmidhuber, 1997] works as the bottom level sequence encoder, encoding the sentence into a compressed representation in a way it can fit on the upper level structure for reasoning.
The major differences of these models lie in their encoders. LSTM+PtrNet uses a conventional LSTM to read the paragraphs or sentences representation and learn the representations as a whole. Variant-LSTM+PtrNet is based on the set-to-sequence framework [Vinyals et al., 2016], which reads the discourse by a series of RNN units with weighted average of sequences vectors as input for each time step and passes the last hidden layer to decoder as the final high level abstraction. ATTOrderNet adopts self-attention architecture [Vaswani et al., 2017],where the input is the concatenated sequence vectors for a self-attention encoder without the position encoding information. SE-Graph utilizes the Graph Recurrent Network [Zhang et al., 2018], that parallelly and iteratively updates its node states with a message passing framework [Gilmer et al., 2017]. For every message passing step , the state of each node update involves a massage calculating from its directly connected neighbors and applying the gated operations with the newly calculated message.
4. Experiments and Results
In this section, we will elaborate our experiment settings and discuss our results. We first use our newly assembled sources to evaluate the models across different sequence levels and genres. Then we make a further assessment on robustness under diverse data scale and noisy extent. Finally, human evaluation is carried out to compare the correlation between human rating and several existing metrics.
4.1. Experiment Setting
For fair comparison, all the batch sizes share the size of 8 and beam width of 32. All of of the models use LSTM as sequence encoder. We use early stopping when there is no performance improvement in 5 consecutive epochs. The nltk tokenizer is used for word tokenization777NLTK implementation: http://www.nltk.org/. All the out-of-vocabulary words are replaced with UNK, whose embeddings are adapted during the training process. For LSTM+PtrNet and SE-Graph, the 100 dimension GloVe 6B [Pennington et al., 2014] pretrained word embedding vectors are used to initialize word embedding layer, while for Variant-PtrNet and ATTOrderNet, we use GloVe 300d instead. Due to the space limitation, we only emphasize some of the crucial settings. For each model, the specific configurations used are listed as follows:
-
•
For LSTM+PtrNet, we follow the authentic configuration and a scoring function for pointer generation is set to be an generalized version of global attention [Bahdanau et al., 2014]:
(4) In order to explore the potential of this framework, we employ 4 parallel heads throughout all pointer attention layers888As we fail to aquire the source code from the author, we replicate the model by ourselves. In practice we found the performance of our version approximates to the authentic release. and use L2 weight decay on the trainable parameters with regularization parameter .
-
•
For Variant-LSTM+PtrNet we employ 8 parallel heads, like in LSTM+PtrNet, throughout all pointer attention layers. All other hypterparameters follow the setting of previous work. 999As we tried our best but still cannot get connection to the author, we replicate the model by ourselves. Some performance mismatch are observed, but the framework completely follows the original paper..
-
•
For ATTOrderNet, the number of attention hidden layers is 6, 4, 4, 2 for AAN abstract, arxiv abstract, Economist and the rest, respectively. We employ 8 parallel heads throughout all self-attention layers. Any other settings keep the same as the original paper.
-
•
For SE-Graph, the setting of the optimizer is the same as the setting of ATTOrderNet. We use the hidden size of 300 for both sequence encoder and GRN encoders for all sentence-level datasets except SIND. Besides these configurations, we keep all the rest hyperparameters as what is in the original release.
Except for SE-Graph, which is implemented by Pytorch, all of the models are implemented with TensorFlow.
| Sentence Level | arXiv | AAN | NIPS | SIND | ||||||||
|---|---|---|---|---|---|---|---|---|---|---|---|---|
| pmr | wlcs-l | #pm | pmr | wlcs-l | #pm | pmr | wlcs-l | #pm | pmr | wlcs-l | #pm | |
| LSTM+PtrNet | 22.17 | 0.6002 | 11.0M | 35.65 | 0.6575 | 6.8M | 19.79 | 0.5839 | 3.2M | 13.61 | 0.5756 | 4.2M |
| V-LSTM+PtrNet | 21.36 | 0.5934 | 66.9M | 35.62 | 0.6564 | 54.5M | 17.95 | 0.5620 | 43.6M | 13.13 | 0.5703 | 46.5M |
| ATTOrderNet | 25.73 | 0.6122 | 40.9M | 40.00 | 0.6763 | 32.6M | 29.17 | 0.6200 | 13.4M | 13.57 | 0.5733 | 16.3M |
| SE-Graph | 26.73 | 0.6251 | 12.4M | 45.97 | 0.6995 | 11.4M | 27.55 | 0.6282 | 4.5M | 15.07 | 0.5838 | 11.6M |
| Paragraph Level | Press | Statements | Journal | Lyrics | ||||||||
|---|---|---|---|---|---|---|---|---|---|---|---|---|
| pmr | wlcs-l | #pm | pmr | wlcs-l | #pm | pmr | wlcs-l | #pm | pmr | wlcs-l | #pm | |
| LSTM+PtrNet | 42.33 | 0.6543 | 10.0M | 43.12 | 0.6582 | 6.6M | 5.24 | 0.4549 | 11.2M | 0.26 | 0.1765 | 8.9M |
| V-LSTM-PtrNet | 35.04 | 0.6304 | 64.1M | 33.01 | 0.6346 | 53.7M | 4.85 | 0.4424 | 67.6M | 0.66 | 0.1891 | 60.7M |
| ATTOrderNet | 42.57 | 0.6555 | 55.4M | 45.79 | 0.6692 | 45.0M | 5.27 | 0.4595 | 41.6M | 0.49 | 0.1751 | 52.1M |
| SE-Graph | 46.90 | 0.6749 | 13.3M | 42.66 | 0.6704 | 12.0M | 5.29 | 0.4618 | 20.02M | 0 | 0.1719 | 12.4M |
4.2. Metrics
We measure the ranking performance[sorting performance] from two aspects. From a global perspective, we use Perfect Match Ratio (PMR) and Accuracy (Acc) as the proxy for the absolute position measurement; from a local perspective, Kendall’s tau() and Weighted Longest Common Subsequence (WLCS-l) are used as pair-wise position metrics.
Perfect Match Ratio(PMR)
is the most stringent measurement in this task. It calculates the ratio of exactly matching orders: , where and are predicted and correct orders of the i-th text respectively.
Accuracy(Acc)
is a measure of how often the absolute position of a sentence was correctly predicted. Compared with PMR, this is a finer metric to measure how well the model performs on finding the absolute position.
Kendall’s tau()
is one of the most frequently used metrics for the automatic evaluation of document coherence. It could be formalized as: , where n is the length of the sequence and the number of inversions denotes the number of pairs in the predicted sequence with incorrect relative order. This metric ranges from -1 (the worst) to 1 (the best).
Length Adapted Weighted Longest Common Subsequence(WLCS-l)
is an adapted version of original ROUGE-w, the metric of the extent of sequence overlapping [Lin, 2004]. Compared with other LCS-based metrics in the ROUGE family, WLCS-l encourages the model to generate successive sequence when the overlapping proportion is same while automatically decreasing with the total sequence length. It could be formalized as:
| (5) | ||||
| (6) | ||||
| (7) |
where represents the length of passage. and represent the sequence of predicted order and truth order sequence, respectively. The two functions and are the same in [Lin, 2004]. Intuitively, we hope the model generates consecutive suborder instead of segments of skip-grams. We use the package py-rouge101010https://pypi.org/project/py-rouge/ to calculate the WLCS-l score with the default alpha value being adopted.
4.3. Within and Cross-domain Performance
To generally examine the performance of each framework, we first run models on all datasets. Table 2 shows the test results of established approaches in two types of tasks. For each dataset, we report the PMR, WLCS-l and number of parameters of each measure. Note that PMR values might be lower than those in previous works since we remove all the texts containing only one sequence. The results confirm our expectation that graph model is much more powerful for ordering task, since it automatically learns directional information flow among each sequence rather than through a central weight matrix as in ATTOrderNet or by a single hidden layer as in Variant-LSTM+PtrNet. At the sentence level, SE-Graph almost dominates all previous models on both the global coherence (measured by PMR) and the local coherence(measured by WLCS-l). At the paragraph level, SE-Graph continues to be the state-of-the-art method in most cases. It acquires the best WLCS-l scores on three datasets and the best PMR on two, which indicates its adaptability on long sequence tasks.
| Train | Model | Test | ||
|---|---|---|---|---|
| arXiv | AAN | NIPS | ||
| arXiv | LSTM+PtrNet | 0.73 | 0.77 | 0.81△ |
| V-LSTM+PtrNet | 0.77 | 0.80 | 0.83△ | |
| ATTOrderNet | 0.75 | 0.79 | 0.81△ | |
| SE-Graph | 0.78 | 0.80 | 0.80△ | |
| AAN | LSTM+PtrNet | 0.64 | 0.74 | 0.65 |
| V-LSTM+PtrNet | 0.73 | 0.81 | 0.75 | |
| ATTOrderNet | 0.64 | 0.76 | 0.65 | |
| SE-Graph | 0.72 | 0.81 | 0.80△ | |
| NIPS | LSTM+PtrNet | 0.62 | 0.65 | 0.70 |
| V-LSTM+PtrNet | 0.64 | 0.64 | 0.70 | |
| ATTOrderNet | 0.66 | 0.70 | 0.73 | |
| SE-Graph | 0.66 | 0.71 | 0.75 | |
| Train | Model | Test at paragraph level / Test at sentence level | ||
| News | Statements | Economist | ||
| News | LSTM+PtrNet | 69.33 / 76.04 | 28.42 / 40.81 | 9.68 / 26.77 |
| V-LSTM+PtrNet | 61.48 / 74.55 | 25.26 / 40.64 | 4.77 / 25.62 | |
| ATTOrderNet | 70.19 / 77.78 | 39.37♢/ 44.82 | 13.64♢/ 26.90♢ | |
| SE-Graph | 66.22 / 69.80 | 31.72 / 45.42♢ | 12.69 / 24.29 | |
| Statements | LSTM+PtrNet | 24.96♢/ 49.98 | 61.66 / 60.14 | 14.50 / 29.44 |
| V-LSTM+PtrNet | 17.86 / 51.12 | 52.67 / 59.19 | 8.55 / 27.44 | |
| ATTOrderNet | 23.54 / 52.77♢ | 63.41 / 59.83 | 16.11♢/ 30.06♢ | |
| SE-Graph | 22.71 / 39.84 | 48.50 / 55.68 | 15.88 / 27.35 | |
| Economist | LSTM+PtrNet | 25.74♢/ 52.08 | 36.96♢/ 50.81♢ | 37.42 / 45.64 |
| V-LSTM+PtrNet | 18.75 / 45.03 | 39.67 / 44.69 | 31.44 / 39.75 | |
| ATTOrderNet | 23.60 / 52.64♢ | 36.15 / 49.55 | 37.80 / 46.71 | |
| SE-Graph | 21.78 / 38.61 | 20.14 / 40.16 | 32.69 / 36.28 | |
We examine the domain adaptability of available approaches by first training and tuning the model on data from one domain, and then test them on test set from another. This procedure mimics the practice in reality - when there is no gold passage corpus for training, one must utilize data from another resource then go through the pretrain-finetune process.
Table 3(a) shows the results of cross-domain experiments on academic abstract datasets, which supports our assertion that the prevalent researches are limited on specific text genre. When measured by , all of the four evaluated models are capable of transferring the knowledge learning from arXiv to NIPS. This conclusion can also be reinforced when measured by Acc. Nearly all triangles locate within the complex row of arXiv, indicating that it could be a general language resource of academic abstract for sentence ordering, in terms of pair-wise order.
Table 3(b) gives a glance of model performance measured by Accuracy on various domains. It is quite obvious that our data resources suffer from less overlapping, which makes it valuable to be used for a training and testing purposes in a broader and more realistic sense. Unlike corpus for the sentence-level task, results show models only work when training on the corresponding domain. This conclusion is also valid when measured by . In addition, in order to test the effect of domain on sentence ordering tasks, we adopt each paragraph in the corpus as a whole passage and test sentence ordering capability of evaluated models. Results also show that Economist is a hard dataset for ordering tasks both at the paragraph and at the sentence level. This is perhaps out of its argument nature, where sentences and paragraphs are connected more by higher level semantic relations instead of hint words.
When measured by Accuary, ATTOrderNet dominates all other models by acquiring the state-of-the-art results in all in-domain and nearly all cross-domain tests in our corpus, which confirms capacity of self-attention structure on catching the absolute coherence. Table 3(b) illustrates the performance of ATTOrderNet at both the sentence level and the paragraph level. This conclusion can also be applied to the ordering task on academic abstracts. In addition, SE-Graph distinguishes itself when measured by . Table 3(a) reveals a comparison of the four models on academic abstract corpus. SE-Graph gains state-of-the-art performance in all the within domain in-domain experiments and competitive results with the benchmark when tested under a cross domain cross-domain circumstances. The conclusion is also well supported by results at the paragraph-level task.
It is easier to transfer knowledge from Economist to News and Statements Corpus at the sentence level than at the paragraph level. Benchmark accuracy for cross-domain inference reaches over 0.5 in when transfer the knowledge learned from Economist to News and Statements. However, when we try to transfer the knowledge in the same way at the paragraph level, the benchmark performance collapse on News. This phenomenon could be a result of less sentences but more paragraphs in News, which makes the sentence-level task easier.
4.4. Learnability and Robustness Analysis
We picked out arXiv and Economist as the representative language source on behalf of general discourses at the sentence level and the paragraph level respectively since the results of cross-domain experiments in the last subsection has illustrated their comprehensiveness. To mimic practical environment we create mini datasets and noisy datasets as approaches to test model performance.
We report WLCS-l instead of as a proxy for local coherence. The motivation behind this is a common phenomenon: misplaced successive sentences are easier to be recap than sequences round its absolute position connected in a skip-gram manner with its supposed siblings. We observe this phenomenon from the human evaluation. Sequences carry consecutive meaning in one clique tends to give human smoother reading experience, which can be perfectly measured by WLCS-l. Besides, Acc is set as the indicator of absolute coherence.
In the following parts, we first introduce the artificial datasets we made and then analyze the experiment results.


4.4.1. Mini and Noisy Datasets
Aiming at studying the learnability of models under low-resource data scenarios, we sample mini dataset to mimic the low-resource occasion. To be more precisely, we sample children training and dev set as mini datasets from the parent corpus in a bootstrap manner by randomly picking out a certain number of instances from the parent set iteratively and independently while fixing the proportion between train and dev. We divide the scale of children training set into five levels – 1k, 3k, 5k, 8k, 10k. In experiment, we run the models on these mini datasets and observe the variation of our metrics.
In an attempt to find the robustness of available methods, we generate the noisy datasets for noisy experiment. To be more specific, we add ”noise” to a specific sequence by randomly adopting one approach from the following three options:
-
•
Insert. We create the ”Insert” noise by randomly picking an ad from a list111111We retrieve the ad slogans from two website. In total, there are 100 pieces of ads in the set https://marketingwit.com/famous-advertising-slogans,https://www.thebalancecareers.com/best-advertising-taglines-ever-39208 and insert it in front of the sequence processed. The intuition behind this approach is that ads usually mixed in the middle of an article and hard to remove. As a result, we try to simulate this occasion by a inverse measure - ”Insert” ads into the passage.
-
•
Remove. We pop out the sequence from the complete text under the ”Remove” noise mode. The motivation behind is to mock the scenario where processing PDF with existing parsing package may face a format mismatch, causing content missing. Thus, we simply ”Remove” some sequences to mimic this scenario.
-
•
Modify. We randomly pick 50% of all the tokens in one sequence and modify them in three possible ways: concatenating, splitting and replacing. For concatenating, we concatenate the current token with another token right behind if the current token does not locates at the tail position. For splitting, we split the current token in a randomly selected position when its length is not smaller than two. For replacing, we randomly replace one of the letters in the token with one character in the substitution list121212The list contains all possible numbers, letters and symbols that is available in an English context.
In order to uniformly permute our noise in the whole corpus, for each sequence, we assign an probability of being ”contaminated”, which means each sentence has an equal chance to be polluted by ”noise”. We define the noisy level of dataset with the parameter . In our experiment, we verify these models on four levels of : 20%, 50%, 80%, 100%. This measure is to emulate that text harvested from a scanner or a photo converter that may contain some mistakes in word spelling out of misrecognizing letter from the picture.
4.4.2. Experiments on Learnability
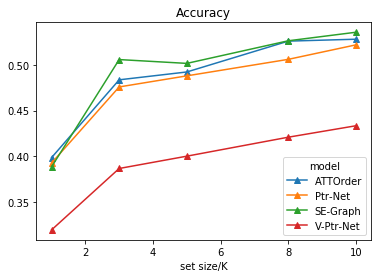
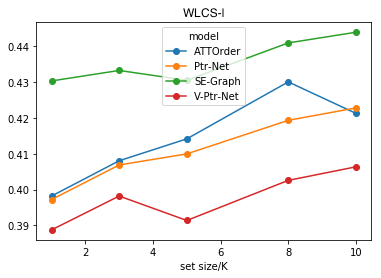
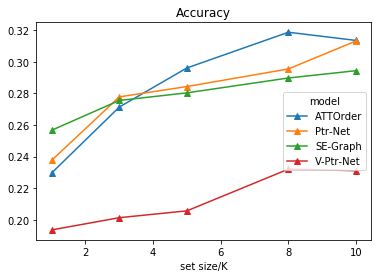
To effectively examine learnability, we train our models on mini datasets. In order to acquire accurate measures, we conduct 20 and 10 bootstrap tests on mini datasets whose training size is 1K and 3K, and 5 bootstrap tests on mini datastes whose training set is 5K, 8K and 10K respectively.
Figure 1(a) and 1(c) show that in general, SE-Graph outperforms other methods with a high margin if measured by wlcs-l, and often follows the trends of ATTOrderNet in both the sentence and the paragraph levels.
In terms of Accuracy, Figure 1(b) illustrates that except Variant-LSTM+Ptr-Net, all three models share relatively similar performance under a data-scarce environment at the sentence level. At the paragraph level, although self-attention-based method dominates all others when measured by Accuracy, it fails to keep its superiority in an extreme occasion when training size is less than 3K, as the cross point in Figure 1(d) indicates. On the country, GRN structure reveals its strong adaptability in an extreme low-resource environment.
4.4.3. Experiments on Robustness
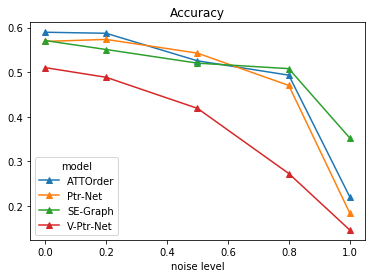
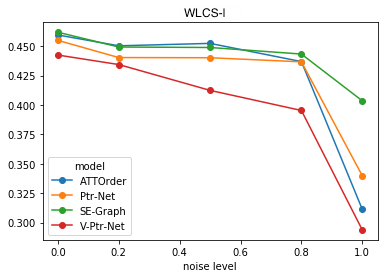
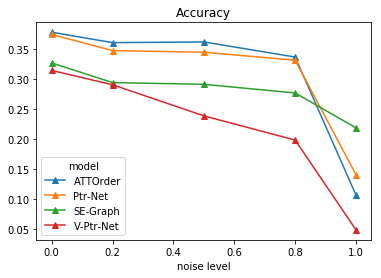
To effectively examine robustness, we train our models on artificially sampled noisy datasets. Figure 2(a)-2(b) illustrate the results at the sentence level. SE-Graph illustrates the strongest noise resistance against the other three. This suggests the robustness of SE-Graph at the sentence level from a relative coherence angle. For global coherence, SE-Graph is supposed to be the most insensitive. Although it remains slightly lower accuracy under a light-noisy condition, its performance enjoys the least decrease when noise level raise to an extreme level.
Figure 2(c)-2(d) plots the results at the paragraph level. The WLCS-l curves indicate the insensitivity of graph framework. Among the four models, only SE-Graph keeps its WLCS-l above 0.4 when noise level comes to 100% whereas the metrics of all other structures drop below 0.35. For absolute positions, the modest slope of green curve reinforces this conclusion, although ATTOrderNet dominates in terms of Accuracy under low noisy circumstances, the Accuracy measure of SE-Graph suffers from the least drop rate when noise reaches to the highest level.
The outstanding noise resistance and low-resource favoring property of the SE-Graph probably lie in its graph building procedure. When the noise level rises or sample size shrinks, LSTM sentence encoder structure has a hard time to encode sequences precisely. While all other models simply rely on the encoded sequence representation from LSTM, SE-Graph explicitly utilizes the connection from dependency parsing. Thus, as long as the entities in the sequence are not hurt, SE-Graph could ensure the right topographical structure of information flow in the successive graph encoding process. As a result, for document ordering, where much more entities are in one sequence in average, there is a higher chance for arbitrary two sentences or paragraphs to remain correctly connected with each other.
4.5. Human Evaluation
In our experiments, we randomly sampled 40 passages from the test set of arXiv abstract and pick the predicted articles of ATTOrderNet and SE-Graph. As a result, in total, 80 passages are evaluated by human judges. To avoid the fatigue effect brought by long-time evaluating, we half the predicted orders from each model into two sets. Thus, passage 1-20 from each model are put into one package while the other 40 passages are put into another.
We distribute the packages among a total of 6 human judges (3 judges per package). Thus, each judge is presented with 40 rearranged permutation of sentences in total from two models. They were asked to assign a single coherence rating for each passage permutation. The ratings were on a scale of 1 to 5, with 1 being very incoherent and 5 being perfectly coherent. The standard is listed as the following:
-
•
1 - Nonsense: What it says makes no sense.
-
•
2 - Wired: It looks rigid but one can understand some segments.
-
•
3 - Acceptable: One can understand the meaning but it’s not an easy task.
-
•
4 - Coherent: One can understand the meaning with no difficulty although there are some flaws.
-
•
5 - Fluent: One can understand the meaning and he cannot tell whether it is from human or machine.
We do not provide any additional instructions or examples of scale as we wanted to capture the intuitive idea of coherence from our judges.
We compute the inter-rater agreement by using Pearson’s correlation analysis. We concatenate the ratings for each half of the samples from one model into one array. In this way, we obtain three arrays simulating score from three different raters. We correlate the ratings given by each judge with the average ratings given by these judges. For interrater agreement we report the average of 3 such correlations which is 0.85 (p-value = 1.2e-23). Krippendorff’s [Artstein and Poesio, 2008] can be used for inter-rater agreement with interval scales like the one we have. In our case, the values were 0.53. The moderate value of alpha indicates that judging coherence of a passage is indeed a difficult task, especially when detailed instructions or examples of scales are not given.
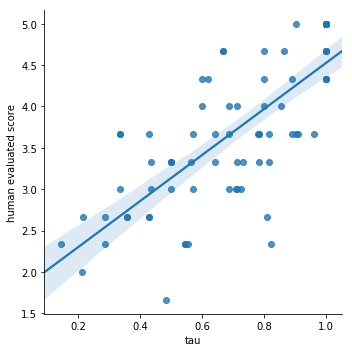
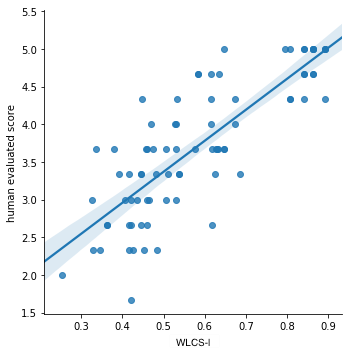
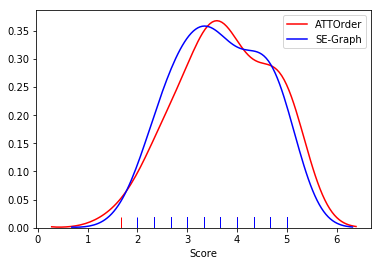
In order to assess which metrics is the best automatic measure of sentence ordering coherence, we regress the average ratings by human judges on , Accuracy and WLCS-l. Although the the regression on reflects the effectiveness of the wildly used metrics with an R-square of 0.571, the regression on Accuracy and WLCS-l indicates their appropriateness with R-square of 0.618 and 0.665, respectively. The results proves that WLCS-l, which has never been considered as one way to measure the validity of sentence ordering methods is indeed correlates the best with human judgements. Note that our metric differs from the original ROUGE-w by doubling the score operator for the denominator. In this way, the would adjusted itself with the length of texts - the score will automatically diminish when the text goes longer. This stimulates human reaction to long texts - people are much more likely to get lost in longer (and usually more complex) texts and thus a highly coherent permutation is needed as a compensation. Fig 3(a)-3(b) shows the plot when regress human rates on and WLCS-l.
To compare the real human experience of machine planned abstracts, we plot the distribution curves of over all human rating of each model. SE-Graph is proved to be slightly worse compared with ATTOrderNet. The scores for SE-Graph ordered passages peaks at roughly 3 while that for ATTOrderNet peaks at 3.3. This is counter-intuitive since we know from the above analysis that a higher wlcs-l score tends to correlates with a better human rating. However, we observe a phenomenon that rating is sometimes affected by the intrinsic complexity of the passage. Thus, when readers finished reading the passages generated by graph-based method, they then will have a basic impression of the articles, which leads to shorter time spent on understanding predicted text of self-attention and thus causes an illusion of its better performance among raters. In fact, 4 out of 6 annotators rated output of SE-Graph before they score the alternative file, and they all express the impact of intrinsic complexity on coherence rating.
5. Conclusion
In this work, we propose the paragraph ordering task as a supplement of sentence ordering, and 4 datasets with diverse domain and low level of overlapping. Based on the public data source and corpus we presented, we evaluated four structures for text ordering by conducting experiments within and cross different domains on both the sentence level and the paragraph level. We use these multi-genre benchmarks to show the efficiency of SE-Graph, the SOTA approach for sentence ordering based on graphical neural network structure. We also conduct examination on the learnability and robustness of the existing methods by randomly downsampling passages from the parent dataset to mimic the small scale data condition, and by artificially blending noise into the original dataset to imitate a real-world scenario, which help us confirm the excellent learnability and strong noise resistance of the SOTA approach. We also carry out a human evaluation between attention-based and graph-based models, whose results strongly support that WLCS-l, a metric we adopt to measure text ordering for the first time, exhibits a higher correlation with human score than . This conclusion provides a hint for future research, which is expected to focus more on improving common sequence instead of concentrating on the order between sequence pairs. Flexible decoder generator may be a direction with greater value, since it may allow a machine to generate sentence in an order that is easier to form coherence clique compared with starting rigidly with the head sequence.
Acknowledgments
We thank the anonymous reviewers for their helpful comments on this paper. This work was partially supported by National Key Research and Development Project (2019YFB1704002) and National Natural Science Foundation of China (61876009 and 61572049). The corresponding author of this paper is Sujian Li.
Bibliographical References
References
- Artstein and Poesio, 2008 Artstein, R. and Poesio, M. (2008). Survey article: Inter-coder agreement for computational linguistics. Computational Linguistics, 34(4):555–596.
- Bahdanau et al., 2014 Bahdanau, D., Cho, K., and Bengio, Y. (2014). Neural machine translation by jointly learning to align and translate. CoRR, abs/1409.0473.
- Barzilay and Lapata, 2005 Barzilay, R. and Lapata, M. (2005). Modeling local coherence: An entity-based approach. In Proceedings of the 43rd Annual Meeting of the Association for Computational Linguistics (ACL’05), pages 141–148, Ann Arbor, Michigan, June. Association for Computational Linguistics.
- Barzilay and Lapata, 2008 Barzilay, R. and Lapata, M. (2008). Modeling local coherence: An entity-based approach. Computational Linguistics, 34(1):1–34.
- Barzilay and Lee, 2004 Barzilay, R. and Lee, L. (2004). Catching the drift: Probabilistic content models, with applications to generation and summarization. In Proceedings of the Human Language Technology Conference of the North American Chapter of the Association for Computational Linguistics: HLT-NAACL 2004, pages 113–120, Boston, Massachusetts, USA, May 2 - May 7. Association for Computational Linguistics.
- Chen et al., 2016 Chen, X., Qiu, X., and Huang, X. (2016). Neural sentence ordering. ArXiv, abs/1607.06952.
- Cui et al., 2018 Cui, B., Li, Y., Chen, M., and Zhang, Z. (2018). Deep attentive sentence ordering network. In Proceedings of the 2018 Conference on Empirical Methods in Natural Language Processing, pages 4340–4349, Brussels, Belgium, October-November. Association for Computational Linguistics.
- Elsner and Charniak, 2011 Elsner, M. and Charniak, E. (2011). Extending the entity grid with entity-specific features. In Proceedings of the 49th Annual Meeting of the Association for Computational Linguistics: Human Language Technologies, pages 125–129, Portland, Oregon, USA, June. Association for Computational Linguistics.
- Gilmer et al., 2017 Gilmer, J., Schoenholz, S. S., Riley, P. F., Vinyals, O., and Dahl, G. E. (2017). Neural message passing for quantum chemistry. ArXiv, abs/1704.01212.
- Gong et al., 2016 Gong, J., Chen, X., Qiu, X., and Huang, X. (2016). End-to-end neural sentence ordering using pointer network. ArXiv, abs/1611.04953.
- Guinaudeau and Strube, 2013 Guinaudeau, C. and Strube, M. (2013). Graph-based local coherence modeling. In ACL.
- Hochreiter and Schmidhuber, 1997 Hochreiter, S. and Schmidhuber, J. (1997). Long short-term memory. Neural Computation, 9(8):1735–1780, November.
- Huang et al., 2016 Huang, T.-H. K., Ferraro, F., Mostafazadeh, N., Misra, I., Agrawal, A., Devlin, J., Girshick, R., He, X., Kohli, P., Batra, D., Zitnick, C. L., Parikh, D., Vanderwende, L., Galley, M., and Mitchell, M. (2016). Visual storytelling. In Proceedings of the 2016 Conference of the North American Chapter of the Association for Computational Linguistics: Human Language Technologies, pages 1233–1239, San Diego, California, June. Association for Computational Linguistics.
- Lapata, 2003 Lapata, M. (2003). Probabilistic text structuring: Experiments with sentence ordering. In Proceedings of the 41st Annual Meeting of the Association for Computational Linguistics, pages 545–552, Sapporo, Japan, July. Association for Computational Linguistics.
- Li and Hovy, 2014 Li, J. and Hovy, E. (2014). A model of coherence based on distributed sentence representation. In Proceedings of the 2014 Conference on Empirical Methods in Natural Language Processing (EMNLP), pages 2039–2048, Doha, Qatar, October. Association for Computational Linguistics.
- Lin, 2004 Lin, C.-Y. (2004). ROUGE: A package for automatic evaluation of summaries. In Text Summarization Branches Out, pages 74–81, Barcelona, Spain, July. Association for Computational Linguistics.
- Logeswaran et al., 2017 Logeswaran, L., Lee, H., and Radev, D. R. (2017). Sentence ordering using recurrent neural networks. ArXiv, abs/1611.02654.
- Luong et al., 2015 Luong, T., Pham, H., and Manning, C. D. (2015). Effective approaches to attention-based neural machine translation. In EMNLP.
- Pennington et al., 2014 Pennington, J., Socher, R., and Manning, C. (2014). Glove: Global vectors for word representation. In Proceedings of the 2014 Conference on Empirical Methods in Natural Language Processing (EMNLP), pages 1532–1543, Doha, Qatar, October. Association for Computational Linguistics.
- Radev et al., 2016 Radev, D. R., Joseph, M. T., Gibson, B. R., and Muthukrishnan, P. (2016). A bibliometric and network analysis of the field of computational linguistics. JASIST, 67:683–706.
- Vaswani et al., 2017 Vaswani, A., Shazeer, N., Parmar, N., Uszkoreit, J., Jones, L., Gomez, A. N., Kaiser, L., and Polosukhin, I. (2017). Attention is all you need. CoRR, abs/1706.03762.
- Vinyals et al., 2015 Vinyals, O., Fortunato, M., and Jaitly, N. (2015). Pointer networks. In C. Cortes, et al., editors, Advances in Neural Information Processing Systems 28, pages 2692–2700. Curran Associates, Inc.
- Vinyals et al., 2016 Vinyals, O., Bengio, S., and Kudlur, M. (2016). Order matters: Sequence to sequence for sets. In International Conference on Learning Representations (ICLR).
- Yang et al., 2016 Yang, Z., Yang, D., Dyer, C., He, X., Smola, A., and Hovy, E. (2016). Hierarchical attention networks for document classification. In Proceedings of the 2016 Conference of the North American Chapter of the Association for Computational Linguistics: Human Language Technologies, pages 1480–1489, San Diego, California, June. Association for Computational Linguistics.
- Yin et al., 2019 Yin, Y., Song, L., Su, J., Zeng, J., Zhou, C., and Luo, J. (2019). Graph-based neural sentence ordering. In Proceedings of the Twenty-Eighth International Joint Conference on Artificial Intelligence, IJCAI-19, pages 5387–5393. International Joint Conferences on Artificial Intelligence Organization, 7.
- Zhang et al., 2018 Zhang, Y., Liu, Q., and Song, L. (2018). Sentence-state lstm for text representation. In ACL.