Circumnuclear Molecular Gas in Low-redshift Quasars and Matched Star-forming Galaxies
Abstract
A series of gravitational instabilities in a circumnuclear gas disk (CND) are required to trigger gas transport to a central supermassive black hole (SMBH) and ignite Active Galactic Nuclei (AGNs). A test of this scenario is to investigate whether an enhanced molecular gas mass surface density () is found in the CND-scale of quasars relative to a comparison sample of inactive galaxies. Here we performed sub-kpc resolution CO(2–1) observations with ALMA of four low-redshift (), luminous ( erg s-1) quasars with each matched to a different star-forming galaxy, having similar redshift, stellar mass, and star-formation rate. We detected CO(2–1) emission from all quasars, which show diverse morphologies. Contrary to expectations, of the quasar sample, computed from the CO(2–1) luminosity, tends to be smaller than the comparison sample at pc; there is no systematic enhancement of in our quasars. We discuss four possible scenarios that would explain the lower molecular gas content (or CO(2–1) luminosity as an actual observable) at the CND-scale of quasars, i.e., AGN-driven outflows, gas-rich minor mergers, time-delay between the onsets of a starburst-phase and a quasar-phase, and X-ray-dominated region (XDR) effects on the gas chemical abundance and excitation. While not extensively discussed in the literature, XDR effects can have an impact on molecular mass measurements particularly in the vicinity of luminous quasar nuclei; therefore higher resolution molecular gas observations, which are now viable using ALMA, need to be considered.
1 Introduction
How are supermassive black holes (SMBHs) in galaxies fed? This has been one of the key open questions in astrophysics ever since quasars and active galactic nuclei (AGNs) were firmly established to be powered by accretion onto SMBHs. Fueling material needs to lose 99% of its angular momentum to travel from kpc-scale galactic disks all the way down to the central black hole (Lynden-Bell & Rees, 1971). Therefore, a specific physical mechanism is required to provide torques that can transport gas to the nuclear region where viscous forces in an accretion disk can then take over (e.g., Balbus & Hawley, 1998).
In principle, major gas-rich galaxy mergers (such as observed as ultra-luminous infrared galaxies = ULIRGs, Sanders & Mirabel, 1996) could provide one such mechanism, generating torques leading to massive gas inflows (e.g., Hernquist, 1989; Di Matteo et al., 2005; Hopkins et al., 2006, 2008). Recent high resolution and/or high sensitivity observations indeed show enhanced AGN fraction in major merger systems (Ellison et al., 2011; Silverman et al., 2011; Koss et al., 2018; Goulding et al., 2018), which is particularly the case for dust-reddened quasars (e.g., Urrutia et al., 2008). While capable of triggering AGN, major mergers are not likely the dominant mechanism for fueling most SMBHs out to (e.g., Cisternas et al., 2011; Schawinski et al., 2012; Kocevski et al., 2012; Mechtley et al., 2016). It appears that mergers account for about of all AGN activity (Silverman et al., 2011).
For nearby low-luminosity AGNs (i.e., Seyfert-class; nuclear bolometric luminosity erg s-1), secular processes, induced by for example, a barred gravitational potential, galaxy–galaxy interaction (e.g., Shlosman et al., 1990; Kormendy & Kennicutt, 2004; Hopkins & Hernquist, 2006), or minor mergers (e.g., Mihos & Hernquist, 1994; Taniguchi, 1999; Kaviraj, 2014), may be sufficient to redistribute gas in the galaxy and transport angular momentum outward. Recent multi-scale hydrodynamical simulations (e.g., Hopkins & Quataert, 2010) predict that such gravitational instabilities are also the mechanism for gas transport in luminous AGNs (i.e., quasar-class) that dominate black hole growth. The simulations show that when the gas mass surface density is sufficiently high in the central several 100 pc region of a gaseous circumnuclear disk (CND), a series of instabilities occur, which could then reach gas down to sub-pc scales. In this picture, black hole accretion generally takes place if sufficient gas is deposited at the CND-scale irrespective of the mechanism.
How much gas is deposited at the CND-scale and on what timescale in the hosts of luminous quasars are currently unanswered questions. These most likely further depend on redshift, mass, and local environment. In nearby Seyfert galaxies, Izumi et al. (2016a) found a positive correlation between dense molecular gas mass of CND and AGN luminosity, supporting the importance of circumnuclear gas amount in AGN fueling. For luminous quasars at , molecular gas observations have been limited in resolution to a few arcsec ( kpc) thus far (Scoville et al., 2003; Evans et al., 2001, 2006; Shangguan et al., 2020), probing only the total gas content.
Now the Atacama Large Millimeter/submillimeter Array (ALMA) permits us to spatially resolve the central sub-kpc of such quasar-host galaxies. According to the simulations (e.g., Hopkins & Quataert, 2010), there should be a threshold in the nuclear gas density, above which self-gravitating instabilities can form, and below which inflows essentially do not exist. As a first step to test this scenario, here we study whether significantly higher gas mass surface densities, which are the key parameter determining gravitational instability, are observed by ALMA at the CND-scale in luminous quasars (accretion rate of the Eddington-limited value) relative to comparison galaxies without AGN. Note that the actual accretion rate should fluctuate strongly (e.g., Novak et al., 2011; Schawinski et al., 2015): an observed intermediate accretion rate could either be due to a genuinely low inflow rate, or just to a temporally fluctuated low accretion rate for a very high inflow rate. This ambiguity can be reduced in a statistical sense when we observe more and more luminous quasars.
This effort is organized as follows. In Section 2, we describe the details of our sample selection and ALMA observations. The observed properties are presented in Section 3. We discuss hypothesized differences in CND-scale gas mass surface density between quasars and comparison galaxies in Section 4. Our conclusions are summarized in Section 5. Throughout this paper, we adopt the concordant cosmological parameters = 70 km s-1 Mpc-1, = 0.3, and = 0.7.
2 Data description
2.1 Sample Selection
To test the above hypothesis, we selected quasars and inactive galaxies, matched in redshift, stellar mass (), and global star formation rate (SFR) (Figure 1; Table 1). This leaves central gas surface density and AGN activity as prime parameters: a positive correlation between these therefore implies a causation. We initially selected quasar-galaxy pairs for this purpose, but later realized that one pair is not well matched in SFR actually. Hence, we excluded that pair from our work, which leaves pairs (see Appendix for details of the excluded pair). With this sample size, we can rule out the possibility that all quasars have higher gas surface density than galaxies solely by chance at a coincidence level of (random probability = 0.5N = 6%).
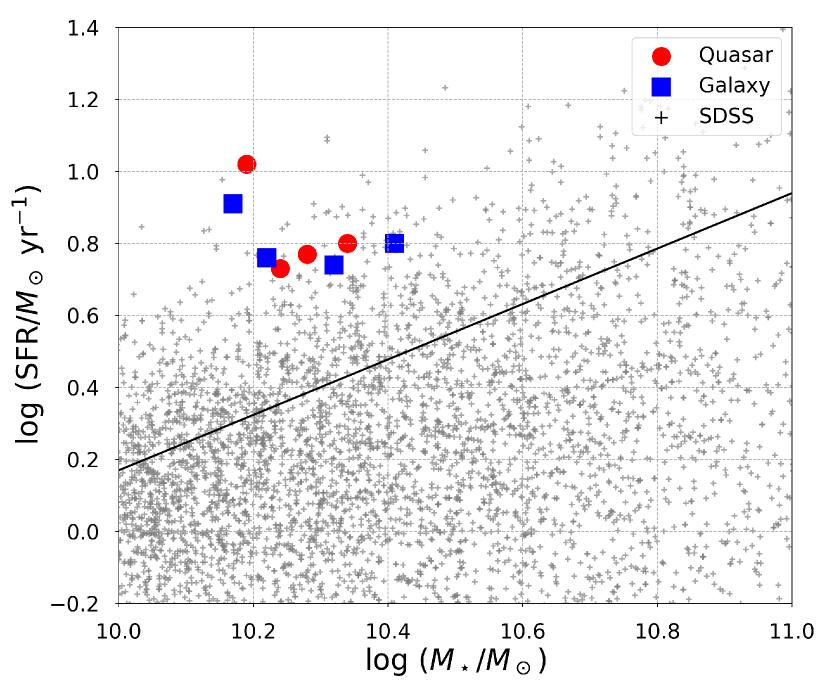
For the quasar sample, we selected nearby (), massive (black hole mass measured with the H-based single epoch method, Vestergaard & Peterson, 2006), high-accretion type-1 objects from the Palomar-Green (PG) quasar sample (Schmidt & Green, 1983) and the Hamburg/ESO (HE) Survey quasar sample (Wisotzki et al., 2000; Schulze & Wisotzki, 2010) with declination . Their quasar bolometric luminosities () are erg s-1, which roughly correspond to the knee of the quasar luminosity function at this redshift range (e.g., Shankar et al., 2009; Schulze et al., 2009) and allow us to better avoid the aforementioned degeneracy due to time-fluctuation. Their are inferred from the local mass relation between SMBH and their host galaxy (Kormendy & Ho, 2013). We used the far-infrared luminosity estimated from (Netzer et al., 2007; Rosario et al., 2013) to compute SFRs of our quasars based on the Kennicutt-Schmidt relation (e.g., Kennicutt & Evans, 2012). Note that these quasars were originally ultraviolet-selected, hence were not biased by the amount of gas and dust in their host galaxies.
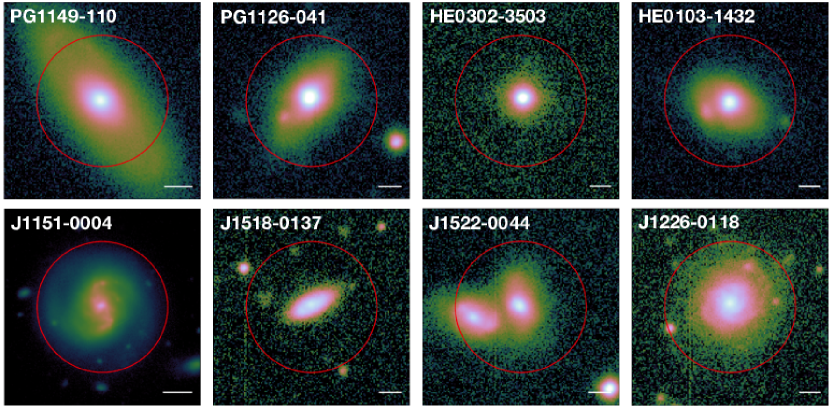
We constructed a comparison sample of inactive galaxies (in terms of quasar activity) selected from the SDSS DR10 MPA-JHU galaxy catalog (Eisenstein et al., 2011; Brinchmann et al., 2004), which is matched to the quasar sample in fundamental parameters – except SMBH accretion rate (Figure 1). Their values are computed by SED fits to photometry following Kauffmann et al. (2003). SFRs are measured with H line emission for the SDSS galaxies (Brinchmann et al., 2004). The constructed pairs are exhibited in Figure 2.
| Name | R.A. | Decl. | Scale | log () | log () | log () | log () | |||
|---|---|---|---|---|---|---|---|---|---|---|
| (ICRS) | (ICRS) | (kpc/) | ||||||||
| PG1149110 | 11:52:03.550 | 11:22:24.09 | 0.049 | 0.96 | 7.92 | 45.1 | 10.34 | 0.80 | ||
| PG1126041 | 11:29:16.729 | 04:24:07.25 | 0.060 | 1.17 | 7.75 | 45.3 | 10.19 | 1.02 | ||
| HE03023503 | 03:04:26.924 | 34:52:07.66 | 0.066 | 1.27 | 7.86 | 45.0 | 10.28 | 0.77 | ||
| HE01031432 | 01:05:38.792 | 14:16:13.58 | 0.066 | 1.27 | 7.81 | 45.0 | 10.24 | 0.73 | ||
| J11510004 | 11:51:30.954 | 00:04:39.93 | 0.048 | 0.93 | - | - | 10.41 | 0.80 | ||
| J15180137 | 15:18:34.689 | 01:37:43.83 | 0.063 | 1.20 | - | - | 10.17 | 0.91 | ||
| J15220044 | 15:22:24.740 | 00:44:04.58 | 0.067 | 1.28 | - | - | 10.32 | 0.74 | ||
| J12260118 | 12:26:46.972 | 01:18:54.13 | 0.062 | 1.20 | - | - | 10.22 | 0.76 |
2.2 ALMA Observations
We observed the redshifted 12CO(2–1) line (rest frequency = 230.5380 GHz) and its underlying continuum emission (at the rest frame wavelength 1.3 mm) towards our targets with ALMA, during Cycle 4 using the Band 6 receiver (project ID: #2015.1.00872.S). As CO(2–1)/CO(1–0) line ratio (or excitation) is widely measured in various kinds of galaxies (see more details in § 4), we can compute molecular masses by using this CO(2–1) line as a surrogate of the ground-transition CO(1–0) line, while easily acquiring higher angular resolutions than cases of lower frequency CO(1–0) observations. In total 37–43 antennas were used with the baseline ranging from 15.1 m to 1.1 km (0.7 km in some cases), resulting in a nominal maximum recoverable scale of . The reduction and calibration were done with CASA version 4.7 (McMullin et al., 2007) in the standard manner. Continuum emission was subtracted in the -plane before making line cubes.
All of the images presented in this paper were reconstructed
using the task clean with the natural weighting to enhance sensitivities,
resulting in synthesized beam sizes of – (major axes).
The achieved 1 sensitivities are 0.26–0.41 mJy beam-1 (quasars)
and 0.16–0.56 mJy beam-1 (comparison galaxies), respectively, for the CO(2–1) cubes:
here we set the frequency resolution () to 62.5 MHz
(velocity resolution km s-1) for quasars,
whereas = 31.25 MHz ( km s-1) for comparison galaxies,
after finding that the lines are relatively fainter in the former (but with broader widths; see § 3).
Further details can be found in Table 2.
Note that on-source integration times were significantly shorter for the quasars (2–5 min)
than for the comparison galaxies (4–12.5 min).
The 10% absolute flux uncertainty, according to the ALMA proposer’s guide,
is not included unless mentioned otherwise.
3 Results
3.1 CO(2–1) emission
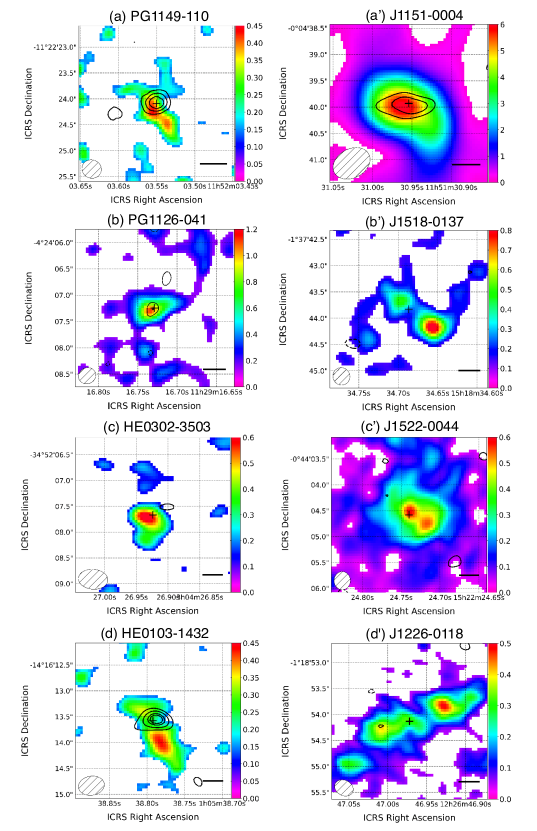
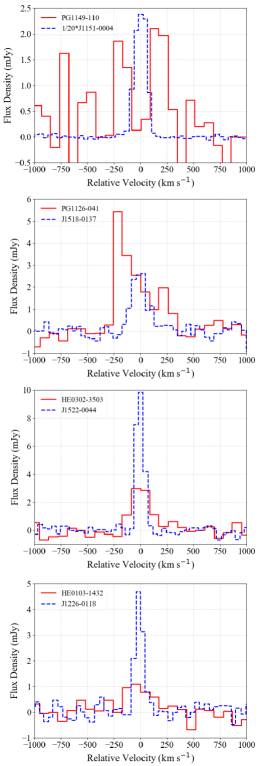
Figure 3 shows the spatial distribution of the CO(2–1) line and underlying 1.3 mm continuum emission within the central 3 region of our sample. Note that the coordinates of their centers are tied to the Gaia reference system except for J11510004, J15220044, and J12260118 (SDSS system). Their CO(2–1) line spectra are presented in Figure 4, which are used to determine the CO-based redshifts (). The line emission was successfully detected in all of the targets and the line-emitting regions are spatially resolved in these global integrated intensity maps. We made these CO(2–1) maps (Figure 3) by integrating velocity channels over the line profiles. For the case of PG1149110, in which the CO(2–1) line profile is not clear due to the modest signal-to-noise (S/N) ratio, we integrated over a velocity range of to km s-1.
As for the quasar sample, line widths are broad with full-width at zero intensity (FWZI) km s-1, which is consistent with the previous single dish-based CO observations toward optically-luminous PG/HE quasars ( mag, Bertram et al., 2007). We also found that the line spectrum of PG1126041, and likely that of PG1149110, show double-horn profiles characteristic of a rotating CND. Recently, Atacama Compact Array (ACA) observations of CO(2–1) emission by Shangguan et al. (2020) also reported a double-horn like profile for PG1126041 but on a larger scale ( resolution).
The CO line width is generally broader in the quasar sample than in the comparison sample. A line profile can be broader if the inclination angle of a system becomes higher, but we would not expect in terms of chance probability that all of our quasars have higher inclination angles than their matched galaxies. Hence, the broader line width would indicate higher gas rotation velocity and/or velocity dispersion in the quasar sample than in the comparison sample. One potential cause of a broader profile is a molecular outflow. However, it is hard to tell whether there are indications of outflows in our quasar spectra given the modest S/N ratios. Another possibility is that the quasars have larger enclosed mass (BH + stellar + gas) than comparison galaxies. In this case, the quasars may be in a later evolutionary phase than the star-forming comparison galaxies. A relevant discussion can be found in § 4.
The morphology of the gas distribution is diverse with spiral-arm-like features (PG1126041 and J15180137), bar- or edge-on disk-like structures (HE01031432 and J12260118), and face-on disk-like structures (HE03023503 and J15220044). In each case, we found that essentially all of the CO(2–1) emission we have recovered emerges from the central a few kpc around the nuclei. Hereafter, we will focus on this small scale () that is much smaller than our maximum recoverable scales (MRS), i.e., missing flux should not be an issue. This may start not to hold when we investigate larger scales, e.g., that is traced by the ACA (aperture , see recent observations toward PG quasars in Shangguan et al., 2020). Hence we do not directly compare our results at this time with those of Shangguan et al. (2020).
Following Solomon & Vanden Bout (2005) we computed the CO(2–1) line luminosity () as
| (1) |
where is the integrated line flux and is the luminosity distance to the object. We first convolved the aperture of individual data cubes to the largest one among our full sample in physical scale, i.e., pc (J11510004). This sufficiently covers the typical CND-scale, as well as is roughly comparable to the spatial scale at which simulations (e.g., Hopkins & Quataert, 2010) start to see elevated gas surface density in quasars. The CO measurements within a central aperture for each object are summarized in Table 3. CO line luminosities are K km s-1 pc2 for the quasar sample and K km s-1 pc2 for the comparison sample, respectively. Except for PG1126041, all of our quasars show fainter than the matched galaxies (see § 4 for further discussion). We stress that it is impossible to estimate how much of the total flux is concentrated at this small scale as there is no single dish CO(2–1) data available except for PG1126041: in this particular case we found that of the total flux measured with the IRAM 30 m telescope (14.9 Jy km s Bertram et al., 2007) originates from the central 700 pc.
| Name | Beam sieze | Beam size | 1 (CO) | 1 (Cont.) | |
|---|---|---|---|---|---|
| (CO: , ∘) | (Cont.: , ∘) | (mJy/beam) | (Jy/beam) | ||
| PG1149110 | 0.380.35, 69.5 | 0.340.32, 73.3 | 0.41 | 0.0491 | 56.9 |
| PG1126041 | 0.340.30, 65.3 | 0.320.29, 65.6 | 0.32 | 0.0603 | 47.3 |
| HE03023503 | 0.570.39, 85.3 | 0.540.37, 83.2 | 0.31 | 0.0656 | 38.7 |
| HE01031432 | 0.500.37, 80.9 | 0.450.34, 84.6 | 0.26 | 0.0669 | 42.8 |
| J11510004 | 0.740.55, 61.0 | 0.720.52, 59.5 | 0.56 | 0.0477 | 44.3 |
| J15180137 | 0.330.32, 23.8 | 0.330.31, 23.5 | 0.22 | 0.0628 | 26.2 |
| J15220044 | 0.350.31, 0.1 | 0.330.31, 2.9 | 0.16 | 0.0669 | 17.3 |
| J12260118 | 0.370.30, 62.8 | 0.340.29, 64.2 | 0.21 | 0.0625 | 22.5 |
| Name | |||||||
| (Jy km s-1) | (107 K km/s pc2) | (107 ) | (Jy km s-1) | (107 K km/s pc2) | (107 ) | (%) | |
| pc | kpc | ||||||
| PG1149110 | 0.74 0.21 | 2.1 0.6 | 2.7 | 1.66 0.39 | 4.6 1.1 | 6.0 | 45 16 |
| PG1126041 | 1.73 0.21 | 7.3 0.9 | 9.5 | 2.76 0.44 | 11.6 1.9 | 15.1 | 63 13 |
| HE03023503 | 0.67 0.12 | 3.4 0.6 | 4.4 | 0.89 0.15 | 4.5 0.7 | 5.9 | 75 18 |
| HE01031432 | 0.42 0.10 | 2.2 0.5 | 2.9 | 1.10 0.23 | 5.7 1.2 | 7.4 | 38 12 |
| J11510004 | 7.17 0.72 | 18.7 1.9 | 24.3 | 17.3 0.2 | 45.2 0.6 | 58.8 | 41 4 |
| J15180137 | 0.87 0.11 | 4.0 0.5 | 5.2 | 3.96 0.16 | 18.1 0.7 | 23.5 | 22 3 |
| J15220044 | 1.12 0.11 | 5.8 0.6 | 7.5 | 4.34 0.14 | 22.6 0.7 | 29.4 | 26 3 |
| J12260118 | 0.66 0.08 | 3.0 0.4 | 3.9 | 2.66 0.13 | 12.0 0.6 | 15.6 | 25 3 |
3.2 Comments on J11510004
As shown in Figures 3 or 4, one comparison galaxy J11510004 is exceptionally bright in CO(2–1) emission ( K km s-1 pc2 at the central 700 pc). This galaxy was matched to the quasar PG1149110, which shows much fainter CO(2–1) emission (Table 3). The of J11510004 is very high even among the comparison sample as well.
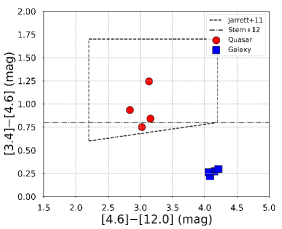
For a possible explanation of this high , we first considered that J11510004 hosts a significant level of dust-obscured star-formation, which is undetectable with SDSS. We further investigated the mid-infrared (MIR) photometric data of our comparison sample obtained by Wide-field Infrared Survey Explorer (WISE: Wright et al., 2010), which is sensitive to dust-obscured activity. An estimated 8–1000 m total IR luminosity (), using a tight correlation between and W3 band luminosity (Cluver et al., 2017), is ( magnitude = 8.35 mag) for the case of J11510004. This corresponds to SFR 10 yr-1 (Murphy et al., 2011), which is still comparable to the SDSS-based unobscured SFR (Table 1). Moreover, the rest of the comparison galaxy sample also shows similar TIR-based SFR ( yr-1). Hence, the dust-obscured star-formation of J11510004 does not stand out among the comparison sample. Note that this measurement cannot be performed for the quasar sample as warm dust heated by the quasars themselves will dominate their WISE fluxes. We also considered the presence of a dust-obscured AGN as it may be hosted in a gas-rich galaxy. To briefly test this scenario, we measured WISE colors of our samples. We found that J11510004 has consistent WISE colors ([4.6][12.0] vs [3.4][4.6] plane; Figure 5) with the rest of the galaxy sample, while our quasars show typical colors for quasars, indeed. Taking these into consideration, we suppose that J11510004 is genuinely a star-forming galaxy that is exceptionally bright in CO(2–1). Any comparison with the matched quasar should be treated with care.
3.3 Continuum emission
We detected mm continuum emission significantly ( 3) in PG1149110, J11510004, and HE01031432, as well as marginally () in PG1126041 (Figure 3). The nominal detection rate is 3 times higher for the quasar sample than for the comparison sample despite the shorter integration times for the former sample. The sizes of the continuum-emitting regions () are smaller than the CO-emitting regions, i.e., more centrally concentrated. These likely imply a significant contribution of quasar-induced emission to the submillimeter continuum emission, either as additional heating to the thermal dust emission or as non-thermal synchrotron emission. Note that in the nearby luminous Seyfert galaxy NGC 1068, it is claimed that about half of ALMA Band 6 continuum flux measured around the nucleus is of non-thermal origin (García-Burillo et al., 2014). As comparably high resolution radio-to-submillimeter continuum data is sparse for our targets, we do not perform detailed analysis to further reveal the nature of the Band 6 continuum emission.
3.4 Estimates of molecular gas mass
Molecular gas mass () is conventionally determined from CO(1–0) line luminosity by using a CO-to-molecular mass conversion factor (Bolatto et al., 2013, and references therein). Note that this molecular mass includes He and heavier elements in addition to H2. To compute , we first need to convert to . We here assume = 2–1 to 1–0 CO brightness temperature ratio , which is the case of optically-thick and fully thermalized excitation. A value of has been observed in the central regions of nearby star-forming galaxies (e.g., Bayet et al., 2004; Sandstrom et al., 2013), IR-luminous galaxies (e.g., Papadopoulos et al., 2012; Saito et al., 2017), Seyfert galaxies (e.g., Mashian et al., 2015), as well as in a global scale of high redshift submillimeter galaxies and luminous quasar host galaxies (Carilli & Walter, 2013). On the other hand, a lower of is frequently observed in kpc scale galactic disks (e.g., Leroy et al., 2013; Saintonge et al., 2017). The latter value is also found for HE/PG quasars when observed at a few kpc resolutions (Bertram et al., 2007; Husemann et al., 2017; Shangguan et al., 2020). Since we now investigate the central sub-kpc regions, however, we adopt throughout this work.
Sandstrom et al. (2013) investigated 26 nearby star-forming galaxies and obtained 782 individual determinations of coupled with a gas-to-dust ratio, after spatially-resolving the targets at some level. As an average for all of their values without weighting, pc-2 (K km s-1)-1 is recommended, which has 0.4 dex standard deviation. This is somewhat lower than the Milky Way value of pc-2 (K km s-1)-1 (Bolatto et al., 2013), and is not strongly dependent on metallicity of galaxies as long as that metallicity is comparable to, or higher than, the solar value. In the central kpc regions of galaxies, Sandstrom et al. (2013) also found that decreases by a factor of from the value averaged over the galaxies. Hence, we adopt pc-2 (K km s-1)-1 in this work, which would have dex uncertainty as well. Note that we apply this to both the quasar and the comparison galaxy samples, although AGN activity can potentially affect molecular gas properties including gas excitation and chemistry (e.g., Izumi et al., 2013, 2016b). As a consequence, we obtained for the quasar sample and for the galaxy sample, respectively, in the central 700 pc aperture (Table 3).
3.5 Molecular gas mass surface density profiles and circumnuclear gas
A primary goal of this work is to test whether systematically enhanced circumnuclear
gas mass surface densities are found in the quasar sample relative to the comparison sample.
Figure 6 shows the azimuthally-averaged radial distributions of
CO(2–1) integrated intensity111We here describe this quantity in the brightness temperature unit (K km s-1) for an easy conversion to .
and corresponding total molecular gas mass surface density ()
of the four matched pairs measured at the central kpc. We used MIRIAD (Sault et al., 1995) task ellint to make these plots
after matching the physical resolution (i.e., not angular resolution) to the poorer one of each pair.
The steps between concentric rings correspond to ,
where is the major axis of each 2D Gaussian beam.
Note that these profiles are sky projections as we have no robust
information about the inclination angles of our targets.
However, the inclination angle (projection) effect will impact the final values of .
For example, if we assume that the classical AGN torus scheme
(Antonucci, 1993) is applicable to our quasars,
their inclination angle () may be
(characteristic value for type-1 AGNs, Marin, 2014).
In this case, could be further reduced by a factor (correction factor = cos ).
Future high resolution observations that accurately constrain the gas distribution and/or dynamics
are necessary to properly correct this effect both for the quasars and the inactive galaxies.
From Figure 6, the quasar sample shows lower than the comparison sample in three of the four pairs: only PG1126041 shows higher relative to its comparison galaxy J15180137 in the central region. This result would be robust even if we regard the galaxy J11510004 to be an anomalous case based on its high , as of the paired quasar PG1149110 is still smaller than the remaining three comparison galaxies at the central pc. Therefore, we do not find systematically enhanced in these quasars as compared to the comparison galaxies. This appears to be contradictory to our initial expectation that the gravitational instability at the CND-scale caused by rich amount of gas triggers AGN, which is predicted in various galaxy evolution models (e.g., Hopkins & Quataert, 2010), as well as is likely supported by recent observations toward nearby Seyfert galaxies (Izumi et al., 2016a).
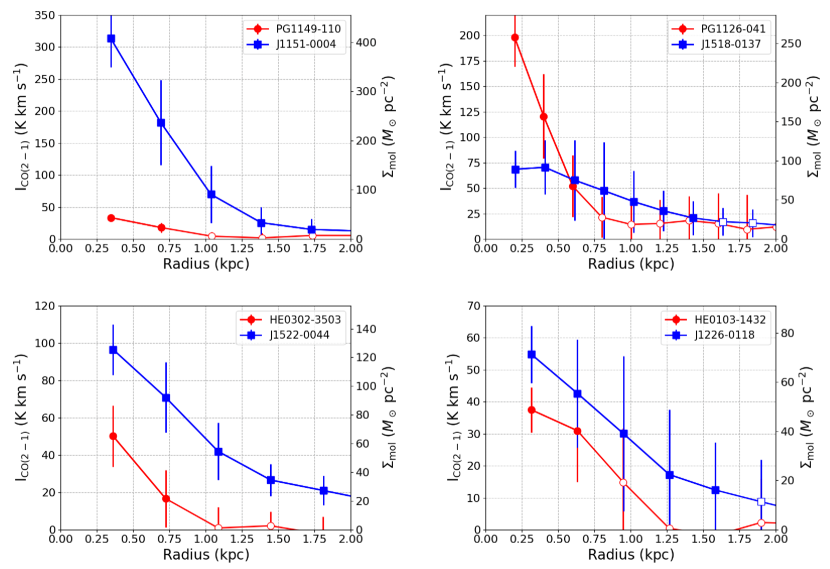
Regarding the comparison galaxy sample, their at the central pc are larger than the typical values ( pc-2; measured with the Galactic ) found in circumnuclear regions of nearby star-forming galaxies (e.g., Leroy et al., 2008). On the other hand, of our quasars, except for PG1126041, tend to be comparable ( pc-2) to that typical value for star-forming galaxies 222 Note that this is in stark contrast to some previous CO observations toward PG quasars (e.g., Evans et al., 2001, 2006), primarily as those quasars were selected based on their IR brightness., although the absolute value of critically depends on the adopted : the value can increase by, for example, when we adopt the Galactic . Indeed, recent hydrodynamic simulations predict that has a large dispersion (e.g., Wada et al., 2018). As there is no effective way to estimate in our targets at this moment, we use the currently adopted value in this work. Future multi- CO observations can lessen this source of uncertainty.
The lower gas masses in these quasars are also evident on a kpc scale as the CO(2–1) emission of the comparison galaxy sample is brighter and spatially more extended than the quasar sample (Figure 3), although the sensitivity of the line cube is considerably different between the two samples (Table 2). For a practical purpose, we measured and of the two samples using a common aperture of kpc (Table 3). The quasar sample shows K km s-1 pc2 (or )333While we probe kpc scales, we continue to use pc-2 (K km s-1)-1 for simplicity in this work., which is clearly smaller than those of the comparison sample K km s-1 pc2 (or ). A similar trend was also found over global scales in luminous (log (/erg s-1) 45–46) quasars (Kakkad et al., 2017), and bulge-dominated HE quasars (Husemann et al., 2017).
4 Discussion
We consider four plausible scenarios to explain the molecular gas properties in the central regions of quasar hosts as compared to a matched control sample of star-forming galaxies. All cases need to consider the lower gas content, the dissimilar radial surface brightness profiles and different velocity profiles.
(i) AGN-driven outflows – massive outflows in various phases of gas have been observed both in nearby AGNs (e.g., Aalto et al., 2012; Greene et al., 2012; Cicone et al., 2014) and in high redshift quasars (e.g., Nesvadba et al., 2008; Maiolino et al., 2012; Bischetti et al., 2019). Among the multiphase flows (ionized, atomic, and molecular), molecular outflows carry the bulk of the gas masses (e.g., Mizumoto et al., 2019), which are considered to be significant enough to deplete CNDs. If we adopt the positive correlation between AGN luminosity and molecular outflow rate () derived by Cicone et al. (2014), we expect as high as yr-1 for our quasar sample. Hence the gap of between the quasar sample and the comparison sample can be easily reconciled if such molecular outflows have lasted only for Myr, which is a small portion of a typical life-time of quasars ( Myr, Schmidt et al., 2017). We recall that we cannot discern the existence of such outflows with current data given the modest S/N ratios (Figure 4).
A caveat of this scenario is that a large fraction of the CO(2–1) emission of our quasar sample comes from the very central region. For example, the ratio of measured with pc to that measured with kpc, which is denoted as in Table 3, is systematically higher in the quasar sample (; average = 52.6 7.1%) than in the comparison sample (; average = 27.0 1.6%). We may expect an opposite case, i.e., lower central gas concentration in the quasar sample, as AGN-driven outflows basically expel their surrounding gas from inside to outside (King & Pounds, 2015). A recent hydrodynamic simulation also suggests that AGNs cause little impact on the surrounding material via winds (Gabor & Bournaud, 2014). However, there may be a possibility that the cavity caused by the feedback is much smaller (e.g., pc; Hopkins et al., 2016) than our resolutions. Higher resolution observations are definitely needed.
(ii) Gas-rich minor merger – the we find at the central 700 pc of the quasar sample are of the order of . An average (bulge-scale) , expected for the quasar sample, is (Table 1). Hence, a 10:1 minor merger (i.e., ) can provide that amount of molecular gas if we assume a typical gas mass fraction of a few to % for galaxies with (e.g., Morokuma-Matsui & Baba, 2015). This scenario is in line with recent observational evidence that major mergers are not the dominant driver of quasar activity at least out to (e.g., Cisternas et al., 2011; Schawinski et al., 2012; Kocevski et al., 2012; Mechtley et al., 2016). It is particularly noteworthy that if the merging (satellite) galaxy also hosts an SMBH, it can form a binary system with the primary SMBH, which then causes gravitational instability in the newly formed gas disk (Taniguchi & Wada, 1996). Very deep optical imaging observations that can capture evidence of past minor mergers are worth performing, such as done for the nearby Seyfert galaxy NGC 1068 (Tanaka et al., 2017).
(iii) Time-delay – Another possible explanation is that a quasar-phase happens during a longer time-scale starburst-phase (e.g., Hopkins, 2012). If this is the case, a large portion of the H2 gas was already consumed by the preceding starburst event. Such time-delay has been predicted not only in galaxy-evolution models including merger-induced ones (e.g., Di Matteo et al., 2005; Hopkins et al., 2008), but also by actual observations (e.g., Davies et al., 2007; Bergvall et al., 2016). Observations suggest that the time-difference between the onsets of the two phases is Myr (Wild et al., 2010; Schawinski et al., 2010). Hence, our quasar sample could have had another H2 gas in the past, if the currently estimated SFRs (Table 1) have lasted for a 100 Myr. This value can be even larger if the quasars have experienced significant reduction of SFR over their lives. In these cases, we expect significantly greater in the CNDs of our quasars at the time they were actually activated, than the currently observed modest values of .
This time-delay would thus wash out a causality between the CND-scale gas properties including and currently observed quasar activity. Hence, we need to perform a test, like what we did in this work, to AGNs in a much younger phase to better investigate the importance of CND-scale for triggering AGN events. Deeply buried (i.e., dust-obscured) AGNs with high Eddington ratios (e.g., Imanishi et al., 2007; Kawaguchi et al., 2004) would be useful for this test. Note that there is a suggestion that the amount of gas reaching the nuclear and accretion disk would depend on the initial gas density profile of a galaxy (Cen, 2015). The higher in the quasar sample than the comparison sample discovered in this work may still imply the initially-different density profiles we expect.
One thing that needs to be further addressed is the relationship to what has been observed in Seyfert-class objects: at the CND-scale of Seyfert galaxies there is a tight positive correlation between SFR and mass accretion rate onto the AGN (e.g., Diamond-Stanic & Rieke, 2012; Esquej et al., 2014), or similarly dense molecular gas mass and accretion rate (Izumi et al., 2016a), while we do not see systematic enhancement in gas amount (or CO(2–1) luminosity as an actual observable here) between the quasar sample and even the non-AGN comparison sample. Regarding this, we speculate that the much higher AGN luminosity in quasars than Seyfert galaxies would explain this difference at some level as discussed in the following.
(iv) XDR effects – Owing to the high X-ray flux expected around an AGN, there may form an X-ray dominated region (XDR), in which gas physical and chemical properties are governed by the X-ray irradiation (Maloney et al., 1996; Meijerink & Spaans, 2005). While the actual size of the XDR depends on the incident X-ray radiation and gas density, typical values are expected to be several hundred pc (i.e., CND-scale we probed in this work) according to a theoretical work (Schleicher et al., 2010). One notable phenomenon in XDRs is that CO molecules are readily dissociated into C atoms, or ionized to C+ or higher levels, which reduces CO abundance and consequently CO(2–1) intensity. Another effect in XDRs is that the gas temperature becomes much higher than in star-forming galaxies or photodissociation regions (= PDRs; Meijerink & Spaans, 2005). We would therefore expect higher CO excitation in XDRs than in PDRs, which can reduce CO(2–1) line intensity by decreasing the number of CO molecules populating the level in AGNs as compared to star-forming galaxies.
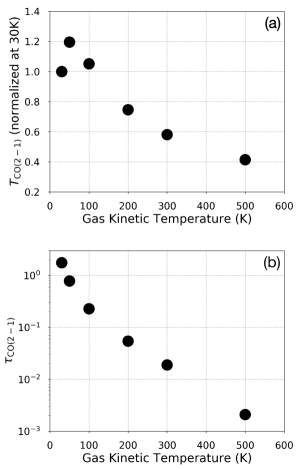
To briefly explore the above-mentioned effect of high temperature in XDRs, we performed non local thermodynamic equilibrium (non-LTE) radiative transfer modelings of line intensities by using the RADEX code (van der Tak et al., 2007). In order simply to grasp a qualitative trend, we performed the modelings by fixing the H2 volume density () of 105 cm-3 and the CO column density-to-velocity gradient ratio (this is relevant to line opacity) of cm-2 (km s-1)-1, which are characteristic to the CNDs of nearby galaxies (e.g., Izumi et al., 2013; Viti et al., 2014). Throughout the modelings we adopted the cosmic microwave background temperature (2.73 K at ) for the background temperature.
Figure 7 shows the resultant values of the CO(2–1) line intensity (brightness temperature) and the line opacity as a function of the gas kinetic temperature (). Here we modeled cases of = 30, 50, 100, 200, 300, and 500 K. There is a trend of reducing the CO(2–1) intensity and the line opacity as increasing , as bulk of the CO population is excited to further higher rotational -levels. Suppose that the molecular gas temperature is typically K in PDRs or star-forming galaxies (Hollenbach & Tielens, 1997), whereas it is much higher in XDRs (at least several 100 K; Maloney et al., 1996), we would expect a factor reduction in CO(2–1) intensity in AGNs than in star-forming systems even if the total gas mass, gas density, and CO abundance are comparable. Furthermore, the CO abundance is basically lower in XDRs than in PDRs, which further reduces the CO intensity in the former regions. This reduction in CO(2–1) intensity due to the high AGN luminosity of the quasar nucleus itself may consequently make the correlation between the CND-scale CO(2–1) luminosity (we rely on this to derive ) and the nuclear activity ambiguous, which would relax the tension with the observations of the lower-luminosity Seyfert galaxies.
These XDR effects have been mainly discussed in nearby Seyfert galaxies (e.g., Izumi et al., 2015), and such discussion is sparse for high redshift objects. However, the effects become stronger with increasing incident X-ray radiation. Now that we are able to probe the central CND-scale molecular gas thanks to the advent of ALMA, we need to carefully consider these effects to properly measure the molecular gas mass in the vicinity of luminous quasar nuclei.
5 Summary and future prospects
We have presented high resolution CO(2–1) observations by using ALMA toward 4 pairs of luminous quasars and normal star-forming galaxies, which are matched in redshift, , and SFR. Our prime aim is to investigate whether a systematically enhanced gas mass surface density is found at the circumnuclear several 100 pc scales of the quasar sample as compared to the inactive comparison sample, which is predicted to be a characteristic initial condition for triggering AGN. Our conclusions are summarized as follows.
-
(i)
We successfully detected the CO(2–1) emission from all quasars, which show diverse morphology (spiral-arm-like feature, bar-like feature, disk-like feature) in their spatial distributions. The bulk of the line emission we recovered originates from their innermost a few kpc regions. The line emission at the nucleus is brighter in the comparison sample than in the quasar sample in three of the four pairs.
-
(ii)
The line profile of the quasar sample is clearly broader than the matched comparison sample. Note that, however, we cannot provide a detailed investigation of the line profiles of the quasar sample (including the search for molecular outflows) given the modest S/N ratios. We also found that two quasars (PG1149110 and likely PG1126041) show double-horn like line profiles, which are interpreted as indications of rotating disks.
-
(iii)
The total molecular gas mass surface density () computed from the CO(2–1) line luminosity is accordingly higher in the comparison sample than in the quasar sample at the central sub-kpc regions, in three of the four pairs. Hence, there seems to be no systematic enhancement in in our quasars. This is inconsistent with our initial expectation that is higher in quasars than in comparison galaxies.
-
(iv)
We discussed four possible explanations for the smaller CO(2–1)-based in the quasar sample, i.e., AGN-driven outflows, gas-rich minor mergers, time-delay between the onsets of a starburst-phase and a quasar-phase, as well as X-ray-dominated region (XDR) effects on the gas chemical abundance and excitation. Although all of these may potentially contribute to the observed low in our quasar sample, we stress the importance of the XDR effects, as we started to probe the CND-scale molecular gas of luminous quasars thanks to the high resolution and sensitivity of ALMA.
The time-delay we discussed in § 4 will wash out a causality between circumnuclear properties and on-going quasar activities. Hence it is desirable to perform a test, similar to that carried out here, for AGNs in a much younger phase that may maintain the initial conditions to ignite the AGN. As for the XDR, as the actual level of the effects depends on the prevalent physical and chemical conditions of the CND-scale gas, further observations of other transition CO lines as well as other species sensitive to the XDR effects (e.g., atomic carbon line, Meijerink & Spaans, 2005; Izumi et al., 2018) are required to obtain a firm conclusion on the importance of CND-scale gas as a fuel reservoir for SMBHs. In addition, for a given , the gas inflow rate will increase with higher stellar mass surface density () due to stronger torques imposed (e.g., Hopkins & Quataert, 2010; Anglés-Alcázar et al., 2017). The high is also claimed to trigger nuclear fuelings (Romeo & Fathi, 2016). In future we thus need high resolution stellar mass maps of both quasars and inactive galaxies to measure and then construct a better matched sample controlled also by . This will be possible after the launch of the James Webb Space Telescope (JWST).
References
- Aalto et al. (2012) Aalto, S., Garcia-Burillo, S., Muller, S., et al. 2012, A&A, 537, A44, doi: 10.1051/0004-6361/201117919
- Anglés-Alcázar et al. (2017) Anglés-Alcázar, D., Faucher-Giguère, C.-A., Quataert, E., et al. 2017, MNRAS, 472, L109, doi: 10.1093/mnrasl/slx161
- Antonucci (1993) Antonucci, R. 1993, ARA&A, 31, 473, doi: 10.1146/annurev.aa.31.090193.002353
- Balbus & Hawley (1998) Balbus, S. A., & Hawley, J. F. 1998, Reviews of Modern Physics, 70, 1, doi: 10.1103/RevModPhys.70.1
- Bayet et al. (2004) Bayet, E., Gerin, M., Phillips, T. G., & Contursi, A. 2004, A&A, 427, 45, doi: 10.1051/0004-6361:20035614
- Bergvall et al. (2016) Bergvall, N., Marquart, T., Way, M. J., et al. 2016, A&A, 587, A72, doi: 10.1051/0004-6361/201525692
- Bertram et al. (2007) Bertram, T., Eckart, A., Fischer, S., et al. 2007, A&A, 470, 571, doi: 10.1051/0004-6361:20077578
- Bischetti et al. (2019) Bischetti, M., Maiolino, R., Carniani, S., et al. 2019, A&A, 630, A59, doi: 10.1051/0004-6361/201833557
- Bolatto et al. (2013) Bolatto, A. D., Wolfire, M., & Leroy, A. K. 2013, ARA&A, 51, 207, doi: 10.1146/annurev-astro-082812-140944
- Brinchmann et al. (2004) Brinchmann, J., Charlot, S., White, S. D. M., et al. 2004, MNRAS, 351, 1151, doi: 10.1111/j.1365-2966.2004.07881.x
- Carilli & Walter (2013) Carilli, C. L., & Walter, F. 2013, ARA&A, 51, 105, doi: 10.1146/annurev-astro-082812-140953
- Cen (2015) Cen, R. 2015, ApJ, 805, L9, doi: 10.1088/2041-8205/805/1/L9
- Cicone et al. (2014) Cicone, C., Maiolino, R., Sturm, E., et al. 2014, A&A, 562, A21, doi: 10.1051/0004-6361/201322464
- Cisternas et al. (2011) Cisternas, M., Jahnke, K., Inskip, K. J., et al. 2011, ApJ, 726, 57, doi: 10.1088/0004-637X/726/2/57
- Cluver et al. (2017) Cluver, M. E., Jarrett, T. H., Dale, D. A., et al. 2017, ApJ, 850, 68, doi: 10.3847/1538-4357/aa92c7
- Davies et al. (2007) Davies, R. I., Müller Sánchez, F., Genzel, R., et al. 2007, ApJ, 671, 1388, doi: 10.1086/523032
- Di Matteo et al. (2005) Di Matteo, T., Springel, V., & Hernquist, L. 2005, Nature, 433, 604, doi: 10.1038/nature03335
- Diamond-Stanic & Rieke (2012) Diamond-Stanic, A. M., & Rieke, G. H. 2012, ApJ, 746, 168, doi: 10.1088/0004-637X/746/2/168
- Eisenstein et al. (2011) Eisenstein, D. J., Weinberg, D. H., Agol, E., et al. 2011, AJ, 142, 72, doi: 10.1088/0004-6256/142/3/72
- Elbaz et al. (2007) Elbaz, D., Daddi, E., Le Borgne, D., et al. 2007, A&A, 468, 33, doi: 10.1051/0004-6361:20077525
- Ellison et al. (2011) Ellison, S. L., Patton, D. R., Mendel, J. T., & Scudder, J. M. 2011, MNRAS, 418, 2043, doi: 10.1111/j.1365-2966.2011.19624.x
- Esquej et al. (2014) Esquej, P., Alonso-Herrero, A., González-Martín, O., et al. 2014, ApJ, 780, 86, doi: 10.1088/0004-637X/780/1/86
- Evans et al. (2001) Evans, A. S., Frayer, D. T., Surace, J. A., & Sand ers, D. B. 2001, AJ, 121, 1893, doi: 10.1086/319972
- Evans et al. (2006) Evans, A. S., Solomon, P. M., Tacconi, L. J., Vavilkin, T., & Downes, D. 2006, AJ, 132, 2398, doi: 10.1086/508416
- Gabor & Bournaud (2014) Gabor, J. M., & Bournaud, F. 2014, MNRAS, 441, 1615, doi: 10.1093/mnras/stu677
- García-Burillo et al. (2014) García-Burillo, S., Combes, F., Usero, A., et al. 2014, A&A, 567, A125, doi: 10.1051/0004-6361/201423843
- Goulding et al. (2018) Goulding, A. D., Greene, J. E., Bezanson, R., et al. 2018, PASJ, 70, S37, doi: 10.1093/pasj/psx135
- Greene et al. (2012) Greene, J. E., Zakamska, N. L., & Smith, P. S. 2012, ApJ, 746, 86, doi: 10.1088/0004-637X/746/1/86
- Hernquist (1989) Hernquist, L. 1989, Nature, 340, 687, doi: 10.1038/340687a0
- Hollenbach & Tielens (1997) Hollenbach, D. J., & Tielens, A. G. G. M. 1997, ARA&A, 35, 179, doi: 10.1146/annurev.astro.35.1.179
- Hopkins (2012) Hopkins, P. F. 2012, MNRAS, 420, L8, doi: 10.1111/j.1745-3933.2011.01179.x
- Hopkins & Hernquist (2006) Hopkins, P. F., & Hernquist, L. 2006, ApJS, 166, 1, doi: 10.1086/505753
- Hopkins et al. (2006) Hopkins, P. F., Hernquist, L., Cox, T. J., et al. 2006, ApJS, 163, 1, doi: 10.1086/499298
- Hopkins et al. (2008) Hopkins, P. F., Hernquist, L., Cox, T. J., & Kereš, D. 2008, ApJS, 175, 356, doi: 10.1086/524362
- Hopkins & Quataert (2010) Hopkins, P. F., & Quataert, E. 2010, MNRAS, 407, 1529, doi: 10.1111/j.1365-2966.2010.17064.x
- Hopkins et al. (2016) Hopkins, P. F., Torrey, P., Faucher-Giguère, C.-A., Quataert, E., & Murray, N. 2016, MNRAS, 458, 816, doi: 10.1093/mnras/stw289
- Husemann et al. (2017) Husemann, B., Davis, T. A., Jahnke, K., et al. 2017, MNRAS, 470, 1570, doi: 10.1093/mnras/stx1123
- Imanishi et al. (2007) Imanishi, M., Dudley, C. C., Maiolino, R., et al. 2007, ApJS, 171, 72, doi: 10.1086/513715
- Izumi et al. (2016a) Izumi, T., Kawakatu, N., & Kohno, K. 2016a, ApJ, 827, 81, doi: 10.3847/0004-637X/827/1/81
- Izumi et al. (2018) Izumi, T., Wada, K., Fukushige, R., Hamamura, S., & Kohno, K. 2018, ApJ, 867, 48, doi: 10.3847/1538-4357/aae20b
- Izumi et al. (2013) Izumi, T., Kohno, K., Martín, S., et al. 2013, PASJ, 65, 100, doi: 10.1093/pasj/65.5.100
- Izumi et al. (2015) Izumi, T., Kohno, K., Aalto, S., et al. 2015, ApJ, 811, 39, doi: 10.1088/0004-637X/811/1/39
- Izumi et al. (2016b) —. 2016b, ApJ, 818, 42, doi: 10.3847/0004-637X/818/1/42
- Jarrett et al. (2011) Jarrett, T. H., Cohen, M., Masci, F., et al. 2011, ApJ, 735, 112, doi: 10.1088/0004-637X/735/2/112
- Kakkad et al. (2017) Kakkad, D., Mainieri, V., Brusa, M., et al. 2017, MNRAS, 468, 4205, doi: 10.1093/mnras/stx726
- Kauffmann et al. (2003) Kauffmann, G., Heckman, T. M., White, S. D. M., et al. 2003, MNRAS, 341, 33, doi: 10.1046/j.1365-8711.2003.06291.x
- Kaviraj (2014) Kaviraj, S. 2014, MNRAS, 440, 2944, doi: 10.1093/mnras/stu338
- Kawaguchi et al. (2004) Kawaguchi, T., Aoki, K., Ohta, K., & Collin, S. 2004, A&A, 420, L23, doi: 10.1051/0004-6361:20040157
- Kennicutt & Evans (2012) Kennicutt, R. C., & Evans, N. J. 2012, ARA&A, 50, 531, doi: 10.1146/annurev-astro-081811-125610
- King & Pounds (2015) King, A., & Pounds, K. 2015, ARA&A, 53, 115, doi: 10.1146/annurev-astro-082214-122316
- Kocevski et al. (2012) Kocevski, D. D., Faber, S. M., Mozena, M., et al. 2012, ApJ, 744, 148, doi: 10.1088/0004-637X/744/2/148
- Kormendy & Ho (2013) Kormendy, J., & Ho, L. C. 2013, ARA&A, 51, 511, doi: 10.1146/annurev-astro-082708-101811
- Kormendy & Kennicutt (2004) Kormendy, J., & Kennicutt, Robert C., J. 2004, ARA&A, 42, 603, doi: 10.1146/annurev.astro.42.053102.134024
- Koss et al. (2018) Koss, M. J., Blecha, L., Bernhard, P., et al. 2018, Nature, 563, 214, doi: 10.1038/s41586-018-0652-7
- Leroy et al. (2008) Leroy, A. K., Walter, F., Brinks, E., et al. 2008, AJ, 136, 2782, doi: 10.1088/0004-6256/136/6/2782
- Leroy et al. (2013) Leroy, A. K., Walter, F., Sandstrom, K., et al. 2013, AJ, 146, 19, doi: 10.1088/0004-6256/146/2/19
- Lynden-Bell & Rees (1971) Lynden-Bell, D., & Rees, M. J. 1971, MNRAS, 152, 461, doi: 10.1093/mnras/152.4.461
- Maiolino et al. (2012) Maiolino, R., Gallerani, S., Neri, R., et al. 2012, MNRAS, 425, L66, doi: 10.1111/j.1745-3933.2012.01303.x
- Maloney et al. (1996) Maloney, P. R., Hollenbach, D. J., & Tielens, A. G. G. M. 1996, ApJ, 466, 561, doi: 10.1086/177532
- Marin (2014) Marin, F. 2014, MNRAS, 441, 551, doi: 10.1093/mnras/stu593
- Mashian et al. (2015) Mashian, N., Sturm, E., Sternberg, A., et al. 2015, ApJ, 802, 81, doi: 10.1088/0004-637X/802/2/81
- McMullin et al. (2007) McMullin, J. P., Waters, B., Schiebel, D., Young, W., & Golap, K. 2007, Astronomical Society of the Pacific Conference Series, Vol. 376, CASA Architecture and Applications, ed. R. A. Shaw, F. Hill, & D. J. Bell (San Francisco, CA: ASP), 127
- Mechtley et al. (2016) Mechtley, M., Jahnke, K., Windhorst, R. A., et al. 2016, ApJ, 830, 156, doi: 10.3847/0004-637X/830/2/156
- Meijerink & Spaans (2005) Meijerink, R., & Spaans, M. 2005, A&A, 436, 397, doi: 10.1051/0004-6361:20042398
- Mihos & Hernquist (1994) Mihos, J. C., & Hernquist, L. 1994, ApJ, 425, L13, doi: 10.1086/187299
- Mizumoto et al. (2019) Mizumoto, M., Izumi, T., & Kohno, K. 2019, ApJ, 871, 156, doi: 10.3847/1538-4357/aaf814
- Morokuma-Matsui & Baba (2015) Morokuma-Matsui, K., & Baba, J. 2015, MNRAS, 454, 3792, doi: 10.1093/mnras/stv2227
- Murphy et al. (2011) Murphy, E. J., Condon, J. J., Schinnerer, E., et al. 2011, ApJ, 737, 67, doi: 10.1088/0004-637X/737/2/67
- Nesvadba et al. (2008) Nesvadba, N. P. H., Lehnert, M. D., De Breuck, C., Gilbert, A. M., & van Breugel, W. 2008, A&A, 491, 407, doi: 10.1051/0004-6361:200810346
- Netzer et al. (2007) Netzer, H., Lutz, D., Schweitzer, M., et al. 2007, ApJ, 666, 806, doi: 10.1086/520716
- Novak et al. (2011) Novak, G. S., Ostriker, J. P., & Ciotti, L. 2011, ApJ, 737, 26, doi: 10.1088/0004-637X/737/1/26
- Papadopoulos et al. (2012) Papadopoulos, P. P., van der Werf, P. P., Xilouris, E. M., et al. 2012, MNRAS, 426, 2601, doi: 10.1111/j.1365-2966.2012.21001.x
- Romeo & Fathi (2016) Romeo, A. B., & Fathi, K. 2016, MNRAS, 460, 2360, doi: 10.1093/mnras/stw1147
- Rosario et al. (2013) Rosario, D. J., Trakhtenbrot, B., Lutz, D., et al. 2013, A&A, 560, A72, doi: 10.1051/0004-6361/201322196
- Saintonge et al. (2017) Saintonge, A., Catinella, B., Tacconi, L. J., et al. 2017, ApJS, 233, 22, doi: 10.3847/1538-4365/aa97e0
- Saito et al. (2017) Saito, T., Iono, D., Xu, C. K., et al. 2017, ApJ, 835, 174, doi: 10.3847/1538-4357/835/2/174
- Sanders & Mirabel (1996) Sanders, D. B., & Mirabel, I. F. 1996, ARA&A, 34, 749, doi: 10.1146/annurev.astro.34.1.749
- Sandstrom et al. (2013) Sandstrom, K. M., Leroy, A. K., Walter, F., et al. 2013, ApJ, 777, 5, doi: 10.1088/0004-637X/777/1/5
- Sault et al. (1995) Sault, R. J., Teuben, P. J., & Wright, M. C. H. 1995, Astronomical Society of the Pacific Conference Series, Vol. 77, A Retrospective View of MIRIAD, ed. R. A. Shaw, H. E. Payne, & J. J. E. Hayes (San Francisco, CA: ASP), 433
- Schawinski et al. (2010) Schawinski, K., Dowlin, N., Thomas, D., Urry, C. M., & Edmondson, E. 2010, ApJ, 714, L108, doi: 10.1088/2041-8205/714/1/L108
- Schawinski et al. (2015) Schawinski, K., Koss, M., Berney, S., & Sartori, L. F. 2015, MNRAS, 451, 2517, doi: 10.1093/mnras/stv1136
- Schawinski et al. (2012) Schawinski, K., Simmons, B. D., Urry, C. M., Treister, E., & Glikman, E. 2012, MNRAS, 425, L61, doi: 10.1111/j.1745-3933.2012.01302.x
- Schleicher et al. (2010) Schleicher, D. R. G., Spaans, M., & Klessen, R. S. 2010, A&A, 513, A7, doi: 10.1051/0004-6361/200913467
- Schmidt & Green (1983) Schmidt, M., & Green, R. F. 1983, ApJ, 269, 352, doi: 10.1086/161048
- Schmidt et al. (2017) Schmidt, T. M., Worseck, G., Hennawi, J. F., Prochaska, J. X., & Crighton, N. H. M. 2017, ApJ, 847, 81, doi: 10.3847/1538-4357/aa83ac
- Schulze & Wisotzki (2010) Schulze, A., & Wisotzki, L. 2010, A&A, 516, A87, doi: 10.1051/0004-6361/201014193
- Schulze et al. (2009) Schulze, A., Wisotzki, L., & Husemann, B. 2009, A&A, 507, 781, doi: 10.1051/0004-6361/200912730
- Scoville et al. (2003) Scoville, N. Z., Frayer, D. T., Schinnerer, E., & Christopher, M. 2003, ApJ, 585, L105, doi: 10.1086/374544
- Shangguan et al. (2020) Shangguan, J., Ho, L. C., Bauer, F. E., Wang, R., & Treister, E. 2020, ApJS, 247, 15, doi: 10.3847/1538-4365/ab5db2
- Shankar et al. (2009) Shankar, F., Weinberg, D. H., & Miralda-Escudé, J. 2009, ApJ, 690, 20, doi: 10.1088/0004-637X/690/1/20
- Shlosman et al. (1990) Shlosman, I., Begelman, M. C., & Frank, J. 1990, Nature, 345, 679, doi: 10.1038/345679a0
- Silverman et al. (2011) Silverman, J. D., Kampczyk, P., Jahnke, K., et al. 2011, ApJ, 743, 2, doi: 10.1088/0004-637X/743/1/2
- Solomon & Vanden Bout (2005) Solomon, P. M., & Vanden Bout, P. A. 2005, ARA&A, 43, 677, doi: 10.1146/annurev.astro.43.051804.102221
- Stern et al. (2012) Stern, D., Assef, R. J., Benford, D. J., et al. 2012, ApJ, 753, 30, doi: 10.1088/0004-637X/753/1/30
- Tanaka et al. (2017) Tanaka, I., Yagi, M., & Taniguchi, Y. 2017, PASJ, 69, 90, doi: 10.1093/pasj/psx100
- Taniguchi (1999) Taniguchi, Y. 1999, ApJ, 524, 65, doi: 10.1086/307814
- Taniguchi & Wada (1996) Taniguchi, Y., & Wada, K. 1996, ApJ, 469, 581, doi: 10.1086/177807
- Urrutia et al. (2008) Urrutia, T., Lacy, M., & Becker, R. H. 2008, ApJ, 674, 80, doi: 10.1086/523959
- van der Tak et al. (2007) van der Tak, F. F. S., Black, J. H., Schöier, F. L., Jansen, D. J., & van Dishoeck, E. F. 2007, A&A, 468, 627, doi: 10.1051/0004-6361:20066820
- Vestergaard & Peterson (2006) Vestergaard, M., & Peterson, B. M. 2006, ApJ, 641, 689, doi: 10.1086/500572
- Viti et al. (2014) Viti, S., García-Burillo, S., Fuente, A., et al. 2014, A&A, 570, A28, doi: 10.1051/0004-6361/201424116
- Wada et al. (2018) Wada, K., Fukushige, R., Izumi, T., & Tomisaka, K. 2018, ApJ, 852, 88, doi: 10.3847/1538-4357/aa9e53
- Wild et al. (2010) Wild, V., Heckman, T., & Charlot, S. 2010, MNRAS, 405, 933, doi: 10.1111/j.1365-2966.2010.16536.x
- Wisotzki et al. (2000) Wisotzki, L., Christlieb, N., Bade, N., et al. 2000, A&A, 358, 77. https://arxiv.org/abs/astro-ph/0004162
- Wright et al. (2010) Wright, E. L., Eisenhardt, P. R. M., Mainzer, A. K., et al. 2010, AJ, 140, 1868, doi: 10.1088/0004-6256/140/6/1868
Appendix A Properties of one quasar-galaxy pair excluded from our test
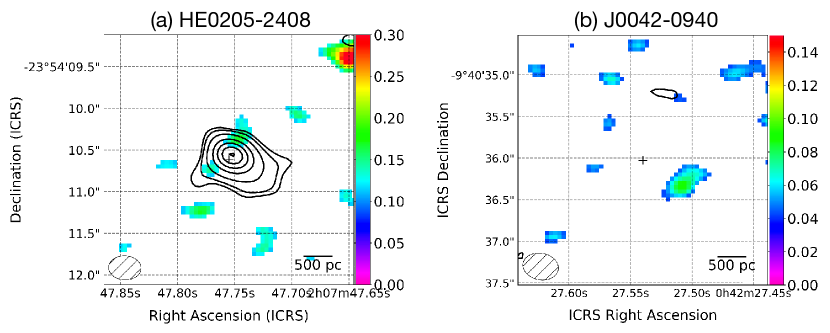
We excluded one quasar HE02052408 and a galaxy J00420940, which were initially paired (Table 4). The reason for this exclusion is the mismatched SFR: the MPA-JHU galaxy catalog shows that the galaxy J00420940 has when it is measured over the galaxy-scale, which is comparable to the SFR estimated for the quasar HE02052408. However, the SFR of J00420940 measured with a 3 fiber aperture is only , which is orders of magnitude smaller than that estimated at the galaxy-scale. The WISE photometry (§ 3.2) also indicates that ( band magnitude = 12.7 mag). Hence, we suppose that there is an unexpected error in the SFR estimation at the galaxy-scale, and the very small SFR measured with the fiber aperture is the correct one for this galaxy. Since HE02052408 and J00420940 do not compose a well-matched pair any more, we excluded this pair from our discussion.
We observed these objects with ALMA and analyzed the data in the same manner as described in § 2. The obtained synthesized beam sizes for the CO(2–1) cube and the continuum image are, (P.A. = 87.7∘) and (P.A. = 86.6∘) for HE02052408 and (P.A. = 79.3∘) and (P.A. = 79.4∘) for J00420940, respectively. With the natural weighting, we obtained 1 sensitivity of 0.30 mJy beam-1 ( km s-1) and 0.20 mJy beam-1 ( km s-1) for the CO(2–1) cubes of HE02052408 and J00420940, respectively. The CO(2–1) emission was undetected in both objects (Figure 8): the corresponding 3 upper limits are 0.33 Jy km s-1 (integrated velocity width = 700 km s-1) and 0.07 Jy km s-1 (integrated velocity width = 450 km s-1), both of which are measured at the central 700 pc region. On the other hand, we detected the continuum emission significantly in HE02052408 (1 = 52 Jy beam-1; max = 2.63 mJy beam-1), while it is not detected in J00420940 (1 = 20 Jy beam-1). Given the deficit of molecular gas around the nucleus, we consider that the bulk of this continuum emission of HE02052408 to be of non-thermal origin.
| Name | R.A. | Decl. | Scale | log () | log () | log () | log () | |||
|---|---|---|---|---|---|---|---|---|---|---|
| (ICRS) | (ICRS) | (kpc/) | ||||||||
| HE02052408 | 02:07:47.755 | 23:54:10.62 | 0.076 | 1.44 | 8.33 | 45.6 | 10.69 | 1.25 | ||
| J00420940 | 00:42:27.540 | 09:40:36.25 | 0.077 | 1.46 | - | - | 10.75 |