Optical control of valley Zeeman effect through many-exciton interactions
†These authors contributed equally to this work.
∗Correspondence to: ajit.srivastava@emory.edu
Charge carriers in two-dimensional transition metal dichalcogenides (TMDs), such as WSe2, have their spin and valley-pseudospin locked into an optically-addressable index that is proposed as a basis for future information processing. The manipulation of this spin-valley index requires tuning its energy, typically through external magnetic field (), which is cumbersome. Thus, other efficient routes like all-optical control of spin-valley index are desirable. Here, we show that many-body interactions amongst interlayer excitons in WSe2/MoSe2 heterobilayer induce a steady-state valley Zeeman splitting corresponding to 6 Tesla. This anomalous splitting, present at incident powers as low as Ws, increases with power and enhances, suppresses or even flips the sign of a -induced splitting. Moreover, the -factor of valley Zeeman splitting can be tuned by 30% with incident power. In addition to valleytronics, our results are relevant for achieving optical non-reciprocity using two-dimensional materials.
The underlying honeycomb-lattice of group VIB semiconducting TMDs results in low-energy charge carriers possessing chirality which can be labeled by a pair of pseudospin indices, and identified with momentum-space -valleys. Consequently, circularly polarized light of a given helicity selectively couples to the valley with the corresponding chirality, as is observed in optical absorption or emission measurements MakNNano2012 ; ZengNNano2012 ; CaoNComm2012 . Moreover, much as electron’s spin, the valley-pseudospins are necessarily degenerate in the presence of time-reversal symmetry (TRS) and carry equal and opposite magnetic moments XiaoPRL2007 ; XiaoPRL2012 . An out-of-plane , couples to the valley magnetic moment and lifts the degeneracy of the valleys. This magnetic control of valley-pseudospin, through valley Zeeman effect, has been well-established in monolayer SrivastavaNPhys2015 ; AivazianNPhys2015 ; LiPRL2014 ; MacNeillPRL2015 ; Wang2DMaterials2015 ; StierNatComm2016 ; LyonsNatComm2019 and heterobilayer (hBL) TMDs NaglerNComm2017 ; WangNL2019 ; CiarrocchiNP2019 . Even in the absence of an external , an effective acting on the valleys can arise, for example, from a valley-contrasting optical Stark effect wherein a strong circular excitation, with photon energy typically below the absorption threshold, effectively breaks TRS in the TMD sample and causes a valley-splitting KimScience2014 ; SieNMat2015 .
In two-dimensional semiconducting TMDs, strong Coulomb attraction between an optically generated electron-hole pair leads to the formation of a tightly bound exciton HePRL2014 ; ChernikovPRL2014 . The above-mentioned approaches for valley control are based on single-exciton effects which work by modifying the energies of the -valley excitons by the action of an external or effective . In contrast, a can also arise through many-particle interactions when there is an imbalance in the densities of the two spin species. In the mean field picture of Stoner model of magnetism, an exchange field, arising from exchange interactions, can be thought of as an effective that each particle experiences due to the presence of all the other particles and is proportional to the spin imbalance density BlundellMICM2003 . Whereas a valley-splitting by magnetic proximity effect has been observed SanchezNL2016 ; ZhaoNNano2017 ; SeylerNL2018 , it is natural to ask whether an optically tuneable valley control based on many-exciton interactions can be realized in TMDs to expand the toolkit of valleytronics. Furthermore, as a valley imbalance can be achieved by optical means, this approach can be implemented in a dynamic and efficient manner.
Here, we experimentally investigate interlayer excitons (IXs) in heterobilayer (hBL) of WSe2/MoSe2 to address this question. The type-II band alignment of this hBL results in IXs with electrons (holes) confined in Mo (W) layer, which have a permanent electric dipole with a fixed orientation in the out-of-plane direction CiarrocchiNP2019 ; LiNMat2020 ; KremserNPJ2D2020 . The exciton-exciton interaction amongst IXs can be approximated by two terms – a valley-independent dipolar repulsion term, , and a valley-dependent exchange interaction term, , which raises (lowers) the energy of a parallel (an antiparallel) alignment of spin-valley indices RiveraScience2016 ; LiNMat2020 ; KremserNPJ2D2020 . In a simple picture, we can understand the higher energy of the ferromagnetic alignment even in the presence of repulsive interactions due to the bosonic nature of excitons, unlike electrons.
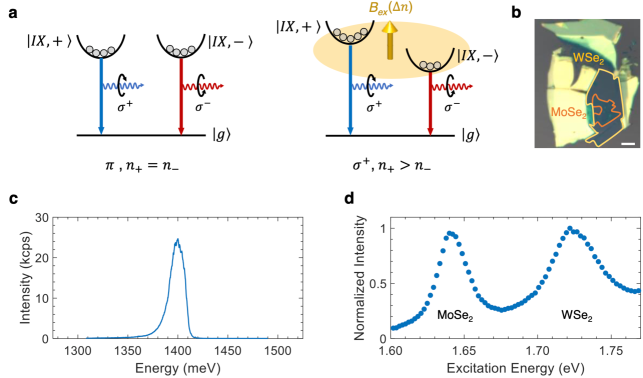
In a many-exciton scenario, results in a exciton density-dependent blue-shift LaikhtmanPRB2009 ; JaureguiScience2019 while results in an exchange-induced mean field () which depends on the imbalance, , in the exciton densities () at the two spins or valleys FernandezPRB1996 ; VinaPRB1996 ; AmandPRB1997 ; CiutiPRB1998 ; RiveraScience2016 . Fig. 1a demonstrates the basic idea behind our scheme based on IXs. When populations of excitons are the same, TRS is unbroken and the two valleys remain degenerate. For a finite , any given exciton experiences whose direction depends on the sign of such that its energy is raised (lowered) if it belongs to the valley with majority (minority) of excitons. In particular, the optically recombining excitons also experience and the resulting valley splitting can be measured in a helicity-resolved emission spectra.
Fig. 1b shows an optical microscope image of our fabricated heterostructure with monolayer MoSe2 on top of WSe2 with a very small twist angle between the two layers. Its photoluminescence (PL) spectrum at 4 K exhibits a peak at 1.40 eV (Fig. 1c), which is in the typical IX energy range NaglerNComm2017 ; WangNL2019 . The strong emission intensity with an integrated (peak) intensity exceeding 3400 kCounts/s (25 kCounts/s) at a low excitation power of 1 W, demonstrates the high quality of our sample (see Methods). In order to further confirm the interlayer nature of the peak, we conduct photoluminescence excitation (PLE) spectroscopy. The PLE spectrum shows two prominent resonances at 1.64 eV and 1.72 eV, corresponding to monolayer MoSe2 and WSe2 intralayer exciton states, as is expected for IX.
To optically create , one can exploit the valley-contrasting optical selection rules for circular absorption in TMDs XiaoPRL2012 ; RiveraScience2016 . By exciting with circularly polarized laser, say at the WSe2 exciton resonance, can be efficiently created first in the WSe2 layer which should then get transferred to the long-lived (ns) IX on a very short timescale ( 50 fs) HongNNano2014 ; ZhuNL2017 . The spin-valley locking and the quenching of contact-type electron-hole exchange interaction in IXs because of the spatial separation of electron and hole in different layers is expected to suppress any valley-mixing during the relaxation of intralayer exciton to IX. This, together with the long IX lifetime RiveraScience2016 ; TranNature2019 , should lead to an efficient generation of in the steady-state even at low excitation powers.
To test our claim about , we first need to confirm the generation of between and exciton densities, where denote the IXs in the -valleys. The imbalance can be characterized by the valley polarization or the degree of circular polarization (DCP) of PL, which is defined as , where () is the intensity of the co-polarized (cross-polarized) emission peak under circularly polarized excitation. As the DCP strongly depends on the excitation energy, we conduct PLE spectroscopy to decide the optimal excitation energy for generating valley imbalance. Fig. 2a shows that only excitation close to the WSe2 resonance (1.72 eV) can create large positive DCP, while MoSe2 resonance (1.64 eV) produces negligible DCP. This large positive DCP for WSe2 resonance indicates that IX is co-polarized with the excitation helicity i.e., co-polarized excitons have much higher density leading to a large imbalance between two valleys. Although in the monolayer case, WSe2 exciton shows a large valley polarization AivazianNPhys2015 while MoSe2 exciton can only have a small valley polarization WangAPL2015 , one expects that at resonant excitation the latter should also exhibit a finite DCP TornatzkyPRL2018 . The fact that IX emission hardly shows any DCP when excited at MoSe2 resonance possibly hints at substantial valley mixing during the relaxation from MoSe2 exciton to IX (see Supplementary section 1).
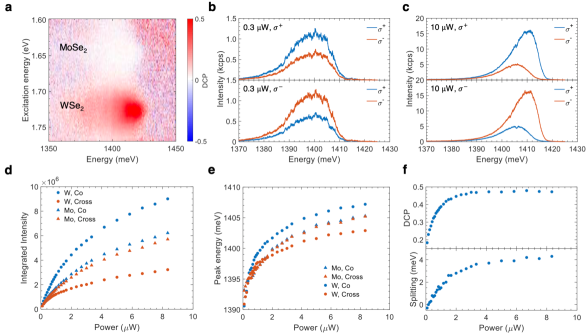
Next, we control by varying the intensity of circular excitation resonant with WSe2 exciton and perform helicity-resolved PL spectroscopy at low power (0.3 W, Fig. 2b) and high power (10 W, Fig. 2c) with a laser spot-size of 1 m. With () excitation, the () emission is more intense, highlighting the co-polarized behavior mentioned earlier. At low circular power, the co-polarized emission has the same energy as the cross-polarized one within the spectral resolution. On the other hand, at high circular power where a large is expected, the co-polarized emission blue-shifts compared to the cross-polarized peak, regardless of the helicity of the excitation laser. On the other hand, the PL spectra under linearly polarized excitation does not result in any splitting and falls in between the two circular excitation spectra (see Supplementary section 1). In other words, circular excitation effectively breaks TRS and leads to an anomalous valley splitting at zero external . The co-polarized emission with higher intensity has higher energy, consistent with the effect of shown in Fig. 1a. The zero-field splitting at a modest continuous-wave power of 10 W is 4.5 meV, which based on the IX -factor discussed below, is equivalent to a 6 Tesla.
Our observations should be contrasted with a recent report of zero- valley-splitting observed in a similar TMD hBL wherein the lower intensity, cross-polarized peak shifts to a higher energy and the splitting only decreases with increasing circular power JiangPRB2018 . Such a behavior is qualitatively different from our observations and inconsistent with exciton interactions induced valley-splitting but arises from an asymmetry in valley relaxation times of electrons and holes. On the other hand, our findings are similar to the helicity-induced Zeeman splitting of excitons in GaAs quantum wells which also originates from many-exciton interactions FernandezPRB1996 ; VinaPRB1996 ; AmandPRB1997 . However, unlike our case, the splitting lasts several picoseconds under pulsed laser excitation and is absent in steady-state. We also remark that a laser intensity as low as 100 W/cm2 is required to observe a valley-splitting of 1 meV in our scheme as opposed to GW/cm2 required to obtain a similar splitting using valley-contrasting optical Stark effect KimScience2014 ; SieNMat2015 .
We perform a systematic power dependence under circular excitation at both WSe2 and MoSe2 resonances. As the power increases, the integrated intensities increases and saturates (Fig. 2d) and peak energies are blue-shifted (Fig. 2e). The saturation of the total intensity with power possibly arises from exciton-exciton annihilation (see Supplementary section 2). The blueshift results from both Udd and Uex between IXs. We note that the integrated intensity for MoSe2 resonance are almost the same for the co- and cross-polarized emissions, and lie between the two WSe2 resonance branches (Fig. 2d). If we assume that the integrated intensity is proportional to the exciton density, we can conclude that exciting at MoSe2 resonance results in negligible valley imbalance even at higher powers. Indeed, this is consistent with the peak energies for MoSe2 resonance being the same for the co- and cross-polarized peaks and falling in between the diverging peak energies for WSe2 resonance (Fig. 2e). For WSe2 resonance, we convert the difference in the integrated intensities (peak energies) into DCP (splitting) as shown in Fig. 2f (see Supplementary section 3 for detailed excitation energy dependence). The DCP increases from 20% to 50% and saturates beyond 3 W, with a similar trend for the splitting which increases from 0 to 4.5 meV (see Supplementary section 4 for data on another IX). Using a theoretical model based on exciton-exciton interactions (see Supplementary section 5), the calculated splitting from peak shifts and DCP reproduce the experimental results fairly well, supporting the fact that the splitting arises from the imbalance between and . Assuming a binding energy, = 200 meV, and a Bohr radius, = 2 nm, we estimate that a splitting of 4 meV arises from a 3.3 1011 cm-2. This estimate agrees well for an incident power in the W range with an absorption of 10% at WSe2 resonance and IX lifetime ns (see Supplementary section 5). We extract the the strength of exciton-exciton interaction from our experiments to be 0.8 eV m2 which is about an order of magnitude larger than the previous studies on monolayer TMDs TanPRX2020 ; BackPRL2018 ; ScuriPRL2018 ; BarachatiNNano2018 and is comparable to GaAs quantum well excitons FernandezPRB1996 ; VinaPRB1996 ; AmandPRB1997 . Owing to their longer lifetime, a steady-state is efficiently created in TMD hBL as opposed to GaAs quantum wells.
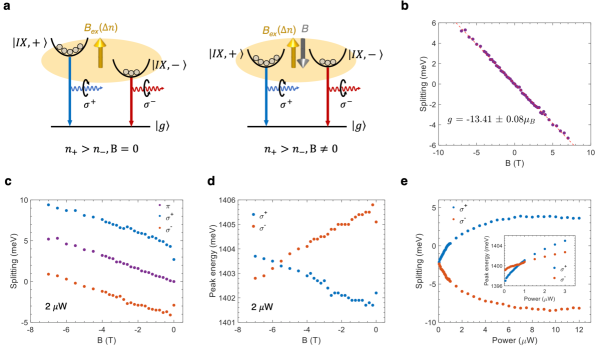
To further investigate the analogy between and an external , we perform magneto-PL spectroscopy. As shown in Fig. 3a, pumping induces the imbalance between and at = 0, and thus the energy of is higher than that of the . When an external is applied perpendicular to the sample ( 0), it shifts the energies of the two valleys in opposite directions by the valley Zeeman effect NaglerNComm2017 ; WangNL2019 ; CiarrocchiNP2019 . The shift direction depends on the out-of-plane direction, and thus one expects that an external can cancel in one direction and enhance it in the other. When the is cancelled, the and components have the same energy (Fig. 3a, right panel). To test this picture, we first characterize the Landé -factor of our hBL by measuring the valley Zeeman effect under linearly polarized excitation. As shown in Fig. 3b, we measure a -factor of -13.41, suggesting that the sample is stacked with a twist angle 60∘ NaglerNComm2017 .
Next, we measure the -dependence of the splitting () which is the difference in the peak energies () of the -components of the PL, under excitation. The excitation power is chosen to be 2 W so as to avoid any effects of power saturation. Figure 3c shows that for () excitation the magnitude of splitting increases (decreases) from 0 to -6 T. Thus, the generated by () excitation acts in concert (opposition) with the negative . We note that the “dip” in the splitting near 0 T is reminiscent of a similar behavior in DCP of long-lived excitons in TMDs under tiny SmolenskiPRX2016 ; JiangNComm2018 (see also Supplementary section 6 for dip-behavior in DCP data). As it is not the main focus of this study, in the following we choose to focus on -dependence away from this dip. From Fig. 3d we find that the effect of anomalous splitting at zero field is completely cancelled by the external -6 T for excitation and the energies of and are flipped beyond -6 T (Fig. 3d). Remarkably, the ability to optically undo the effect of up to 6 T with continuous-wave power of W is attractive for spin-valley control, which has not been previously observed JiangPRB2018 ; FernandezPRB1996 ; VinaPRB1996 ; AmandPRB1997 .
Another evidence for the equivalence between and external is shown in Fig. 3e where we fix the external at +3 T and vary the circular excitation power. At very low powers, is negligible and the splitting of -2.3 meV is the same as the linear Zeeman splitting at +3 T in Fig. 3b. When the power increases, the excitation cancels the external at 0.8 W. The inset of Fig. 3e clearly shows that a flip in the energies of the two valleys at a positive is caused by excitation. Thus, we can conclude that () excitation results in acting as negative (positive) external and that the and the external are analogous as far as the splitting is concerned. Thus, our scheme shows that an external which is slow and cumbersome to change, can be modulated with very low optical powers on a timescale of tens of nanoseconds.
From Fig. 3c, it appears that the splitting under excitation is merely shifted from the linear Zeeman splitting by 4 meV, such that the -factor is independent of the helicity of excitation. We can then ask the question whether the and the external act together in a linear fashion even at higher powers, i.e., whether the total splitting, in the presence of circular excitation and , is simply a sum of zero-field splitting and the valley Zeeman splitting for linearly polarized excitation. To answer this question, we first study the dependence at low circular power of 1 W. As shown in the Fig. 4a, at -7 T, the expected spectra (dashed lines), assuming a linear behavior obtained by shifting the 0.1 T data, to avoid the dip-behavior, by the corresponding linearly-polarized Zeeman splitting, matches very well with measured spectra (solid lines). Therefore, we can conclude that there is negligible nonlinear behavior in the splitting at low powers. On the other hand, as shown in Fig. 4b, at higher circular power (7.6 W), the expected spectra at -7 T and the measured spectra have a small but systematic difference. We find that () excitation which should reduce (enhance) the splitting, reduces (enhances) the splitting more than expected, implying a larger magnitude of . When the external is flipped, a similar behavior is seen with the roles of interchanged.
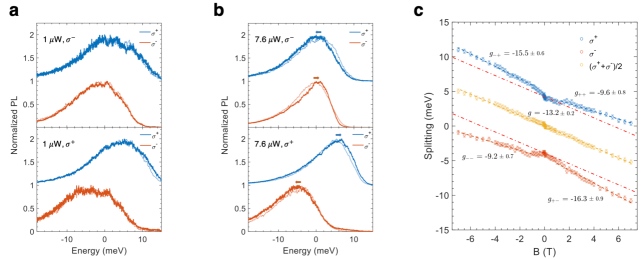
To understand this nonlinear behavior further, we perform a systematic -dependence and find that it leads to a helicity control of the bare -factor (Fig. 4c). In particular, linear fitting of the -dependence at 7.6 W, away from the dip behavior near 0 T, gives a larger -factor for excitation under negative ( = -15.5) and excitation under positive ( = -16.3). On the contrary, the factors of excitation under negative ( = -9.2) and excitation under positive ( = -9.6) are smaller. We note that even with the observed nonlinear behavior at higher circular power, the concept of a -factor or linear-in- splitting remains valid up to at least 7 T. This behavior can be empirically captured by assuming that the magnitude of increases linearly with (see Supplementary section 7). Moreover, this increase in results from a corresponding increase in . We make this conclusion by comparing the -dependence of imbalance in emission intensities of the two helicities with that of the splitting. In other words, for a fixed, large incident circular power, increasing creates a larger (see Supplementary section 7). As the WSe2 resonance shifts in only by 1 meV (see Supplementary section 7) while the PLE resonance is much broader (Fig. 1d), we rule out the possibility that this shift is responsible for the B-dependence of . Moreover, as we excite on the WSe2 resonance, even at 0 T, a large valley-imbalance between the initially created WSe2 excitons is expected, which is unlikely to increase much more in . Therefore, a possible explanation for this behavior could be that the valley-mixing processes during the relaxation of intralayer exciton to IX are suppressed with increasing and at higher circular powers. With a lower depolarization rate at a higher , the imbalance increases, so does , and thus induces a larger enhancement or cancellation of the splitting seen in Fig. 4b.
In conclusion, we have demonstrated an optical generation of exchange field in hBLs of semiconducting TMDs under steady-state condition. This effective magnetic field, arising from many-exciton interactions and essential for the control of the valley-pseudospin, can be dynamically tuned up to several Tesla. A combination of strong Coulomb interactions and characteristic optical properties of interlayer excitons in type-II hBL is responsible for the efficient generation of exchange field with very low continuous-wave incident powers (W) compared to previous schemes. In addition to valley-pseudospin control, our findings of TRS breaking in TMDs could lead to the engineering of gyrotropic medium in an energy-efficient manner for optical non-reciprocity ShiNP2015 . On a fundamental side, our experiments should motivate the exploration of strongly interacting quantum phases of light and matter under driven-dissipative conditions BarachatiNNano2018 . In particular, recent reports of exciton condensation and optical spectroscopy of strongly correlated electronic phases in moiré heterostructures of TMDs have garnered much attention WangNature2019 ; TangNature2020 ; ReganNature2020 ; ShimazakiNature2020 . In light of this, our results on many-body physics of excitons, focusing on the valley-pseudospin, make a strong case for investigating quantum magnetism in this rich materials platform.
Acknowledgments We acknowledge many enlightening discussions with Ataç Imamoğlu. A. S. acknowledges support from NSF through the EFRI program-grant # EFMA-1741691 and NSF DMR award # 1905809.
Author Contributions † W. L., X. L., J. W contributed equally to this work. A. S., W. L., X. L. conceived the project. W. L., X. L., J. W. carried out the measurements. J. W. prepared the samples. A. S. supervised the project. All authors were involved in analysis of the experimental data and contributed extensively to this work.
Competing interests The authors declare no competing interests.
References
- (1) Mak, K. F., He, K., Shan, J. & Heinz, T. F. Control of valley polarization in monolayer mos2 by optical helicity. Nat Nano 7, 494–498 (2012). URL http://dx.doi.org/10.1038/nnano.2012.96.
- (2) Zeng, H., Dai, J., Yao, W., Xiao, D. & Cui, X. Valley polarization in mos2 monolayers by optical pumping. Nat Nano 7, 490–493 (2012). URL http://dx.doi.org/10.1038/nnano.2012.95.
- (3) Cao, T. et al. Valley-selective circular dichroism of monolayer molybdenum disulphide. Nat Commun 3, 887 (2012). URL http://dx.doi.org/10.1038/ncomms1882.
- (4) Xiao, D., Yao, W. & Niu, Q. Valley-contrasting physics in graphene: Magnetic moment and topological transport. Phys. Rev. Lett. 99, 236809 (2007). URL http://link.aps.org/doi/10.1103/PhysRevLett.99.236809.
- (5) Xiao, D., Liu, G.-B., Feng, W., Xu, X. & Yao, W. Coupled spin and valley physics in monolayers of and other group-vi dichalcogenides. Phys. Rev. Lett. 108, 196802 (2012). URL http://link.aps.org/doi/10.1103/PhysRevLett.108.196802.
- (6) Srivastava, A. et al. Valley zeeman effect in elementary optical excitations of monolayer wse2. Nat Phys 11, 141–147 (2015). URL http://dx.doi.org/10.1038/nphys3203.
- (7) Aivazian, G. et al. Magnetic control of valley pseudospin in monolayer wse2. Nat Phys 11, 148–152 (2015). URL http://dx.doi.org/10.1038/nphys3201.
- (8) Li, Y. et al. Valley splitting and polarization by the zeeman effect in monolayer . Phys. Rev. Lett. 113, 266804 (2014). URL http://link.aps.org/doi/10.1103/PhysRevLett.113.266804.
- (9) MacNeill, D. et al. Breaking of valley degeneracy by magnetic field in monolayer . Phys. Rev. Lett. 114, 037401 (2015). URL http://link.aps.org/doi/10.1103/PhysRevLett.114.037401.
- (10) Wang, G. et al. Magneto-optics in transition metal diselenide monolayers. 2D Materials 2, 034002 (2015).
- (11) Stier, A. V., McCreary, K. M., Jonker, B. T., Kono, J. & Crooker, S. A. Exciton diamagnetic shifts and valley zeeman effects in monolayer ws2 and mos2 to 65 tesla. Nature Communications 7, 10643 (2016). URL https://doi.org/10.1038/ncomms10643.
- (12) Lyons, T. P. et al. The valley zeeman effect in inter- and intra-valley trions in monolayer wse2. Nature Communications 10, 2330 (2019). URL https://doi.org/10.1038/s41467-019-10228-7.
- (13) Nagler, P. et al. Giant magnetic splitting inducing near-unity valley polarization in van der waals heterostructures. Nature Communications 8, 1551 (2017). URL https://doi.org/10.1038/s41467-017-01748-1.
- (14) Wang, T. et al. Giant valley-zeeman splitting from spin-singlet and spin-triplet interlayer excitons in wse2/mose2 heterostructure. Nano Letters (2019).
- (15) Ciarrocchi, A. et al. Polarization switching and electrical control of interlayer excitons in two-dimensional van der waals heterostructures. Nature photonics 13, 131–136 (2019).
- (16) Kim, J. et al. Ultrafast generation of pseudo-magnetic field for valley excitons in wse2 monolayers. Science 346, 1205–1208 (2014). URL http://science.sciencemag.org/content/346/6214/1205. eprint http://science.sciencemag.org/content/346/6214/1205.full.pdf.
- (17) Sie, E. J. et al. Valley-selective optical stark effect in monolayer ws2. Nat Mater 14, 290–294 (2015). URL http://dx.doi.org/10.1038/nmat4156.
- (18) He, K. et al. Tightly bound excitons in monolayer . Phys. Rev. Lett. 113, 026803 (2014). URL http://link.aps.org/doi/10.1103/PhysRevLett.113.026803.
- (19) Chernikov, A. et al. Exciton binding energy and nonhydrogenic rydberg series in monolayer . Phys. Rev. Lett. 113, 076802 (2014). URL http://link.aps.org/doi/10.1103/PhysRevLett.113.076802.
- (20) Blundell, S. Magnetism in condensed matter (2003).
- (21) Sanchez, O. L., Ovchinnikov, D., Misra, S., Allain, A. & Kis, A. Valley polarization by spin injection in a light-emitting van der waals heterojunction. Nano letters 16, 5792–5797 (2016).
- (22) Zhao, C. et al. Enhanced valley splitting in monolayer wse2 due to magnetic exchange field. Nature nanotechnology 12, 757 (2017).
- (23) Seyler, K. L. et al. Valley manipulation by optically tuning the magnetic proximity effect in wse2/cri3 heterostructures. Nano letters 18, 3823–3828 (2018).
- (24) Li, W., Lu, X., Dubey, S., Devenica, L. & Srivastava, A. Dipolar interactions between localized interlayer excitons in van der waals heterostructures. Nature Materials 19, 624–629 (2020).
- (25) Kremser, M. et al. Discrete interactions between a few interlayer excitons trapped at a mose 2–wse 2 heterointerface. npj 2D Materials and Applications 4 (2020).
- (26) Rivera, P. et al. Valley-polarized exciton dynamics in a 2d semiconductor heterostructure. Science 351, 688–691 (2016). URL http://science.sciencemag.org/content/351/6274/688. eprint http://science.sciencemag.org/content/351/6274/688.full.pdf.
- (27) Laikhtman, B. & Rapaport, R. Exciton correlations in coupled quantum wells and their luminescence blue shift. Physical Review B 80, 195313 (2009).
- (28) Jauregui, L. A. et al. Electrical control of interlayer exciton dynamics in atomically thin heterostructures. Science 366, 870–875 (2019).
- (29) Fernández-Rossier, J., Tejedor, C., Muñoz, L. & Viña, L. Polarized interacting exciton gas in quantum wells and bulk semiconductors. Physical Review B 54, 11582 (1996).
- (30) Viña, L. et al. Spin splitting in a polarized quasi-two-dimensional exciton gas. Physical Review B 54, R8317 (1996).
- (31) Amand, T. et al. Spin relaxation in polarized interacting exciton gas in quantum wells. Physical Review B 55, 9880 (1997).
- (32) Ciuti, C., Savona, V., Piermarocchi, C., Quattropani, A. & Schwendimann, P. Role of the exchange of carriers in elastic exciton-exciton scattering in quantum wells. Physical Review B 58, 7926 (1998).
- (33) Hong, X. et al. Ultrafast charge transfer in atomically thin mos 2/ws 2 heterostructures. Nature nanotechnology 9, 682 (2014).
- (34) Zhu, H. et al. Interfacial charge transfer circumventing momentum mismatch at two-dimensional van der waals heterojunctions. Nano letters 17, 3591–3598 (2017).
- (35) Tran, K. et al. Evidence for moiré excitons in van der waals heterostructures. Nature 567, 71–75 (2019).
- (36) Wang, G. et al. Polarization and time-resolved photoluminescence spectroscopy of excitons in mose2 monolayers. Applied Physics Letters 106, 112101 (2015).
- (37) Tornatzky, H., Kaulitz, A.-M. & Maultzsch, J. Resonance profiles of valley polarization in single-layer mos 2 and mose 2. Physical review letters 121, 167401 (2018).
- (38) Jiang, C. et al. Optical spin pumping induced pseudomagnetic field in two-dimensional heterostructures. Physical Review B 98, 241410 (2018).
- (39) Tan, L. B. et al. Interacting polaron-polaritons. Physical Review X 10, 021011 (2020).
- (40) Back, P., Zeytinoglu, S., Ijaz, A., Kroner, M. & Imamoğlu, A. Realization of an electrically tunable narrow-bandwidth atomically thin mirror using monolayer . Phys. Rev. Lett. 120, 037401 (2018). URL https://link.aps.org/doi/10.1103/PhysRevLett.120.037401.
- (41) Scuri, G. et al. Large excitonic reflectivity of monolayer mose 2 encapsulated in hexagonal boron nitride. Physical review letters 120, 037402 (2018).
- (42) Barachati, F. et al. Interacting polariton fluids in a monolayer of tungsten disulfide. Nature nanotechnology 13, 906–909 (2018).
- (43) Smoleński, T. et al. Tuning valley polarization in a wse 2 monolayer with a tiny magnetic field. Physical Review X 6, 021024 (2016).
- (44) Jiang, C. et al. Microsecond dark-exciton valley polarization memory in two-dimensional heterostructures. Nature Communications 9, 753 (2018). URL https://doi.org/10.1038/s41467-018-03174-3.
- (45) Shi, Y., Yu, Z. & Fan, S. Limitations of nonlinear optical isolators due to dynamic reciprocity. Nature photonics 9, 388 (2015).
- (46) Wang, Z. et al. Evidence of high-temperature exciton condensation in two-dimensional atomic double layers. Nature 574, 76–80 (2019).
- (47) Tang, Y. et al. Simulation of hubbard model physics in wse 2/ws 2 moiré superlattices. Nature 579, 353–358 (2020).
- (48) Regan, E. C. et al. Mott and generalized wigner crystal states in wse 2/ws 2 moiré superlattices. Nature 579, 359–363 (2020).
- (49) Shimazaki, Y. et al. Strongly correlated electrons and hybrid excitons in a moiré heterostructure. Nature 580, 472–477 (2020).
Methods
Sample fabrication
We transfer the mechanically exfoliated samples by polydimethylsiloxane-based dry transfer method on 300 nm SiO2/Si substrates. Monolayer MoSe2 (HQ graphene) is stacked on top of monolayer WSe2 (HQ graphene) with the aligned edges. After the stacking, the sample is annealed in 5 H2/95 N2 at 125∘C for 2 h.
\justifyMagneto-optical spectroscopy
We use two home-built, low temperature (4 K) confocal microscope setups for magneto-photoluminescence measurements.
The sample is first loaded into a closed-cycle cryostat (AttoDry 800, base temperature 4K) for the sample characterization and subsequently into another cryostat (BlueFors cryogenics, base temperature 3.2K) for Faraday geometry measurements (from -8 T to +8 T). The sample is positioned by a coarse and fine piezoelectric nanopositioners (Attocube systems).
The emission is collected using either a room or low temperature achromatic objective (NA = 0.42 for AttoDry 800 and NA = 0.63 for BlueFors cryogenics) and directed to a high-resolution (focal length: 500 mm for AttoDry 800 and 750 mm for BlueFors cryogenics) spectrometer (Princeton Instrument HR-500 for AttoDry 800 and Princeton Instruments SP-2750i for BlueFors cryogenics) where it is dispersed by a 1200 g/mm or 300 g/mm grating (both blazed at 750 nm).
A charge coupled device (Princeton Instrument PIXIS-400 CCD for AttoDry 800 and PyLoN CCD for BlueFors cryogenics) is used as a detector.
The excitation laser is a mode-hop-free tuneable continuous-wave Ti:Sapphire laser (MSquared Lasers) with resolution of 0.1 pm, which is focused to a spot size of 1 m on the sample.
The polarization of incident laser is controlled by using a polarizer together with a liquid crystal variable retarder ( waveplate) for Bluefors cryogenics (AttoDry 800).
Polarization-resolved measurements are performed by using a waveplate (achromatic, 690-1200 nm) placed before a Wollaston prism.
The mechanism is that waveplate transforms circular emission is converted into linearly polarized light s- and p-components, and then the two components are displaced separately by the Wollaston prism. Another achromatic waveplate is placed after the Wollaston prism to convert the linearly polarized light into a circular signal, in order to avoid the polarization sensitivity of the grating.
Data availability
The data that support the plots within this paper and other findings of this study are available from the corresponding author upon reasonable request.
Supplementary Information Contents:
Note 1. Discussion on negligible valley polarization on the MoSe2 resonance (section 1).
Figure S1. Interlayer exciton configurations for WSe2 and MoSe2 resonances in AB-stacking heterobilayers
Figure S2. Dependence of emission energy and intensity on incident polarization (section 1).
Figure S3. Power dependence of the peak energy, degree of circular polarization and splitting at linear excitation (section 1)
Note 2. Estimation of the exciton-exciton annihilation rate from the power dependence of integrated intensity (section 2).
Figure S4. Calculated power dependence of the integrated intensity (section 2).
Figure S5. Excitation dependence of the peak energy and splitting at circular incidence (section 3).
Figure S6. Power dependence of the degree of polarization and splitting for another interlayer exciton (section 4).
Note 3. Calculation of the power-dependent energy splitting (section 5).
Figure S7. Calculated power dependence of the energy splitting (section 5).
Figure S8. Magnetic field dependence of the degree of circular polarization (section 6).
Figure S9. Power dependence of the degree of circular polarization at zero and finite magnetic fields (B) (section 6).
Figure S10. Polarization resolved reflectance spectra at linear excitation at B = 7 T (section 7).
Note 4. Magnetic field dependence of exchange field () (section 7).
Note 5. Calculation of the magnetic field dependence of the energy splitting (section 7).
Figure S11. Relationship between the imbalance in intensities of the circular components to the splitting (section 7).
Note 1: Discussion on negligible valley polarization on MoSe2 resonance.
The negligible valley polarization of interlayer excitons at MoSe2 resonance may be understood based on the their formation process. In the main text, Fig. 1d shows that the interlayer excitons have two resonances corresponding to WSe2 and MoSe2 resonances; however, Fig. 2a shows the robust conservation of valley polarization at WSe2 resonance but negligible valley polarization at MoSe2 resonance, which is also reported in former reportBrotonsNMat2020 . The difference between two resonances are consistent with the fact that monolayer MoSe2 shows less valley polarization than monolayer WSe2WangAPL2015 . In other words, the intralayer valley depolarization behavior before the fast transfer of carriers between layers makes MoSe2 resonance more depolarized compared to WSe2 resonance. Nevertheless, it still can not explain the complete lost of valley polarization on MoSe2 resonance, especially resonantly excited monolayer MoSe2 showing valley polarizationTornatzkyPRL2018 .
Another possible explanation is that the carriers are depolarized during the carrier transfer process at MoSe2 resonance. According to the factor of -13.41, the twist angle of the heterobilayer is close to 60∘, i.e., AB stacking. The valley configuration is that K (-K) valley of WSe2 is aligned with -K (K) valley of MoSe2 as shown in Fig. S1. When we pump the sample with light at WSe2 resonance (Fig. S1a), electrons are excited in K valley of WSe2 and then transferred to -K valley of MoSe2 via spin-conserving process, forming singlet interlayer excitons. In contrast, excitation at MoSe2 resonance requires hole spin flip process to form the interlayer excitons, no matter for the singlet or triplet states (Fig. S1b). The process that hole transfers to K valley of WSe2 is not considered because of the large momentum mismatch. The spin flip process at MoSe2 resonance may lose the information of valley polarization and thus the interlayer excitons are completely depolarized. Since the optical selection rules are site dependent in the heterobilayersYu2DMat2018 , from the fact that only one strong peak is observed and is co-polarized, one possibility is that the interlayer excitons are at site, where the observed excitons are in the singlet state with co-polarized feature, while the triplet states are coupled to z direction and unobserved. For the singlet states, WSe2 resonance can create interlayer excitons without flipping spins, whereas the MoSe2 resonance needs to either flip both the electron and hole spins or create the same configuration as Fig. S1a through intervalley scattering.
![[Uncaptioned image]](/html/2006.03061/assets/x5.png)
Figure S1: Interlayer exciton configurations for WSe2 and MoSe2 resonances in AB-stacking heterobilayers. a, excitation for WSe2 resonance. For the heterobilayer with a twist angle of 60∘, K valley in the WSe2 layer is aligned with -K valley in the MoSe2 layer. When WSe2 is excited by light (red arrow), the spin-conserving tunneling of electrons (solid grey arrow) from WSe2 to MoSe2 forms -polarized interlayer excitons (black arrow). The solid (dashed) lines in the band structures are spin up (down) states. b, excitation for MoSe2 resonance. Due to the time reversal symmetry, K valley in the MoSe2 layer is aligned with -K valley in the WSe2 layer. When light excites at MoSe2 resonance (blue arrow), the interlayer excitons must be formed via spin-flipped process (dashed grey arrow) or change the valley index (not shown), which may lose the information of polarization.
![[Uncaptioned image]](/html/2006.03061/assets/x6.png)
Figure S2: Dependence of emission energy and intensity on incident polarization. a, The dependence of -polarized interlayer excitons. The -polarized interlayer excitons have the highest energy and intensity at -polarized excitation (co-polarized) and the lowest energy and intensity at -polarized excitation (cross-polarized). The linear excitation gives -polarized interlayer excitons the energy and intensity between the two cases, which is consistent with Fig. 1a in the main text. b, The dependence of -polarized interlayer excitons. Due to the time reversal symmetry, -polarized interlayer excitons at linear excitation still have the energy and intensity between the co-polarized and cross-polarized excitation. The excitation energy is 1.72 eV with a power of 5 W.
![[Uncaptioned image]](/html/2006.03061/assets/x7.png)
Figure S3: Power dependence of the peak energy, degree of circular polarization and splitting at linear excitation a, Polarization resolved PL spectra at the linear polarized excitation. Linear polarized excitation induces no imbalance and no energy splitting between and -polarized interlayer excitons. b, c, Power dependence of the peak energy shift (b), DCP (defined as ) in the upper panel of (c) and splitting in the bottom panel of (c). Peak energies of two interlayer exciton species blueshift with the increased power, but the energy splitting and imbalance remain to be zero over the power range. The excitation energy is 1.72 eV in all panels.
Note 2: Estimation of the exciton-exciton annihilation rate from the power dependence of integrated intensity.
Saturation of the power dependent integrated intensities is an important factor to consider, as it may account for the saturated splitting at high power. Two kinds of possible mechanisms are discussed here, exciton-exciton annihilation (EEA) and absorption saturation. The EEA is mainly non-radiative Auger recombination, which has been observed in various transition metal dichalcogenide monolayers MouriPRB2014 ; KumarPRB2014 ; SunNL2014 ; YuPRB2016 ; HoshiPRB2017 ; KuligPRL2018 . This process has the probability of , where is the Auger coefficient and is the exciton density. Therefore, the rate equation for EEA under continuous wave excitation is given by,
Here is the lifetime and is the exciton generation rate scaled as , where is the excitation power and is the generation efficiency. Solving the equation for the steady state, the PL intensity is equal to . = 6.810-6 is the effective collection efficiency, which is obtained from Note 3, and A is the laser spot size (1 ) for our measurements. Considering the absorption to be 40, the scaling factor = 1.45 10cm-2 in the fitting curve presented in Fig. S4a and S4b. Fitting parameters = 5.5 10-4 cm2/s and = 10 ns. Both the linear scale (Fig. S4a) and logarithmic scale (Fig. S4b) show the quantitative match between the fitting and experimental data.
Next, we discuss the absorption saturation mechanism RiveraNComm2015 . For the resonant excitation, the absorption is proportional to , where is the saturation power. Therefore, the rate equation becomes,
is proportional to and is the linear absorption (11.5). Making , the steady-state PL intensity is
Here is the collection efficiency for the absorption saturation model and is the photon energy (1.72 eV). Using this formula, the fitting results are shown in Fig. S3c, S3d with = 11.5, = 6.810-6, = 6.3 W. Although the linear scale fitting matches well, the logarithmic scale fitting shows that the absorption saturation model deviates from the experimental results in the low power regime, implying that the absorption saturation is not the mechanism for saturation behavior in the experiment.
Comparing these two mechanism, the exciton-exciton annihilation is a more possible explanation for the saturation behavior. Recently, the phase transition from interlayer excitons to charge-separated electron-hole plasmas has been reported in the same system with continuous wave excitationWangSciAdv2019 , supporting the exciton-exciton annihilation of interlayer excitons.
![[Uncaptioned image]](/html/2006.03061/assets/x8.png)
Figure S4: Calculated power dependence of the integrated intensity. a, b, Experimental data (blue circles) and fitting (blue dashed lines) using the exciton-exciton annihilation (EEA) model in the linear scale (a) and logarithmic scale (b). c, d, Experimental data (blue circles) and fitting (blue dashed lines) using the absorption saturation model in the linear scale (c) and logarithmic scale (d). The logarithmic scale shows that the EEA model fits better than the absorption saturation model, implying the saturation behavior is probably from the EEA process.
![[Uncaptioned image]](/html/2006.03061/assets/x9.png)
Figure S5: Excitation dependence of the peak energy and splitting at circular incidence. The shifts of interlayer exciton peak in panel a show two resonances, corresponding to the MoSe2 (1.64 eV) and WSe2 (1.72 eV) intralayer exciton energies. The blueshift upon resonant excitation is consistent with the photoluminescence excitation intensity plot in Fig. 1d, providing further evidence for the fact that the exciton energies are closely related to the population of excitons. The peak energy difference or splitting, defined as is presented in panel b, which shows only WSe2 resonance can induce substantial splitting. Combined with Fig. 2a in the main text, it indicates that the imbalance at the WSe2 resonance creates the splitting. Excitation laser is circularly-polarized with incident power = 2 W.
![[Uncaptioned image]](/html/2006.03061/assets/x10.png)
Figure S6: Power dependence of the degree of circular polarization and splitting for another interlayer exciton. a, Polarization resolved PL spectra at 4.3 W. The co-polarized excitons have higher intensity and higher energy than the cross-polarized excitons, which is the same as the exciton in the main text. b, The power-dependent DCP (upper panel) and splitting (bottom panel). Both the DCP and splitting increase with larger power and saturate about 4.3 W. Excitation laser is circularly-polarized, with energy = 1.72 eV.
Note 3: Calculation of the power-dependent energy splitting.
Power dependence of the energy splitting can be understood by the density-dependent energy shift from the exciton-exciton interactionsFernandezPRB1996 ; RiveraScience2016 . The interactions can be separated into two parts, dipole-dipole interaction and exchange interaction . In the heterobilayer system, each exciton carries a permanent dipole moment. Due to the fixed dipole moments from MoSe2 layer to the WSe2 layer, the dipole-dipole interaction is repulsive and induces the blueshift of the interlayer exciton energy. This dipole-dipole interaction is independent of the valley indices of interactive excitons, and thus the blueshift from is the same for the two valley excitons and , that is, the excitons that couple to and light, respectively. In contrast, the exchange interaction only exists between interlayer excitons in the same valley and is a valley-dependent effect. For the valley excitons and with the density and , the mean field description of the exciton-exciton interactions is given by,
| (1) | |||||
| (2) |
where () is the energy shift of the ( ) from exciton-exciton interactions. and are the exchange interaction and dipole-dipole interaction in the mean field description. The estimation of and gives , and RiveraScience2016 ; FernandezPRB1996 , where is the Bohr radius of interlayer exciton, is the binding energy, and the scaling factor 1 in the 2D limit. We can obtain the splitting energy by calculating the difference of shift between and ,
| (3) |
This shows that the splitting is proportional to the imbalance of exciton density, . At -polarized excitation with power P = 5.62 W for Fig. S7, = 10.0 meV, = 5.8 meV. Taking = 2 nm, = 0.7 nm, = 0.2 eVRiveraScience2016 , we can estimate = 8.481011 cm-2, and = 3.171011 cm-2. The total exciton density is then given by as 1.161012 cm-2. Considering the nano-second lifetime and 10 absorptionLiPRB2014 , exciton density is given by , where A is the laser spot size of 1 m2, excitation energy = 1.72 eV, and is the lifetime. The total density of 1.161012 cm-2 corresponds to the lifetime of 5.7 ns, which is a reasonable value. The measured intensity difference is 3.6, giving the effective collection efficiency , which is used in the Note 2. We note that this effective collection efficiency includes the collection efficiency of our setup including the mode-mismatch due possible -polarized emission of IXs and any non-radiative channels.
In the main text, we use the degree of circular polarization (DCP) to characterize the imbalance, which is basically DCP = , as is proportional to intensity . The DCP is proportional to the imbalance, so as to the splitting. In order to connect DCP to the splitting, we add the two energy shift equations (1),(2) and plug into the splitting equation (3) with the DCP, which gives-
| (4) |
Based on the equation, if the excitation is -polarized, DCP is positive, and thus the splitting is positive, i.e., has higher energy, while the splitting is flipped for the excitation. Moreover, the splitting follows the same trend as the DCP, which is consistent with our interpretation throughout the main text. The calculated energy splitting from the power dependence at B = 0 T is shown in the Fig. S7. The quantitative agreement between the calculated and experimental splitting at low power before the saturation power validates our model. The deviation starting from the saturation power may come from a phase-space filling blue shift KimSciAdv2017 , which is spin-valley independent and is not included in our model.
We note that the strength of exciton-exciton interactions that we find in our sample is 0.8 eVm2 and is about an order of magnitude larger than the value reported in monolayer sample TanPRX2020 ; ScuriPRL2018 ; BarachatiNNano2018 . This strength of interaction scales as where is the effective dielectric constant. While is 10 nm in GaAs quantum wells, due to a larger , the ratio is comparable with TMDsVinaPRB1996 ; AmandPRB1997 .
![[Uncaptioned image]](/html/2006.03061/assets/x11.png)
Figure S7: Calculated power dependence of the energy splitting. For both and excitation, the calculated splitting (dash-circle lines) matches the experimental splitting (solid circles) when power is below saturation. Above the saturation power, the experimental splitting is smaller than the calculated splitting, which may be explained by the phase-space filling blue shift independent of spin-valley index. The excitation energy is 1.72 eV for the experimental data.
![[Uncaptioned image]](/html/2006.03061/assets/x12.png)
Figure S8: Magnetic field dependence of the degree of circular polarization. Taking the DCP at linear excitation as reference, the DCP of and -polarized excitation saturates at B= 0.2 T and then keeps the same, though the magnetic field is increased. Excitation laser energy is 1.72 eV and incident power is 2 W.
![[Uncaptioned image]](/html/2006.03061/assets/x13.png)
Figure S9: Power dependence of the degree of circular polarization at zero and finite magnetic fields (B). Power dependence of DCP under B= 0 T and 3 T for -polarized excitation (a) and -polarized excitation (b). At B = 0 T, the DCP increases slowly with power and saturates at about 6 W, the change of DCP together with the energy shift quantitatively reproduces the splitting as shown in Fig. S7 (Note 3). However, DCP at B = 3 T saturates at very low power, and decreases slightly when the power increases. Excitation laser is circularly-polarized, with energy = 1.72 eV.
![[Uncaptioned image]](/html/2006.03061/assets/x14.png)
Figure S10: Polarization resolved reflectance spectra at linear excitation at B = 7 T. The upper panel is the monolayer WSe2 reflectance spectra. The monolayer WSe2 absorption energies of -polarized excitons (1.7488 eV) and -polarized excitons (1.7508 eV) are split by -1.94 meV, which is corresponding to the factor of -4.78. The bottom panel is the heterobilayer MoSe2/WSe2 reflectance spectra. The two absorption energies 1.64 eV and 1.72 eV correspond to MoSe2 and WSe2 resonances as shown in the Fig. 1d. The WSe2 resonance in heterobilayer red-shifts from that of the monolayer counterpart, implying the effective interlayer coupling between the MoSe2 and WSe2 layers.
Note 4. Magnetic field dependence of exchange field ().
Once an external is applied in the Faraday geometry, the effective magnetic field () in the hBL sample is the combination of and the exciton-interaction induced exchange field (),
| (5) |
As introduced in the main text, is nonzero when there is population imbalance between the two species of excitons. even breaks TRS and induces the valley splitting under zero . The total splitting energy under external depends on both and ,
| (6) |
When (), is proportional to due to the valley Zeeman effect,
| (7) |
with = -13.41 0.08 (Fig. 3b in the main text). When under larger power circular excitation, still scales linearly with (Fig. 4c in the main text) but with a different scaling factor compared to that of the valley Zeeman effect. This result can be empirically captured if is a function of imbalance and , and it is proportional to .
| (8) |
with responsible for the zero-field splitting and being constant once the circular excitation power is fixed. The sign depends on whether acts in concert or opposition with external . Accordingly, the splitting energy is given by,
| (9) |
The effective factor = . Plugging in the values from Fig. 4c, we obtain = 0.25 0.05. is an increasing function of and as such that at low power the non-linear behavior discussed in Fig. 4 of the main text is negligible. We note that the linear relation of with in Eq. 8 has been derived on very general grounds and is valid as long as the splitting is linear with .
The simplest explanation for a linear increase of could arise if itself increases linearly with . In other words, can be expressed in terms of as follows -
| (10) |
where . As shown below, our data supports this hypothesis. From the power-dependence of or , it appears that the suppression of valley-mixing in the relaxation process from interlayer to IX (as mentioned in the main text) is more effective at larger imbalance. In other words, the surmised valley-mixing, in absence of , is dominant at larger imbalance, making it a density-dependent scattering process.
Note 5: Calculation of the magnetic field dependence of the energy splitting.
We first note that imbalance density, , is proportional to the difference in intensities of the two circular components . In order to confirm that the non-linear behavior under circular incident power in the -dependence of Fig. 4 arises from a linear increase in with , we must first take into account the linearly polarized data (equivalent to circular power being zero) as reference. Indeed, we performed a similar analysis for the splitting data as well when we subtracted the linear Zeeman splitting in Fig. 4b or plot the parallel guidelines in Fig. 4c.
To this end, we note that the intensity imbalance for the linearly polarized excitation scales linearly with with a positive slope, as shown in Fig. S11a. Hence, the B-dependence of linearly polarized reference is completely antisymmetric in . We use this model-independent fact to decompose the imbalance for the circular incident data into their respective symmetric and antisymmetric components. The circular components are labeled as co- or cross-polarized peaks based on the incident helicity. As shown in Fig. S11a, the antisymmetric parts of circular components match up with the linear reference. This implies that the only the symmetric component of the co- and cross-polarized data needs to be considered in order to relate to splitting.
Fig. S11b shows the symmetric parts of the co- and cross-polarized peaks which have been offset by 0.02 T data to ignore the effect of dip discussed in the main text. Next, we must convert this data into splitting by using the experimental data of peak energy versus intergrated intensity. In other words,
| (11) |
where are the calculated peak energies, is the zero- energy, is the symmetrized intensity data and is obtained from the peak energy versus integrated intensity data. Fig. S11c shows the mesaured splitting offset by the linearly polarized Zeeman splitting (reference) and the calculated splitting . We find excellent match between the two, strongly supporting our claim that the nonlinear behavior at high powers arises from the imbalance increasing linearly with . We remark that no external parameters or free parameters have been used in this analysis.
![[Uncaptioned image]](/html/2006.03061/assets/x15.png)
Figure S11: Relationship between the imbalance in intensities of the circular components to the splitting a, The linearly-polarized intensity-imbalance data serves as a reference. The antisymmetric parts of the circular data match up almost perfectly with the reference implying only the symmetric part of the circular data contributes to the splitting. b, The symmetric parts of the co- and cross-polarized circular data. c, A comparison of the calculated splitting (red dashed lines) from the intensity-imbalance data and the measured splitting yields excellent overlap.
References
- (1) Brotons-Gisbert, M. et al. Spin-layer locking of interlayer valley excitons trapped in moir’e potentials. Nature Materials 19, 630–636 (2020).
- (2) Wang, G. et al. Polarization and time-resolved photoluminescence spectroscopy of excitons in mose2 monolayers. Applied Physics Letters 106, 112101 (2015).
- (3) Tornatzky, H., Kaulitz, A.-M. & Maultzsch, J. Resonance profiles of valley polarization in single-layer mos 2 and mose 2. Physical review letters 121, 167401 (2018).
- (4) Yu, H., Liu, G.-B. & Yao, W. Brightened spin-triplet interlayer excitons and optical selection rules in van der waals heterobilayers. 2D Materials 5, 035021 (2018).
- (5) Kulig, M. et al. Exciton diffusion and halo effects in monolayer semiconductors. Physical review letters 120, 207401 (2018).
- (6) Mouri, S. et al. Nonlinear photoluminescence in atomically thin layered wse 2 arising from diffusion-assisted exciton-exciton annihilation. Physical Review B 90, 155449 (2014).
- (7) Kumar, N. et al. Exciton-exciton annihilation in mose2 monolayers. Physical Review B 89, 125427 (2014).
- (8) Sun, D. et al. Observation of rapid exciton–exciton annihilation in monolayer molybdenum disulfide. Nano letters 14, 5625–5629 (2014).
- (9) Yu, Y. et al. Fundamental limits of exciton-exciton annihilation for light emission in transition metal dichalcogenide monolayers. Physical Review B 93, 201111 (2016).
- (10) Hoshi, Y. et al. Suppression of exciton-exciton annihilation in tungsten disulfide monolayers encapsulated by hexagonal boron nitrides. Physical Review B 95, 241403 (2017).
- (11) Rivera, P. et al. Observation of long-lived interlayer excitons in monolayer mose2–wse2 heterostructures. Nature Communications 6, 6242 EP – (2015). URL http://dx.doi.org/10.1038/ncomms7242.
- (12) Wang, J. et al. Optical generation of high carrier densities in 2d semiconductor heterobilayers. Science advances 5, eaax0145 (2019).
- (13) Rivera, P. et al. Valley-polarized exciton dynamics in a 2d semiconductor heterostructure. Science 351, 688–691 (2016). URL http://science.sciencemag.org/content/351/6274/688. eprint http://science.sciencemag.org/content/351/6274/688.full.pdf.
- (14) Fernández-Rossier, J., Tejedor, C., Muñoz, L. & Viña, L. Polarized interacting exciton gas in quantum wells and bulk semiconductors. Physical Review B 54, 11582 (1996).
- (15) Li, Y. et al. Measurement of the optical dielectric function of monolayer transition-metal dichalcogenides: Mos 2, mo s e 2, ws 2, and ws e 2. Physical Review B 90, 205422 (2014).
- (16) Kim, J. et al. Observation of ultralong valley lifetime in wse2/mos2 heterostructures. Science Advances 3 (2017). URL http://advances.sciencemag.org/content/3/7/e1700518. eprint http://advances.sciencemag.org/content/3/7/e1700518.full.pdf.
- (17) Tan, L. B. et al. Interacting polaron-polaritons. Physical Review X 10, 021011 (2020).
- (18) Scuri, G. et al. Large excitonic reflectivity of monolayer mose 2 encapsulated in hexagonal boron nitride. Physical review letters 120, 037402 (2018).
- (19) Barachati, F. et al. Interacting polariton fluids in a monolayer of tungsten disulfide. Nature nanotechnology 13, 906–909
- (20) Viña, L. et al. Spin splitting in a polarized quasi-two-dimensional exciton gas. Physical Review B 54, R8317 (1996).
- (21) Amand, T. et al. Spin relaxation in polarized interacting exciton gas in quantum wells. Physical Review B 55, 9880 (1997).