Mt. Wendelstein imaging of comet 41P/Tuttle-Giacobini-Kresak during the 2017 perihelion arc
Abstract
Context. In April 2017 comet 41P/Tuttle-Giacobini-Kresak (41P) passed perihelion close to Earth.
Aims. We present observations of the comet and aim to use these to characterize its dust environment in the coma and of physical properties of the nucleus.
Methods. 41P was imaged in the visible at the Mt. Wendelstein observatory over 45 nights between 2017 March 11 and 2017 July 17. Photometry of the coma provides information on the dust activity of the comet. Nucleus dimensions are determined by comparing radial profiles of observed images with those from models of the brightness distribution in the near-nucleus coma. Coma and tail structures in the images are enhanced using adaptive Laplace filtering and image normalization techniques. The geometry of the coma structures found are compared to results from dust models of the comet in order to obtain information on the nucleus rotation axis and the location of active regions on the nucleus.
Results. Analyzing the evolution of the dust activity of the comet versus solar distance gives different results depending on the assumed phase angle corrections for the dust. Contamination from light emissions of the coma gas modified the colors in the coma and the slopes of the radial profiles. The light distribution in the very inner coma indicates some dust fragmentation close to the nucleus. The appearance of a prominent coma fan during the time period from March to May 2017 constrains the rotation axis of the nucleus (52 deg obliquity, 50 deg rotation angle of the perihelion meridian). This fan is produced by an extended region beyond about 50 deg latitude on the nucleus. Two narrow regions at low northern to equatorial latitudes were responsible for the time-variable occurrence of linear dust jets in the coma. An outburst of about 0.6 mag on 2017 May 11 generated various dust structures in the coma. The outburst originated from a region extending over a latitude range from +30 deg to -5 deg and released about 3 000 tons of dust into the coma. The brightness of the nucleus indicates an equivalent radius of about 600 m and a minimum axis ratio larger than two.
Key Words.:
Comets: individual: 41P/Tuttle-Giacobini-Kresak1 Introduction
Comet 41P/Tuttle-Giacobini-Kresak (text abbreviation = 41P) was originally discovered by H. P. Tuttle in 1858 and was observed twice more: in 1907 by M. Giacobini and in 1951 by L. Kresak (Belyaev 1986; Vsekhsvyatskii 1964) with no observations in between. 41P is a low inclination (9.2 deg) Jupiter family comet (JFC) with an orbital period of 5.4 years and a current perihelion distance (1.045 AU) close to the Earth orbit. The orbit evolution of 41P over the past approximately 200 years (Belyaev 1986) shows several encounters with Jupiter from moderate (0.37 AU in 1975) to large (1.60 AU in 1963) distances. Triggered by the initial analysis of Fernández & Sosa (2015) and based on their own analysis of the orbit dynamics of 41P over several tens of thousands of years, Pozuelos et al. (2018) suggest that this comet may belong to the group of near-Earth JFCs with possible origin in the main asteroid belt.
Despite 41P occasionally passing the Earth at relatively close proximity, only limited information on its physical properties were collected before the 2017 perihelion passage of the comet. The absolute coma magnitude (15.3 mag from Jet Propulsion Laboratory ephemeris111 https://ssd.jpl.nasa.gov/horizons.cgi) indicates 41P to be a moderately active comet. Based on nucleus brightness estimations published in the literature, Tancredi et al. (2000) deduced an absolute magnitude of the nucleus of 18.5 mag. This corresponds to a nucleus radius of 0.7 km for an assumed geometric albedo of 0.04. In late May and early June 1973 two major outbursts were reported with a brightness amplitude of about 9 mag and a coma expansion speed of more than 500 m/s (Kresak (1991), Hughes (1991)). These are among the most violent events observed in comets so far (Whipple & Huebner 1976). 41P is therefore discussed in the context of split comets (Sekanina 1991), although only indirect evidence (outburst, nongravitational forces) and no direct subnucleus detection is reported (Hughes 1991).
The 2017 perihelion passage of 41P allowed a very favorable observing window for the comet, as it passed close to Earth (closest distance of 0.14 AU on 2017 April 01) and was clearly observable from Earth for 6 months in 2017. From this apparition of the comet, Bodewits et al. (2018) provide evidence that the apparent rotation period of the nucleus may have increased from about 20 h to more than 46 h between March and May 2017. The increase of the rotation period is analyzed in greater detail by Schleicher et al. (2019) based on their observing campaign of the comet of about 4.5 months. Moulane et al. (2018) provide results on the gas (OH, CN, C2, C3, NH) and dust activity ( values) of 41P. Pozuelos et al. (2018) also present first modeling results on the dust coma. Both of these latter papers are based on observations of 41P made with the Trappist 0.6m telescopes between 2017 February 16 and 2017 July 20. Luk’yanyk et al. (2019) found rapid variations of the dust color in 41P. Rumyantsev et al. (2019) presented polarization measurements of 41P from a single epoch in April 2017. Other partly preliminary results were reported on volatile species (C2H2, HCN, C2H6 and H2CO; McKay et al. 2017, 2018), the OH production rate and gas expansion velocity (Lovell et al. 2017), and the radar size of the nucleus (Howell et al. 2017).
Here, we describe the results from the 2017 imaging campaign toward comet 41P using the 2m Fraunhofer telescope at the Mt. Wendelstein Observatory, Bavaria/Germany (section 2). We discuss our findings with respect to the coma environment and dust activity of the comet (section 3.1) as well as to the size of the nucleus (section 3.2). Furthermore, we use coma structures to assess the dust tail in the coma (section 3.3) as well as the rotation axis and the locations of active regions on the nucleus (section 3.4). In section 3.5 we analyze a singular outburst event seen in the coma of 41P on 2017 May 11. Section 4 presents the conclusions.
2 Observations, data reduction, and analysis methods
2.1 Observations
Observations of comet 41P were performed with the 2m Fraunhofer Telescope at the Mt. Wendelstein Observatory of the Ludwig-Maximilian University Munich over 45 nights between 2017 March 11 and 2017 July 17 (Table 4). During that time interval the comet moved from 1.14 AU pre- to 1.61 AU post-perihelion. 41P was closest to Earth on 2017 April 01 (0.14 AU). The observations cover a phase angle range of the comet from 14 to 69 deg.
| [nm] | [nm] | [nm] | |
|---|---|---|---|
| g band | |||
| WWFI | 483.4 | 418 | 550 |
| PS1 | 483.2 | 414 | 552 |
| SDSS | 462.7 | 402 | 533 |
| r band | |||
| WWFI | 620.6 | 557 | 695 |
| 3KK | 630.3 | 562 | 697 |
| PS1 | 618.8 | 548 | 694 |
| SDSS | 613.9 | 559 | 675 |
| i band | |||
| WWFI | 761.2 | 698 | 836 |
| 3KK | 759.5 | 682 | 841 |
| PS1 | 752.5 | 688 | 824 |
| SDSS | 746.7 | 690 | 817 |
Two imaging instruments were used for the comet observations, namely the 3KK multi-channel imager (Lang-Bardl et al. 2010) and the Wendelstein wide field imager WWFI (Kosyra et al. 2014). The 3KK instrument allows simultaneous exposures in three filter bands, namely two in the visible and one in the near-infrared. For this analysis of the 41P observations, only the Sloan Digital Sky Survey SDSS r and SDSS i images were used (image pixel scale = 0.200 arcsec/pixel) . Single exposures provide a field of view of arcmin on the pixels CCD detectors. The WWFI instrument (pixel scale = 0.199 arcsec/pixel) took image series of the comet sequentially through SDSS g, SDSS r, and SDSS i filters. Those data provide a field of view of 27.6 x 29.0 arcmin on a mosaic of four 4096 x 4096 pixel CCD detectors. Both instruments are mounted on the telescope and allowed us to obtain images of 41P with both on several nights. The typical nightly observing interval of 41P extended over about 15 to 60 min; on a few nights the comet was exposed over longer time intervals or during a second time window. The log file of the 41P observations is compiled in Table 4, and information on the filter properties is listed in Table 1.
The exposure series of the comet consist of sequences of 60 sec exposures with jitter offsets in between the individual filter exposures (WWFI) or filter set exposures (3KK). Non-sidereal tracking was applied to the telescope to compensate the differential motion of the comet. The exposure time of the individual comet images was chosen to avoid saturation of the central part of the coma as well as to avoid smearing of the coma center beyond actual seeing conditions. In addition to the images of the comet, the usual set of calibration exposures (bias, sky flat-field) was taken. Since the flux calibration is performed by means of background stars in the field of view of the science target, exposures of standard star fields were not collected.
2.2 Data reduction
Data reduction was performed using a pipeline process developed and tuned at the University Observatory Munich specifically for the Mt. Wendelstein 2m telescope and the WWFI camera; it is described for the application to comet observations in Boehnhardt et al. (2016) and references therein. This pipeline was adapted to the 3KK images in the visible wavelength range and applied in a similar way to the comet observations. The pipeline process corrects for the bias and flat-field properties as well as for the sky background and for detector artifacts (i.e., ‘hot’ and ‘cold’ pixels, cosmic rays) in the images. It also provides zero points (to convert photons per second to magnitudes) for the exposures using background stars for the individual images from the Pan-STARRS-3 Pi source catalog (PV3) given in AB magnitudes (Magnier et al. 2013) and corrected to the SDSS gri filter system. Over 90% of the WWFI r frames have photometric zero points between 23.2 and 25.2 mag which were determined using between 200 and 17,000 reference stars; for 3KK the number of reference stars is down by a factor of 16 compared to the WWFI case. For WWFI, a purely photon error for the zero point determination would be smaller than 0.01 mag (having at least 200 stars brighter than 17 mag and a minimum sky brightness of 17.5 mag/arcsec2). For images with over 10,000 reference stars, our large aperture of 10 arcsec may count multiple sources, thereby shifting the zero point to a slightly higher value of maximum 0.03 mag (e.g., in the most extreme case of 17,000 stars on 2017 July 17). Color terms of between WWFI and SDSS as measured by (Kosyra et al. 2014) play only a minor role, having colors in the range .
The data post-processing for the preparation of the analysis of 41P properties requires mean- and median-averaged composite frames of the comet, which are calculated from the flux-calibrated image series of a single night - or typically one-hour segments in cases of extended or multiple observing windows per night. Before averaging the image series, we aligned the individual frames to the central brightness peak in the coma. The centering accuracy is estimated to be well within 0.1 arcsec (10 to 46 km at the distance of the comet). From the average composite images a minor sky background level was subtracted that remained from the averaging process of the individual sky-removed images. The optimum sky level is determined via the method of the asymptotic radial profile fitting of the cometary coma in the median-averaged image. We estimate the flux calibration error on a case-by-case basis from the nonflatness and bias variations with typical values of less than 1.5%, from the sky subtraction and remnant star signal in the coma below 2%, and from the zero points to be better than 1.5%. Overall, the flux calibration of the comet signal should be better than 3 to 4%.
2.3 Analysis methods
For the assessment of the coma activity and in particular for the search of coma and tail structures in the comet, beyond visual inspection of the images, we used structure enhancement techniques, such as an adaptive Laplace filter (Boehnhardt & Birkle 1994) and radial normalization (A’Hearn et al. 1986). Both numerical recipes were applied to the individual images as well as to the nightly or hourly averaged composite frames.
The global coma status is investigated by means of radial coma profiles obtained from the median averaged composite images of the comet. The radial profiles are calculated by integrating and then averaging comet flux in concentric rings of increasing radius centered on the brightness peak in the coma. For a quantitative assessment, the gradient slope in the average radial profile is approximated in linear fits to the log-log pairs for the flux versus the distance at the comet using different distance ranges in the coma.
The light scattering and emission behavior of the coma is analyzed through color maps of the coma which are produced from nightly median composite images of the SDSS gri filter exposures. The respective procedure calculates the apparent magnitude in the median composite filter images and subtracts filter pair images (g-r, g-i, r-i) after proper centering to the brightness peak in the coma.
We also calculate the model flux distribution of the inner coma region within 8 arcsec from the central brightness peak in the comet image. This corresponds to about 200-900 km distance from the nucleus depending on the observation date. The model includes flux contributions of light reflected by the coma and the nucleus, and it considers the atmospheric smearing of the signal. This new model allows the assessment of the contribution of nucleus-reflected sunlight. In the following, we describe the respective analysis steps in detail.
The flux from the coma is represented by a radial power-law profile that is used to create a 2D image around the nucleus position. The central coma pixel (i.e., the coma at the nucleus position) is set to the level of the closest neighboring distance in the radial profile. In order to mimic the object-specific asymmetric light distribution in the coma, the 2D symmetric coma image is multiplied by a 2D mask file. This mask represents the pixel-wise ratio between the observed pixel flux at a certain coma position and the mean coma flux, as it is determined for the respective nucleus distance in the observed image. We note that the 2D mask file is a direct output of the normalization method for the analysis of structures inherent in coma images (for examples, see Fig. 9 and Fig. 12). In order to avoid abrupt pixel-to-pixel variations, we smoothed the coma mask file by a 6x6 pixel averaging filter. The smoothing process is adequate for the relatively wide and low-contrast coma features seen in the coma region beyond about 20 pixels from the nucleus. However, it may not well represent small-scale variations very close to the nucleus. The model coma image is normalized to achieve the same mean flux as measured in the observed image in a ring aperture of a few pixels (in our case 5 pixels or 1 arcsec in the sky) and with an inner diameter well beyond the seeing of the exposures (in our case 35.5 pixels or 7.1 arcsec nucleus distance in the sky).
The nucleus light is represented by a 2D image with a single pixel at the appropriate flux level and all other pixels at zero. The degradation of the image quality due to the atmosphere and the instrument is described by a 2D radially symmetric point-spread function (PSF). Either a Gaussian or a Moffat-type distribution (Moffat 1969) is applied. Here, the Moffat function is proportional to with the Moffat parameters and and as radial distance. Both distribution kernels are normalized to unity over the 2D image size chosen for the model description.
The input images for the simulation, that is, the coma flux distribution, the nucleus image, and the PSF image, are each centered to maximum brightness. In order to improve the sensitivity of the solution for the nucleus, an oversampling of the pixel size by integer factors of up to 5 in and is introduced. This brings the effective pixel resolution of the model image to a range below the nominal resolution of the telescope aperture (0.08 arcsec for the 2m Wendelstein telescope) and allows a better representation of the mean coma flux distribution close to the nucleus position.
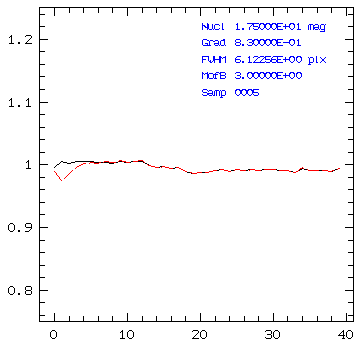
The comet model image in space, that is, before transit through the terrestrial atmosphere and the telescope and instrument, is represented by the co-addition of the aligned coma and the nucleus images. The comet image at the telescope is the result of the convolution of the comet model image in space with the PSF image that represents the changes due to atmosphere and observing equipment. The resulting image from the convolution can be compared with the observed image and appropriate fitting parameters can be chosen. For the evaluation of the nucleus flux we apply the comparison of the telescope model data to median-averaged composites of the observed images. We selected the best solution from a large set of forward calculations. Selection criteria were: (1) the minimum sum of deviations in the mean radial profiles of the model image and of the observed image in the inner 20 pixels (4 arcsec) around the nucleus and (2) a constant ratio (close to unity) of the mean radial model profile to the observed profile in the radial range between 20 and 40 pixels (4 to 8 arcsec) from the nucleus. We required that criteria (1) and (2) be fulfilled at the same time. The pixel range for criterion (1) reflects best the nucleus distance in the observed image that is most affected by the PSF and by the nucleus flux. The radial flux profile in the coma is reflected further away from the nucleus where the PSF and the nucleus flux properties are unimportant. The fit solution produced a model image with a radial profile very close to those of the chosen observed image – or in other words the ratio of the radial profiles of the model and the observed images is close to unity over the full pixel range (40 pixels). An example case for comet 41P is shown in Fig. 7 below.
Model parameters for the fitting process are as follows: The exponent of the radial coma profile (for a geometric expanding coma, the exponent should be 1), the nucleus brightness, and the PSF parameters, namely the sigma (or equivalent full width at half maximum (FWHM)) of the seeing disk for the Gaussian distribution and the FWHM plus the asymptotic exponent for the Moffat case (representing the and parameter in the Moffat distribution). The PSF parameters (Gaussian or Moffat and ) are determined to the greatest extent possible from the width of the trails of background stars in the mean composite comet images. The Gaussian and Moffat were found to be well defined by these measurements, and therefore, for the calculation of the model image, they are kept fixed or very close to the measured values (rarely up to 0.05 arcsec deviation). It should be noted that the fitting process for the inner 20 pixels in the comet image usually gave better results for the Moffat model (as compared to the Gaussian approximation). The seeing measured by the FWHM of stars in the comet images was between 0.8 and 2 arcsec with a mean value of 1.2 arcsec, and three cases beyond 2 arcsec.
3 Results
The main objectives of our research are to estimate the size of the nucleus and to analyse the coma and tail structures in order to constrain the rotation properties and the location of active regions on the nucleus of 41P. In preparation for these tasks, it was deemed important to gather a description of the general appearance of comet 41P during the 2017 apparition, including the coma brightness evolution, the measured colors, and radial gradients in the coma.
3.1 The cometary coma
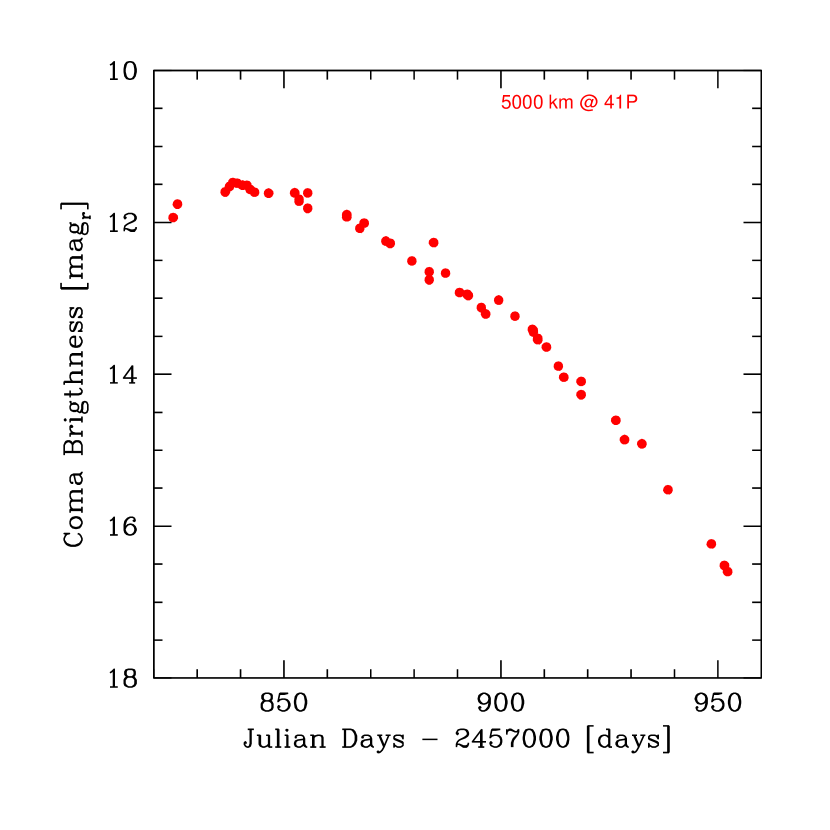
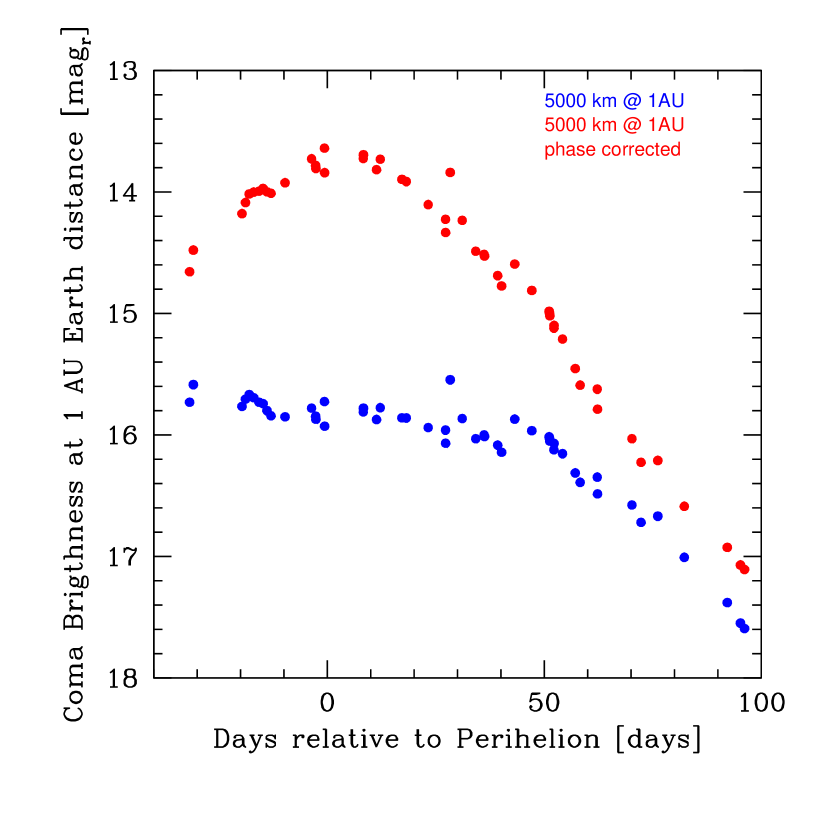
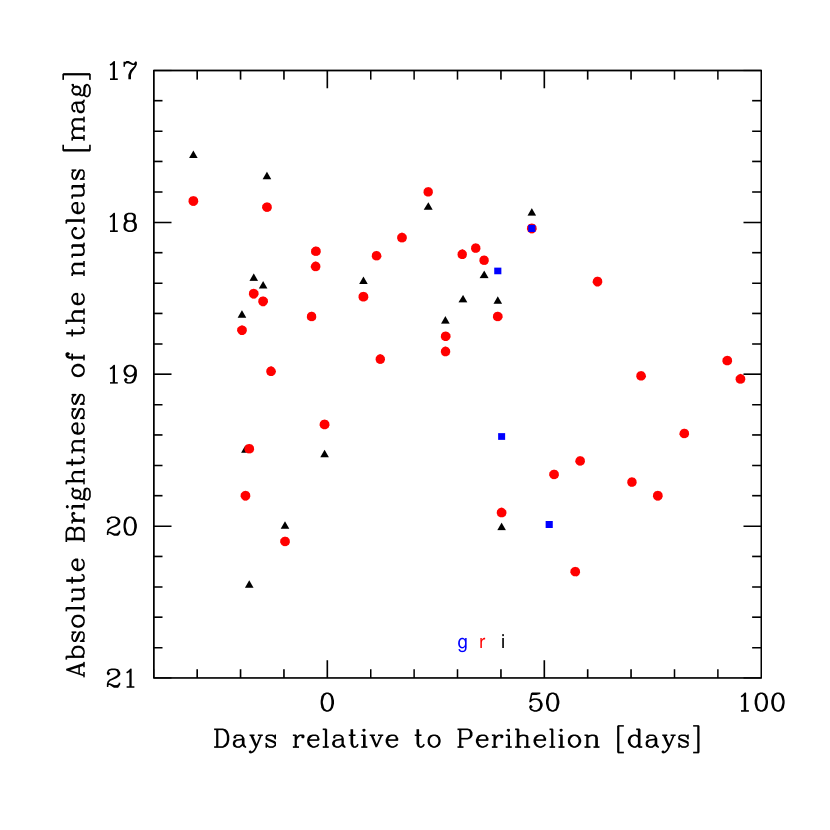
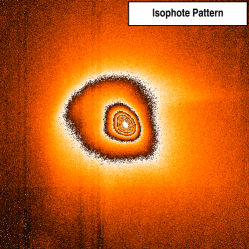
Coma brightness: During the observing interval from 2017 March 11 to 2017 July 17, comet 41P showed an extended coma of a few tens of thousands of kilometers in diameter with slightly oval, asymmetric, and sometimes dented (due to inherent coma structures) isophote patterns. The total apparent coma brightness in SDSS r filter varied from about 11.5 to 16.6 mag and was measured in a circular aperture of constant 5 000 km diameter at the distance of the comet and centered at the central brightness peak in the coma (Table 5). The maximum apparent brightness was reached about 1-3 weeks before perihelion (Fig. 1, top panel). The absolute brightness of the coma (corrected to 1 AU Earth distance and to zero phase angle using a linear phase angle coefficient of 0.04 mag/deg (Lamy et al. 2004)) indicates that 41P may have been brightest intrinsically around the time of perihelion passage (Fig. 1, bottom panel). The overall brightness evolution of the comet shows a few deviations from a smooth light curve, that is, a short-term maximum (outburst) 28 days after perihelion passage (2017 May 11), which is discussed in section 3.5, as well as short-term dips and peaks of up to 0.1 mag amplitude due to activity variations of the comet and/or measurement scatter. The light curve of the comet in SDSS i filter is, in general, quite similar to the one in SDSS r; our data in the SDSS g filter are too sparse and do not provide a global picture of the light curve over the 2017 apparition.
The measurements of the comet brightness represent mostly the coma activity in the dust phase with – likely – small contributions from coma gases (C2, C3, NH2, [OI]). Maximum activity around perihelion is therefore not surprising, as solar illumination and heating of the nucleus for ice sublimation is highest and also drives the dust activity. Moulane et al. (2018) report the maximum gas production rates in 41P for the OH, NH, CN, C2, and C3 daughter species before perihelion (within 10-20 days). Comet 41P displayed strong and variable gas and dust jet activity (Schleicher et al. 2019). Currently, it is unclear to what extend the occurrence of jets and the increasing rotation period have impacted the assessment of the global gas activity status of the comet. For the activity profile of 41P (see also the paragraph on coma activity below), which is representative of the dust production of the comet, Moulane et al. found a maximum 17 days before perihelion. This maximum was followed by a drop by almost half of the maximum amplitude from 10 days before to about 16 days after perihelion passage of the comet – while the gas production decreased only by a smaller amount. This behavior is in contrast to the rather smooth brightness evolution of the comet seen in our measurements (Fig. 1, bottom panel), which do not support dust activity variations of almost a factor two. The estimation implies correction of the measurements to zero phase angle using an assumed phase angle relationship to the brightness data at unity Earth distance. Different phase angle corrections, applied to our measurements of 41P, result in a diverse predicted behavior of the activity profile for zero phase angle (reflected in the curves of 41P in Fig. 6). Therefore, conclusions on the actual dust activity profile of the comet have to be handled with care, in particular for corrections covering a larger phase angle range (see Tab. 4) like that of 41P.
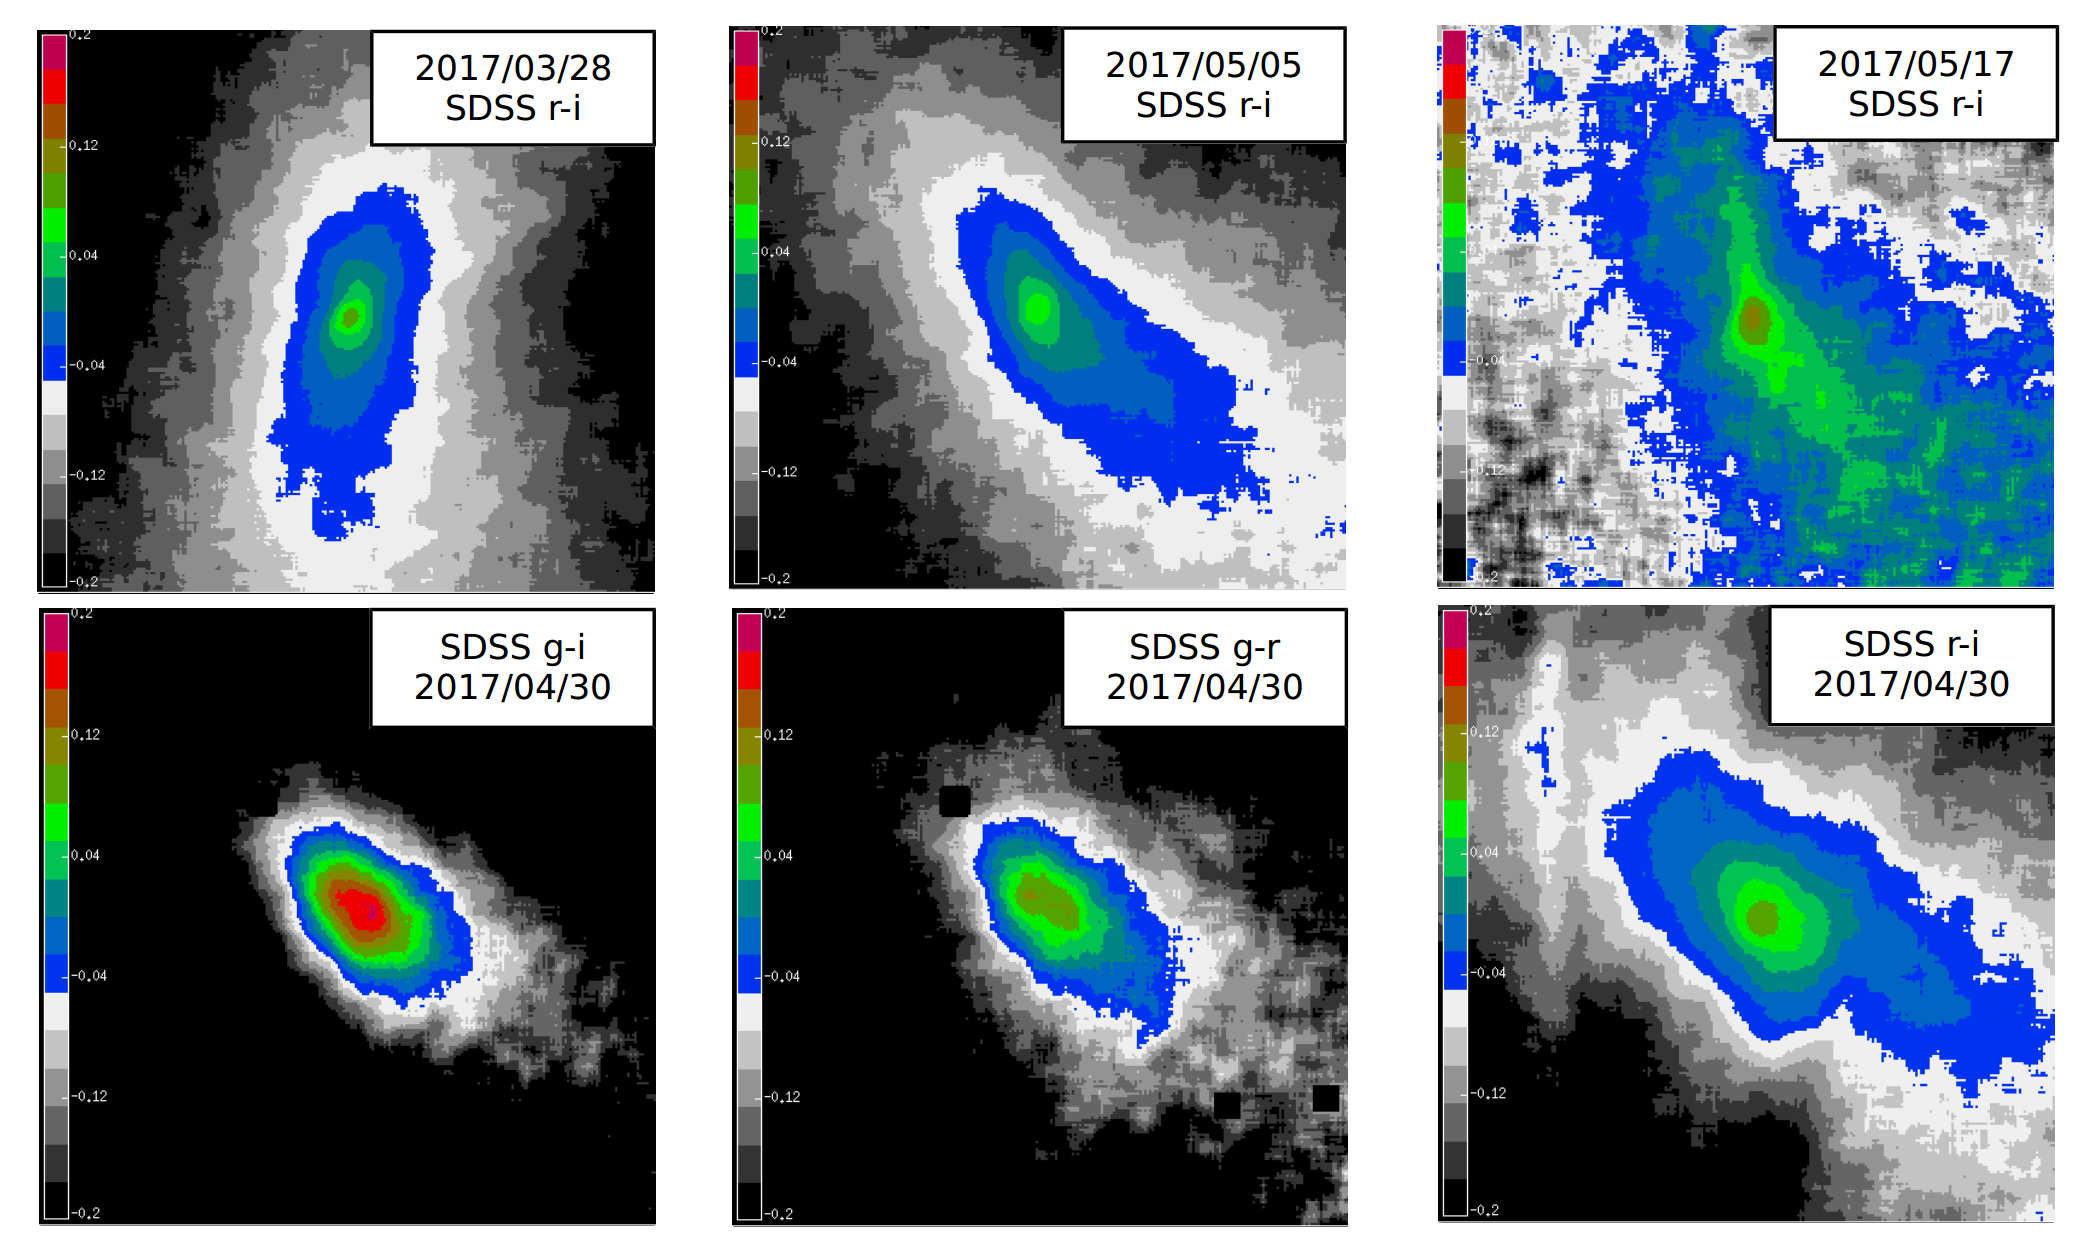
Coma color: The perihelion arc of 41P is covered by SDSS r-i color data from 2017 March 12 to 2017 June 02. Colors involving the SDSS g filter (SDSS g-r and SDSS g-i) exist for 7 nights (2017 May 01+19+22+23+25+29 and 2017 June 02). The color maps of the coma of 41P (Fig. 2) show an approximately oval shape of the isocolor lines similar to the isophote pattern of the comet for the respective observing epoch. The isocolor lines are roundish in the inner part of the coma (within a few hundred kilometers of the nucleus) and extend further into the tail direction compared to the solar direction for the more distant part of the coma. A significant gradient from red color in the coma center to blue color at larger distances is noted. In most images, coma structures are only barely noticeable in the color maps of the comet. However, it is noted that a coma jet is identified in color images from 2017 May 17 (see Fig. 2), indicating color properties of this feature that are different from the behavior of the main coma.
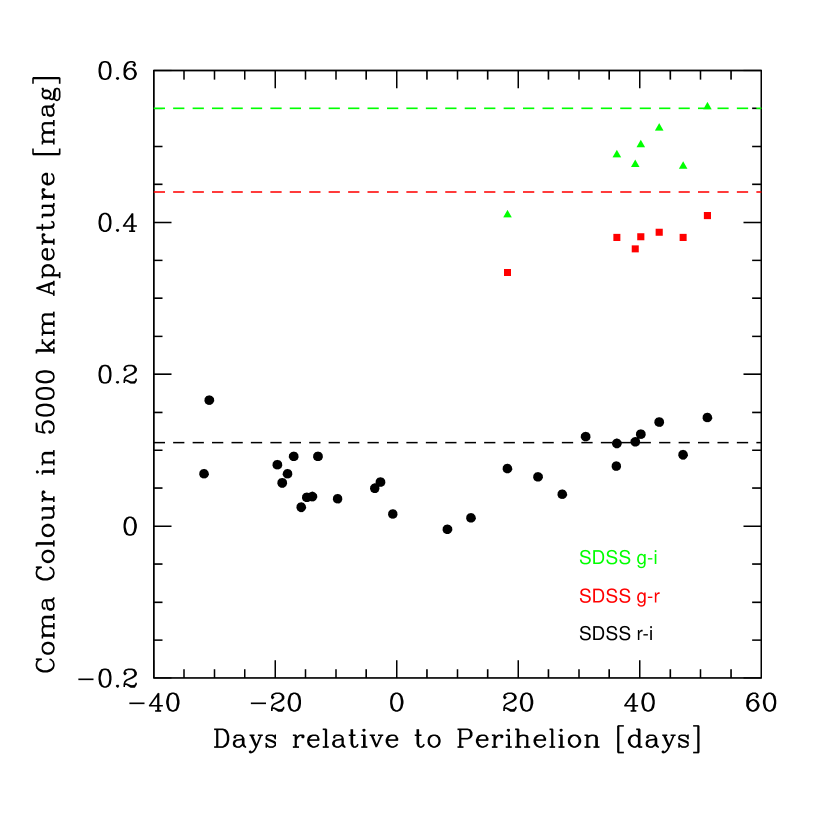
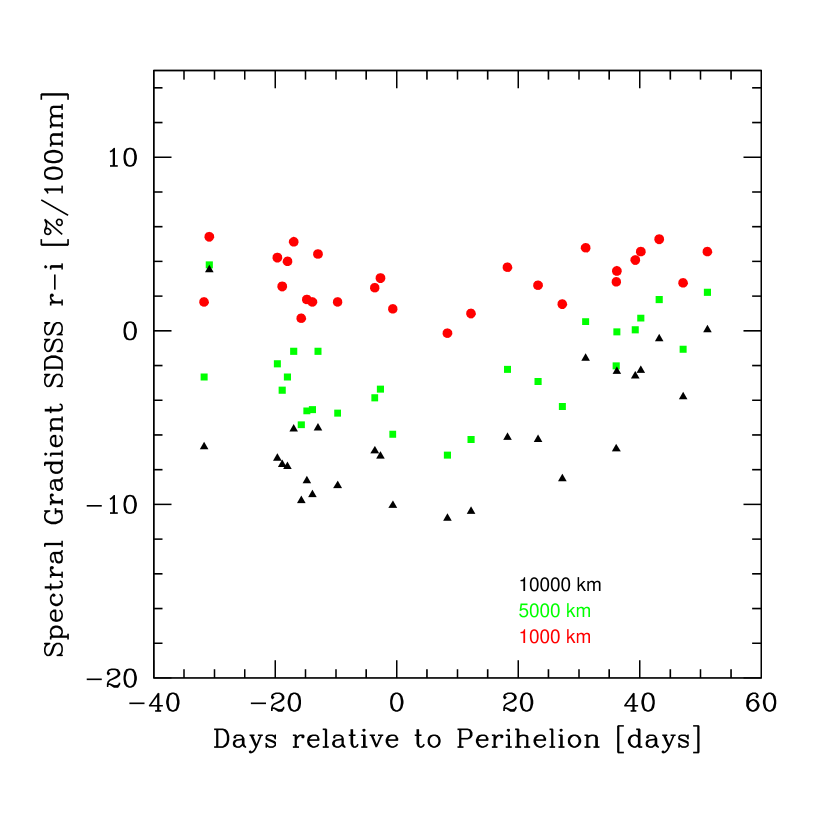
Figure 3 quantifies the findings on the colors of 41P using aperture photometry of different diameters. On different scales, the coma displays colors that are: slightly redder (for 500 and 1 000 km apertures) than solar222solar colors calculated from the Sun brightness in the respective filter pairs as given by Willmer (2018) – SDSS g-i = 0.550 mag, SDSS g-r = 0.440 mag, SDSS r-i = 0.110 mag; at about solar (for 2 500 and 5 000 km apertures), and slightly bluer than solar (for 10 000 km aperture). Within about a month before and a month after perihelion, the SDSS r-i color of the comet shows a trend of bluer slope with increasing coma aperture. The bluish trend reaches an amplitude of -0.15 mag compared to the Sun around perihelion passage of the comet (Fig. 3). This trend is more pronounced for the colors involving the SDSS g filter. A similar behavior is seen in the ring aperture results that exclude the nonzero flux contributions from the cometary nucleus. Therefore, we conclude that the likely source of the bluish colors in 41P around perihelion is light emission from gaseous species in the coma (for SDSS g: C2 and C3, for SDSS r: C2, [OI] and NH2, for SDSS i: NH2). Because of the observed trend in the SDSS colors of the comet around perihelion and the reduction of gas emission with increasing solar distance, the best values of the intrinsic colors of the dust in 41P is obtained from the observations on 2017 June 02: SDSS mag, SDSS mag, and SDSS mag for the 5 000 km aperture diameter in the coma. The mean spectral gradient varies between -2, 0, and (error is ) for SDSS g-r, SDSS g-i, and SDSS r-i, respectively; at that time the dust of 41P had close to solar colors and no significant spectral reddening. The spectral gradient for the SDSS r-i color versus aperture size is presented in Fig. 4. It is noted that the color in the central coma part of the 41P color maps, that is, where the gas contamination is lowest, shows a mean reddening in SDSS r-i of 0.09 (0.03) mag compared to the Sun, which indicates a spectral slope of nm. This value is close to the reddening found by Rosetta for dust in comet 67P/Churyumov-Gerasimenko (7.3 %/100nm for the orange/near-IR filter set; Frattin et al. (2017)). Our measurement results on the coma color of 41P illustrated in Figs. 2 to 4 suggest possible variations of dust properties with time and/or distance from the nucleus. For instance, the SDSS r-i filter colors and spectral gradients became bluer when the comet was closer to perihelion and they were also bluer with increasing distance from the nucleus. Both trends might be an effect of the gas contamination of the flux in the SDSS r and i filters used for the measurements. Taking these trends to be at least in part due to the coma dust, one could argue that dust size distributions change with distance from the Sun, favoring the enhanced presence of small dust close to perihelion, as for instance discussed in the case of comet 67P/Churyumov-Gerasimenko by Bockelée-Morvan et al. (2017). The small dust may reflect the light in the Rayleigh regime, producing a trend of bluer colors around perihelion. Dust disintegration in the inner coma can have a similar consequence on the SDSS r-i colors and spectral gradients, resulting in decreasing reddening with increasing distance from the nucleus. Slopes below unity in the radial profile of the coma flux, as described below under ‘Radial coma profiles’, could be seen as a supportive argument for the occurrence of dust fragmentation in the inner coma of comet 41P.
Luk’yanyk et al. (2019) present color measurements of 41P in broadband V and R filters. While the mean spectral slope found by these latter authors is in the range of our data of 41P, the temporal pattern of the spectral gradient shows considerable variability with amplitude, which is not seen in our results. In particular, Luk’yanyk et al. claim rapid (on timescales of 1 day) changes in the spectral slope of the comet (namely for 2017 March 3-4) and interpret this finding as being due to different dust components released by the comet from different regions on the nucleus at different times. It is noteworthy that on 2017 March 03, Trappist measurements of 41P in cometary dust filters show distinctly different gradient values (nm) compared to the results by Luk’yanyk et al. (nm), although the observations were taken just about 1.5 hours apart (with different aperture sizes). A similar discrepancy (now for identical 2 000 km apertures) exists between our data on 2017 March 24 02:25UT (nm in SDSS ri filters) and the results of Luk’yanyk et al. measured about 1.5 hours earlier (nm in Kron-Cousins VR filters). Although the modeling by Luk’yanyk et al. offers an interesting explanation for their color variations, it does not seem to explain the smoothly varying color gradients we see in 41P. In addition, it is unclear whether their model can also explain the rather different behavior of the radial flux gradients in the coma of 41P as described below or whether both phenomena have different origins.
The neutral (compared to the Sun) spectral gradient of 41P in the broadband filters is different from the typical reddening of the solid component seen in other comets (Kolokolova et al. 2004) like for instance also measured in the Rosetta target comet 67P/Churyumov-Gerasimenko at the Mt. Wendelstein observatory (Boehnhardt et al. 2016). Assuming solar colors of the dust in 41P implies that about 20% of the flux in the SDSS g filter in late April 2017 has to be attributed to contributions from the coma gas.
Radial coma profiles: Radial coma profiles were extracted from the median averaged SDSS filter images of 41P. They represent the azimuth-averaged (over 360 deg) brightness of the comet with distance from the nucleus. For a geometrically expanding coma (the expected case for the cometary dust in the inner part of the coma) the flux of the radial profile should increase linearly with aperture radius. For our 41P observations, the radial exponents are obtained for various distance ranges (1 000-2 000, 1 000-5 000, and 5 000-10 000 km) in order to assess systematic changes with distance and with time (see Fig. 5).
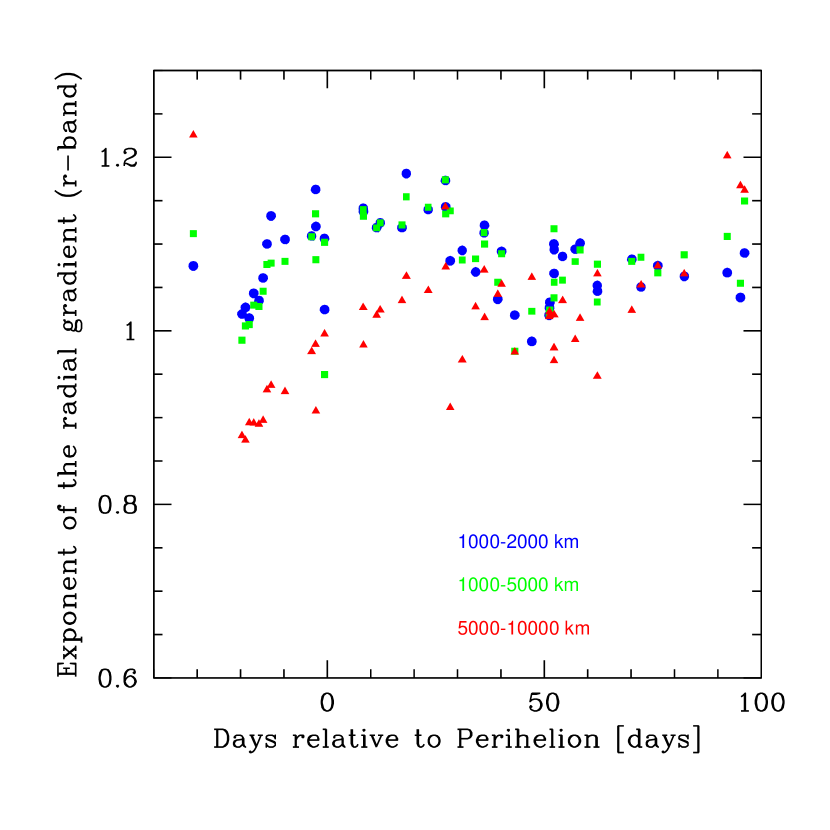
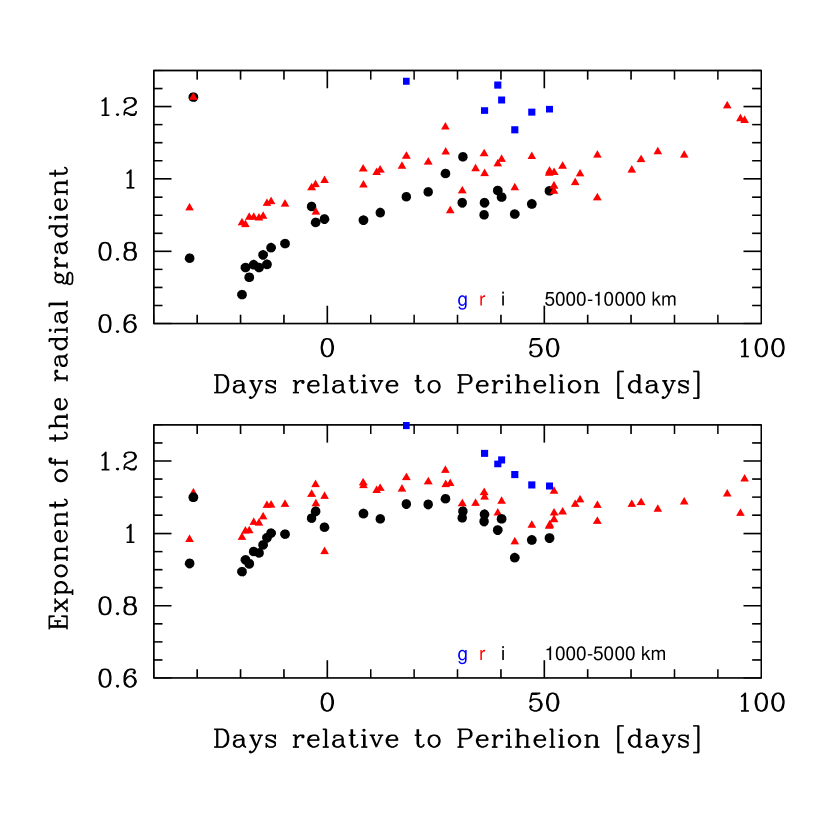
The radial exponent values obtained for distance ranges 1 000-2 000 and 1 000-5 000 km display a scatter of less than 0.03 for single nights which is attributed to data reduction artifacts, namely the incomplete removal of signatures from background objects shining through the cometary coma. The temporal evolution seen for the SDSS r filter (see Fig. 5, top panel) shows an increase of the coma gradients towards perihelion, followed by a plateau up to 40 days post-perihelion; thereafter, it gradually decreases and stabilizes to a rather constant level until the end of the observing campaign. A similar temporal behavior is also seen – at least up to about 50 days post-perihelion - for the radial gradient measured through SDSS i filter, shifted to lower slope values. We note that the shift between the coma gradients in SDSS r and SDSS i filters has a decreasing trend between about 25 and 45 days post-perihelion. Only a few nights had coma observations through SDSS g filters that show higher values of the radial coma slopes and follow the decreasing gradient trend as seen in the SDSS r filter between about 30 and 55 days post-perihelion (see Fig. 5, bottom panel).
The increasing and decreasing trends in the radial coma slopes, respectively, before and after perihelion are attributed to the increasing and decreasing gas contamination in the SDSS filters during the perihelion passage of the comet. This interpretation is in line with that of the color variations of the coma around perihelion. It is noted that the radial exponents of the SDSS g filter images are in general higher than those for the SDSS r and SDSS i filter images taken at the same epochs; they also remain steeper at larger radial distances. This can be explained by the presence of C2 gas in the SDSS g filter, which has prominent emissions in this filter pass band and also a large scale length for photo-dissociation compared to the NH2 species that might be the dominant contaminants in the SDSS ri filters. The radial exponent of the coma measured in SDSS r filter images remained quasi-constant as of about 60 days post-perihelion and also the coma slopes seen in SDSS g and SDSS i filters tend to converge towards those of the SDSS r images. Both findings are indicative of the decreasing influence of the coma gas on the measured fluxes of the comet. These findings also support the interpretation that the colors of 41P measured in early June 2017 are representative of the coma dust.
It is noted that the radial exponents of the coma measured in SDSS i filter before perihelion (as well as those around 50 days after perihelion) are below unity. The exponents in the radial coma profile found for the very inner part of the coma (see Tab. 6 described in section 3.2) also indicate a decrease of the radial exponent from about unity to values of around 0.9 and below when the comet was approaching perihelion as well as for about a month after perihelion passage. Thereafter, the exponent values were found to be mostly between 0.9 and 1.0. This behavior may indicate additional dust production in the coma, for instance by dust disintegration very close to the nucleus of 41P (for possible dust fragmentation scenarios see Boehnhardt et al. 1990). A similar behavior, though more pronounced in amplitude and different in its temporal profile, was seen in ground-based images of comet 67P/Churyumov-Gerasimenko (Boehnhardt et al. 2016).
Coma Activity: The dust activity of the comet is represented by the parameter of the coma (A’Hearn et al. (1984)). This parameter provides a quantitative equation that connects the measured coma flux with the projected aperture radius at the distance of the comet, the so-called filling factor f of the cometary dust in the light path, and the albedo a of the dust (which is assumed to be constant for all dust grains):
| (1) |
where, and r denote the Earth and Sun distance of the comet, respectively, and and are the fluxes of the comet and Sun, respectively, in the filter band used.
For the Wendelstein observations of 41P, the values around perihelion contain small contributions from gaseous species in the coma (possibly up to about 0.15 mag) in SDSS r filter images (see paragraphs on the coma colors and radial coma profiles). Furthermore, nucleus reflected sunlight may also contribute to the total aperture brightness of the coma. For 41P, a nucleus radius of 700 m and an albedo of 0.04 together with a linear phase angle correction (0.03 mag/deg) is applied. Different phase functions for the dust can be applied as published in the literature (the parameter values applied here are given in parenthesis): A linear phase angle correction (Lamy et al. 2004, parameter: 0.04 mag/deg) or slightly more complex ones as for instance used by Schleicher et al. (1998, parameters: 0.01807, -0.000177) and Schleicher (2010, phase corrections taken from table file), Müller (1999, parameters: , ) or the HG-type phase correction after Bowell et al. (1989, parameters: 3.332, 0.631, 0.986 for Bowell A and 1.862, 1.218, 0.238 for Bowell B). From Fig. 2 of Moreno et al. (2018), we obtained approximate values for the phase function of cometary dust at comet 67P/Churyumov-Gerasimenko measured by the OSIRIS camera on board the Rosetta spacecraft. The data were normalized to unity at zero phase angle (extrapolation value 6.5 in the notation of Fig. 2 in Moreno et al. (2018)) and were then used for an estimation of for comet 41P. Linear interpolation between the measurement points of the Rosetta phase function at 20, 30, 40, 50, and 60 deg is applied to obtain the phase function for the phase angle values of our 41P observations.
| 41P | af Exponent | af Exponent | af Exponent | af Exponent |
|---|---|---|---|---|
| Activity | corrected for | corrected for | corrected for | corrected for |
| Nucleus brightness | no | no | yes | yes |
| Gas contamination | no | yes | no | yes |
| linear | ||||
| Schleicher (1998) | ||||
| Schleicher (2010) | ||||
| Müller | ||||
| Bowell A | ||||
| Bowell B | ||||
| Rosetta |
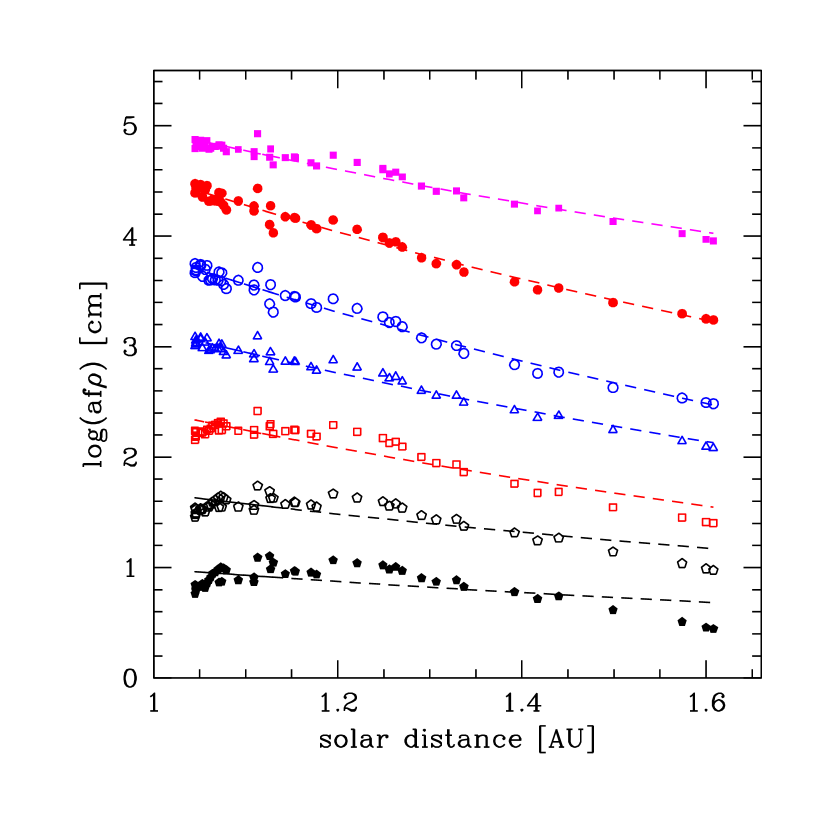
Figure 6 shows the data obtained for the coma brightness measurements of 41P through the SDSS r filter in a 5 000 km diameter aperture. The dashed lines in the figure represent fits to the values for the individual phase functions used, in all cases assuming that a single radial exponent describes the evolution of the dust activity of the comet over the duration of the whole observing campaign. Corrections for gas contamination (about 15% for gas emissions in the SDSS r filter band) and for the nucleus brightness are applied. Table 2 lists the activity exponents with solar distance obtained from fits to the results for the various phase functions applied, with or without corrections for gas contamination and reflected light from the nucleus. The fits for the linear, Bowell A/B, and Rosetta phase functions have the highest confidence levels (0.95 and higher) and suggest that a single-exponent parameter (though of different value depending on the phase function) is sufficient to describe the activity of comet 41P over an extended part of its perihelion passage. The Rosetta phase function has the lowest radial exponent value, while the linear and Bowell A phase functions have the highest exponent values. It is noted that the Bowell phase function is derived for atmosphereless asteroid-like bodies and applying it to cometary dust can at least be debated. The linear phase function was found not to be appropriate for the dust in comet 1P/Halley (Meech & Jewitt 1987) and is likely not a well-suited description of the light scattering by cometary dust over a wider phase angle range. The data using the Schleicher and Müller phase functions display a larger scatter to the fit lines and have considerably lower confidence parameters (see Fig. 6). Here, improvement might be possible with fits in segments of radial distances. Taking gas production rates, if measured in parallel, as a reference for the dust activity of the comet can provide a useful guidance. However, careful considerations need to be applied for variable ratios in the gas and dust activity of comets that may change with time and distance from the Sun. Bertini et al. (2017) performed an assessment of the extent to which the Rosetta phase function values determined at comet 67P/Churymov-Gerasimenko are suitable for the interpretation of dust measurements of other comets; they found cases with good and less good agreement between measurements and modeling results.
The activity of 41P in the outbound leg of its orbit was found to be steeper than that of the Rosetta target comet 67P/Churyumov-Gerasimenko (Boehnhardt et al. 2016; Snodgrass et al. 2016), assuming that the linear, Müller, and Bowell A and B phase corrections can be applied. For the Schleicher phase function, the activity exponent versus solar distance of 41P is smaller than for 67P, although a single parameter description may be far from optimum for 41P (and for 67P as well). Given that the phase range of the 41P observations is larger than for other comets with a measured coma activity, it is not possible to draw a firm conclusion on the dust activity profile of the comet versus solar distance. This is because the phase angle corrections have a strong impact on the estimations of the comet and cannot be independently and securely determined from our data. Taking the gas activity into account (Moulane et al. 2018), a behavior of the dust activity with a Schleicher-type phase function appears to be plausible for 41P. However, this argues for a considerable activity drop of the comet around perihelion while the phase angle changed only by about 10 deg and a smooth light curve behavior is observed (Fig. 1). It is noted that, independent of the phase angle correction applied, the activity of 41P is several factors smaller than that of 67P (see Boehnhardt et al. 2016), taking the perihelion distance of the latter (1.25 AU) as a reference. This difference may reflect the ratio of the active surface area of 67P displayed to solar illumination to that of 41P, because their equivalent radii differ by a factor of between about three and four (see section 3.2).
3.2 Nucleus brightness and size
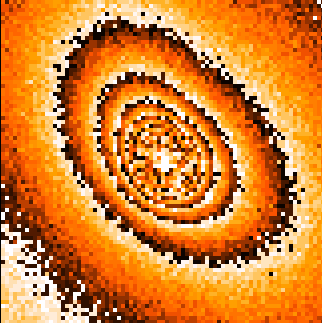
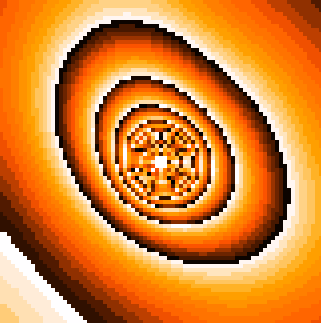
As described in section 2.3, the nucleus size of 41P was estimated via a fit of the radial brightness profile in the inner coma of the comet, that is, from the measured light distribution profile within 40 pixels (8 arcsec) around the central brightness peak in the coma. The best solution was found with a set of forward calculations with iterative improvements of the fit parameters. The usage of a Moffat-type PSF considerably improved the fit quality for the radial profile over that of the Gaussian PSF. The four nominal fit parameters were treated as follows: The FWHM of the image quality was determined from the width of star trails in the comet images and it was set to the value as obtained for the respective observing epoch of 41P. Variations of this fit parameter by up to 0.05 arcsec only very rarely improved the fit solution. The parameter of the Moffat function could usually not be directly determined a priori from the images, which was due to low signal levels in the stellar PSF wings and in part to the presence of the cometary coma light in the field of view. Hence, was a free fit variable, usually varied in steps of 0.2 to 0.3. As expected, the parameter of the PSF is most sensitive to the radial profile in the wing range of the PSF; in our cases, typically to the radial profile from about 1.5 to 3 arcsec from the nucleus (7-20 pixels from the nucleus). The Moffat -values obtained are between 2.5 and 5, with a median value of 3.2, and the vast majority are between 3 and 4, which is inside the expected range for a Kolmogorov-type atmosphere. The radial exponent of the coma profile was typically adjusted via the slope of the radial profile in the distance range of 4 - 8 arcsec (20-40 pixels) from the central brightness peak. The nucleus brightness contributed mostly to the central part of the radial profile, that is, to the innermost 2 - 3 arcsec (0-15 pixels from the nucleus). Figure 7 exemplifies results of the fitting process for the inner coma and the nucleus brightness of comet 41P for the observations on 2017 May 09.
The data set analyzed for the nucleus size estimation comprises 82 median-averaged images of 41P (7 through SDSS g, 47 through SDSS r, 28 through SDSS i) from observations of the comet on 42 nights between 2017 March 12 and 2017 July 16 (Tab. 6). In total, 65 nucleus brightness estimations were achieved for 35 nights (4 for SDSS g, 39 for SDSS r, 22 for SDSS i). Exponents for the radial profile in the inner coma were obtained for most images. The letters ‘ne’ in Tab. 6 indicate observing epochs for which the nucleus brightness estimation was unsuccessful. In these cases, the seeing caused a wider spread of the actual nucleus flux in the PSF such that it was close to (or below) the sensitivity limit in the radial profile of the respective night, that is, the nucleus signal was in the noise of the coma profile.
Absolute magnitude of the nucleus: It is noted that the method used to determine the nucleus brightness through the cometary coma implicitly assumes optically thin conditions for the coma. For 41P we have no direct proof in support of this assumption. However, the agreement of our results with alternative size estimations for this nucleus as well as the detection of a variable nucleus brightness of the comet (see below) can be seen as an indication in favor of the optically thin case for 41P. Attempts to determine the extinction in cometary comae – mostly due to the dust released by the nucleus – used close appulses of background stars to cometary nuclei. The results are controversial, both in quality and quantity; for a discussion see Lacerda & Jewitt (2012). Measurements of these latter authors at comet 17P/Holmes indicate an optical depth of 0.04 in 1.5 arcsec distance from the nucleus, from which an optical depth of between 13.3 and 0.19 is concluded for the nucleus region, depending on the value of the radial exponent in the inner coma (1 and 0.35, respectively). For comet 17P/Holmes, the dust-production rate at the time of the observations ( kg/s) was higher by a factor of more than 3 000 than the peak dust production rate (110 kg/s) estimated for 41P by Pozuelos et al. (2018). This may indicate that optically thin conditions were prevailing in the inner coma of 41P by the time of our observations of the comet.
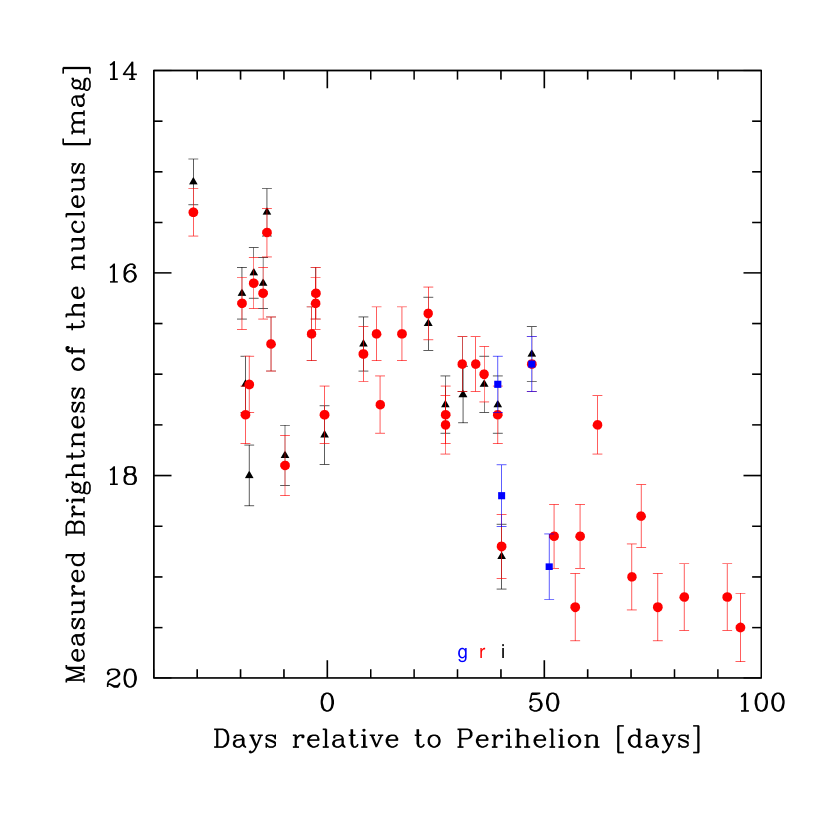
The results achieved for the nucleus brightness and for the gradient exponent of the inner coma of 41P are compiled in Tab. 6. From the apparent nucleus brightness (Fig. 8 top panel) the absolute nucleus brightness is calculated for 1 AU Sun () and Earth () distances and zero-degree phase angle (), assuming a linear phase angle function with a constant correction factor () of 0.03 mag/deg in all filter bands:
| (2) |
where represents the estimated nucleus magnitude at Sun and Earth distance and , respectively, and phase angle of the comet. We note that in the literature on photometric size estimations, phase correction factors of 0.02 (Snodgrass et al. 2013) to 0.04 mag/deg (Lamy et al. 2004, and references therein) are typically applied for cometary nuclei. More recently, Bertini et al. (2017) provided a graphical representation (see Fig. 9 in their paper) of the pre- and post-perihelion phase function for the nucleus of the Rosetta target comet 67P/Churyumov-Gerasimenko which allowed us to obtain an approximate average phase correction factor of 0.043 mag/deg (for phase angles between 0 and 70 deg). Using our values in Tab. 6 and assuming a phase correction factor of 0.03 mag/deg for 41P, the magnitudes of the nucleus for the SDSS r filter vary between 17.8 mag and 20.3 mag, for the SDSS i filter between 17.6 mag and 20.4 mag, and for SDSS g between 18.0 mag and 20.0 mag (see Tab. 6 and Fig. 8, bottom panel).
Nucleus size: The equivalent radius (in m) for the nucleus of 41P can be estimated using the following equation.
| (3) |
where is the magnitude of the Sun in the respective filter band at 1AU and is the geometric albedo of the nucleus. For comets, a typical albedo of 4% can be assumed (Lamy et al. 2004), whereas for the Rosetta comet 67P/Churyumov-Gerasimenko an albedo of 6.5% is measured for a wavelength of 649 nm (Fornasier et al. 2015). For the ‘AB’ magnitudes for the SDSS gri filters by Willmer (2018) can be used ( mag in SDSS g, mag in SDSS r, mag in SDSS i). The equivalent radii determined for 41P vary between about 800 m and 220 m (Tab. 6 assuming = 0.03 mag/deg and A = 0.04).
| 41P | Radius | |
|---|---|---|
| Nucleus | (mag) | (km) |
| SDSS g | 640 (560-730) | |
| SDSS r | 560 (480-640) | |
| SDSS i | 590 (510-680) |
The median values of the absolute brightness of the nucleus in the SDSS gri filters (Tab. 3) lead to values of the equivalent radii of 41P of between 560 and 640 m (for geometric albedo 0.04 and phase correction factor 0.03 mag/deg). These radius values of 41P are numerically below that given by Tancredi et al. ((2000; radius = 700 m), but they appear to be compatible considering the uncertainties on both sides. We would like to mention that from our 2017 May 09 data we obtain an equivalent radius of about 520 to 560 m for the nucleus of 41P, a value that is compatible with the lower limit radius of 450 m as measured from radar observations of the comet on the same day (Howell et al. 2017). Applying the Rosetta values for the albedo (0.065) and phase function (0.043 mag/deg) to our measurements for the nucleus of 41P results in median H(1,1,0) brightness of 18.3, 18.0, and 17.7 mag for SDSS gri filters, respectively, corresponding to about 660, 600, and 650 m for the equivalent radius of the nucleus.
Axis ratio of the nucleus: According to Zappala et al. (1990), the light curve amplitude of asteroids, or of bodies with irregular shape and light scattering depending on structural parameters on microscopic and macroscopic scales in general, depends on the phase angle at the time of observation. This dependency was further analyzed by Gutiérrez et al. (2006) and both groups of authors arrive at a relationship between the light curve amplitude m and the phase angle (for deg) of
| (4) |
where and are the light curve amplitude at phase angles and 0 deg, respectively. The parameter should fall in the range 0.012 to 0.030, depending on the applicable light scattering properties. It is noted that eq. (4) implies that variability is obtained for constant observing geometry of the object.
Comet 41P has a relatively slow rotation period that was increasing considerably from about 1 day to more than 2 days in the course of our observing campaign (see Section 1 and the discussion in the paragraph on ‘Nucleus rotation’ below). In order to sample the amplitude of the brightness variability of 41P, we scanned our nucleus brightness estimations for variability in a time frame of 7 days. This way the impacts on the nucleus brightness due to the changing observing geometry with time should be no more than 0.2 mag, that is, on the order of the uncertainty on the nucleus brightness estimations obtained from the observations. We found maximum variability of the brightness of the nucleus of 2.3 mag in SDSS r filter for the time interval 2017 March 26 to 2017 April 03.
The phase angle values for the maximum variability of the nucleus in SDSS r ( deg) fall outside of the range for which eq. (4) should be valid. Nevertheless, we take this relationship and its known parameters as a zero-order approximation for an estimation of the axes ratio of the comet. Here, provides a lower limit for the main axis ratio of the nucleus (approximated as being of ellipsoidal shape with axes ) according to
| (5) |
Taking the above-mentioned mean value for the SDSS r filter as a reference, the nucleus of 41P appears to have a minimum axes ratio of 2.1 (for ) to 3.4 (for ). This result indicates a prolate or oblate nucleus shape for comet 41P with a value for the principal axes ratio that is in the upper range of or slightly beyond what has been found for cometary nuclei so far (see Lamy et al. 2004; Sierks et al. 2015, who give a/b ratios between 1.67 and 2.5 for four comets). We note that among small asteroids (diameter 150 m), light curve amplitudes of 1.5 mag and higher (equivalent to similar axis ratios as determined for 41P) seem to be rare (e.g., two cases in Fig. 5 of Pravec et al. 2002). On the other side, the likely interstellar object 1I/2017 U1 Oumuamua was found to have a very elongated shape with an axis ratio of between 7 and 10 (Meech et al. 2017).
Nucleus rotation: Bodewits et al. (2018) present observational results of 41P, namely time-variable coma structures and the UV light curve of the inner coma, that allow interpretation of the nucleus rotation period, which changed from about 20h in early March 2017 to around 46-60h in early May 2017. This finding is supported by results from Moulane et al. (2018) using time-variable gas jet structures seen in the coma within about a month of perihelion passage of the comet. Schleicher et al. (2019) obtained a quadratic approximation over time for the rotation period P(t) of 41P from an analysis of gas jet features in the cometary coma. These latter authors found ( time since 2017 March 01 0 UT). This relationship should describe the period increase during the time interval used for the jet analysis, that is, between about mid-March and early May 2017.
Our data (see Tab. 6 and Fig. 8) show that the apparent and absolute brightness of the nucleus of 41P varied on timescales of a day to a few days. The amplitude of the brightness variability was larger before and during perihelion than towards the end of our observing campaign, i.e., beyond about 50 days post-perihelion. Our attempts to fit the variability in the brightness of the nucleus with a constant or changing (linear and quadratic functions were applied) rotation period gave inconclusive results, most likely because the changing light scattering scenario (illumination and viewing geometry, body shape, and light scattering properties of the nucleus of 41P) was not considered.
3.3 The dust and gas tail
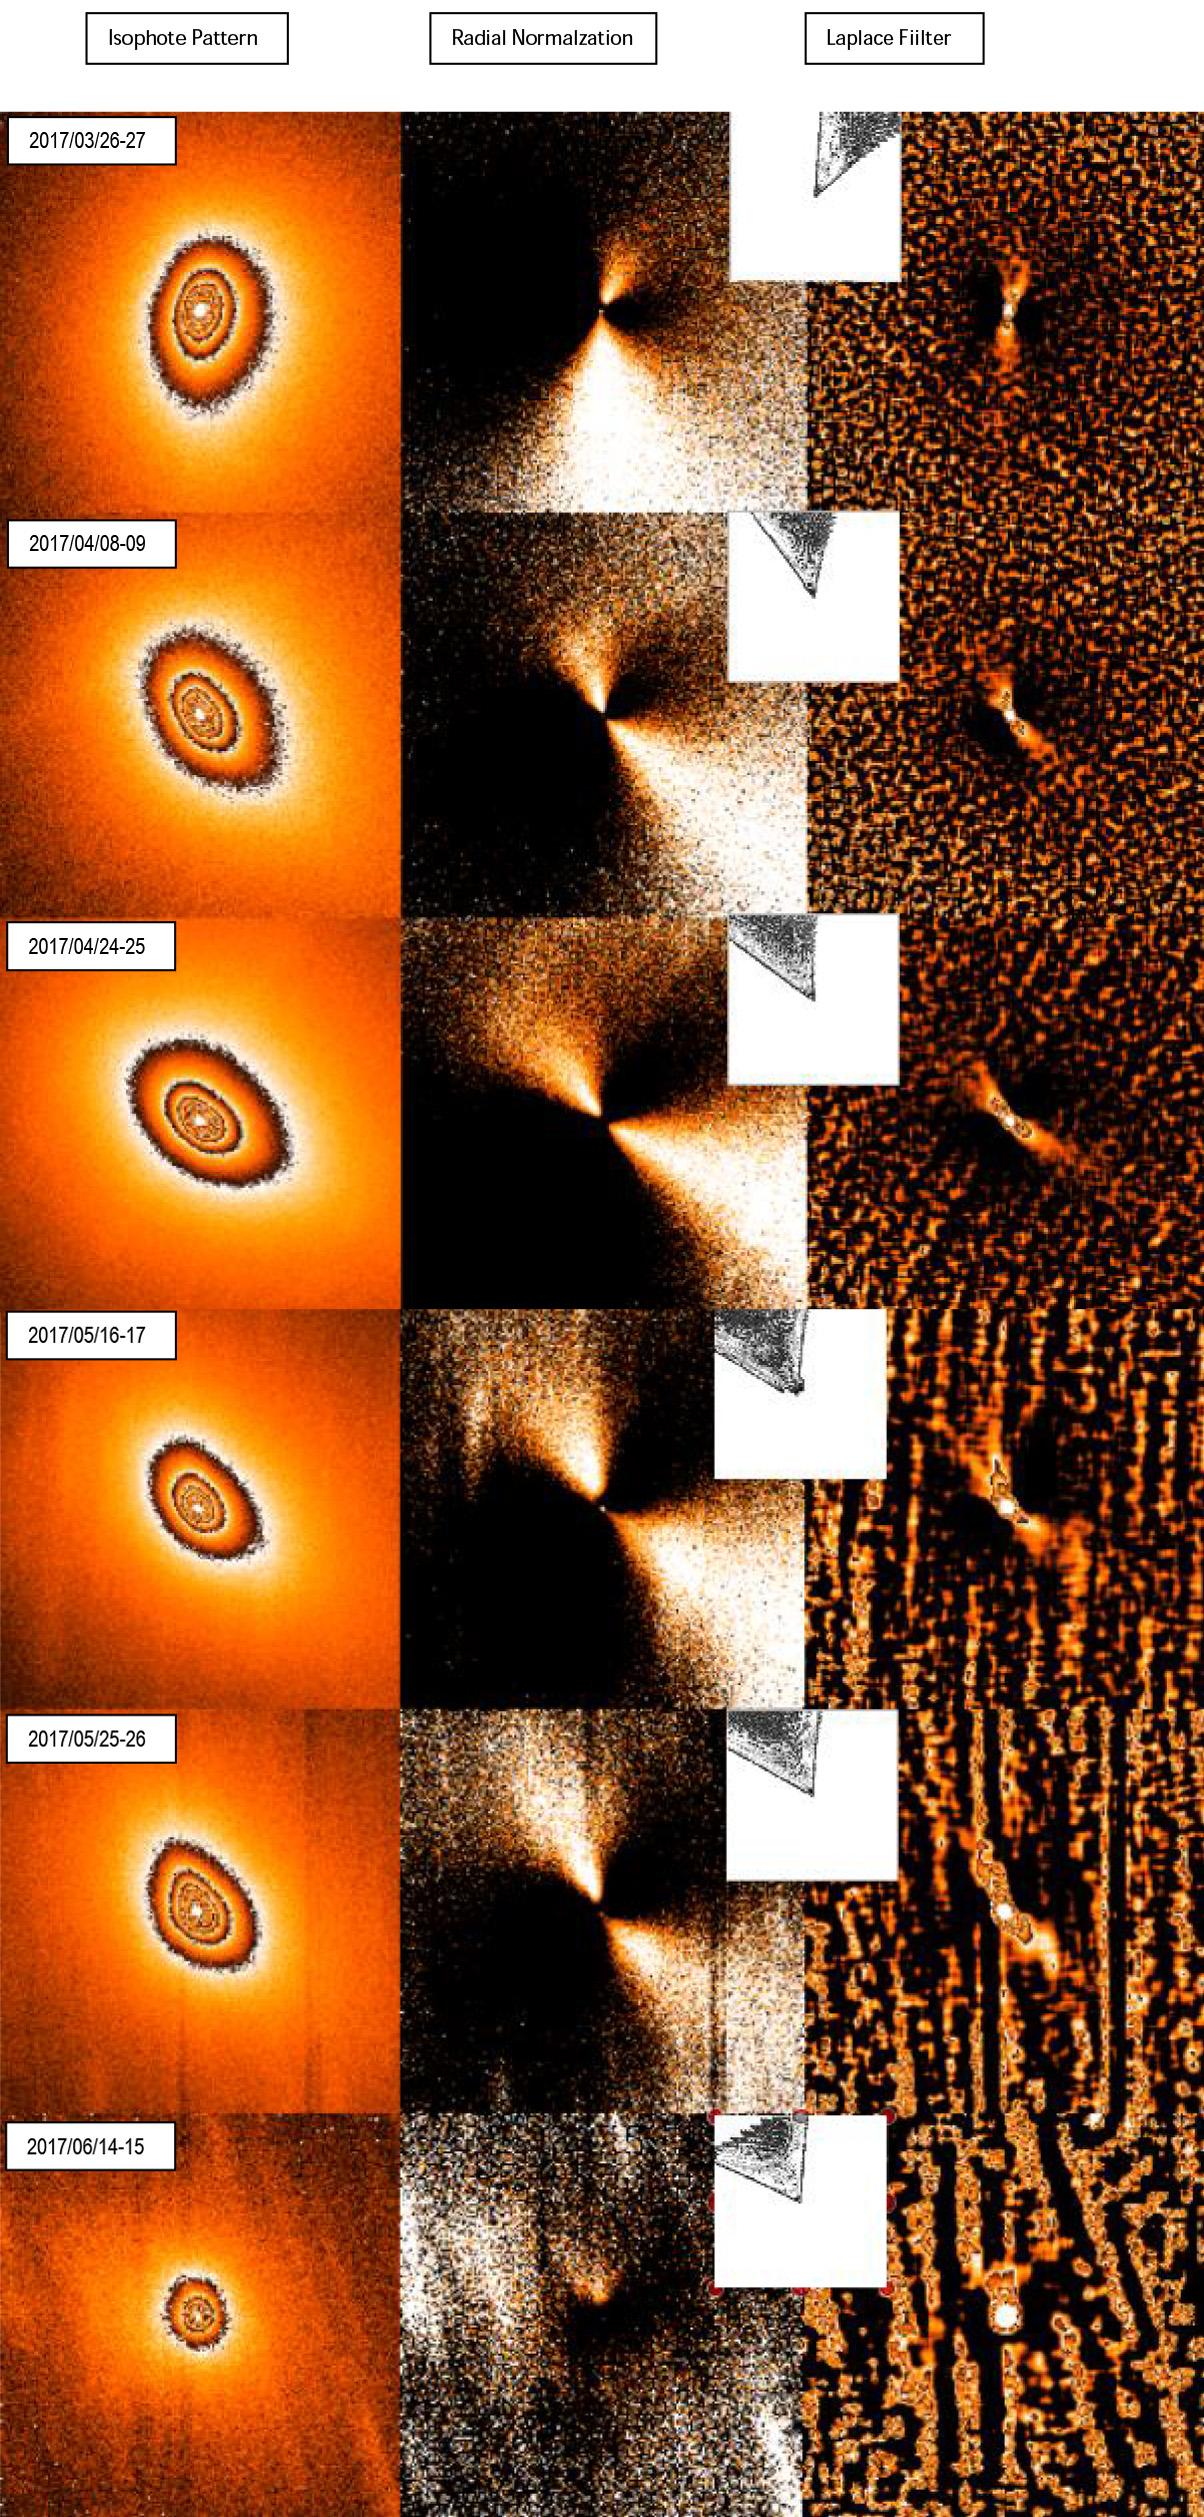
The dust tail of 41P is noticeable in the calibrated images by the southward extension of the isophotes and by a broad linear structure in the radially normalized and Laplace-filtered images of the comet (Figs. 9, 11, 12). The tail orientation represented by its near-nucleus position angle (Tab. 7) moved from approximately the southern direction in March 2017 towards the southwest in April and May 2017 and as of the end of May 2017 back over southern directions towards east-southeast in mid July 2017. The relatively fast change in the tail position angle as of mid June 2017 is related to the opposition passage of the comet when the comet changed from the morning to the evening sky and the tail flipped orientation in the opposite direction towards the Sun. In Tab. 7, the Sun direction with respect to the nucleus, represented under column label ‘PA r vector’, indicates the direction where the recently emitted (within days to 2 weeks) and radiation-pressure-sensitive dust is found in the tail region of the comet. Old and radiation-pressure-insensitive dust released months to years before the observing epoch is found closer to the position angle of the projected velocity vector (column ‘PA v vector’ in Tab. 7).
Since the near-nucleus position angle of the tail structure in 41P aligns (within about 5 deg) with the anti-solar direction (see column ‘PA r – tail’ in Tab. 7) while it is far from the direction of the old and heavy dust (see column ‘PA v – tail’ in Tab. 7), we conclude that the broad linear structure in the southern hemisphere represents radiation-pressure-sensitive dust that was only recently emitted from the cometary nucleus. Around opposition on 2017 July 03, no signature of the dust tail is visible in our images. At that time, the view of the tail from Earth was mostly in the radial direction (slightly below the orbital plane of the comet), and it became projected behind the coma of the comet that was also seen mostly front-on. No indication of a trail-like feature is found in our images of the comet, in particular not at the beginning or towards the end of the observing campaign, when Earth was not far above the orbital plane of the comet. These findings may indicate that heavy dust may not be abundant in that comet. However, quantitative constraint of this statement requires proper dust dynamics and light scattering modeling.
Signatures of the plasma tail of comet 41P are not apparent in the images. These can appear in approximately anti-solar direction in the form of tail rays and narrow, straight, and/or kinked features with embedded isolated substructures (see Boehnhardt & Birkle 1994). Such signatures should display fast (within hours) changes in position and geometry and should be most visible in the SDSS g and r filter images of the comet (due to emission bands of CO, CO+ and H molecules).
3.4 Structures in the cometary coma, active regions and rotation axis of the nucleus
To search for and analyze morphological structures in the coma of 41P we used the enhanced (Laplace-filtered and radially normalized; see section 2) versions of the individual and combined (median and mean averaged) images of the comet.
From the images of the more than four-month observing campaign of 41P, we identified the repeated occurrence of a coma fan, labeled ‘Fan A’ in Tab. 8, and of several jet structures, labeled feature EJ and WJ in Tab. 9. Since the coma features are seen in the SDSS gri filters that cover a wide wavelength range, we assume that they are due to the dust distribution in the coma, although gas contribution to the measured coma light may be present (see sections 3.2). In support of the interpretation as dust signatures, we note that the features analyzed here show in part a rather collimated nature and are best modeled by expansion speeds of far below the speeds of 100 m/s typical for cometary dust.
We analyzed the nature of the respective coma features using dust coma simulations performed with the cometary coma and tail modeling software developed and described by Beisser & Drechsel (1992). This Monte-Carlo-type software allows calculation of the brightness distribution of the cometary dust coma and tail via a Finson-Probstein approach (Finson & Probstein 1968). Coma structures can be simulated through dust released from individual active areas on the rotating nucleus. Apart from the physical parameters of the dust (emission velocity, radiation pressure sensitivity, activity profile daily and with solar distance), important key parameters of the model are the attitude of the rotation axis and the location of active regions on the nucleus. The rotation axis is represented by the obliquity angle towards the orbit pole direction of the comet and the rotation angle of the meridian at the time of perihelion. An active region is defined by its nuclear longitude and latitude. The model assumes simple rotation of a spherical nucleus. As the rotation period of 41P changed considerably over time (Schleicher et al. 2019), the results of the model software are restricted to the orientation of the rotation axis and the latitudes of active areas on the nucleus. Longitude estimations for these regions were not possible in the case of 41P.
The comparison of the simulation results is performed by finding a best possible match of the near-nucleus position angles of a given coma feature in the available images. For the coma fan, the opening angle of the feature, measured in radially normalized images of the comet, is also used. The opening angle geometry is determined from position angle measurements of the structure at 2 000 km projected distance from the nucleus where it is 5% above mean coma flux level at this distance. Beyond that, the overall geometry and appearance of the simulated coma structure are also compared with the observed feature to check overall consistency. The matching process makes use of simulation results that systematically iterate the parameters of the rotation axis and of the location of an active region on the nucleus. The best-matching result implies an uncertainty of better than 10 deg for the orientation of the rotation axis and of close to 5 deg for the obtained information on the location of active areas. Position-angle measurements of imaged coma features have estimated uncertainties of 3 deg, except for very weak and/or low-contrast features where this may be two to three times higher.
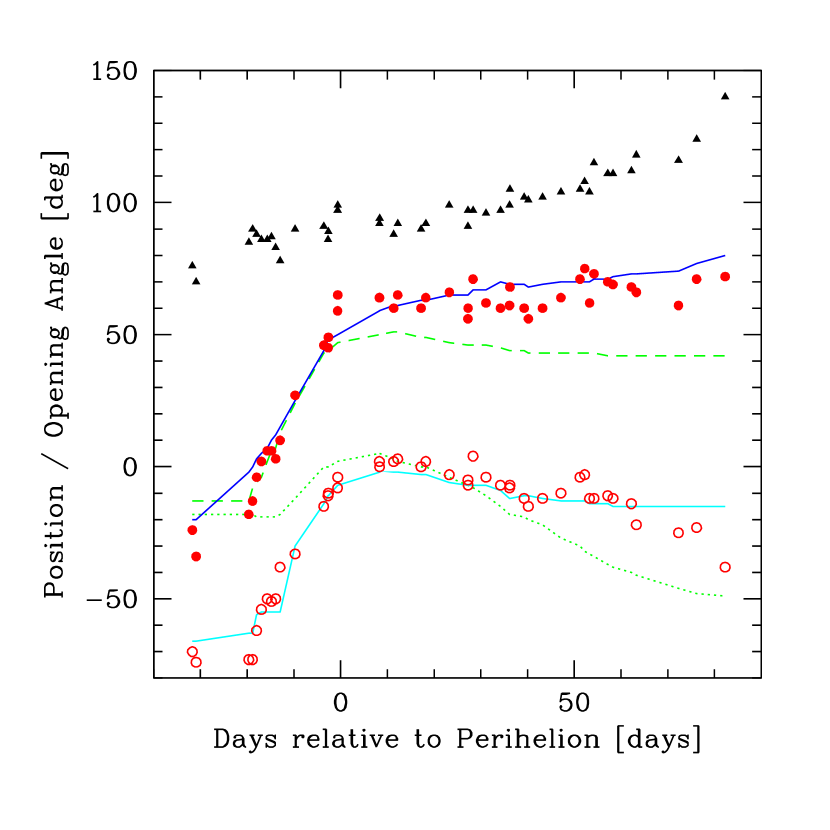
Fan A (Figs. 9+10, Tab. 8): This conical structure in the sunward coma of 41P is seen at all available observing epochs except on nights 2017 March 10-11, 2017 June 21, and 2017 July 13+16+17. The nondetection of the fan in March 2017 is most likely a consequence of the reduced sensitivity of the 3KK detector (in the images of this night only the very center of the coma is visible), while that on the nights in June and July 2017 might be due to the reduced brightness contrast of the fan and enhanced disturbances from the very crowded star background in the images. Fan A appeared (see Fig. 9) in the northwestern coma quadrant in March 2017. It swung over North into the northeastern coma part in early April 2017, where it remained until the first week of May 2017, when it started to drift back towards the northern coma section. During the observing interval a continuous increase of the fan opening angle from about 40 to 110 deg is noted (Tab. 8 and Fig. 10). Fan A extended to maximum projected distances of up to 8 000 km from the nucleus in March to May 2017 and up to 4 000 km in June 2017. Maximum brightness excess in the fan cone was 25-30% above the mean coma background in March to May 2017; thereafter, it reduced first to 20% and then to 10%. Fan A displayed time variable fluctuations in its intrinsic brightness profile, that is, linearly extended fan sections of maximum brightness varied in position angle over time, as did the overall shading of the brightness distribution in the fan. This variable appearance might be due in part to jet structures originating from local areas on the rotating nucleus for individual nights projected into the position angle range of fan A.
The forward modeling of fan A showed immediately that for the slow rotation period of 41P in March and April 2017 as determined by Bodewits et al. (2018), Moulane et al. (2018), and Schleicher et al. (2019), localized regions of enhanced activity over a few degrees extension on the nuclear surface result in narrow collimated jets that do not smear out to a fan feature of quasi-continuous and wide angular extension. Hence, fan A must come from a rather extended source region of enhanced nuclear activity. The simulation results that best match the measured geometry of the observed coma fan (Tab. 8) were obtained for a rotation axis orientation with 52 deg obliquity towards the orbital plane of the comet and about 50 deg rotation angle for the perihelion meridian of the nucleus. The active region extends beyond about +50 deg latitude, and it may cover the whole range up to +90 deg latitude and all longitudes. This scenario is highly compatible with the appearance of a rather homogeneous brightness distribution within the fan as well as over time. Individual localized spots of even further enhanced activity may produce time-variable jet features and brightness variations (shading) that are noticed inside the fan area. It is noted that from the appearance of fan A, it is not possible to firmly distinguish the sense of rotation of the nucleus. This implies that the mirrored rotation axis with 128 deg obliquity and 230 deg rotation angle for the perihelion meridian also produce acceptable fan shapes and geometries. The sense of rotation of the nucleus is again addressed in the last paragraph of this section as well as in section 3.5.
The best-matching solution explains the overall geometry of coma fan A as a large active region on the nucleus and a rotation axis attitude, which both remained constant in time (within our uncertainty limits), at least from mid-March to mid-June 2017. Solutions for enhanced rotation of the nucleus might also be possible but were not explored here. It is noted that the constant rotation axis solution presented above has difficulties in reproducing the wide opening angles of fan A measured as of mid-June 2017 (see Tab. 8 and Fig. 10). Although the fan contrast towards the end of our observing campaign is at a low to marginal level, the possible deviations between measured and modeled fan geometry might be an indication that at that time the rotation axis of 41P may have been in an enhanced state, as was speculated by Schleicher et al. (2019).
From the analysis of the Trappist observations of 41P, Pozuelos et al. (2018) found a rotation axis orientation with an obliquity of 25 ( 15) deg and a rotation angle of the meridian at perihelion of 5 ( 3) deg. These latter authors also argue for the presence of a large-scale region of enhanced activity extending beyond 45 ( 10) deg north on the nucleus. Using this information for simulations of the appearance and geometry of a resulting fan at the epochs of the Mt. Wendelstein campaign on 41P confirms the overall trend in the orientation of fan A. However, it is noted (see Fig. 10) that the width of fan A tends to be narrower and fan edges are shifted towards the west compared to the ones seen in our images. Whether these deviations can be compensated by a time-variable orientation of the rotation axis of the comet or by the temporal and spatial evolution of the activity profile in the wide active region on the nuclear surface remains unexplored here.
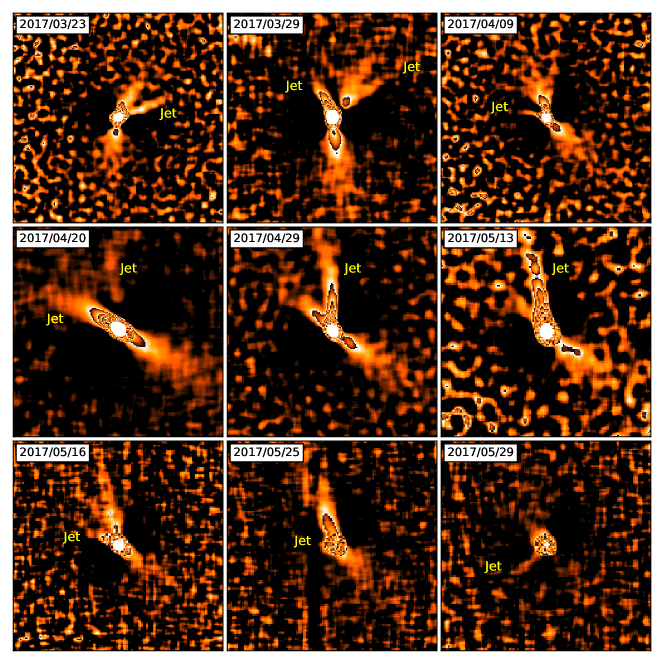
Jet structures (Fig. 11, Tab. 9): A number of narrow linear features are seen in Laplace-filtered images of the coma of 41P (for examples see Fig. 11). These occur preferentially in the sunward coma hemisphere with variable intensity and spatial extension, and are best identified outside of the fan A region in the coma, that is, eastward (larger position angles) and westward (smaller position angles) of the fan structure. The appearance of these linear jet features is episodic as can be seen from Tab. 9. In the table, a quasi-alternating appearance of the features over time is indicated: they are seen westward of fan A between 20 and 9 days before perihelion, eastward of fan A between 3 days before and 8 days post-perihelion, westward again between 8 and 31 days post-perihelion, and once more eastward of fan A between 28 and 51 days post-perihelion. Narrow linear features are not identified in our 41P images thereafter, that is, after 2017 June 02. This may be due in part to the fainter flux level of the comet and lower contrast in the coma.
The collimated appearance of the jet-like features, which is similar in the different filters used during the comet observations, is in favor of a dust-dominated nature. For 41P, this interpretation can be firmly supported by dust coma simulations: local regions of enhanced dust emission on a slowly rotating nucleus produce collimated quasi-linear jets. Contrary to the extended source region of fan A, the jets in the coma of 41P originate from small areas on the nucleus surface localized in a narrow range (not more than a few degrees extension) in longitude and latitude. The slow rotation of the nucleus results in quasi-constant near-nucleus position angles of the jets that are compatible with the constant appearance of the jets over the nightly observing intervals. The prominent occurrence of the dust jets on the sunward side implies a ‘sun-focused’ emission profile of the dust.
The simultaneous appearance of two dust jets, one on the eastward and one on the westward side of fan A on 2017 March 29 and 2017 April 20 (Fig. 11), requires the presence of at least two source regions that are widely separated on the nucleus of the comet. Schleicher et al. (2019) identified two gas jets, labeled J1 and J2, originating from two local areas that have a wide separation in longitude on the nucleus. Using the J1 and J2 identification as given in Fig. 7 of Schleicher et al. (2019), we tentatively associate the dust jets in our images with the same respective source region as the gas jets, as follows: gas jet J2 with the westward dust jet in our images of nights 2017 March 29 and 2017 April 20 and gas jet J1 with the eastern dust jets of nights 2017 March 29 and 2017 April 20.
We applied our solution for the rotation axis attitude of 41P, which was obtained from the simulation of the coma fan A in order to constrain the location of the source regions of the dust jets identified in our images eastward and westward of the fan area. The numerical simulations of the dust jets indicate that the source regions of the eastern and western dust jets seen in March and April 2017 should have latitudes of +35 deg or less. The dust jets seen in May 2017 on the eastern side of the coma require close-to-equatorial source regions in order to allow for the southeastern position angles measured in our images. Our simulations also show that the source regions of gas jets J1 and J2 – and the associated dust jets in our images – require near equatorial latitudes in order to appear on the anti-sunward side of the nucleus.
It is noted that the dust jet east of the coma fan on 2017 March 29 shows a slight anti-clockwise jet curvature, as does the dust jet towards the east on 2017 April 09 (Fig. 11) – and the gas jets in the images of Schleicher et al. (2019) during this time interval. Our dust coma simulation clearly indicates that the anti-clockwise curvature requires clockwise rotation of the nucleus. This finding in turn identifies the rotation axis with 52 deg obliquity and 50 deg rotation angle of the meridian at perihelion as the preferred solution compared to the rotation axis pointing in the opposite direction. The simulations also show that the eastward-oriented dust jets represent the morning side on the nucleus, while westward features originate from the afternoon to evening side.
3.5 The outburst on 2017 May 10-11
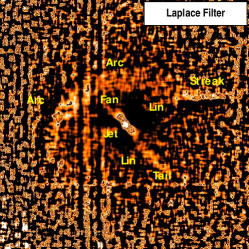
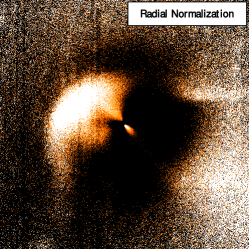
SDSS r filter photometry of the coma of 41P shows an approximately 0.6 mag brightness increase ( 70 %) on 2017 May 11 1-2 UT (Tab. 5) as compared to the measurements about 25 hours earlier (2017 May 10 00:30UT) and 43 hours later (2017 May 13 20UT). Similar brightness variations of the comet are not seen during other time intervals covered by our observing campaign on 41P. The brightness increase is accompanied by unique structures seen in the coma of the comet on the night of 2017 May 11 only (Fig. 12): The Laplace-filtered coma image displays an arc of 2 100 km in width and spanning over about 195 deg (from PA -65 over PA = 0 to PA 130 deg). The arc reaches a maximum intensity ratio of about 1.5 above the mean coma background in the east-northeast region of the coma and a minimum ratio approximately equal to the mean coma level in the north-northwest region of the coma. The arc is accompanied by a straight jet-like feature of about 25 deg opening angle at a position angle of 95 – 120 deg that extends from the coma center to about 4 500 km into the eastern coma. In the Laplace-filtered image a narrow linear feature is seen at a marginal level that extends from about the eastern part to the western part of the arc in the tailward side of the coma. Moreover, at least one narrow streak is seen extending from at 2 500 to 11 500 km projected distance from the coma center, respectively. In addition to the outburst-related coma structures, the fan A and the dust tail can still be identified, which are seen essentially undisturbed in the images of that night.
By the time of the observations on 2017 May 11 1-2 UT, the outburst may have lasted for a maximum of about 1 day which is close to half the rotation cycle of the comet measured by Schleicher et al. (2019) about 10 days earlier. Also, the more than 180 deg coverage of the arc supports the interpretation that the outburst activity continued for about half a rotation of the nucleus. The narrow linear features and the straight jet indicate that the outburst signal in the SDSS r filter images of this night is due to dust-reflected sunlight, although strictly speaking gas activity cannot be completely excluded. The maximum projected distance of the arc from the nucleus (about 7300 km) is compatible with a dust expansion speed of about 80 m/s (for a 24h outburst period). The radial gradient of the inner coma (inside about 1500 km nucleus distance) shows an exponent (0.98, see Tab. 6) close to unity, which is indicative of an almost geometric expansion of the dust in this distance range. It is noted that the radial exponents of the inner coma show significantly smaller values for the observing epochs immediately preceding and succeeding the outburst date.
Our dust coma modeling using a rotation axis solution obtained from a fan analysis and assuming a rotation period of about 50 hours allows the following conclusions: The rotation motion of the nucleus is from east to west in the images, with the former being the morning side and the latter the evening side of the cometary activity. Since outburst signatures are seen in the sunward and tailward side of the coma center, the outburst activity extended over a wider range in latitude. The eastern jet of 25 deg in width implies an extension of the activity from about 30 deg north to about 5 deg south on the nucleus (assuming the preferred rotation axis solution from Sect. 3.4). It is noted that the outburst may have started on the evening side of the nucleus, lasting until at least the source region had rotated to the morning side of the comet. The wide extension of the outburst in latitude covers at least more than 400 m of terrain on the (600 m radius) nucleus of 41P and is therefore not representative for the local active regions from which the dust jets originate.
Possible scenarios for the outburst are: (a) a nucleus splitting event, (b) an up-welling of a dust cloud from a landslide on the nucleus, and (c) a singular activity outburst from an extended region on the nucleus.
‘Nucleus splitting’ scenario: The potential nucleus splitting of 41P on 2017 May 10 did not produce any noticeable relics in our images, such as daughter nuclei. The separation velocities of subnuclei are typically on the order of 1 m/s, as is estimated for the daughter nuclei of comet splitting events (Boehnhardt 2004). Therefore, the separation distance of split nuclei in 41P should have been 80 and 250 km during the two observing epochs following the assumed splitting date 2017 May 10. Inspection of the images of these two nights did not reveal any indication of the presence of a daughter nucleus in 41P. The same negative finding applies for later observing epochs of the comet until the end of our campaign. It is also noted that the overall coma brightness returned to the normal level 3 days after the outburst, a behavior that is considered atypical for nucleus splitting events reported in the literature (Boehnhardt 2004). Therefore, apart from the signatures related to the outburst, direct or further indirect evidence for a nucleus splitting of 41P on 2017 May 10 is absent in our data of the comet as well as in the reports of the 2017 apparition published so far.
‘Dust cloud from a landslide’ scenario: The total amount of dust released during the outburst between 2017 May 10 and 2017 May 11 (i.e., within about t = 24h) can be approximated using the measured brightness increase mag compared to the dust-production rate of the comet (about 45 kg/s) given by Pozuelos et al. (2018) for early May 2018: tons (approximately three-quarters of the dust mass released by the nucleus per day) or roughly 5700 m3 of dust for an assumed mean bulk density of 0.5 g/cm3 for the nucleus solids as found in comet 67P/Churyumov-Gerasimenko (Pätzold et al. 2016). A landslide scenario for nonrepetitive outbursts on this comet was introduced by Vincent et al. (2016) and further analyzed by Pajola et al. (2017). This scenario involves the collapse of cliff structures on the cometary nucleus, an event that was found to be short in time for 67P/Churyumov-Gerasimenko (order 10 min) and involving the release of approximately a few percent of the mass of the collapsing material. The dust leaves the surface in a dust cloud of wide opening angle. The cliff collapse may be triggered due to a weakening of the cliff strength by thermal stresses and in the end may leave fresh volatile ice-rich material from deeper layers on the cliff surface. As a consequence, the collapsed region may display enhanced activity over a much longer time interval than the duration of the actual cliff collapse. The ejected mass of cometary material from the Aswan cliff collapse over about 70 m 333It is noted that a landslide structure in the Hathor cliff of 67P/Churyumov-Gerasimenko extends over several hundred meters. in length, one of the stronger ones seen on 67P/Churyumov-Gerasimenko, amounts to 500 - 1 000 tons and should represent only a small percentage of the mass that was sliding down the cliff wall (Pajola et al. 2017). The ejected mass of the 41P outburst was greater than that of the Aswan outburst on 67P/Churyumov-Gerasimenko by a factor of between three and six and would therefore indicate a more massive cliff collapse, possibly also indicated by the wide latitude extension of the active outburst region. The outburst of 41P may have started on the afternoon side of the nucleus, and it involved an extended surface region, as is also observed on 67P/Churyumov-Gerasimenko. However, the duration of the outburst of 41P is much longer than found in the case of 67P/Churyumov-Gerasimenko. It also displayed a variable intensity profile over the 24h duration that was imaged in our data: The initial outburst phase was followed by a decay in activity and thereafter by a considerable brightness increase towards and on the morning side of the coma. The latter might be due to the enhanced sublimation of volatile ices that were freshly exposed to the Sun after the cliff collapse. It is noted that in the second half of May 2017, short jet features appeared in the morning side of the coma in the position angle range representing the latitude range of the outburst region on 2017 May 10 (see Tab. 9).
Outburst from an extended region on the nucleus: The scenario of a singular outburst from an extended region on the nucleus involves a thermal trigger for a sudden gas release from subsurface layers, caused by either a heat wave from solar illumination reaching a massive pocket of very volatile ice (CO2, CO) or subsurface gas that has not been able to diffuse into the coma with time, has built up significant gas pressure, and at some moment exceeding the tensile strength of the enclosing cometary material. The available results from the observations do not allow us to distinguish the gas-triggered outburst from the cliff-collapse scenario. However, we note that the region affected by the outburst seems to be very extended in latitude, that is, over more than 400 m in length, which is more than half of the mean radius of the nucleus, that is, the subsurface gas reservoir must have been very extended.
4 Conclusions
During its last perihelion passage at a distance of 0.14 AU from Earth, comet 41P was imaged in broadband SDSS gri filters between 2017 March 11 and 2017 July17 from the Mt. Wendelstein observatory with the 2m Fraunhofer telescope over a wide phase angle range (14-69 deg). The apparent coma brightness peaked around perihelion (2017 April 12). Determination of the dust activity profile of 41P and of its maximum is not possible without the adoption of proper phase angle corrections. Depending on the chosen phase function, we found a single power law of the solar distance profile with a maximum activity around perihelion and a steep radial exponent or a segmented profile with its maximum a few weeks before perihelion and a shallower decrease with increasing distance from the Sun. The measured filter flux of the comet is dominated by dust-reflected sunlight. However, during the time period from mid-March to the end of May 2017 the filter flux was contaminated by light from emissions of coma gases. In the very inner coma ( 1 000 km from the nucleus), the power exponent of the radial profile was mostly below unity, indicating ongoing fragmentation of dust. The overall color and spectral gradient of the cometary dust was found to be solar ( to nm). Trends towards bluer SDSS r-i coma colors with time to and from perihelion and with increasing distance from the nucleus are noted and are interpreted as a possible signature of changing dust size distribution with time and within the cometary coma, respectively. Signatures in the anti-solar direction in the images indicate the presence of a dust tail made of grains that were only recently (within days to a few weeks) released from the nucleus. No dust trail of older and heavier dust grains and no signatures of an ion tail are found in the images.
The size of the nucleus of 41P was determined directly from the light distribution in the central brightness peak of the coma. The value of about 600 m for the equivalent radius of the nucleus confirms an earlier size estimation. Significant variability of the nucleus brightness suggests a minimum axis ratio of more than two. This ratio value is higher than what has been measured for other comets, and marks the upper end of ratios seen in other small bodies observed in the Solar System, except for 1I//2017 U1 Oumuamua, which is potentially an extra-solar object. The rotation axis of the nucleus was determined from the continuous fan structure in the northern coma hemisphere. It remained approximately constant from mid-March to early June 2017 (obliquity = 52 deg, meridian at perihelion passage = 50 deg, uncertainty deg). Deviations of the fan geometry (i.e., wide opening angle) may indicate changes in the rotation motion of 41P as of about June 2017. The fan itself originates from a wider region on the nucleus beyond about 50 deg north up to polar latitudes. Two prominent linear and a few narrow jet features in the coma can be traced to local areas at moderate northern to equatorial latitudes, with the former two being identified on two epochs as being associated with the J1 and J2 gas jets seen by Schleicher et al. (2019). On 2017 May 10-11, a 0.6 mag outburst is observed in 41P that is responsible for various structures (arc, wide jet, lineaments) in the coma of the comet. The outburst produced about 3 000 tons of dust within a day. Together with the curvature of some dust jets seen earlier in the coma, this outburst provided the opportunity to constrain the rotation direction (prograde) and the rotation period of the nucleus ( days). The outburst originated from a region that extended over more than 400 m (between 30 deg north and 5 deg south) on the nucleus and may have been produced by a major landslide on the nucleus or the explosion of an extended subsurface gas pocket.
The analysis of our observational results for comet 41P has shown that a good understanding of the light scattering of the dust population is essential for proper interpretation of the dust activity versus solar distance, in particular if the comet passes through a wide phase angle range during the observing interval. As the comet came close to Earth, we were able to test a new approach for the estimation of the nucleus brightness, shining through the inner coma. This delivered quantitative results on the dimensions of the body. By comparing the observed geometry of dust structures (fan, jet, arc, lineaments) in the cometary coma with that of numerical simulations of these features, we were able to assess the rotation axis and the locations of active regions on the nucleus. An upgrade of the simulation tools considering enhanced rotation modes (including a changing rotation period) will allow for further improvement and consolidation of the results for 41P.
5 Acknowledgements
We thank Dr. Klaus Beisser for the provision of the simulation software for the cometary dust coma and tail. We wish to acknowledge the important contribution to this work resulting from the Pan-STARRS1 Survey catalog. This research was supported by the cluster of excellence ’Origin and structure of the universe’ of the Deutsche Forschungsgemeinschaft DFG. This paper contains data obtained at the Wendelstein Observatory of the Ludwig-Maximilian University Munich.
References
- A’Hearn et al. (1986) A’Hearn, M. F., Hoban, S., Birch, P. V., et al. 1986, Nature, 324, 649
- A’Hearn et al. (1984) A’Hearn, M. F., Schleicher, D. G., Millis, R. L., Feldman, P. D., & Thompson, D. T. 1984, AJ, 89, 579
- Beisser & Drechsel (1992) Beisser, K. & Drechsel, H. 1992, Earth, Moon, and Planets, 191, 1
- Belyaev (1986) Belyaev, N. A. 1986, Catalogue of short-period comets (Astron. Inst. Slovak Academy of Sciences)
- Bertini et al. (2017) Bertini, I., La Forgia, F., Tubiana, C., et al. 2017, MNRAS, 469, S404
- Bockelée-Morvan et al. (2017) Bockelée-Morvan, D., Rinaldi, G., Erard, S., et al. 2017, MNRAS, 469, S443
- Bodewits et al. (2018) Bodewits, D., Farnham, T. L., Kelley, M. S. P., & Knight, M. M. 2018, Nature, 553, 186
- Boehnhardt (2004) Boehnhardt, H. 2004, in Comets II, ed. M. C. Festou, H. U. Keller, & H. A. Weaver (University of Arizona Press, Tucson), 301
- Boehnhardt & Birkle (1994) Boehnhardt, H. & Birkle, K. 1994, A&AS, 107, 101
- Boehnhardt et al. (1990) Boehnhardt, H., Fechtig, H., & Vanysek, V. 1990, A&A, 231, 543
- Boehnhardt et al. (2016) Boehnhardt, H., Riffeser, A., Kluge, M., et al. 2016, MNRAS, 462, S376
- Bowell et al. (1989) Bowell, E., Hapke, B., Domingue, D., et al. 1989, in Asteroids II, ed. R. P. Binzel, T. Gehrels, & M. S. Matthews (University of Arizona Press, Tucson), 524
- Doi et al. (2010) Doi, M., Tanaka, M., Fukugita, M., et al. 2010, AJ, 139, 1628
- Fernández & Sosa (2015) Fernández, J. A. & Sosa, A. 2015, Planet. Space Sci., 118, 14
- Finson & Probstein (1968) Finson, M. J. & Probstein, R. F. 1968, ApJ, 154, 327
- Fornasier et al. (2015) Fornasier, S., Hasselmann, P. H., Barucci, M. A., et al. 2015, A&A, 583, A30
- Frattin et al. (2017) Frattin, E., Cremonese, G., Simioni, E., et al. 2017, MNRAS, 469, S195
- Gutiérrez et al. (2006) Gutiérrez, P. J., Davidsson, B. J. R., Ortiz, J. L., Rodrigo, R., & Vidal-Nuñez, M. J. 2006, A&A, 454, 367
- Howell et al. (2017) Howell, E. S., Lejoly, C., Taylor, P. A., et al. 2017, in AAS/Division for Planetary Sciences Meeting Abstracts #49, 414.24
- Hughes (1991) Hughes, D. W. 1991, Comets in the Post-Halley Era, ed. R. L. Newburn Jr., M. Neugebauer, & R. Rahe (Kluwer Acad. Publ.), 825
- Kolokolova et al. (2004) Kolokolova, L., Hanner, M. S., Levasseur-Regourd, A. C., & Gustafson, B. Å. S. 2004, in Comets II, ed. M. C. Festou, H. U. Keller, & H. A. Weaver (University of Arizona Press, Tucson), 577
- Kosyra et al. (2014) Kosyra, R., Gössl, C., Hopp, U., et al. 2014, Experimental Astronomy, 38, 213
- Kresak (1991) Kresak, L. 1991, Comets in the Post-Halley Era, ed. R. L. Newburn Jr., M. Neugebauer, & R. Rahe (Kluwer Acad. Publ.), 607
- Lacerda & Jewitt (2012) Lacerda, P. & Jewitt, D. 2012, ApJ, 760, L2
- Lamy et al. (2004) Lamy, P. L., Toth, I., Fernandez, Y. R., & Weaver, H. A. 2004, in Comets II, ed. M. C. Festou, H. U. Keller, & H. A. Weaver (University of Arizona Press, Tucson), 223
- Lang-Bardl et al. (2010) Lang-Bardl, F., Hodapp, K., Jacobson, S., et al. 2010, in Proceedings of the SPIE, Volume 7735, 3Q
- Lovell et al. (2017) Lovell, A. J., Amason, C., Howell, E. S., et al. 2017, in AAS/Division for Planetary Sciences Meeting Abstracts #49, 420.04
- Luk’yanyk et al. (2019) Luk’yanyk, I., Zubko, E., Husárik, M., et al. 2019, MNRAS, 485, 4013
- Magnier et al. (2013) Magnier, E. A., Schlafly, E., Finkbeiner, D., et al. 2013, ApJS, 205, 20
- McKay et al. (2018) McKay, A., DiSanti, M., Cochran, A., et al. 2018, in American Astronomical Society Meeting Abstracts #231, 144.13
- McKay et al. (2017) McKay, A., DiSanti, M. A., Cochran, A. L., et al. 2017, in AAS/Division for Planetary Sciences Meeting Abstracts #49, 305.09
- Meech & Jewitt (1987) Meech, K. J. & Jewitt, D. C. 1987, A&A, 187, 585
- Meech et al. (2017) Meech, K. J., Weryk, R., Micheli, M., et al. 2017, Nature, 552, 378
- Moffat (1969) Moffat, A. F. J. 1969, A&A, 3, 455
- Moreno et al. (2018) Moreno, F., Guirado, D., Muñoz, O., et al. 2018, AJ, 156, 237
- Moulane et al. (2018) Moulane, Y., Jehin, E., Opitom, C., et al. 2018, A&A, 619, A156
- Müller (1999) Müller, M. 1999, Ph. D. Thesis (University of Heidelberg)
- Pajola et al. (2017) Pajola, M., Höfner, S., Vincent, J. B., et al. 2017, Nature Astronomy, 1, 0092
- Pätzold et al. (2016) Pätzold, M., Andert, T., Hahn, M., et al. 2016, Nature, 530, 63
- Pozuelos et al. (2018) Pozuelos, F. J., Jehin, E., Moulane, Y., et al. 2018, A&A, 615, A154
- Pravec et al. (2002) Pravec, P., Harris, A. W., & Michalowski, T. 2002, in Asteroids III, ed. W. F. Bottke Jr., A. Cellino, P. Paolicchi, & R. P. Binzel (University of Arizona Press, Tucson), 113–122
- Rumyantsev et al. (2019) Rumyantsev, V. V., Kiselev, N. N., & Ivanova, A. V. 2019, Solar System Research, 53, 91
- Schleicher (2010) Schleicher, D. G. 2010, Composite Dust Phase Function for Comets - Details (https://asteroid.lowell.edu/comet/dustphase_details.html)
- Schleicher et al. (2019) Schleicher, D. G., Knight, M. M., Eisner, N. L., & Thirouin, A. 2019, AJ, 157, 108
- Schleicher et al. (1998) Schleicher, D. G., Millis, R. L., & Birch, P. V. 1998, Icarus, 132, 397
- Sekanina (1991) Sekanina, Z. 1991, Comets in the Post-Halley Era, ed. R. L. Newburn Jr., M. Neugebauer, & R. Rahe (Kluwer Acad. Publ.), 769
- Sierks et al. (2015) Sierks, H., Barbieri, C., Lamy, P. L., et al. 2015, Science, 347, aaa1044
- Snodgrass et al. (2016) Snodgrass, C., Jehin, E., Manfroid, J., et al. 2016, A&A, 588, A80
- Snodgrass et al. (2013) Snodgrass, C., Tubiana, C., Bramich, D. M., et al. 2013, A&A, 557, A33
- Tancredi et al. (2000) Tancredi, G., Fernández, J. A., Rickman, H., & Licandro, J. 2000, A&AS, 146, 73
- Tonry et al. (2012) Tonry, J. L., Stubbs, C. W., Lykke, K. R., et al. 2012, ApJ, 750, 99
- Vincent et al. (2016) Vincent, J. B., A’Hearn, M. F., Lin, Z. Y., et al. 2016, MNRAS, 462, S184
- Vsekhsvyatskii (1964) Vsekhsvyatskii, S. K. 1964, Physical characteristics of comets (Israel Program for Scientific Translations Ltd.)
- Whipple & Huebner (1976) Whipple, F. L. & Huebner, W. F. 1976, ARA&A, 14, 143
- Willmer (2018) Willmer, C. N. A. 2018, ApJS, 236, 47
- Zappala et al. (1990) Zappala, V., Cellino, A., Barucci, A. M., Fulchignoni, M., & Lupishko, D. F. 1990, A&A, 231, 548
Appendix A
| Time to/from | SDSS r | SDSS i | SDSS g | TRP | TRP | ||||||||||||
|---|---|---|---|---|---|---|---|---|---|---|---|---|---|---|---|---|---|
| Perihelion | PR | Inst. | Date | Time | TEX | Time | TEX | Time | TEX | Min | Max | ||||||
| (days) | (AU) | (AU) | (deg) | (km) | (UT) | (UT) | (s) | (UT) | (s) | (UT) | (s) | (%) | (%) | ||||
| -32.73 | 1.135 | 0.178 | 34.32 | 25.81 | 3KK | 2017/03/11 | 00:06 - 00:56 | 6 | 360 | na | na | ||||||
| -31.71 | 1.130 | 0.174 | 35.76 | 25.33 | 3KK | 2017/03/12 | 00:44 - 01:05 | 12 | 720 | 00:44 - 01:05 | 10 | 600 | 68 | 78 | |||
| -30.90 | 1.126 | 0.172 | 36.93 | 24.95 | 3KK | 2017/03/12 | 18:15 - 22:25 | 104 | 6240 | 18:15 - 22:25 | 104 | 6240 | 42 | 84 | |||
| -19.64 | 1.079 | 0.147 | 52.89 | 21.35 | 3KK | 2017/03/24 | 02:25 - 02:53 | 13 | 780 | 02:25 - 02:53 | 2 | 120 | 29 | 56 | |||
| -18.84 | 1.076 | 0.146 | 53.95 | 21.21 | 3KK | 2017/03/24 | 21:39 - 22:09 | 13 | 780 | 21:39 - 22:09 | 13 | 780 | 43 | 67 | |||
| -17.97 | 1.073 | 0.145 | 55.08 | 21.07 | 3KK | 2017/03/25 | 18:29 - 18:58 | 11 | 660 | 18:29 - 18:58 | 6 | 360 | 51 | 59 | |||
| -16.95 | 1.070 | 0.144 | 56.39 | 20.94 | 3KK | 2017/03/26 | 19:05 - 19:30 | 60 | 780 | 19:05 - 19:21 | 7 | 420 | 58 | 62 | |||
| -15.71 | 1.067 | 0.143 | 57.90 | 20.80 | 3KK | 2017/03/28 | 00:36 - 01:06 | 13 | 780 | 00:36 - 01:06 | 10 | 600 | 72 | 78 | |||
| -14.79 | 1.064 | 0.143 | 59.01 | 20.73 | 3KK | 2017/03/28 | 22:53 - 23:23 | 12 | 720 | 22:53 - 23:23 | 10 | 600 | 62 | 68 | |||
| -13.88 | 1.062 | 0.142 | 60.03 | 20.67 | 3KK | 2017/03/29 | 20:33 - 21:02 | 13 | 780 | 20:33 - 21:02 | 12 | 720 | 52 | 59 | |||
| -12.95 | 1.060 | 0.142 | 61.05 | 20.64 | 3KK | 2017/03/30 | 18:56 - 19:20 | 13 | 780 | 18:56 - 19:20 | 13 | 780 | 65 | 72 | |||
| -9.73 | 1.053 | 0.142 | 64.21 | 20.66 | 3KK | 2017/04/03 | 00:03 - 01:07 | 25 | 1500 | 00:03 - 01:07 | 17 | 1020 | 37 | 59 | |||
| -3.61 | 1.046 | 0.147 | 68.40 | 21.31 | 3KK | 2017/04/09 | 02:53 - 03:44 | 22 | 1320 | 02:53 - 03:42 | 21 | 1260 | 57 | 69 | |||
| -2.67 | 1.046 | 0.148 | 68.83 | 21.47 | 3KK | 2017/04/10 | 01:46 - 02:16 | 13 | 780 | 01:46 - 02:16 | 13 | 780 | 67 | 76 | |||
| -2.61 | 1.046 | 0.148 | 68.85 | 21.38 | WWFI | 2017/04/10 | 03:15 - 03:24 | 5 | 300 | - | 62 | 82 | |||||
| -0.64 | 1.045 | 0.151 | 69.52 | 21.87 | 3KK | 2017/04/12 | 02:19 - 02:47 | 13 | 780 | 02:19 - 02:47 | 13 | 780 | 54 | 62 | |||
| -0.61 | 1.045 | 0.151 | 69.53 | 21.77 | WWFI | 2017/04/12 | 03:16 - 03:20 | 2 | 120 | - | 29 | 49 | |||||
| 8.30 | 1.051 | 0.167 | 69.52 | 24.20 | WWFI | 2017/04/21 | 01:04 - 01:29 | 12 | 720 | - | 82 | 86 | |||||
| 8.34 | 1.051 | 0.167 | 69.51 | 24.33 | 3KK | 2017/04/21 | 01:41 - 02:49 | 26 | 1560 | 01:41 - 02:49 | 24 | 1440 | 65 | 69 | |||
| 11.36 | 1.056 | 0.174 | 68.51 | 25.22 | WWFI | 2017/04/24 | 02:18 - 02:39 | 11 | 660 | - | 72 | 84 | |||||
| 12.22 | 1.058 | 0.177 | 68.15 | 25.65 | 3KK | 2017/04/24 | 22:42 - 23:40 | 25 | 1500 | 22:42 - 23:40 | 24 | 1440 | 59 | 70 | |||
| 17.22 | 1.071 | 0.189 | 65.46 | 27.37 | WWFI | 2017/04/29 | 23:00 - 23:25 | 13 | 780 | - | 74 | 92 | |||||
| 18.22 | 1.074 | 0.192 | 64.83 | 27.76 | WWFI | 2017/04/30 | 23:02 - 23:23 | 13 | 780 | 22:34 - 22:59 | 13 | 780 | 00:59 - 01:05 | 2 | 120 | 26 | 72 |
| 23.26 | 1.092 | 0.206 | 61.16 | 29.93 | 3KK | 2017/05/05 | 23:36 - 00:43 | 30 | 1800 | 23:36 - 00:43 | 27 | 1620 | 67 | 79 | |||
| 27.24 | 1.109 | 0.218 | 57.85 | 31.62 | 3KK | 2017/05/09 | 23:36 - 00:05 | 13 | 780 | 23:36 - 00:05 | 13 | 780 | 71 | 77 | |||
| 27.28 | 1.109 | 0.218 | 57.83 | 31.47 | WWFI | 2017/05/10 | 00:24 - 00:49 | 13 | 780 | - | 92 | 95 | |||||
| 28.33 | 1.113 | 0.221 | 56.90 | 31.93 | WWFI | 2017/05/11 | 01:13 - 02:29 | 18 | 1080 | - | 59 | 63 | |||||
| 31.10 | 1.127 | 0.229 | 54.39 | 33.31 | 3KK | 2017/05/13 | 20:11 - 20:33 | 10 | 600 | 20:11 - 20:39 | 11 | 660 | 22 | 64 | |||
| 31.26 | 1.128 | 0.230 | 54.24 | 33.22 | WWFI | 2017/05/14 | 00:07 - 00:14 | 4 | 240 | 82 | 89 | ||||||
| 34.20 | 1.143 | 0.239 | 51.46 | 34.55 | WWFI | 2017/05/16 | 22:43 - 23:01 | 12 | 720 | - | 73 | 79 | |||||
| 36.14 | 1.153 | 0.245 | 49.58 | 35.64 | 3KK | 2017/05/18 | 21:05 - 21:33 | 13 | 780 | 21:05 - 21:33 | 10 | 600 | 15 | 54 | |||
| 36.23 | 1.154 | 0.246 | 49.49 | 35.50 | WWFI | 2017/05/18 | 23:26 - 23:45 | 3 | 180 | 23:46 - 00:05 | 13 | 780 | 00:06 - 00:24 | 12 | 720 | 58 | 86 |
| 39.27 | 1.171 | 0.256 | 46.48 | 36.97 | WWFI | 2017/05/22 | 00:18 - 00:37 | 13 | 780 | 00:38 - 00:57 | 13 | 780 | 00:58 - 01:17 | 13 | 780 | 82 | 92 |
| 40.17 | 1.177 | 0.259 | 45.58 | 37.42 | WWFI | 2017/05/22 | 21:51 - 22:10 | 13 | 780 | 22:11 - 22:30 | 13 | 780 | 22:30 - 22:49 | 13 | 780 | 68 | 87 |
| 43.20 | 1.095 | 0.270 | 42.51 | 38.97 | WWFI | 2017/05/25 | 22:33 - 22:52 | 12 | 720 | 22:52 - 23:10 | 10 | 600 | 23:12 - 23:18 | 5 | 300 | 65 | 87 |
| 47.13 | 1.221 | 0.284 | 38.51 | 41.12 | WWFI | 2017/05/29 | 20:54 - 21:12 | 13 | 780 | 21:13 - 21:18 | 3 | 180 | 21:33 - 21:52 | 13 | 780 | 44 | 71 |
| 51.21 | 1.249 | 0.301 | 34.39 | 43.54 | WWFI | 2017/06/02 | 20:55 - 01:01 | 25 | 1500 | 21:14 - 21:33 | 25 | 1500 | 21:34 - 21:53 | 13 | 780 | 68 | 87 |
| 52.22 | 1.256 | 0.306 | 33.37 | 44.18 | WWFI | 2017/06/03 | 21:41 - 01:00 | 33 | 1980 | 50 | 78 | ||||||
| 53.26 | 1.263 | 0.310 | 32.36 | 44.83 | WWFI | 2017/06/05 | 00:07 - 00:14 | 5 | 300 | 24 | 27 | ||||||
| 54.21 | 1.270 | 0.314 | 31.43 | 45.46 | WWFI | 2017/06/05 | 22:44 - 23:18 | 21 | 1260 | 40 | 67 | ||||||
| 57.14 | 1.291 | 0.328 | 28.63 | 47.47 | WWFI | 2017/06/08 | 20:24 - 22:54 | 43 | 2580 | 85 | 95 | ||||||
| 58.27 | 1.307 | 0.339 | 26.67 | 49.01 | WWFI | 2017/06/11 | 00:08 - 00:47 | 27 | 1620 | 93 | 94 | ||||||
| 62.21 | 1.329 | 0.355 | 24.10 | 51.27 | WWFI | 2017/06/13 | 21:32 - 23:47 | 20 | 1200 | 55 | 74 | ||||||
| 63.27 | 1.337 | 0.361 | 23.21 | 52.13 | WWFI | 2017/06/15 | 00:16 - 00:35 | 13 | 780 | 74 | 83 | ||||||
| 70.19 | 1.392 | 0.403 | 18.20 | 58.31 | WWFI | 2017/06/21 | 22:24 - 22:54 | 17 | 1020 | 75 | 82 | ||||||
| 72.29 | 1.417 | 0.425 | 16.50 | 61.41 | WWFI | 2017/06/25 | 00:43 - 01:20 | 21 | 1260 | 65 | 80 | ||||||
| 76.16 | 1.440 | 0.446 | 15.29 | 64.48 | WWFI | 2017/06/27 | 21:19 - 22:20 | 26 | 1560 | 33 | 75 | ||||||
| 82.27 | 1.499 | 0.505 | 13.99 | 72.95 | WWFI | 2017/07/05 | 00:05 - 00:47 | 23 | 1380 | 87 | 89 | ||||||
| 92.16 | 1.574 | 0.590 | 15.15 | 85.30 | WWFI | 2017/07/13 | 21:39 - 22:05 | 14 | 840 | 73 | 82 | ||||||
| 95.20 | 1.600 | 0.622 | 15.95 | 89.97 | WWFI | 2017/07/16 | 22:45 - 22:52 | 5 | 300 | 35 | 86 | ||||||
| 96.14 | 1.608 | 0.633 | 16.22 | 91.47 | WWFI | 2017/07/17 | 21:09 - 21:46 | 25 | 1500 | 71 | 84 |
| Time | SDSS r | SDSS i | SDSS g | ||||||
|---|---|---|---|---|---|---|---|---|---|
| to/from | 1000km | 5000km | 10000km | 1000km | 5000km | 10000km | 1000km | 5000km | 10000km |
| Perihelion | Bright. | Bright. | Bright. | Bright. | Bright. | Bright. | Bright. | Bright. | Bright. |
| (days) | (mag) | (mag) | (mag) | (mag) | (mag) | (mag) | (mag) | (mag) | (mag) |
| -32.73 | 13.94 | 11.50 | 10.17 | ||||||
| -31.71 | 13.62 | 11.94 | 11.21 | 13.49 | 11.87 | 11.21 | |||
| -30.90 | 13.54 | 11.44 | 10.38 | 13.37 | 11.23 | 10.15 | |||
| -19.64 | 13.33 | 11.59 | 10.87 | 13.16 | 11.51 | 10.88 | |||
| -18.84 | 13.30 | 11.53 | 10.78 | 13.15 | 11.47 | 10.80 | |||
| -17.97 | 13.20 | 11.48 | 10.73 | 13.04 | 11.41 | 10.75 | |||
| -16.95 | 13.26 | 11.49 | 10.73 | 13.08 | 11.39 | 10.71 | |||
| -15.71 | 13.30 | 11.51 | 10.75 | 13.18 | 11.48 | 10.80 | |||
| -14.79 | 13.32 | 11.51 | 10.75 | 13.18 | 11.47 | 10.78 | |||
| -13.88 | 13.43 | 11.56 | 10.78 | 13.29 | 11.52 | 10.82 | |||
| -12.95 | 13.59 | 11.60 | 10.83 | 13.41 | 11.51 | 10.80 | |||
| -9.73 | 13.54 | 11.60 | 10.82 | 13.40 | 11.57 | 10.85 | |||
| -3.61 | 13.48 | 11.61 | 10.79 | 13.34 | 11.56 | 10.79 | |||
| -2.67 | 13.70 | 11.69 | 10.86 | 13.55 | 11.63 | 10.87 | |||
| -2.61 | 13.66 | 11.71 | 10.93 | ||||||
| -0.64 | 13.51 | 11.61 | 10.79 | 13.38 | 11.60 | 10.85 | |||
| -0.61 | 13.61 | 11.81 | 11.13 | ||||||
| 8.30 | 13.88 | 11.93 | 11.08 | ||||||
| 8.34 | 13.84 | 11.90 | 11.05 | 13.74 | 11.90 | 11.12 | |||
| 11.36 | 14.01 | 12.08 | 11.24 | ||||||
| 12.22 | 13.96 | 12.01 | 11.17 | 13.84 | 12.00 | 11.23 | |||
| 17.22 | 14.19 | 12.24 | 11.39 | ||||||
| 18.22 | 14.40 | 12.27 | 11.42 | 14.24 | 12.20 | 11.41 | 14.91 | 12.61 | 11.63 |
| 23.26 | 14.47 | 12.51 | 11.65 | 14.33 | 12.44 | 11.64 | |||
| 27.24 | 14.68 | 12.65 | 11.76 | 14.54 | 12.61 | 11.78 | |||
| 27.28 | 14.73 | 12.75 | 11.90 | ||||||
| 28.33 | 14.16 | 12.27 | 11.37 | ||||||
| 31.10 | 14.58 | 12.67 | 11.86 | 14.41 | 12.55 | 11.77 | |||
| 31.26 | 14.41 | 12.55 | 11.75 | ||||||
| 34.20 | 14.80 | 12.92 | 12.09 | ||||||
| 36.14 | 14.89 | 12.95 | 12.10 | 14.73 | 12.87 | 12.10 | |||
| 36.23 | 14.98 | 12.96 | 12.14 | 14.82 | 12.85 | 12.06 | 15.51 | 13.34 | 12.41 |
| 39.27 | 14.89 | 13.10 | 12.31 | 14.73 | 12.99 | 12.24 | 15.40 | 13.47 | 12.55 |
| 40.17 | 15.17 | 13.20 | 12.39 | 14.99 | 13.08 | 12.31 | 15.67 | 13.58 | 12.67 |
| 43.20 | 14.84 | 13.02 | 12.30 | 14.66 | 12.89 | 12.20 | 15.35 | 13.41 | 12.50 |
| 47.13 | 14.96 | 13.24 | 12.45 | 14.81 | 13.14 | 12.40 | 15.48 | 13.61 | 12.73 |
| 51.21 | 15.29 | 13.42 | 12.64 | 15.09 | 13.27 | 12.52 | 15.79 | 13.82 | 12.93 |
| 52.22 | 15.41 | 13.53 | 12.67 | ||||||
| 53.26 | 15.58 | 13.64 | 12.86 | ||||||
| 54.21 | 15.41 | 13.53 | 12.67 | ||||||
| 57.14 | 15.87 | 13.87 | 13.08 | ||||||
| 58.27 | 15.98 | 14.04 | 13.22 | ||||||
| 62.21 | 16.16 | 14.30 | 13.52 | ||||||
| 63.27 | 16.04 | 14.27 | 13.45 | ||||||
| 70.19 | 16.61 | 14.60 | 13.79 | ||||||
| 72.29 | 16.71 | 14.83 | 14.00 | ||||||
| 76.16 | 16.87 | 14.91 | 14.11 | ||||||
| 82.27 | 17.36 | 15.52 | 14.68 | ||||||
| 92.16 | 18.04 | 16.23 | 15.35 | ||||||
| 95.20 | 18.34 | 16.52 | 15.72 | ||||||
| 96.14 | 18.46 | 16.60 | 15.67 |
| Time | Inst. | SDSS r | SDSS i | SDSS g | |||||||||
|---|---|---|---|---|---|---|---|---|---|---|---|---|---|
| to/from | Coma | Nucleus | Nucleus | Nucleus | Coma | Nucleus | Nucleus | Nucleus | Coma | Nucleus | Nucleus | Nucleus | |
| Perihelion | Gradient | Estimated | Absolute | Equivalent | Gradient | Estimated | Absolute | Equivalent | Gradient | Estimated | Absolute | Equivalent | |
| (days) | Brightness | Brightness | Radius | Brightness | Brightness | Radius | Brightness | Brightness | Radius | ||||
| (mag) | (mag) | (km) | (mag) | (mag) | (km) | (mag) | (mag) | (km) | |||||
| -31.71 | 3KK | 1.00 | 15.7 | 18.2 | 0.72 | 1.02 | 15.5 | 18.0 | 0.78 | ||||
| -30.90 | 3KK | 0.90 | 15.4 | 17.9 | 0.82 | 0.91 | 15.1 | 17.6 | 0.93 | ||||
| -19.64 | 3KK | 0.98 | 16.3 | 18.7 | 0.56 | 1.00 | 16.2 | 18.6 | 0.57 | ||||
| -18.84 | 3KK | 0.99 | 17.4 | 19.8 | 0.34 | 1.03 | 17.1 | 19.5 | 0.38 | ||||
| -17.97 | 3KK | 1.04 | 17.1 | 19.5 | 0.39 | 1.11 | 18.0 | 20.4 | 0.25 | ||||
| -16.95 | 3KK | 0.99 | 16.1 | 18.5 | 0.62 | 1.05 | 16.0 | 18.4 | 0.64 | ||||
| -15.71 | 3KK | 1.03 | ne | ne | ne | 1.00 | ne | ne | ne | ||||
| -14.79 | 3KK | 0.97 | 16.2 | 18.5 | 0.61 | 1.02 | 16.1 | 18.4 | 0.63 | ||||
| -13.88 | 3KK | 0.87 | 15.6 | 17.9 | 0.81 | 0.93 | 15.4 | 17.7 | 0.87 | ||||
| -12.95 | 3KK | 0.86 | 16.7 | 19.0 | 0.49 | 0.89 | 16.7 | 19.0 | 0.48 | ||||
| -9.73 | 3KK | 0.92 | 17.9 | 20.1 | 0.29 | 0.97 | 17.8 | 20.0 | 0.30 | ||||
| -3.61 | 3KK | 0.93 | 16.6 | 18.6 | 0.58 | 0.98 | 16.6 | 18.6 | 0.57 | ||||
| -2.67 | 3KK | 0.83 | 16.3 | 18.3 | 0.68 | 0.90 | 16.2 | 18.2 | 0.70 | ||||
| -2.61 | WWFI | 0.85 | 16.2 | 18.2 | 0.71 | ||||||||
| -0.64 | 3KK | 0.93 | 17.4 | 19.3 | 0.42 | 1.00 | 17.6 | 19.5 | 0.38 | ||||
| -0.61 | WWFI | 0.96 | 17.4 | 19.3 | 0.42 | ||||||||
| 8.30 | WWFI | 0.88 | 16.8 | 18.5 | 0.62 | ||||||||
| 8.34 | 3KK | 0.90 | 16.8 | 18.5 | 0.62 | 0.94 | 16.7 | 18.4 | 0.64 | ||||
| 11.36 | WWFI | 0.88 | 16.6 | 18.2 | 0.70 | ||||||||
| 12.22 | 3KK | 0.93 | 17.3 | 18.9 | 0.51 | 1.00 | ne | ne | ne | ||||
| 17.22 | WWFI | 0.87 | 16.6 | 18.1 | 0.74 | ||||||||
| 18.22 | WWFI | 0.90 | ne | ne | ne | 0.90 | ne | ne | ne | 0.75 | ne | ne | ne |
| 23.26 | 3KK | 0.83 | 16.4 | 17.8 | 0.84 | 0.89 | 16.5 | 17.9 | 0.80 | ||||
| 27.24 | 3KK | 0.83 | 17.5 | 18.9 | 0.52 | 0.89 | 17.3 | 18.7 | 0.56 | ||||
| 27.28 | WWFI | 0.85 | 17.4 | 18.8 | 0.55 | ||||||||
| 28.33 | WWFI | 0.98 | ne | ne | ne | ||||||||
| 31.10 | 3KK | 0.90 | 16.9 | 18.2 | 0.70 | 0.94 | 16.9 | 18.2 | 0.69 | ||||
| 31.26 | WWFI | 0.95 | 17.2 | 18.5 | 0.60 | ||||||||
| 34.20 | WWFI | 0.90 | 16.9 | 18.2 | 0.71 | ||||||||
| 36.14 | 3KK | 0.89 | 17.0 | 18.3 | 0.69 | 0.94 | 17.1 | 18.4 | 0.65 | ||||
| 36.23 | WWFI | 0.90 | ne | ne | ne | 0.98 | ne | ne | ne | 0.82 | ne | ne | ne |
| 39.27 | WWFI | 0.96 | 17.4 | 18.6 | 0.58 | 1.00 | 17.3 | 18.5 | 0.60 | 0.82 | 17.1 | 18.3 | 0.77 |
| 40.17 | WWFI | 0.93 | 18.7 | 19.9 | 0.32 | 0.97 | 18.8 | 20.0 | 0.30 | 0.82 | 18.2 | 19.4 | 0.47 |
| 43.20 | WWFI | 1.07 | ne | ne | ne | 1.14 | ne | ne | ne | 0.93 | ne | ne | ne |
| 47.13 | WWFI | 0.97 | 16.9 | 18.0 | 0.76 | 1.02 | 16.8 | 17.9 | 0.78 | 0.85 | 16.9 | 18.0 | 0.88 |
| 51.21 | WWFI | 1.01 | ne | ne | ne | 1.07 | ne | ne | ne | 0.92 | 18.9 | 20.0 | 0.36 |
| 52.22 | WWFI | 1.03 | ne | ne | ne | ||||||||
| 53.26 | WWFI | 0.82 | 18.6 | 19.7 | 0.36 | ||||||||
| 54.21 | WWFI | 0.96 | ne | ne | ne | ||||||||
| 57.14 | WWFI | 0.93 | 19.3 | 20.3 | 0.27 | ||||||||
| 58.27 | WWFI | 0.90 | 18.6 | 19.6 | 0.38 | ||||||||
| 62.21 | WWFI | 1.00 | ne | ne | ne | ||||||||
| 63.27 | WWFI | 0.90 | 17.5 | 18.4 | 0.65 | ||||||||
| 70.19 | WWFI | 0.93 | 19.0 | 19.7 | 0.35 | ||||||||
| 72.29 | WWFI | 0.91 | 18.4 | 19.0 | 0.49 | ||||||||
| 76.16 | WWFI | 0.97 | 19.3 | 19.8 | 0.34 | ||||||||
| 82.27 | WWFI | 0.90 | 19.2 | 19.4 | 0.41 | ||||||||
| 92.16 | WWFI | 0.86 | 19.2 | 18.9 | 0.51 | ||||||||
| 95.20 | WWFI | 0.92 | 19.5 | 19.0 | 0.48 |
| Time to/from | Inst. | PA | PA | PA | PA | PA |
|---|---|---|---|---|---|---|
| Perihelion | Tail | r vector | v vector | r - Tail | v - Tail | |
| (days) | (deg) | (deg) | (deg) | (deg) | (deg) | |
| -32.73 | 3KK | 150 | 148.2 | 263.8 | -1.8 | 113.8 |
| -31.71 | 3KK | 152 | 149.2 | 263.1 | -2.8 | 111.1 |
| -30.90 | 3KK | 155 | 150.0 | 262.7 | -5.0 | 107.7 |
| -19.64 | 3KK | 170 | 167.1 | 264.0 | -2.9 | 94.0 |
| -18.84 | 3KK | 168 | 169.0 | 265.1 | 1.0 | 97.1 |
| -17.97 | 3KK | 168 | 171.3 | 266.5 | 3.3 | 98.5 |
| -16.95 | 3KK | 170 | 174.2 | 268.4 | 4.2 | 98.4 |
| -15.71 | 3KK | 175 | 177.8 | 271.0 | 2.8 | 96.0 |
| -14.79 | 3KK | 177 | 180.9 | 273.4 | 3.9 | 96.4 |
| -13.88 | 3KK | 187 | 184.1 | 276.0 | -2.9 | 89.0 |
| -12.95 | 3KK | 185 | 187.5 | 278.7 | 2.5 | 93.7 |
| -9.73 | 3KK | 197 | 199.8 | 289.5 | 2.8 | 92.5 |
| -3.61 | 3KK | 215 | 220.4 | 308.7 | 5.4 | 93.7 |
| -2.67 | 3KK | 225 | 222.9 | 311.1 | -2.1 | 86.1 |
| -2.61 | WWFI | 220 | 222.9 | 311.1 | 2.9 | 91.1 |
| -0.64 | 3KK | 228 | 227.0 | 315.2 | -1.0 | 87.2 |
| -0.61 | WWFI | 225 | 227.0 | 315.2 | 2.0 | 90.2 |
| 8.30 | 3KK | 235 | 235.5 | 323.8 | 0.5 | 88.8 |
| 8.34 | WWFI | 235 | 235.5 | 323.8 | 0.5 | 88.8 |
| 11.36 | WWFI | 230 | 236.0 | 324.2 | 6.0 | 94.2 |
| 12.22 | 3KK | 240 | 236.0 | 324.2 | -4.0 | 84.2 |
| 17.22 | WWFI | 230 | 235.3 | 323.0 | 5.3 | 93.0 |
| 18.22 | WWFI | 230 | 235.1 | 322.6 | 5.1 | 92.6 |
| 23.26 | 3KK | 235 | 233.3 | 319.8 | -1.7 | 84.8 |
| 27.24 | 3KK | 235 | 231.6 | 317.0 | -3.4 | 82.0 |
| 27.28 | WWFI | 235 | 231.5 | 317.0 | -3.5 | 82.0 |
| 28.33 | WWFI | 230 | 231.1 | 316.2 | 1.1 | 86.2 |
| 31.10 | 3KK | 230 | 229.7 | 313.9 | -0.3 | 83.9 |
| 31.26 | WWFI | 231 | 229.7 | 313.9 | -1.3 | 82.9 |
| 34.20 | WWFI | 230 | 228.0 | 311.2 | -2.0 | 81.2 |
| 36.14 | 3KK | 230 | 226.9 | 309.4 | -3.1 | 79.4 |
| 36.23 | WWFI | 230 | 226.8 | 309.3 | -3.2 | 79.3 |
| 39.27 | WWFI | 222 | 225.0 | 306.6 | 3.0 | 84.6 |
| 40.17 | WWFI | 225 | 224.4 | 305.7 | -0.6 | 80.7 |
| 43.20 | WWFI | 225 | 222.4 | 303.0 | -2.6 | 78.0 |
| 47.13 | WWFI | 225 | 219.5 | 299.5 | -5.5 | 74.5 |
| 51.21 | WWFI | 220 | 216.2 | 296.1 | -3.8 | 76.1 |
| 52.22 | WWFI | 220 | 215.2 | 295.2 | -4.8 | 75.2 |
| 53.26 | WWFI | 220 | 214.2 | 294.4 | -5.8 | 74.4 |
| 54.21 | WWFI | 210 | 213.3 | 293.6 | 3.3 | 83.6 |
| 57.14 | WWFI | 210 | 210.1 | 291.5 | 0.1 | 81.5 |
| 58.27 | WWFI | 205 | 207.5 | 290.0 | 2.5 | 85.0 |
| 62.21 | WWFI | 205 | 203.4 | 288.1 | -1.6 | 83.1 |
| 63.27 | WWFI | 210 | 201.7 | 287.5 | -8.3 | 77.5 |
| 70.19 | WWFI | 190 | 188.1 | 283.9 | -1.9 | 93.9 |
| 72.29 | WWFI | 190 | 180.3 | 282.6 | -9.7 | 92.6 |
| 76.16 | WWFI | 180 | 172.1 | 281.6 | -7.9 | 101.6 |
| 82.27 | WWFI | ne | 149.7 | 279.5 | ne | ne |
| 92.16 | WWFI | ne | 125.7 | 277.6 | ne | ne |
| 95.20 | WWFI | 135 | 119.6 | 277.2 | -15.4 | 142.2 |
| 96.14 | WWFI | 135 | 117.9 | 277.0 | -17.1 | 142.0 |
| Time | Fan A | Fan A | Fan A | Fan A | Fan A | Fan A | Fan A | Fan A | Fan A |
| to/from | PA | PA | PA | PA | PA | Opening | Curva- | Inten- | Exten- |
| Perihelion | Aeast | Awest | Aeast | Awest | Abright | Angle | ture | sity | sion |
| obs | obs | sim | sim | obs | obs | obs | obs | obs | |
| (days) | (deg) | (deg) | (deg) | (deg) | (deg) | (deg) | (km) | ||
| -31.71 | -24 | -70 | -20 | -66 | -30 | 46 | nm | nm | nm |
| -30.90 | -34 | -74 | -20 | -66 | -27 | 40 | nm | nm | nm |
| -19.64 | -18 | -73 | -2 | -63 | -35 | 55 | s | 1.2 | 5000 |
| -18.84 | -13 | -73 | 0 | -63 | -34 | 60 | s | 1.2 | 5000 |
| -17.97 | -4 | -62 | 3 | -56 | -19 | 58 | s | 1.25 | 4000 |
| -16.95 | 2 | -54 | 5 | -55 | -18 | 56 | s | 1.3 | 5000 |
| -15.71 | 6 | -50 | 7 | -55 | -23 | 56 | s | 1.25 | 5000 |
| -14.79 | 6 | -51 | 10 | -55 | -9 | 57 | s | 1.3 | 4000 |
| -13.88 | 3 | -50 | 12 | -55 | -32 | 53 | s | 1.25 | 2500 |
| -12.95 | 10 | -38 | 15 | -55 | -16 | 48 | s | 1.3 | 5000 |
| -9.73 | 27 | -33 | 25 | -30 | -3 | 60 | s | 1.3 | 6000 |
| -3.61 | 46 | -15 | 44 | -14 | 11 | 61 | s | 1.3 | 5000 |
| -2.67 | 45 | -11 | 48 | -11 | 25 | 56 | s | 1.3 | 6000 |
| -2.61 | 49 | -10 | 48 | -11 | 11 | 59 | s | 1.25 | 5000 |
| -0.64 | 59 | -8 | 50 | -7 | 15 | 67 | s | 1.3 | 5000 |
| -0.61 | 65 | -4 | 50 | -7 | 35 | 69 | s | 1.3 | 3000 |
| 8.30 | 64 | 2 | 59 | -2 | 37 | 62 | s | 1.15 | 7500 |
| 8.34 | 64 | 0 | 59 | -2 | 53 | 64 | s | 1.25 | 7500 |
| 11.36 | 60 | 2 | 61 | -2 | 44 | 58 | s | 1.25 | 6000 |
| 12.22 | 65 | 3 | 61 | -2 | 36 | 62 | s | 1.3 | 3000 |
| 17.22 | 60 | 0 | 63 | -3 | 43 | 60 | s | 1.2 | 6000 |
| 18.22 | 64 | 2 | 63 | -3 | 39 | 62 | s | 1.2 | 5000 |
| 23.26 | 66 | -3 | 65 | -6 | 35 | 69 | s | 1.3 | 5000 |
| 27.24 | 56 | -5 | 65 | -7 | 31 | 61 | s | 1.25 | 4000 |
| 27.28 | 60 | -7 | 65 | -7 | 31 | 67 | s | 1.25 | 6000 |
| 28.33 | 71 | 4 | 67 | -7 | 33 | 67 | s | 1.25 | 6000 |
| 31.10 | 62 | -4 | 67 | -7 | 35 | 66 | s | 1.25 | 6000 |
| 34.20 | 60 | -7 | 70 | -9 | 14 | 67 | s | 1.25 | 6500 |
| 36.14 | 61 | -8 | 69 | -12 | 39 | 69 | s | 1.3 | 5000 |
| 36.23 | 68 | -7 | 69 | -12 | 23 | 75 | s | 1.3 | 6000 |
| 39.27 | 60 | -12 | 69 | -11 | 19 | 72 | s | 1.3 | 8000 |
| 40.17 | 56 | -15 | 68 | -11 | 16 | 71 | s | 1.3 | 6000 |
| 43.20 | 60 | -12 | 69 | -12 | 23 | 72 | s | 1.3 | 7000 |
| 47.13 | 64 | -10 | 70 | -13 | 26 | 74 | s | 1.2 | 6500 |
| 51.21 | 71 | -4 | 70 | -13 | 30 | 75 | s | 1.2 | 5000 |
| 52.22 | 75 | -3 | 70 | -13 | 19 | 78 | s | nm | 3000 |
| 53.26 | 62 | -12 | 70 | -14 | 14 | 74 | s | nm | 3000 |
| 54.21 | 73 | -12 | 71 | -14 | 18 | 85 | s | 1.25 | 3000 |
| 57.14 | 70 | -11 | 71 | -14 | 15 | 81 | s | 1.2 | 3500 |
| 58.27 | 69 | -12 | 72 | -15 | 27 | 81 | s | 1.2 | 3000 |
| 62.21 | 68 | -14 | 73 | -15 | 20 | 82 | s | 1.25 | 4000 |
| 63.27 | 66 | -22 | 73 | -15 | 5 | 88 | s | 1.2 | 3000 |
| 72.29 | 61 | -25 | 74 | -15 | 5 | 86 | s | 1.1 | 3000 |
| 76.16 | 71 | -23 | 77 | -15 | nm | 94 | s | 1.1 | 3500 |
| 82.27 | 72 | -38 | 80 | -15 | nm | 110 | s | 1.1 | 2000 |
| Jet | Time | Date | Jet | Jet | Jet | Jet | Jet | Comments |
|---|---|---|---|---|---|---|---|---|
| Position | to/from | Start | Axis | Opening | Max. | Geometry | Max. | |
| Perihelion | of Night | PA | Angle | Intensity | Extension | |||
| (days) | (UT) | (deg) | (deg) | (ratio) | (km) | |||
| WJ | -19.64 | 2017/03/23 | 291 | 7 | 1.05 | s | 4000 | strong |
| WJ | -18.84 | 2017/03/24 | 282 | 16 | 1.00 | s | 5000 | marginal, PAC=295deg ? |
| WJ | -16.95 | 2017/03/26 | 290 | 7 | 1.00 | s | 3000 | weak |
| WJ | -15.71 | 2017/03/27 | 305 | 10 | 1.00 | s | 5000 | weak, PAC=290deg ? |
| WJ | -14.79 | 2017/03/28 | 300 | 15 | 1.02 | s | 3000 | clear |
| WJ | -13.88 | 2017/03/29 | 303 | 21 | 1.10 | s | 6000 | clear/strong |
| EJ | -13.88 | 2017/03/29 | 31 | 18 | 1.20 | mp | 2000 | strong |
| WJ | -12.95 | 2017/03/30 | 310 | 18 | 1.15 | s | 3500 | strong |
| WJ | -9.73 | 2017/04/02 | 331 | 13 | 1.00 | s | 7000 | weak |
| EJ | -2.67 | 2017/04/09 | 86 | 11 | 1.05 | mp | 2000 | clear |
| EJ | -0.64 | 2017/04/11 | 86 | 14 | 1.05 | mp | 3000 | clear |
| EJ | 8.30 | 2017/04/20 | 73 | 29 | 1.15 | mp | 3000 | clear, overlap with fan A |
| WJ | 8.34 | 2017/04/20 | 5 | 18 | 1.20 | s | 6000 | clear, overlap with fan A |
| WJ | 11.36 | 2017/04/23 | 353 | 7 | 1.05 | s | 2500 | clear |
| WJ | 17.22 | 2017/04/29 | 2 | 21 | 1.20 | mp | 4000 | strong |
| WJ | 27.24 | 2017/05/09 | 357 | 16 | 1.20 | s | 3000 | weak, overlap with fan A |
| WJ | 31.10 | 2017/05/13 | 11 | 23 | 1.25 | s | 4000 | strong, overlap with fan A |
| EJ | 34.20 | 2017/05/16 | 68* | 14 | 0.90 | s | 1500 | clear |
| EJ | 39.27 | 2017/05/21 | 126* | 13 | 0.90 | s | 1500 | weak |
| EJ | 40.17 | 2017/05/22 | 127* | 15 | 0.90 | s | 1000 | weak |
| EJ | 43.20 | 2017/05/25 | 110* | nm | nm | nm | nm | weak, difficult to measure |
| EJ | 47.13 | 2017/05/29 | 136 | 24 | 1.00 | s | 2000 | clear/weak |
| EJ | 51.21 | 2017/06/02 | 77 | 7 | 1.05 | s | 3000 | clear |