The well correlated DIBs at 6196, 6614 Å and their possible companions.
Abstract
Considered here is the interrelation between five diffuse interstellar bands (DIBs): 5545, 6113, 6196, 6445 and 6614 Å. Two DIBs ( 6196 and 6614 Å) have already been known as well correlated with each other; their relation with three other, weaker bands, was investigated for the first time. To accomplish this task high-resolution spectra (100,000) with high signal-to-noise ratio (S/N) of 54 hot O – B stars with reddening 0.12 – 1.45 mag were used. Analysis of measured equivalent widths has allowed to establish linear dependencies and evaluate linear correlation coefficients as high as 0.968 – 0.988 between the intensities of these five DIBs. Such a degree of correlation may indicate their common origin. Several spacings in wavenumbers found between these DIBs correspond to the energies of vibrational transitions in some PAHs resulting in IR emissions at 16.4, 11.3, 7.7, 6.2 and 3.3 µm.
keywords:
ISM: molecules, lines and bands1 Introduction
During nearly a century astrophysicists have been searching for a key to understanding of the origin of diffuse interstellar bands. A great deal of works dedicated to the DIBs problem directly concerns the subject of interrelation between DIBs as well as of the nature of their carriers. So, Herbig (1975) considered 39 diffuse bands in spectra of 56 hot stars of diverse spectral types (from O6 till A5). 17 DIBs showed quite a good correlation between their strengths — even better than either with color excess. He did not find any regularities in the wavenumbers of the analysed DIBs that might be considered, e. g. as a series of vibrational transitions. As DIBs carrier the author suggested a constituent of very small interstellar grains Å in radius.
Chlewicki et al. (1986) investigated several DIBs in spectra of stars from three associations. A special attention was given to the shapes of profiles and correlations between, so-called, “major” bands 5780, 5797, 6195, 6203, 6270 and 6284 Å. Basing on obtained results the authors concluded that DIBs could rather arise due to vibrational transitions in large molecules than on interstellar dust grains. To the same inferences Chlewicki et al. came after the study of correlations between narrow and broad DIBs (see Chlewicki et al., 1987). There authors put forward several arguments against the solid state origin hypothesis of DIBs, such as constancy of their central wavelengths, differences in shapes of profiles amid strongly correlated bands, existence of narrow diffuse bands and correlations between narrow and broad DIBs, that suggests close relation of their carriers. But as the hypothesis excludes appearance of the narrow DIBs so solid particles should not also be responsible for existence of the broad ones.
Krełowski & Walker (1987) analysing intensities and central depths of some diffuse bands in spectra of reddened early B stars (EB-V = 0.16 – 0.42) detected three probable families of DIBs, most evident in the spectrum of Per. The authors supposed existence of three different carriers for those DIBs.
Concept of DIB families got its continuation in the paper by Krełowski & Sneden (1995) and in quite recent works, for instance, by Friedman et al. (2011); Vos et al. (2011); Krełowski, Galazutdinov & Bondar (2019), where spectra of selected objects were classified accordingly to intensity ratios of two strong DIBs 5797 and 5780 Å as ‘’ and ‘’ interstellar cloud types — called after sightlines towards Sco and Oph.
But Cami et al. (1997) besides ‘’ and ‘’ cloud types considered CS (circumstellar) and the Orion type clouds. Their classification of DIB families is based on differences in ionization potentials (an ionization hypothesis) of DIB carriers — as probably large carbon-bearing molecules. In their opinion DIBs that correlate well with each other have carriers with similar ionization potentials and vise verse: poorly correlated DIBs should have carriers with significant differences in ionization and recombination properties. On the whole the authors support molecular hypothesis of DIB carriers as large carbonaceous molecules and explain existence of ‘’, ‘’ and Orion clouds as a sequence in intensity of local UV-field: from low in ‘’ through strong in ‘’ to extreme UV radiation in Orion cloud types.
Herbig (1988) described six weak features nearly uniformly spaced at 35 cm-1 between 6779 – 6860 Å. He speculated about rotational or vibrational progressions with spacings at 35 cm-1 level, but did not find any plausible carrier for this group of bands.
Herbig & Leka (1991) explored the systematics in spacings of more than hundred of DIBs. Assuming that in interstellar medium only the lowest energy levels (no excitation) of possible complex molecules are involved into DIBs production, they sought for vibrational sequences of the type . As a result, from 50 sequences of four or more DIBs, found by their method, eight were considered as reliable: thus some of the bands in these sequences could be related to one common carrier. The authors had taken into account quite a big number of known bands and concluded that DIBs should be produced by a mixture of different carriers.
Moutou et al. (1999) tested 10 DIBs in spectra of 62 stars and found good correlations between several of them: 6614 5780, 6614 5797, 6196 5780, 6196 5797, 6196 6379, 5797 5850, 5797 6379 with correlation coefficients ranging 0.90 – 0.93. But there was one strict correlation between equivalent widths of the DIBs 6614 and 6196 Å, with correlation coefficient R = 0.98 — the only case for which a common carrier was quite real.
Later detailed study of this pair based on a significant sample of spectra (114 targets) was carried out by McCall et al. (2010). The authors got excellent correlation between these two DIBs (R = 0.986), but final conclusion about their common carrier was left for future investigations due to difference in forms of their profiles.
Afterwards some works pertained to matter of correlation between different DIBs, mainly the strong ones — 5780, 5797, 6196, 6204, 6283 and 6614 Å. Thus, Friedman et al. (2011) found moderate (R = 0.87 – 0.98) correlations between these bands besides two, much better correlated (R = 0.99) bands 6196.0, 6613.6 Å. In Vos et al. (2011) the most correlated pair was DIBs at 6379 and 6614 Å (R = 0.92); the DIBs at 6196 and 6614 Å demonstrated quite a low degree of correlation, with R = 0.80. Similar result (R = 0.89) for the two last was obtained by Bailey et al. (2016). These researchers also found a break in the monotonic relation between these diffuse bands at low values of intensities: EW(6614) 20.0 – 40.0 mÅ, EW(6196) 10 mÅ. Though Krełowski et al. (2016) using spectra of much higher resolution confirmed tight correlation between these two diffuse bands, as it was presented in McCall et al. (2010).
In this paper the author presents a new study of interrelation between the well-correlated DIBs 6195.95 and 6613.58 Å and three relatively weak bands: 5545.00, 6113.18 and 6445.22 Å. As the differences in wavenumbers for these five DIBs are close to vibrational energies in molecules an attempt to find suitable molecules, candidates in DIB carriers was done. The wavelengths for these diffuse bands were taken from work by Bondar (2012) and further in the text accepted as 5545, 6113, 6196, 6445 and 6614 DIBs.
2 Objects and spectral data.
2.1 The objects.
The selected objects (54 in total) cover wide range of spectral classes from O5 to B9.5 with several Wolf-Rayet stars. Many of them are members of well-known stellar associations, such as Per OB2, Sgr OB1, Sco OB2, Oph cloud and others, so they present regions of interstellar medium with variant physical conditions. These stars have reddening from moderate to strong: EB-V= 0.12 – 1.45 mag. The main characteristics of the selected targets are presented in the Table 1. Intrinsic values of (BV)0 for calculating EB-V in the 5th column of the Table 1 were taken from work by Papaj, Krelowski &Wegner (1993).
One of the selection criteria for the objects in the Table 1 is the absence of a splitting in interstellar atomic or molecular lines visible in their spectra, i. e. a single cloud on the sightline towards a star. Or at least, if such a splitting exists, a secondary component should have much lesser intensity in comparison with a main component, the strongest one. This criterion was not strictly kept as it is quite a difficult task in case of high resolution spectra. The 1st column of the Table 1 clearly demonstrates that 25% of sightlines (marked with ‘’ sign) have more than one interstellar cloud. All the other objects in the Table 1 either do not have any signs of splitting in the potassium K i line or can have slight asymmetries in this line. A special case is the star HD 169454 as its spectrum reveals two evident interstellar clouds towards it.
As a rule verification was done on the interstellar line of potassium K i at 7699 Å, or in case of its absence (HARPS spectra) on other molecular (mainly CH at 4300 Å) or atomic (Ca i at 4227 Å) interstellar lines.
2.2 The spectra.
The used sample of spectral data was collected in different years with three spectrographs: mostly HARPS (2007 yr., program ID 078.C-0403(A)) and UVES (2009 and 2015 yrs., program IDs 082.C-0566(A), 092.C-0019(A)), see respective acronyms (‘H’, ‘U’) in the last column of the Table 1. Also, spectra obtained with HARPS and UVES spectrographs from ESO science archive have been used. They include the raw spectra as well as the reduced “Phase3” ones. Spectra of five objects were obtained with BOES spectrograph (Kim et al., 2007), letter ‘B’ in the last column of the Table 1. All the considered spectra are of a high resolution, 90,000 – 120,000. Measured S/N in vicinity of the selected DIBs ranges from 260 to 2100. Minimum and maximum S/N (with noted spectrum of the star) and S/N mean values for all the spectra in the data set are next:
-
•
DIB 5545: 430 (HD 147889) – 2010 (HD 159176), ;
-
•
DIB 6113: 270 (HD 144470) – 2080 (HD 142468), ;
-
•
DIB 6196: 330 (15 Sgr) – 1620 ( Sco), ;
-
•
DIB 6445: 260 (HD 185859) – 1920 (HD 142468), ;
-
•
DIB 6614: 305 (HD 203532) – 1750 (HD 63804), .
| Namea | Typeb | V, mag | Sp/L | EB-V, mag | Inst.c |
| HD 14956 | sb | 7.20 | B1.5Ia | 0.89 | B |
| HD 23016 | Be | 5.69 | B9Vne | 0.12 | U |
| omi Per | 3.83 | B1III | 0.27 | U, B | |
| zet Per | V | 2.85 | B1Ib | 0.29 | U |
| 62 Tau ‘’d | 6.34 | B3V | 0.37 | U | |
| HD 34078 | Or | 5.96 | O9.5V | 0.49 | U, B |
| HD 37367 ‘’ | 5.98 | B2IV-V | 0.34 | U | |
| LS 719 | sb | 9.19 | B3Ia | 0.99 | U |
| HD 63804 | sb | 7.78 | B9.5Ia+(e) | 1.05 | U |
| HD 73882 | EB | 7.19 | O8.5IV | 0.68 | U |
| HD 76341 | Em | 7.16 | O9.2IV | 0.50 | U |
| HD 78344 | 9.00 | O9.5/B0(Ib) | 1.34 | U | |
| HD 80077 | sb | 9.00 | B2Ia+e | 1.45 | U |
| HD 91824 ‘’ | SB | 8.14 | O7V((f))z | 0.26 | U |
| Tr 16 112 ‘’ | SB | 9.22 | O6V((fc)) | 0.61 | U |
| HD 97253 ‘’ | SB | 7.09 | O5III(f) | 0.37 | U |
| HD 100099 | 8.08 | O8/9 | 0.37 | U | |
| HD 110432 | Be | 5.31 | B0.5IVpe | 0.47 | U |
| HD 142468 | V | 7.90 | B1Ia/Iab | 0.77 | U |
| HD 144217 | SB | 2.62 | B1V | 0.16 | U, H |
| HD 144470 | bC | 3.97 | B1V | 0.19 | U |
| HD 145502 | 4.00 | B2V | 0.25 | U | |
| sig Sco | bC | 2.89 | O9.5(V)+B7(V) | 0.35 | H |
| HD 147888 | 6.74 | B3/4V | 0.48 | U | |
| HD 147889 | pr | 7.90 | B2III/IV | 1.09 | U, H |
| HD 147933 | 5.05 | B2/3V | 0.43 | H | |
| chi Oph | Be | 4.43 | B2Vne | 0.49 | U, H |
| HD 148688 ‘’ | sb | 5.39 | B1Iaeqp | 0.52 | U |
| zet Oph | Be | 2.56 | O9.2IVnn | 0.29 | U |
| HD 151932 ‘’ | WR | 6.51 | WN7h | 0.57 | U |
| HD 152003 | sb | 7.08 | O9.7IabNwk | 0.61 | U |
| HD 152233 ‘’ | SB | 6.59 | O6II(f) | 0.39 | H |
| HD 152235 ‘’ | sb | 6.38 | B0.5Ia | 0.74 | U |
| HD 152249 | sb | 6.45 | OC9Iab | 0.42 | U |
| HD 152270 | WR | 6.59 | WC7+O5-8 | 0.50 | U |
| HD 154090 ‘’ | sb | 4.87 | B2Iab | 0.45 | H |
| HD 154445 | 5.61 | B1V | 0.37 | U | |
| HD 155450 | 6.00 | B1Ib | 0.21 | H | |
| HD 159176 | SB | 5.70 | O7V((f))+O7V((f)) | 0.34 | U |
| HD 161056 ‘’ | 6.32 | B3II/III | 0.59 | U | |
| V2052 Oph | bC | 5.82 | B3III | 0.21 | U |
| HD 163800 | 7.00 | O7.5III((f)) | 0.57 | U, H | |
| 9 Sgr | Em | 5.97 | O4V((f))z | 0.35 | U |
| 15 Sgr | sb | 5.37 | O9.7Iab | 0.29 | U |
| HD 167771 | SB | 6.54 | O7III((f))+O8III | 0.37 | U |
| HD 169454 ‘’ | sb | 6.71 | B1Ia | 1.10 | U |
| HD 170740 | SB | 5.72 | B2/3II | 0.40 | U |
| 20 Aql | V | 5.34 | B2/3II | 0.31 | U, H |
| HD 184915 | 4.96 | B0.5IIIn | 0.22 | U | |
| HD 185418 ‘’ | 7.49 | B0.5V | 0.39 | U | |
| HD 185859 | Em | 6.52 | B0.5Iae | 0.59 | U |
| HD 193793 ‘’ | WR | 6.85 | WC7p+O5 | 0.69 | B |
| HD 203532 | 6.38 | B3IV/V | 0.31 | U | |
| HD 228712 | sb | 8.67 | B0.5Ia | 1.34 | B |
| Notes. | |||||
| a HD number, Bayer or other designation. | |||||
| b Short type of an object (acronyms adopted from SIMBAD): — star, sb — blue supergiant star, — double star, SB — spectral binary, V — variable star, Or — Variable Star of Orion Type, bC — Variable Star of beta Cep type, Be — Be-type star, WR — Wolf-Rayet star, pr — pre-main sequence star, Em — emission-line star, EB — eclipsing binary. | |||||
| c ‘B’ — BOES, ‘H’ — HARPS, ‘U’ — UVES. | |||||
| d ’ ‘” sightlines with strong asymmetry or signs of splitting in interstellar atomic K i line at 7699 Å. | |||||
So, the spectral intervals utilized in this work have high mean S/N close to 700.
2.3 Choice of diffuse bands.
DIBs for the current study were selected on suggestion that they preserve their intensity ratios in the same manner as DIBs 6196 and 6614 Å while changing sightlines in the Galaxy: EW(DIB)1/EW(DIB)EW(6196)1/EW(6196)2 EW(6614)1/EW(6614)2, where indices 1, 2 stand for two different sightlines. The intensity ratios were calculated by division intensities of DIBs in spectrum of an arbitrary star by those in the spectrum of HD 163800. The spectrum of this object was chosen as reference for quite strong DIBs in it and because it is a simple star: without signs of binarity, variability and so on, see the Table 1.
At first EWs for ten stars were taken from work by Bondar (2012). Later on the set of objects was widened to 54 stars. Initially number of the selected DIBs reached 35, but after a thorough verification most of them were rejected as implausible and also due to big uncertainties in their EWs, their weakness or too noisy spectra. Thus only three bands which demonstrated variations in equivalent widths in agreement with those in DIBs 6196 and 6614 Å in different directions in the Galaxy had been left — 5545, 6113 and 6445 Å.
3 Data analysis and results.
3.1 Data reduction.
Raw spectra were processed by the author either with IRAF (Tody, 1986) or ESO UVES pipeline: http://www.eso.org/sci/software/pipelines/, “esorex” and “gasgano” programs. A set of reduced spectra from HARPS (2007) and UVES (2015) spectrographs was kindly given by Prof. J. Krełowski.
 |
 |
 |
 |
 |
 |
3.2 Analysis of the one-dimensional spectra.
All the one-dimensional spectra were analysed with IRAF spectroscopic package tasks. A special procedure for measurement of equivalent widths with evaluation of uncertainties by method of Vollmann & Eversberg (2006) was created on the basis of the IRAF “splot” task. Equivalent widths have been measured by direct integration of DIB profiles.
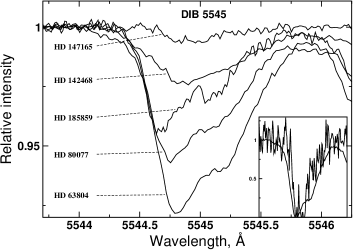
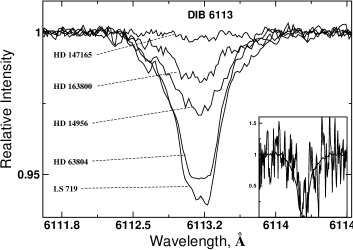
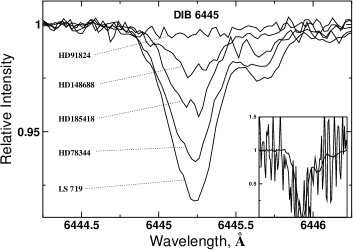
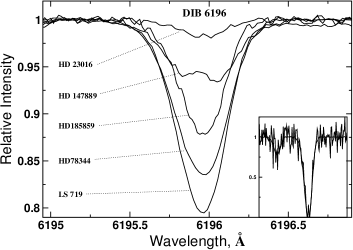
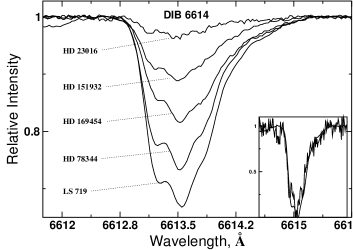
Typical profiles of the 5545, 6113, 6196, 6445 and 6614 Å DIBs ordered according to their intensities are depicted at the Fig. 1. The insets below right, at every picture, show comparison between the weakest and the strongest normalized profiles of the DIB in the spectral data set. It can be seen that the profiles mostly persist their forms well. Though some noticeable variations in them, probably caused by specific local conditions in ISM or by blends with stellar lines are visible: in width, see for example, the inset for DIB 5545 Å in the spectra of HD 63804 and Sco (the strongest and the weakest cases) or appeared structure in the profile of DIB 6196 Å in the spectrum of HD 147889. Profiles of the weak DIBs in spectra with lower S/N can also be significantly distorted.
As to similarity of profiles for DIBs with common origin they do not match well. Though profiles of DIBs 6113 and 6196 Å are quite alike. Common for three other bands is a redward extension visible in their profiles (Fig. 1).
Possible blends of the DIBs with stellar lines were verified on synthetic spectra calculated with the programs ATLAS9 for Kurucz model atmospheres (Kurucz, 1970, 1992) and SYNTHE (Sbordone et al., 2004) according to the spectral type and luminosity of the selected stars.
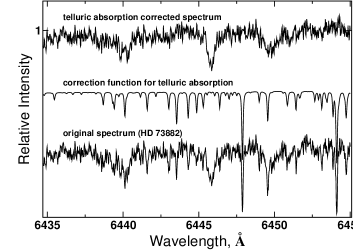
Additionally, for DIB 6445 Å a telluric lines cancellation procedure was applied. For this goal spectrum of a hot star ( Vir) was used. But in many cases it has been realized with “Molecfit” package developed by Smette et al. (2015). It was quite effective, see e. g. mid picture at the right panel of the Fig. 1.
| Star | 5545 | 6113 | 6196 | 6445 | 6614 |
|---|---|---|---|---|---|
| hd14956 | 26.02.8 | 20.12.5 | 44.22.0 | 23.53.1 | 210.44.0 |
| hd23016 | 4.01.8 | 2.93.0 | 6.52.1 | 3.13.5 | 34.84.9 |
| omi Per | 8.82.7 | 5.52.0 | 12.83.1 | 5.11.7 | 50.05.6 |
| zet Per | 8.72.2 | 7.34.9 | 13.42.1 | 6.14.0 | 60.89.3 |
| 62 Tau | 5.72.0 | 3.13.2 | 9.53.1 | 4.83.8 | 43.17.9 |
| hd34078 | 12.93.4 | 4.73.7 | 18.92.7 | 5.93.1 | 57.95.6 |
| hd37367 | 13.92.0 | 10.46.4 | 38.12.9 | 13.64.7 | 140.410.1 |
| LS719 | 53.01.2 | 38.51.8 | 78.81.1 | 40.91.8 | 328.72.7 |
| hd63804 | 63.31.3 | 33.52.4 | 81.21.1 | 36.61.9 | 316.21.9 |
| hd73882 | 5.61.9 | 3.42.9 | 15.91.4 | 4.52.2 | 47.04.1 |
| hd76341 | 5.62.4 | 6.04.8 | 20.72.5 | 6.44.9 | 64.28.3 |
| hd78344 | 36.12.0 | 26.72.3 | 73.62.7 | 30.32.9 | 265.13.0 |
| hd80077 | 44.21.5 | 35.72.4 | 77.41.3 | 35.61.7 | 289.02.5 |
| hd91824 | 7.12.5 | 3.34.5 | 14.13.7 | 3.24.5 | 47.56.5 |
| Tr 16 112 | 5.43.8 | 5.34.3 | 19.73.2 | 9.25.3 | 77.88.6 |
| hd97253 | 11.74.4 | 10.53.5 | 30.23.5 | 14.86.7 | 131.68.9 |
| hd100099 | 3.92.9 | 20.63.9 | 3.92.9 | 62.89.3 | |
| hd110432 | 6.12.1 | 6.13.4 | 16.21.1 | 11.62.8 | 69.34.3 |
| hd142468 | 20.81.6 | 15.81.4 | 55.72.3 | 22.51.6 | 176.82.4 |
| hd144217 | 4.12.7 | 4.96.3 | 11.73.5 | 4.55.4 | 47.29.3 |
| hd144470 | 3.92.3 | 3.47.3 | 13.63.3 | 6.67.0 | 59.76.6 |
| hd145502 | 6.82.3 | 3.55.5 | 14.13.5 | 6.34.3 | 57.57.6 |
| sig Sco | 3.51.6 | 0.90.5 | 16.41.5 | 5.51.4 | 57.83.4 |
| hd147888 | 10.43.2 | 17.83.3 | 7.55.5 | 72.810.9 | |
| hd147889 | 26.83.5 | 16.63.0 | 34.03.7 | 25.03.2 | 178.96.2 |
| hd147933 | 10.83.5 | 4.23.0 | 15.02.1 | 8.42.3 | 62.86.4 |
| chi Oph | 6.62.1 | 2.41.2 | 12.01.8 | 40.44.0 | |
| hd148688 | 12.93.1 | 10.44.0 | 36.91.9 | 10.42.1 | 121.26.3 |
| zet Oph | 3.41.7 | 3.02.2 | 8.31.0 | 3.72.0 | 35.02.8 |
| hd151932 | 11.73.3 | 29.91.8 | 11.92.8 | 114.74.6 | |
| hd152003 | 13.04.7 | 9.13.7 | 28.82.9 | 12.65.2 | 102.95.7 |
| hd152233 | 9.42.7 | 7.83.5 | 19.31.7 | 9.73.0 | 78.95.6 |
| hd152235 | 14.72.0 | 9.92.0 | 32.91.2 | 15.93.0 | 132.23.8 |
| hd152249 | 9.12.9 | 6.62.9 | 19.61.9 | 3.93.0 | 75.65.0 |
| hd152270 | 7.93.9 | 10.46.7 | 20.62.5 | 8.32.3 | 62.05.8 |
| hd154090 | 6.12.7 | 6.31.5 | 18.81.8 | 10.72.4 | 90.55.5 |
| hd154445 | 10.71.9 | 7.71.8 | 22.31.4 | 8.71.5 | 105.14.8 |
| hd155450 | 8.64.2 | 3.50.9 | 15.82.1 | 8.22.7 | 67.75.8 |
| hd159176 | 7.11.0 | 7.11.8 | 20.11.4 | 7.71.8 | 63.12.6 |
| hd161056 | 23.13.9 | 18.04.8 | 32.62.3 | 17.53.4 | 152.46.3 |
| V2052 Oph | 10.42.3 | 7.74.0 | 25.52.7 | 15.35.2 | 115.09.0 |
| hd163800 | 18.42.4 | 11.43.2 | 27.31.4 | 12.22.8 | 119.14.9 |
| 9 Sgr | 7.53.9 | 6.13.9 | 15.62.6 | 7.44.7 | 53.36.1 |
| 15 Sgr | 14.82.6 | 6.15.2 | 21.93.8 | 9.87.8 | 86.38.4 |
| hd167771 | 7.28.1 | 16.93.4 | 6.42.9 | 61.15.4 | |
| hd169454 | 27.82.9 | 20.83.5 | 51.63.1 | 25.34.9 | 190.54.6 |
| hd170740 | 13.23.2 | 7.34.9 | 24.32.9 | 13.05.0 | 118.810.6 |
| 20 Aql | 11.02.5 | 7.52.2 | 19.41.6 | 6.41.3 | 92.04.3 |
| hd184915 | 4.71.8 | 5.22.6 | 16.01.9 | 8.02.9 | 69.15.3 |
| hd185418 | 12.71.6 | 15.35.4 | 34.52.4 | 15.03.2 | 164.96.9 |
| hd185859 | 28.92.9 | 21.05.4 | 42.62.5 | 25.68.8 | 206.011.1 |
| hd193793 | 12.52.3 | 12.74.3 | 43.02.4 | 16.43.9 | 137.44.0 |
| hd203532 | 8.82.2 | 4.63.8 | 12.22.2 | 4.64.8 | 56.810.1 |
| hd228712 | 19.74.1 | 17.25.7 | 53.65.1 | 24.05.4 | 180.76.7 |
Measurements of the equivalent widths with their 1 uncertainties for the five diffuse bands are given in the Table 2. The uncertainties were calculated for pure photon noise statistics by technique used in work by Vollmann & Eversberg (2006). It remains indefinite how much such factors as continuum placement, peculiarities in profiles of diffuse bands themselves (wings, asymmetry); stellar peculiarities — binarity, variability (see the Table 1) which provoke blends with DIBs and also telluric lines remnants, in case of DIB 6445 Å, can contribute to the errors in equivalent widths.
Correct S/N determination can also present some difficulties. DIBs 6113, 6445 and especially 5545 Å have closely located neighbours and thus too short pieces of free continuum to measure S/N. So, if those pieces of spectra were inappropriate for measurements, S/N was to be measured somewhere in other place of the spectral order.
3.3 Correlations between the DIBs.
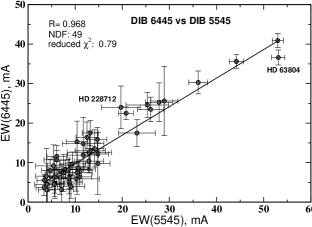
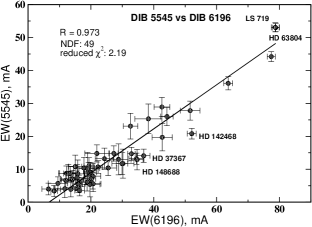
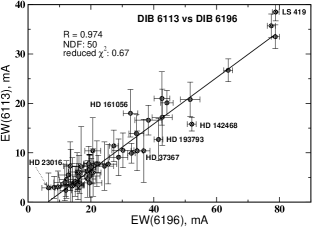
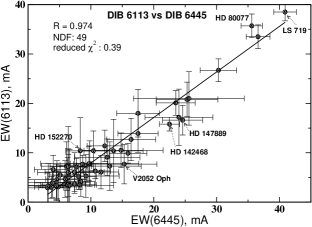
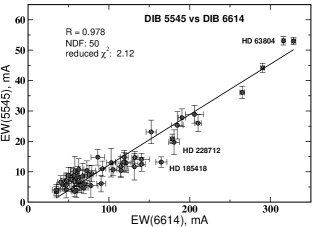
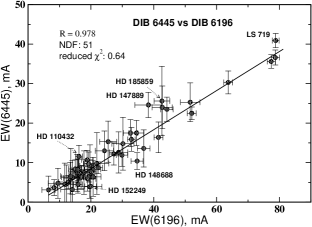
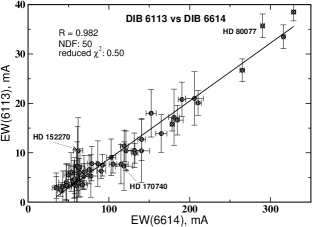
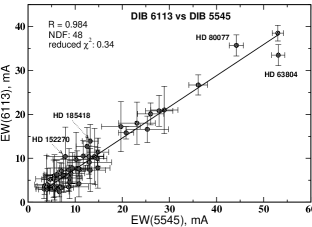
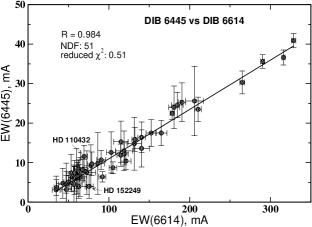
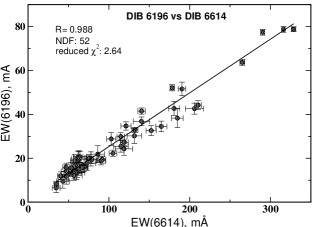
Interrelations between the DIBs have been sought by weighted least squares fitting of measured equivalent widths. All the fits were done by method described in work by Orear (1982) — case when errors in two variables were allowed for. Parameters of the fits as well as those for the inverted fits () are collected in the Table 3. The direct fits are depicted at the Fig. 2. In all plots presented there equivalent widths of stronger DIB were adopted as arguments (X). Respectively, to every pair of the DIBs a weighted linear correlation coefficient, R, has been calculated. The values of R, the number degree of freedom of the fit (NDF) and reduced are shown at the upper left corners on the plots at the Fig. 2.
As it is seen from the figure, the highest value of R = 0.988 was obtained for the pair: DIB 6196 vs DIB 6614 Å. The correlation coefficient R, parameters and determined from the direct and inverse fits between EW(6196) and EW(6614) (see the Table 3) — are in a good agreement with those from the earlier works (see McCall et al., 2010; Krełowski et al., 2016). It concerns especially the former one, where detailed statistical analysis was done with data set twice larger than in the present work.
Other pairs of the diffuse bands: 6445 vs 6614 Å, 6113 vs 5545 Å and 6113 vs 6614 Å also show quite a high degree of correlation R = 0.982 – 0.984, see the Fig. 2. Correlations between other bands remain at nearly equal and still high level R 0.970. Only one pair — DIB 6445 vs DIB 5545 Å has R 0.970.
| Pair of DIBs | ||
|---|---|---|
| 5545:6196 | ||
| 5545:6614 | ||
| 6113:5545 | ||
| 6113:6196 | ||
| 6113:6445 | ||
| 6113:6614 | ||
| 6196:6614 | ||
| 6445:5545 | ||
| 6445:6196 | ||
| 6445:6614 | ||
It is seen from the 2nd and 3rd columns of the Table 3 that the ratios of equivalent widths probably demonstrate a sequence: EW(6196)/EW(6614)1:4, EW(5545)/EW(6614)1:6, and pairs EW(6445)/EW(6614), EW(6113)/EW(6614)1:8.
 |
 |
 |
 |
 |
 |
 |
 |
 |
 |
In vast majority of cases the most deviant points at the Fig. 2 could be explained due to blends with stellar lines. So, in accordance with the synthetic spectra generated with above mentioned programs, ATLAS9 and SYNTHE, DIB 5545 Å in the spectrum of B9.5Ia star HD 63804 (see the plots on the Fig. 2) looks overestimated probably due to the blend with the stellar Fe ii line. And further: DIB 6113 Å in the spectra of HD 185418 (B0.5V), HD 152270 (WC7+O5-8), LS 719 (B3Ia) and HD 80077 (B2Ia) probably has the blend with Ne ii or with Fe ii in the spectrum of HD 23016 (B9Vne). DIB 6445 Å can be blended with the stellar Fe ii line in the spectra of V2052 Oph (B3III), HD 147889 (B2III/IV) or with N iii lines in the spectra of HD 110432 (B0.5IVpe), HD 142468 (B1Ia/Iab), HD 185859 (B0.5Iae), HD 228712 (B0.5Ia). As for DIB 6196 Å, e. g in the spectra of HD 37367 (B2IV-V), HD 142468 (B1Ia/Iab) or other stars with the deviant points at the Fig. 2, it is difficult to say what could increase the DIB’s equivalent width as the stellar Fe iii, near 6194.8 Å, is located quite far from the DIB to create a blend. Contrary can be observable for DIB 5545 Å in the spectrum of HD 185418, see the plots EW(5545) vs EW(6614) or EW(6113) vs EW(5545), there the meaning of equivalent width is much lower of that predicted by fit.
So, in some cases neither too big nor too small values of equivalent widths could be explained. If these effects have not been caused by cosmic ray hits or by defects in spectra then specific local conditions of ISM might be responsible. It is quite probable that such deviant points could be caused by variations in the local physical conditions, especially in the intensity of radiation field and in the interstellar density, which can influence DIB equivalent widths and shapes of their profiles. This effect can be seen, for instance, in spectra of stars in Upper Scorpius (Vos et al., 2011) and in spectra of Local Bubble objects (Bailey et al., 2016; Farhang et al., 2019) or in the spectrum of Her 36 where DIBs have extended red wings (Dahlstrom et al., 2013; Oka et al., 2013).
In many cases weakness of DIBs may be really explained by diminishing of DIB carriers in interstellar medium because of proximity of the hot stars, as it is in Orion Nebula. From the other hand DIBs can be more intense or of normal strengths under nearly the same physical conditions (see Herbig, 1995).
3.4 Spacings between the DIBs.
The DIBs explored here make a set of wavenumber differences or spacings, , which cover the range 218 – 2913 , see the 2nd column of the Table 4. These spacings pretty well match to the energies of vibrational transitions in some molecules including polyatomic ones, such as PAHs, which are quite abundant in ISM (see Léger & Puget, 1984). Such transitions, often ascribed to vibrations in PAHs, are observable as IR emission bands, named earlier as Unidentified Infra-Red (UIR) emission features, see, e. g. review by Mathis (1990) and references therein. Several IR bands at 16.4, 11.3, 7,7, 6.2 and 3.3 µm are presented in the 3rd column of the Table 4. The IR band at 16.4 µm is described in works by (Boulanger et al., 1998; Tielens et al., 1999; Moutou et al., 2000) about four others see, e. g. (Léger & Puget, 1984; Mathis, 1990). In addition there is one band, at 5.3 µm, visible in calculated spectra of PAHs (see Léger et al., 1989).
| DIBs pair | a, | IR bandb, | Ratioc |
| , (, µm) | |||
| 6196 6113 | 218.5 | ||
| 6614 6445 | 394.9 | ||
| 6445 6196 | 624.1 | 609.8 (16.4) | 1.02 |
| 6445 6113 | 842.5 | 884.8 (11.3) | 0.95 |
| 6614 6196 | 1018.9 | ||
| 6614 6113 | 1237.4 | 1298.4 (7.7) | 0.95 |
| 6113 5545 | 1675.8 | 1612.9 (6.2) | 1.04 |
| 6196 5545 | 1894.3 | 1886.8 (5.3)d | 1.00 |
| 6445 5545 | 2518.3 | ||
| 6614 5545 | 2913.2 | 3029.7 (3.3) | 0.96 |
| Notes. | |||
| a — spacings between DIBs. | |||
| b — wavenumbers and wavelengths of vibronic infrared bands ascribed to PAHs. | |||
| c — the ratio spacing/wavenumber of IR band (/). | |||
| d — the band observed in calculated spectra for PAHs, see Léger et al. (1989). | |||
Of all spacings collected in the second column of the Table 4 six — with = 624.1, 842.5, 1237.4, 1675.8, 1894.3 and 2913.2 — demonstrate a relation with the wavenumbers of IR bands. Thus spacings 842.5, 1237.4, 1675.8 and 2913.2 are lesser/greater than their counterparts from IR bands by nearly equal factors (1.04, 1.05), see the 4th column of the Table 4. These IR emissions is now regarded as indicatives of aromatic hydrocarbons due to CH out-of-plane bend vibration at 11.3 µm ( = 884.8 ), C — C at 6.2 µm (1612.9 ), 7.7 µm (1298.4 ) and CH at 3.3 µm (3029.7 ) stretch vibrations, see, for instance, review by Mathis (1990). The spacing = 624.1 cm-1 matches (it is greater by factor 1.02) to the band at 16.4 µm (609.8 ) which a PAH produces due to vibrations (see Moutou et al., 2000). This IR emission has been known from laboratory experiments (Moutou et al., 1996) as 16.2 µm mode in PAH and was first mentioned in Boulanger et al. (1998) as emission observable at 16.5 µm in spectra of NGC 7023 and Oph molecular cloud. The spacing = 1894.3 nearly exactly corresponds to IR band at 5.3 µm (1886.8 ) which was observed in calculated spectra of PAHs and recommended for search in astronomical objects by the authors (see Léger et al., 1989).
So, four pairs: vs from the Table 4 show the same 5% and 4% differences; one pair differs by 2% and one by 0.3%. If to guess PAHs are species responsible for DIBs, what could induce such a divergence? At the present moment it is known about variations in the relative strengths as well as shifts in wavelengths of the IR bands. They may arise from changes in PAHs mixture, including changes in fraction of positively or negatively charged PAHs (Léger et al., 1989; Mathis, 1990). Modes of vibrations depend on internal structure of molecule. For instance, in laboratory spectra the band at 16.4 µm can be produced in the wavelength range 16.21 – 16.52 µm ( = 623 – 611 ), thus varying in its position by 2% (Moutou et al., 2000). The band at 11.3 µm, caused by out-of-plane C — H bending occurs at 11.6 – 12.5 µm ( = 862 – 800 ) if there two C — H bonds on the same aromatic ring, and at 12.4 – 13.3 µm (807 – 752 ) for three bonds (see Mathis (1990) and references therein). Tielens et al. (1999) demonstrated IR bands in the Red Rectangle with 11.0, 11.3, 11.9, 12.8 µm. According to the Table 4 the band at 11.9 µm (840.3 ) quite well corresponds to the spacing = 842.5 .
Wavelengths of IR bands also depend on type of their carriers: whether they are in aromatic or in aliphatic forms. In PAHs C — H stretching gives a band at 3.3 µm. Aliphatic hydrocarbons have a band of weaker intensity at 3.4 µm (2941.2 ) which even better matches to the spacing = 2913.2 , from the Table 4. According to the recent studies (see e. g. Li & Draine, 2012) the fraction of aliphatic constituent in IR bands carriers is 15% — thus they are mostly aromatic. As to the possible carriers of diffuse bands, it is improbably that this group of five DIBs was due to both aliphatic and aromatic hydrocarbons.
In any case a found proximity of spacings between the DIBs to wavenumbers of several IR bands may point to common origin of their carriers: be they PAHs or any other complex molecules.
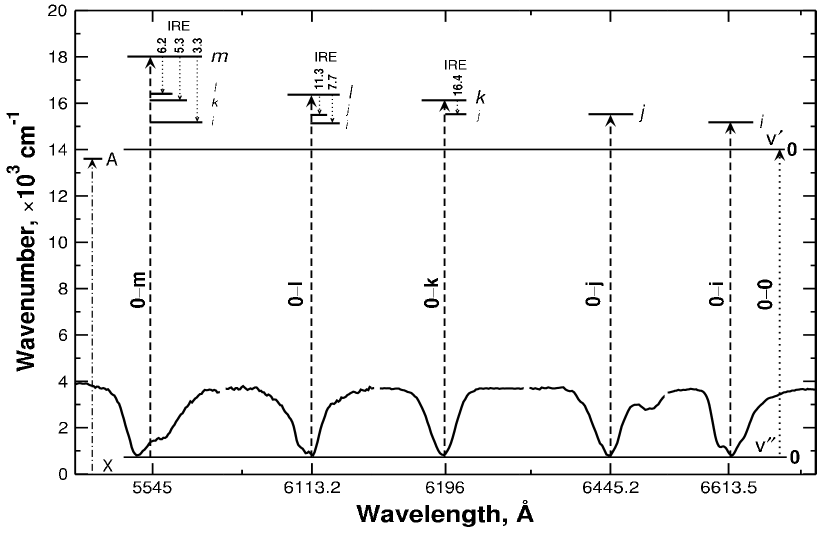
If to suppose that the five diffuse bands analysed in the current study present a fragment of spectrum of a complex molecule — e. g. an electronic transition with rotation-vibrational series — then DIB profiles could be considered as packed, unresolved rotational structure and spacings between the DIBs as differences in energies of vibrational states. Such a series perhaps might look as it is depicted at the Fig. 3. Electronic transition from the ground level to an upper state (e. g. after absorption an energetic photon) can give rise to a series of vibrational transitions from the ground vibrational level to arbitrary upper levels i, j, k, l, m etc. with a set of rotational transitions. Thus, the DIBs at corresponding wavelengths may appear. Later on due to different intramolecular processes the system can go to lower energy states in different ways. One of them vibrational relaxation — energy transfer from upper vibrational levels to different modes of vibrations (radiationless transition without changing electronic state), another — vibrational de-excitation through IR emissions. Several likely transitions between upper () vibrational levels which could lead to IR emissions are shown at the Fig. 3, see also the Table 4. Rotational P, Q, R branch structure may reveal itself as substructure in DIB profiles, see the Fig. 1. Especially it is evident in DIB 6614 Å (see Sarre et al., 1995; Cami et al., 2004). Sometimes a similar substructure (as well as the profile broadening) is developed in DIBs when their carriers are located in regions with higher temperature, determined e. g. on excitation temperature of C2, as it was shown for DIB 6196 Å in the study by Kaźmierczak et al. (2009). On the Fig. 1 the substructure is evident in the profile of DIB 6196 Å in the spectrum of HD 147889. Conspicuous substructure is also observable in the profile of the band at 5545 Å.
If the five DIBs appear as a result of above mentioned factors in such a case the intensity ratios of the DIBs, noted in subsection 3.3 — EW(6196)/EW(6614)1:4, EW(5545)/EW(6614)1:6, EW(6445)/EW(6614) and EW(6113)/EW(6614)1:8, see the Table 3, might have been ratios of the Franck-Condon factors which determine how intensity of an electronic transition is distributed between the different vibrational bands.
On the whole there is not any evident regularity in the found spacings. Moreover in complex molecules vibronic progressions do not necessarily follow simple equation for energies in function of vibrational quantum number ‘’ for the given fundamental frequency ‘’ and inharmonicity ‘’ constants, which depend on electronic state of the molecule. So, finding a regularity in such a case may present a difficult task.
If to look into the whole DIBs’ spectrum there are many pairs of DIBs (not so strong) with values of spacings close to the presented in the Table 4. Those with the best coincidence 0.1 are next: 6600 5866 (1894.3 ); 6486 5850 (1675.8 ); 6768 6245 (1247.4 ); 6325 6005 (842.5 ); 6467 6216 (624.1 ). Many others do not match so well, but here, of course, the precision of DIB wavelengths should be taken into account.
Conclusions
High linear correlation coefficients R = 0.968 – 0.988 could indicate close interrelation of the five considered bands. Correlation and intensities ratio found for two diffuse bands at 6196 and 6614 Å are in a good accordance with the result of McCall et al. (2010), see the Fig. 2 and the Table 3. Two DIBs 6445 and 6113 Å slightly better correlate (R 0.98) with DIB 6614 Å than with DIB 6196 Å; DIB at 5545 Å correlates worse and almost equally with both — R 0.98.
Low could point to errors underestimation and also result from big uncertainties in EW measurements of the weakest DIBs in the set: 6113 and 6445 Å.
Do these DIBs have a common origin despite that fact the forms of their profiles are not alike? There is some similarity in the profiles of DIBs at 6113 and 6196 Å; and three other bands have such a common feature as redward extension.
The spacings presented in the Table 4 do indicate that DIB carriers might rather be related with PAHs or molecular compounds which contain groups of molecules such as CH, C2. Five spacings have values close to the wavenumbers of IR emission bands which were suggested to arise due to vibrations in PAHs: at 16.4, 11.3, 7,7, 6.2 and 3.3 µm; in addition there is one spacing ( = 1894.3 ) that corresponds to the IR band at 5.3 µm (1886.8 ), visible in calculated spectra of PAHs (see Léger et al., 1989).
There is not any evident regularity in the spacings amid the considered DIBs. But a proximity of the spacings to the wavenumbers of the IR bands may be a sign of a close relation of the DIBs’ carriers to PAHs or even that the PAHs are these carriers themselves. It seems that DIBs may arise as a result of excitation of PAHs. IR bands could appear due to intramolecular processes such as de-excitation of vibrational levels in PAHs, see the Fig. 3. Perhaps, to shed light on this issue it makes sense to search and explore the objects in whose spectra both IR bands and DIBs are observable.
Found ratios of equivalent widths have values: EW(6196)/EW(6614)1:4, EW(5545)/EW (6614)1:6, EW(6445)/EW(6614) and EW(6113)/EW(6614)1:8. Whether it is a sign of a regularity, e. g. ratios of their Franck-Condon factors, which influence energy distribution between vibrational bands in a complex molecule or simply a coincidence?
This short investigation if not supports the PAH hypothesis of DIB carriers directly, points to possibility of close relation between DIB carriers and PAHs (see van der Zwet & Allamandola, 1985; Léger & D’Hendecourt, 1985). Perhaps a new profound study of DIBs phenomenon based on PAHs hypothesis may help to answer the above mentioned questions and to reveal the origin of these mystic spectral features.
Acknowledgements
Based on observations made with ESO Telescopes under programmes ID: 67.D-0439(A), 194.C-0833(A,B,D,F), 382.D-0237, 266.D-5655(A), 67.C-0281(A), 097.C-0979(A), 60.A-9036(A), 076.B-0055(A), 0102.C-0040(B), 080.D-0855(A), 083.C-0503(A), 078.C-0403(A), 187.D-0917(A). The author is very grateful to the referee for his relevant and useful comments and suggestions.
References
- Bailey et al. (2016) Bailey M., van Loon J. T., Farhang A., Javadi A., Khosroshahi H. G., Sarre P. J., Smith K. T., 2016, A&A, 585, A12
- Bondar (2012) Bondar A., 2012, MNRAS, 423, 725
- Boulanger et al. (1998) Boulanger F., Boisssel P., Cesarsky D., Ryter C., 1998, A&A, 339, 194
- Cami et al. (1997) Cami J., Sonnentrucker P., Ehrenfreund P., Foing B. H., 1997, A&A, 326, 822
- Cami et al. (2004) Cami J., Salama F., Jiménez-Vicente J., Galazutdinov G. A., Krełowski J., 2004, ApJL, 611, L113
- Chlewicki et al. (1986) Chlewicki G., van der Zwet G. P., Ijzendoorn L. J., Greenberg J. M., Alvarez P. P., 1986, ApJ, 305, 455
- Chlewicki et al. (1987) Chlewicki G., de Groot M. S., van der Zwet G. P., Greenberg J. M., Alvarez P. P., Mampaso A., 1987, A&A, 173, 131
- Dahlstrom et al. (2013) Dahlstrom J., York, D. G., Welty, D. E., et al., 2013, ApJ, 773, 41
- Farhang et al. (2019) Farhang A., van Loon J. T., Khosroshahi H. G., Javadi A., Bailey M., 2019, NatAs, 3, 922
- Friedman et al. (2011) Friedman S. D., et al., 2011, ApJ, 727, 33
- Herbig (1975) Herbig G. H., 1975, ApJ, 196, 129
- Herbig (1988) Herbig G. H., 1988, ApJ, 331, 999
- Herbig (1995) Herbig G. H., 1995, ARA&A, 33, 19
- Herbig & Leka (1991) Herbig G. H., Leka K. D., 1991, ApJ, 382, 193
- Kaźmierczak et al. (2009) Kaźmierczak M., Gnaciński P., Schmidt M. R., Galazutdinov G., Bondar A., Krełowski J., 2009, A&A, 498, 785
- Kim et al. (2007) Kim, K.-M., et al., 2007, PASP, 119, 1052
- Krełowski & Walker (1987) Krełowski J., Walker G. A. H., 1987, ApJ, 312, 860
- Krełowski & Sneden (1995) Krełowski, J., Sneden, C., 1995, “Diffuse interstellar bands in individual sightline”, edited by A. G. G. M. Tielens and T. P. Snow, Vol. 202, 13–24, “Kluwer Academic Publishers”, Dordrecht
- Krełowski et al. (2016) Krełowski J., Galazutdinov G. A., Bondar A., Beletsky Y., 2016, MNRAS, 460, 2706
- Krełowski, Galazutdinov & Bondar (2019) Krełowski, J., Galazutdinov, G., & Bondar, A., 2019, MNRAS, 486, 3537
- Kurucz (1970) Kurucz, R. L., 1970, SAOSR, 309.
- Kurucz (1992) Kurucz, R.L., 1992, Proc. of the 149th Symposium of the IAU, 225.
- Léger & Puget (1984) Léger A., Puget J. L., 1984, A&A, 500, 279
- Léger & D’Hendecourt (1985) Léger A., D’Hendecourt L., 1985, A&A, 146, 81
- Léger et al. (1989) Léger A., D’Hendecourt L. & Défourneau D., 1989, A&A, 216, 148
- Li & Draine (2012) Li A., Draine B. T., 2012, ApJL, 760, L35
- Mathis (1990) Mathis John S., 1990, ARA&A, 28, 37
- McCall et al. (2010) McCall B. J., et al., 2010, ApJ, 708, 1628
- Moutou et al. (1996) Moutou C., Léger A., D’Hendecourt L., 1996, A&A, 310, 297
- Moutou et al. (1999) Moutou C., Krełowski J., D’Hendecourt L., Jamroszczak J., 1999, A&A, 351, 680
- Moutou et al. (2000) Moutou C.,Verstraete L., Léger A., Sellgren K., Schmidt W., 2000, A&A, 354, 17
- Oka et al. (2013) Oka T., Welty D. E., Johnson S., York D. G., Dahlstrom J., Hobbs L. M., 2013, ApJ, 773, 42
- Orear (1982) J. Orear, ”Least Squares When Both Variables have Uncertainties”, Amer. J. Phys., 1982, 50, 912
- Papaj, Krelowski &Wegner (1993) Papaj, J., Krelowski, J. & Wegner, W. 1993, A&A, 273, 575
- Sarre et al. (1995) Sarre P. J., Miles J. R., Kerr T. H., Hibbins R. E., Fossey S. J., Somerville W. B., 1995, MNRAS, 277, 41
- Sbordone et al. (2004) Sbordone, L., Bonifacio, P., Castelli, F., Kurucz, R. L., 2004, Mem. Soc. Astron. Italiana, 5, 93.
- Smette et al. (2015) Smette, A., Sana, H., Noll, S., Horst, H., Kausch, W., Kimeswenger, S., Barden, M., Szyszka, C., Jones, A. M., Gallenne, A., Vinther, J., Ballester, P., Taylor, J., 2015, A&A, 576, 77.
- Tielens et al. (1999) Tielens A. G. G. M., Hony S., van Kerckhoven C., Peeters E., 1999, ESASP, 427, 579
- Tody (1986) Tody, D., 1986, SPIE, 627, 733.
- van der Zwet & Allamandola (1985) van der Zwet G. P., Allamandola L. J., 1985, A&A, 146, 76
- Vollmann & Eversberg (2006) Vollmann, K., Eversberg, T. 2006, Astron. Nachr., 327, 862.
- Vos et al. (2011) Vos D. A. I., Cox N. L. J., Kaper L., Spaans M., Ehrenfreund P., 2011, A&A, 533, A129