On the AGN nature of two UV bright sources at in the CANDELS fields: an update of the AGN space density at
Abstract
It is a widespread opinion that hydrogen reionization is mainly driven by primeval star-forming galaxies, with a minor role of high-z active galactic nuclei. Recent observations, however, challenge this notion, indicating a number of issues related to a galaxy-driven reionization scenario. We provide here an updated assessment of the space density of relatively faint () AGNs at in order to improve the estimate of the photo-ionization rate contribution from accreting super massive black holes. Exploiting deep UV rest-frame ground-based spectra collected at the Very Large Telescope on the CANDELS/GOODS-South field and deep Chandra X-ray images in the CANDELS/GOODS-North and EGS areas, we find two relatively bright () AGNs at . We derive an AGN space density of at and M by simply dividing their observed number by the cosmological volume in the range . Our estimate does not consider corrections for incompleteness, therefore it represents a lower limit, although uncertainties due to cosmic variance can still be significant. This value supports a high space density of AGNs at , in contrast with previous claims mostly based on standard color selection, possibly affected by significant incompleteness. Our estimate for the AGN photo-ionization rate at is in agreement with the observed values at similar redshifts, which are needed to keep the intergalactic medium highly ionized. Upcoming JWST and giant ground based telescopes observations will improve the study of high-z AGNs and their contribution to the reionization of the Universe.
1 Introduction
Identifying the sources responsible for the epoch of reionization (EoR) is still an open and very debated problem in the comprehension of the various transition phases of the Universe (Meiksin, 2009; McQuinn, 2016; Dayal & Ferrara, 2018; Giallongo et al., 2019; Wise, 2019), as witnessed e.g. by the wide interest on this subject in the last Decadal Survey on Astronomy and Astrophysics 2020 (Alvarez et al., 2019; Cooray et al., 2019; Finkelstein et al., 2019b; Furlanetto et al., 2019; Wang et al., 2019; Papovich et al., 2019).
It is now well established that the end of reionization happened relatively late, rapidly, and through a patchy and strongly inhomogeneous process. This picture has been validated by the low optical depth () due to Thomson scattering of cosmic microwave background (CMB) photons by Planck Collaboration (2018a), indicating a midpoint of reionization at and a duration . Recent results by Planck Collaboration (2019) are further lowering down the CMB optical depth, , moving the reionization epoch even later at (Efstathiou & Gratton, 2019, see also) and in a shorter time interval at 68% confidence level (Reichardt et al., 2020).
Recently, Mason et al. (2019) combined constraints from CMB optical depth, dark gap statistics, Lyman- damping wing in quasi-stellar objects (QSOs), and the ratio of Lyman- emitters (LAEs) over Lyman break galaxies (LBGs) at to infer an even later mid-point of reionization, at . This is also consistent with the strong and rapid decrease of the photo-ionization rate observed at by Calverley et al. (2011); Davies et al. (2018a); D’Aloisio et al. (2018) and by the strengthening and hardening of the ionizing background at found by Becker et al. (2019).
The presence of particularly long and deep absorbed troughs in the spectra of QSOs (Becker et al., 2015, 2018; Keating et al., 2020; Kashino et al., 2020) marks the position of the islands of neutral hydrogen, consistent with a very late end of the reionization process (). The analysis of the probability distribution function of the inter-galactic medium (IGM) opacity in the Lyman forest of high-z bright quasars (Bosman et al., 2018; Eilers et al., 2018; Kulkarni et al., 2019b; Eilers et al., 2019) confirms that strong spatial inhomogeneities of neutral hydrogen at are required in order to match these observations, plausibly powered by the shot noise of rare QSOs (Meiksin, 2020).
The first sources of HI ionizing photons, plausibly star-forming galaxies (SFGs) and AGNs, were able to close the so-called “Dark Ages” at redshift , cleaning the fog by neutral hydrogen and producing the widespread metagalactic ionizing background. In the last 15 years, the mainstream on reionization was focused almost totally on high-z SFGs, with the exception of Giallongo et al. (2012, 2015); Madau & Haardt (2015); Boutsia et al. (2018); Grazian et al. (2018); Giallongo et al. (2019); Romano et al. (2019). This choice has been driven by four facts: early WMAP results, heavily affected by dust polarization of the Milky Way, indicated a much earlier reionization epoch, around (Hinshaw et al., 2013); the luminosity function of galaxies is gradually steepening with redshifts at (Finkelstein et al., 2015); numerous galaxies exist even at very faint absolute magnitudes () at (Livermore et al., 2017); at high redshifts, galaxies can be efficient producers of ionizing photons (Bouwens et al., 2016) and there were frequent indications of a large emissivity of ionizing photons from SFGs at (Steidel et al., 2001; Shapley et al., 2006; Nestor et al., 2011; Mostardi et al., 2013, e.g.).
Great uncertainties however affect the determination of the Lyman continuum escape fraction of high-z SFGs. Recent observations of LBGs at z3 by Steidel et al. (2018) indicate that the ionizing emissivity from SFGs, with %, exceeded that of QSOs by a factor . Similar results are obtained recently by Iwata et al. (2019), who infer a 3 upper limits of % for galaxies at z=3.1 with absolute UV magnitude (% if only IGM attenuation is taken into account). Similarly, Bian & Fan (2020) derived a stringent upper limit of 14-32% at 3 to the Lyman continuum escape fraction of faint () LAEs ( Å) at , confirming previous results by Grazian et al. (2016, 2017), while Bosman et al. (2020) reported the measurement of % for a double peak LAE at in the proximity zone of a bright QSO in the background. Jones et al. (2018) combined deep UV imaging with HST and deep spectra by Keck/DEIMOS in the GOODS-North field to search for candidate ionizing sources at . At variance with Steidel et al. (2018) and Iwata et al. (2019), they find that four candidates out of six are contaminated by foreground galaxies at lower-z, the ionizing flux in the GOODS-North region is dominated by a AGN and the remaining candidate galaxy has low escape fraction, well below the required ionization level of the IGM at these redshifts. AGNs could thus provide a significant contribution to the ionizing background at these redshifts. A low Lyman continuum escape fraction % (at 98% c.l.) has been derived by Tanvir et al. (2019) for the host galaxies of long-duration gamma-ray bursts (GRBs), assuming they trace the locations of the massive stars dominating ionizing photon production. Interestingly, they do not find correlation of the escape fraction with the galaxy UV luminosity or host stellar mass, suggesting that faint galaxies at high-z should not dominate the photon budget required for HI reionization.
Reionization models where ultra-faint dwarf SFGs are the main contributors to the UV background (Finkelstein et al., 2019, e.g.) seem also disfavored by the recent scenarios of late and quick reionization mentioned above (Mason et al., 2019; Naidu et al., 2019), since faint dwarf galaxies would start the reionization process too early, in tension with the recent results by Planck and with the evolution of the neutral hydrogen fraction with redshift (Hoag et al., 2019; Keating et al., 2020; Yung et al., 2020).
It is interesting at this regard the fact that the sources with suspected or confirmed Lyman continuum radiation at high redshifts are peculiar and rare, bright SFGs with rather hard ionizing spectra marked by high ionization emission lines (e.g. NV, CIV, HeII, OIII, CIII). Their presence at high redshift can be hardly explained by pure SFGs, even requiring uncommon assumptions (e.g. large stellar rotation, binary stellar population, top heavy initial mass function (IMF), extremely low metallicity) as discussed by a number of recent works (Bradley et al., 2014; Bowler et al., 2014; Kehrig et al., 2015; Stark et al., 2015; Stark, 2016; Jaskot & Ravindranath, 2016; Senchyna et al., 2017; Nakajima et al., 2018; Berg et al., 2018; Chisholm et al., 2019; Jaskot et al., 2019; Le Fevre et al., 2019a; Nanayakkara et al., 2019; Senchyna et al., 2019, 2020; Schaerer et al., 2019; Stanway & Eldridge, 2019, see). The majority of galaxies showing Lyman continuum emission (both at low-z and at ) populate the upper end of the BPT diagram (Baldwin et al., 1981) or occupy a region of the high ionization line ratio in between SFGs and AGNs or mainly populated by AGNs (see e.g. Fig. 11 and 14 by Nakajima et al. 2018). Indeed, Le Fevre et al. (2019a) find a marginal 2 detection in the X-ray stacking of strong CIII emitters at , consistent with the presence of low-luminosity AGNs. Interestingly, it is recently emerging the evidence that local confirmed Lyman continuum emitters or low-z Green Peas, blue compact galaxies, Lyman break analogs, that are usually associated with reliable Lyman continuum candidates, are characterized by significant X-ray emission, not compatible with star-formation activity but more plausibly powered by low-luminosity AGN activity or by a large population of high-mass X-ray binaries (Kaaret et al., 2017; Svoboda et al., 2019; Baldassare et al., 2019; Bao et al., 2019; Bluem et al., 2019; Latimer et al., 2019; Plat et al., 2019; Prescott & Sanderson, 2019; Senchyna et al., 2019, 2020; Wu et al., 2019; Birchall et al., 2020; Dittenber et al., 2020). It is thus possible that pure stellar radiation from SFGs is a negligible source of HI ionizing radiation, and the bulk of Lyman continuum photons escaping at low and high-z are produced instead by accretion onto super massive black holes (SMBHs).
Recently, a revival of the role of bright QSOs and faint AGNs in the EoR is progressively emerging. Giallongo et al. (2015, 2019) found faint AGNs at in the CANDELS fields using the deep Chandra X-ray imaging available in these fields. Sources were selected in the HST H-band as having and (which corresponds to an UV rest-frame selection). AGN candidates were selected looking for significant X-ray emission in the H-band position of sources with photometric or spectroscopic redshifts greater than 4. The analysis suggested a dominant contribution of AGNs to the expected UV background up to and a possible important contribution up to depending on the uncertainties in the evolution of the AGN luminosity function at and on the adopted average escape fraction and mean free path of ionizing photons into the IGM.
Both Cristiani et al. (2016) and Grazian et al. (2018) indicated high escape fractions (%) for QSOs and AGNs at in a wide luminosity range (), while Romano et al. (2019) showed that, at , the ionizing background produced by QSOs should be corrected upward by factor 1.2-1.7 with respect to previous estimates in the literature, due to the longer mean free path of HI ionizing photons. If these values and trends are extrapolated to higher redshifts, then the AGN population can play a significant role in the cosmic reionization. At present, however, a notable source of uncertainty in this respect is the value of Lyman continuum escape fraction of faint type 2 AGNs at high-z, which could be significantly low (Cowie et al., 2009; Micheva et al., 2017, e.g.).
The main criticism111The issues of a too early HeII reionization and the high IGM temperature caused by the hard AGN radiation will be discussed in Section 5. against an HI reionization driven by accreting SMBHs is the dramatically rapid drop of the space density of AGNs of intermediate luminosity at , as resulting from various color-selected surveys (Fan et al., 2001; Cowie et al., 2009; Parsa et al., 2018; Akiyama et al., 2018; Kim et al., 2019; Matsuoka et al., 2018; Yang et al., 2019; Kulkarni et al., 2019a; Cowie et al., 2020). These results, however, could be affected by incompleteness in the observed number of high-z QSOs. For example, at an almost spectroscopically “complete” sample of AGNs by Boutsia et al. (2018) based on a multi-wavelength selection which includes X-ray detections, highlights the possible under-estimation provided by previous analysis (Akiyama et al., 2018; Parsa et al., 2018, e.g.), mainly based on standard color selections. Also at very bright magnitudes (), Schindler et al. (2018, 2019) find an increase of 36% to the number density of QSOs at with respect to the previous results based on SDSS survey (Fan et al., 2001). Moreover, they suggest a moderate evolution of the QSO number density with redshift and a steeper bright-end luminosity function compared to the previous SDSS results (Fan et al., 2001).
The Giallongo et al. (2019) luminosity functions are based on AGN candidates, photometric redshift selections, uncertain corrections due to the X-ray vs optical flux ratio distribution, and thus they are still uncertain, especially at and , where most of the AGN contribution to the UV background is expected. We provide here an updated estimate of the AGN space density in the rest frame UV at and , thanks to the new analysis of two spectroscopically confirmed AGNs at which have been optically selected in the CANDELS/GOODS-North and South fields.
The paper is organized as follows: in Section 2 we describe the data used in this work, in Section 3 we outline the adopted method to measure the space density of AGNs at , and in Section 4 we show the results on the AGN luminosity function and HI photo-ionization rate. Section 5 discusses the reliability of our results and conclusions are provided in Section 6. Throughout the paper, we assume the cold dark matter (-CDM) concordance cosmological model, with round values H km/s/Mpc, , and . Apparent magnitudes are in the AB photometric system.
2 Data
Two relatively faint AGNs have been spectroscopically confirmed at in the CANDELS footprint, i.e. GDN3333 in the GOODS-North field and GDS3073 in GOODS-South. We describe here the dataset available for these two AGNs.
2.1 GDN3333
The AGN GDN3333 lies in the CANDELS/GOODS-North field, at coordinates RA=12:36:47.96 DEC=+62:09:41.3 (J2000) and with an observed magnitude of 23.91 in the F850LP filter of HST. It has been detected in X-ray (0.5-8.0 keV) by the ultradeep 2 Msec Chandra X-ray image of the Chandra Deep Field North (CDFN), as discussed in Alexander et al. (2003). It corresponds to the source with ID=247 in the catalog by Alexander et al. (2003), and it has 138 counts in the 0.5-8.0 keV band. This source has been selected also in the AGN sample by Giallongo et al. (2019) with a flux of 27.2 in the 0.5-2.0 keV band. It is clearly detected in X-ray, with a low probability of spurious detection of .
Spectroscopic information for GDN3333 has been collected in Barger et al. (2002). GDN3333 has a spectroscopic redshift of and, in their catalog, it corresponds to the object with ID=174 (see their Fig. 6). It shows a strong Lyman- line in emission, which is relatively narrow, with a weak NV 1240 line, also in emission. The Lyman- line is barely visible. No other emission lines are seen at Å, since the optical spectrum of GDN3333 is relatively noisy due to strong sky emissions. Based on the available UV rest-frame spectrum only, this object would have been classified as a simple SFG, if it had not been detected in the deep Chandra image in X-ray by Alexander et al. (2003) or by Giallongo et al. (2019). It is worth noting that the NV 1240 line falls on a strong night-sky emission line, thus it is not obvious to assure its presence in the available spectrum by Barger et al. (2002).
Summarizing, given its clear X-ray detection by Chandra, as shown in Alexander et al. (2003) and its secure spectroscopic redshift at z=5.186 provided by Barger et al. (2002), there is no doubt that GDN3333 is an AGN, as concluded also by Giallongo et al. (2019). Moreover, its X-ray over optical flux ratio is (see Fig. 2 of Giallongo et al. 2019), which is one of the highest X/optical flux ratio among the AGN candidates at magnitudes provided by Giallongo et al. (2019). Based on these considerations, we conclude that its X-ray flux cannot come from star formation activity, but it is powered by an accreting SMBH. GDN3333 is the only known AGN brighter than at in the CANDELS fields and it has already been included in the AGN luminosity function at by Giallongo et al. (2019).
2.2 GDS3073
The source GDS3073 has sky coordinate RA=03:32:18.92 DEC=-27:53:02.7 and belongs to the CANDELS/GOODS-South field. Its F850LP magnitude is 24.52 and its spectroscopic redshift is (Raiter et al., 2010; Vanzella et al., 2010). GDS3073 has a spatially compact morphology in the ACS HST images and resemble an almost unresolved point-like source, similar to GDN3333. This object is not detected in the ultradeep 7 Msec X-ray image by Chandra down to a flux limit of in the 0.5-2.0 keV band (Giallongo et al., 2019). GDS3073 has been detected by ALMA in CII at 158m by the ALPINE survey (“ALMA Large Program to INvestigate C+ at Early Times”), as described in Le Fevre et al. (2019b). In the following, we discuss three deep spectroscopic observations of GDS3073 with FORS2, X-Shooter, and VIMOS at the VLT telescope. These spectra indicate that GDS3073 is a bona-fide AGN, as we show in the following. At the end of this section we also summarize the sub-mm properties of GDS3073 by the ALPINE survey with ALMA.
2.2.1 The FORS2 data
GDS3073 has been selected for the FORS2 spectroscopic observations as a F606W-band dropout and has a blue F775W-F850LP color due to a strong Lyman- emission line falling in the F775W band (Raiter et al., 2010). The spectroscopic observations of GDS3073 have been carried out with the ESO VLT FORS2 instrument, yielding a wavelength coverage of approximately 0.55-1 m with a resolving power of . The total exposure time on GDS3073 is of 4 hours (Vanzella et al., 2010).
The FORS2 spectrum of GDS3073 is shown in Fig. 4 of Raiter et al. (2010), in Fig. 1 of Vanzella et al. (2010) and in Fig. 1 of this paper. GDS3073 shows a strong and asymmetric Lyman- line, with rest-frame equivalent width (EW) of Å and a peak at Å, corresponding to a redshift of . It also shows an emission line at the observed wavelength of 9735 Å. This line has been associated to the inter-combination doublet of NIV] at 1483, 1486 Å rest-frame at a redshift of , in agreement with the Lyman- line in emission. The presence of significant NIV] in emission is rather unusual in known astronomical objects, but it is somehow detected in rare “Nitrogen Loud” QSOs (Baldwin et al., 2003; Glikman et al., 2007), where they usually show weak or absent CIV 1549 in emission. Such features have been also detected in the Lynx arc at z=3.4 (Fosbury et al., 2003).
From a detailed fitting of the spectral energy distribution of GDS3073, extending to the IRAC bands, there are clear indications of the presence of strong nebular emission of OIII 5007 and H- (Raiter et al., 2010; Vanzella et al., 2010). Combined with its compact morphology, GDS3073 could be classified as a Green Pea analog at high-z (Cardamone et al., 2009).
The FORS2 spectrum of GDS3073 (Fig.1) shows also the possible presence of NV 1240 emission line at ( Å), although at low significance. This spectrum is not deep enough for a clear detection, but already at this stage the NV line emerges from the continuum. From the FORS2 spectrum alone, it is not possible to conclude whether GDS3073 is a SFG or an AGN, therefore we analyze also the VIMOS and X-Shooter spectra to have further information about its nature.

2.2.2 The VIMOS data
GDS3073 has been observed for 20 hours with the VIMOS spectrograph during the ESO program ID 194.A-2003 (McLure et al., 2018). The raw data from the ESO Science Archive have been reduced with a custom pipeline, described in detail in Grazian et al. (2018).
Fig.2 shows the 1-dimensional VIMOS deep spectrum of object GDS3073. Strong emission lines of high ionization (NV 1240, NIV] 1483-1486) are clearly detected in the spectrum, while other high ionization lines (Lyman-, OVI 1032-1038) are barely visible. The CIV line at 1549.1 Å rest-frame is probably present, but it falls on a sky emission line and it is only barely visible after 20 hours of exposure. In particular, the NV 1240 and OVI 1032-1038 emission lines unambiguously ensure the AGN nature of this object. It is worth noting that the NV 1240 emission line was not clearly detected in the FORS2 spectrum by Raiter et al. (2010); Vanzella et al. (2010), after 4 hours of exposure time, while it is clearly detected here after 20 hours of VIMOS. It clearly indicates that deep exposures are required in order to determine the true nature (SFG vs AGN) of high redshift objects.
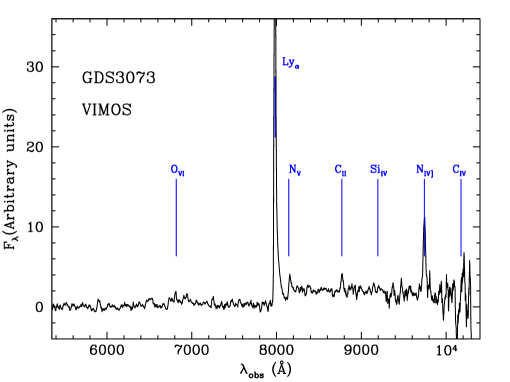
Fig.3 shows a zoom of the VIMOS GDS3073 2-dimensional spectrum close to the Å wavelength range. The OVI 1032-1038 emission line is clearly visible in the spectrum. The OVI 1032-1038 line is clearly detected at a S/N ratio of 6.7. This line unambiguously confirms the AGN nature for GDS3073. Moreover, the Lyman- line in emission is barely detected (S/N=4.4). Also this line is very rare in SFGs, while it is quite common in AGNs and QSOs.

The flux ratio between the Lyman- line and the NV 1240 in the VIMOS spectrum of GDS3073 is 6.6, which is significantly lower than the ratio measured in LBGs by Shapley et al. (2003) (Ly-/NV=15) at or at higher redshifts. This ratio is lower than or more similar to the Ly-/NV ratio in faint high-z AGNs both at (Steidel et al., 2002; Hainline et al., 2011) and at (Hu et al., 2017; Sobral et al., 2017; Laporte et al., 2017; Mainali et al., 2018), with Ly-/NV=1-9. This measurement further corroborates the AGN nature of GDS3073.
2.2.3 The X-Shooter data
GDS3073 has been observed by the X-Shooter spectrograph under two observing programs (384.A-0886 in ESO period 84 and 089.A-0679 in ESO period 89) for a total of 49 hours of net exposure time (21 hours in P84 and 28 hours in P89). The raw data have been reduced with the X-Shooter pipeline available under the ESO REFLEX Pipeline environment222https://www.eso.org/sci/software/esoreflex/. We stack together all the 49 hours of exposure time in a single image, in order to maximize the signal to noise ratio of the resulting spectrum. The X-Shooter spectrum of GDS3073 is rather noisy and only the Lyman- and NIV] 1483-1486 emission lines are clearly detected (Fig. 4, top). There is a hint of OVI 1032-1038 and NV 1240 emission lines, but the S/N ratios of these transitions are quite low due to the higher spectral resolution w.r.t. the VIMOS spectrum, despite the longer exposure time of the X-Shooter spectrum. The CIV 1549 emission line is barely visible in the X-Shooter spectrum, but it falls at the limit of the VIS arm ( Å) and its S/N ratio is very low. Unfortunately, due to the much higher spectral resolution, the X-Shooter spectrum does not add too much information with respect to the VIMOS and FORS2 spectra, but it is useful to confirm independently the presence of OVI, NV, and possibly CIV emission lines. Thus the FORS2, VIMOS, and X-Shooter deep spectra together confirm that GDS3073 is clearly an AGN with narrow emission lines.
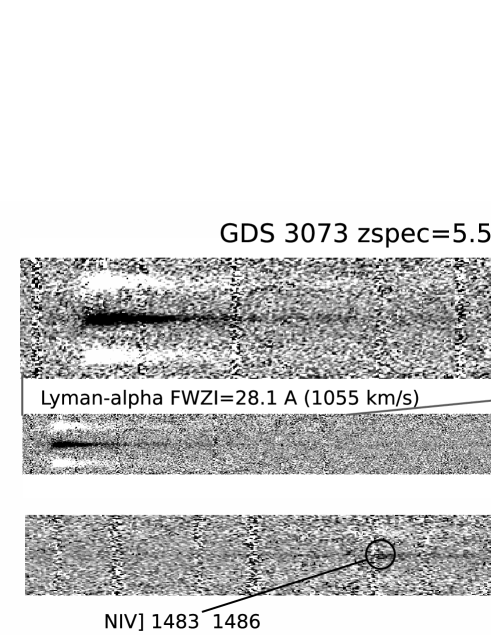
Fig. 4 illustrates a small portion of the 2-dimensional spectrum of GDS3073, showing the details of the Lyman- emission line observed by X-Shooter. Its large extension, with a full width at zero intensity (FWZI) of at least 28 Å, corresponds to a velocity of 1055 km/s. Such velocities are typical of the outflows expected in faint AGNs in the primeval universe (Menci et al., 2019).

2.2.4 ALMA data
In the ALPINE survey, GDS3073 is labeled CANDELS-GOODSS-14 and has a systemic redshift of based on the CII 157.7 m line (Le Fevre et al., 2019b; Bethermin et al., 2020; Cassata et al., 2020). In the ALMA datacube, GDS3073 shows a compact morphology (unresolved at the ALMA spatial resolution of 0.7 arcsec beam), and its kinematics are mainly dominated by velocity dispersion. The large redshift difference between the Lyman- and the C+ emissions corresponds to km/s (Cassata et al., 2020). In the ALMA C+ map of GDS3073, a faint tail is present, extending towards the north-west of the optical source, as shown in Fig. 4 of Le Fevre et al. (2019b). The large spatial and velocity offset, which is an almost frequent case for ALMA detected sources (Carniani et al., 2017, e.g.), could be a plausible indication of an on-going merger of GDS3073 with a dusty companion galaxy. This merger could be at the origin of the AGN activity for GDS3073.
3 The Method
The availability of two faint () AGNs, spectroscopically confirmed at in a relatively small area covered by the CANDELS-GOODS survey, allows an improved estimate of the space density of high-z accreting SMBHs. The computation of the AGN Luminosity Function at in the CANDELS fields has been carried out following the same technique adopted in Boutsia et al. (2018). In order to derive an estimate of the space density of faint AGNs, we decide to use in the computation only the spectroscopically confirmed AGNs analyzed here, i.e. GDN3333 and GDS3073. We start from their HST magnitudes, taken from the CANDELS official catalogs (Guo et al., 2013; Barro et al., 2019), and from their spectroscopic redshifts, which have been summarized here in Table 1.
We derive the absolute magnitude at 1450 Å rest frame (M1450) for each source from the HST magnitude and by applying a K-correction according to the following equation:
| (1) |
where is the luminosity distance, expressed in pc, and the k-correction is given by
| (2) |
The AGN intrinsic slope has been fixed to -0.7, while Å is the central wavelength of the filter, and Å. The choice of the band for M1450 calculation allows us to minimize the k-correction. The absolute magnitudes M1450 have been included in Table 1.
| Name | zspec | M1450 | |
|---|---|---|---|
| GDN3333 | 5.186 | 23.91 | -22.56 |
| GDS3073 | 5.563 | 24.52 | -22.10 |
The AGN space density at has been computed by adopting the approach, without any correction for incompleteness. We want indeed to be sure that our luminosity function is a reliable estimate and it is not plagued by possible uncertainties. In order to compare our results with the recent ones derived in the CANDELS fields by Giallongo et al. (2019), we adopt the same area and the same redshift interval. The total area used here is 551.5 sq. arcmin., which is the sum of the individual HST pointings of the CANDELS/GOODS-North, GOODS-South, and EGS. The adopted redshift interval is . It is worth noting that in the EGS field the spectroscopic search for high-z objects has not been carried out extensively as in the GOODS fields, so it is possible that other AGNs are present in this field. In principle, we should exclude the EGS field from the volume computation here. We decided however to take into account also the EGS fields in order to be comparable with the results of Giallongo et al. (2019). Of course, if we reduce the area only to the two GOODS fields, for a total of 346 sq. arcmin., then the AGN space density provided here should be increased by a factor of .
4 Results
4.1 The luminosity Function of faint AGNs at
The space density of faint (, M) AGNs at has been derived in the CANDELS fields as described in Section 3. It is worth noting here that the CANDELS luminosity function has been derived by simply dividing the actual number of the spectroscopically confirmed AGNs by the comoving volume between . No correction for any kind of incompleteness has been applied to the measured density, and any incompleteness corrections would move the space density of AGNs upwards. There could be indeed other faint high-z AGNs which have not yet spectroscopically identified or with shallow spectra that do not allow a reliable classification, as happened in the past with old data for GDN3333 and GDS3073.
| zspec | M1450 | |||
| 5.5 | -22.33 | 1.291 | 1.717 | 0.854 |
Table 2 reports the space density of AGNs in the CANDELS fields. Fig.5 summarizes the resulting luminosity function of QSOs/AGNs at . It shows the space density obtained from the CANDELS fields (filled blue pentagon), using objects GDN3333 and GDS3073. Error bars to the space density have been derived by adopting the statistics of Gehrels (1986) for low number counts. This plot compares the luminosity function obtained in this paper with the one (red filled squares) recently derived by Giallongo et al. (2019). Other small open symbols in Fig.5 are a summary of the AGN space density determinations at (Jiang et al., 2016; Yang et al., 2016; Marchesi et al., 2016; Ricci et al., 2017; Onoue et al., 2017; Parsa et al., 2018; McGreer et al., 2018; Chehade et al., 2018; Matsuoka et al., 2018; Shin et al., 2020). The dotted and continuous red lines in Fig.5 are the Giallongo et al. (2019) best fit luminosity functions at . In particular, the dotted line is the best fit obtained by leaving all parameters free during the fitting procedure (their model 3), while the red continuous curve has been obtained by fixing the two slopes to the best fit values derived at (model 4). The blue continuous curve is the best fit AGN luminosity function by Kulkarni et al. (2019b). When the mean redshifts of the various luminosity functions displayed here are not centered at , i.e. the mean value of our survey, we correct the original densities, taken from the literature, by a factor , with , as found by Fan et al. (2001). Table 3 provides the complete list of the AGN space densities at from recent works, as shown in Fig.5.
| paper | redshift | M1450 | Selection criterion | ||
| Included in the AGN’s luminosity function fitting procedure | |||||
| Jiang et al. (2016) | 5.7-6.4 | -29.0,-27.0 | optical colors | 52 | 11240 |
| Yang et al. (2016) | 4.7-5.4 | -29.3,-26.8 | optical colors | 99 | 14555 |
| Chehade et al. (2018) | 5.7-6.4 | -27.5,-26.5 | optical/NIR colors | 6 | 3119 |
| Giallongo et al. (2019) | 5.0-6.1 | -20.0,-19.0 | NIR/X-ray | 9 | 0.15 |
| Excluded from the AGN’s luminosity function fitting procedure | |||||
| Marchesi et al. (2016) | 3.0-6.85 | X-ray | 174 | 2.2 | |
| Ricci et al. (2017) | 5.0-6.5 | -22.5,-18.5 | X-ray to UV conversion | ||
| Onoue et al. (2017) | 5.7-6.5 | -23.5,-22.5 | optical colors | 2 | 6.5 |
| Parsa et al. (2018) | 5.0-6.5 | -21.0,-19.0 | NIR/X-ray | 1 | 0.09 |
| McGreer et al. (2018) | 4.7-5.4 | -26.4,-22.4 | optical/NIR colors | 37 | 105 |
| Matsuoka et al. (2018) | 5.7-6.5 | -26.5,-22.0 | optical colors | 110 | 650 |
| Shin et al. (2020) | 4.6-5.4 | -26.0,-23.0 | optical/NIR colors | 10 | 6.5 |
A collection from the recent literature of the space densities of QSOs and AGNs at , shown in Fig.5. The upper part of the table summarizes the space densities used for the luminosity function fitting, while the lower part of the table includes space densities, typically associated to faint absolute magnitudes, which have not been considered during the fitting process. Only the faintest data points of Giallongo et al. (2019) have been considered for our luminosity function derivation. The Giallongo et al. (2019) luminosity function is based on a rest-frame UV (observed NIR AB magnitude) selected sample with photometric redshift greater than 4 and with robust associations to X-ray sources. The X-ray luminosity function from Marchesi et al. (2016) has been converted into an UV luminosity function by Ricci et al. (2017) based on a standard X-ray/UV luminosity ratio distribution.
As can be seen from Figure 5, the CANDELS space density (blue filled pentagon), without any corrections, agrees well with and it is even larger than the luminosity function by Giallongo et al. (2019) at (red filled squares), which at these luminosities has one AGN at . Our data point is slightly higher than their fit (model 3, red dotted line), possibly indicating that the space density of AGNs is even larger than previous estimates by Giallongo et al. (2019). It is also consistent with their best fit value (model 4, red continuous line). At this stage, the AGN space density at in CANDELS is much larger than the luminosity function determinations appeared recently in the literature. In particular, our luminosity function is ruling out the results of McGreer et al. (2018); Matsuoka et al. (2018); Cowie et al. (2020) and it is only marginally consistent with Marchesi et al. (2016); Ricci et al. (2017); Onoue et al. (2017); Parsa et al. (2018); Kulkarni et al. (2019b); Shen et al. (2020); Shin et al. (2020).
Due to the relatively small area of the CANDELS survey, the cosmological volumes probed by this paper is still limited, and no AGN brighter than has been presently found in GOODS-North and GOODS-South fields. For this reason, very limited information exists at (), i.e. the plausible position of the break of the AGN luminosity function at . The recent determinations by McGreer et al. (2018) and Matsuoka et al. (2018), e.g., are probably affected by incompleteness, and they are possibly underestimating the luminosity function even at the break. Efficient rest-frame UV color selections coupled with morphological criteria could severely underestimate the AGN space density at high redshifts, as found by Boutsia et al. (2018); Stevans et al. (2018) and Adams et al. (2020) at slightly lower redshifts (), or at by Shin et al. (2020).

We have refined the best fit AGN luminosity function at provided in the Equation 2 of Giallongo et al. (2019) with our new CANDELS data point at , given in Table 2. We have compared our volume densities derived in the CANDELS fields with that of the brightest () QSOs selected in the SDSS and ATLAS/WISE surveys (Jiang et al., 2016; Yang et al., 2016; Chehade et al., 2018), where selection biases with respect to the morphological appearance and X-ray properties are small (upper part of Table 3). At these bright magnitudes, indeed, no X-ray selected QSO with strong absorption in the rest-frame optical/UV is expected, and optical colors or X-ray selections are both representative of the same global AGN population. At fainter magnitudes, incompleteness in surveys based on optical color becomes significant and the scatter in their observed number densities is large. For this reason we did not include in our best fitting procedure the luminosity function points derived from color selected surveys in the range but we show them in Fig.5 and in the lower part of Table 3 only for comparison with our results. The resulting best fit luminosity function after the minimization procedure is summarized in Table 4 and it is shown by the continuous green line in Fig.5.
| zspec | |||||||
|---|---|---|---|---|---|---|---|
| BEST FIT | 5.5 | -23.78 | 1.535 | 3.175 | 1.45 | 0.13 | |
| -1 | 5.5 | -27.68 | 2.205 | 4.055 | 0.16 | 0.02 | |
| +1 | 5.5 | -22.52 | 1.090 | 2.920 | 1.74 | 0.16 | |
| MIN | 5.5 | -27.68 | 2.205 | 4.055 | 0.16 | 0.02 | |
| MAX | 5.5 | -23.54 | 1.305 | 3.320 | 2.42 | 0.22 |
and are the faint and bright slopes, respectively, of the AGN Luminosity Function at . The lines correspond to the minimum and maximum slopes allowed by the best fit at 68% confidence level, respectively. The -1 corresponds to the minimum photo-ionization rate (MIN ) while the maximum value of the photo-ionization rate (MAX ) is not associated to the +1 limit of the best fit luminosity function due to the covariance between the four parameters , , , and .
The uncertainties on the best fit luminosity function parameters have been derived by considering all the possible solutions satisfying , where is . Here is the minimum value associated to the best fit solution, while is the number of degree of freedom, i.e. the number of independent data points used (eleven) minus the number of fitted parameters, in our case four. Since we lack reliable space densities around the knee of the luminosity function, at , the position of the break is presently unconstrained and the uncertainties span a wide range, from -27.7 to -22.5, with a best fit at , corresponding to a density of . The lack of suitable data around causes a strong degeneracy between and , with an almost linear spread from and up to and , which corresponds to the 1 limits. The uncertainty on the two slopes of the luminosity function has a range between 1.1 and 2.2 for the faint-end slope, with a best fit of 1.53, and an interval of 2.9-4.0 for the bright end slope, with a best fit of 3.2. The dashed green lines in Fig.5 correspond to the two extreme luminosity functions at 1 confidence level.
Following Giallongo et al. (2019), we have repeated the best fit of the luminosity function by fixing the two slopes to and (model 3) and and (model 4). The position of the knee of the luminosity function is thus at and for model 3 and and for model 4, respectively. These values are pretty consistent with the best fit obtained in Giallongo et al. (2019), with a slightly higher normalization.
4.2 The ionizing background at and implications on Reionization
We compute the emissivity at Å rest frame by integrating the luminosity function, multiplied by L, from 0.01 to 100. An escape fraction of 100% has been assumed, adopting a spectral slope of and of between 1450 and 1200 Å rest frame and between 1200 and 912 Å rest frame, respectively (Schirber & Bullock, 2003). This choice corresponds to a flux ratio of 1.67 between 1450 and 912 Å. The adopted spectral slopes are similar to the ones derived by Lusso et al. (2015). The Photo-ionization rate has been computed following Giallongo et al. (2019), adopting the mean free path of HI ionizing photons of Worseck et al. (2014), which is 9 proper Mpc at . The value of has been increased by a factor of 1.2, in order to take into account the contribution by radiative recombination in the IGM (D’Aloisio et al., 2018). We leave to Section 4 of Giallongo et al. (2019) for further details about the calculations of the emissivity and photo-ionization rate. In order to derive the 1 interval for we have considered all the possible combinations of luminosity function parameters which agree at 68% level with the best fit solution, and for each combination of the four parameters we compute the photo-ionization rate at . Due to the degeneracy between and , outlined in the previous sub-section, the 1 uncertainty in the photo-ionization rate is limited to the interval 0.02-0.22, with a peak probability for . This value corresponds to 46% of the UV background inferred by Davies et al. (2018a), or alternatively to the 29% of the one by D’Aloisio et al. (2018). The red triangle in Fig.6 shows the photo-ionization rate , with its 1 confidence level, produced by AGNs at , adopting the luminosity function parameterization summarized in Table 4. The ionizing background produced by AGNs has been compared with the values inferred from the ionization status of the IGM, derived by different analysis of the Lyman- forest of high-z QSOs (Faucher-Giguère et al., 2008; Calverley et al., 2011; Wyithe & Bolton, 2011; Becker & Bolton, 2013; Davies et al., 2018a; D’Aloisio et al., 2018).

According to recent results by Romano et al. (2019), the photo-ionization rate produced by AGNs at should be increased by a factor of 1.7 with respect to the nominal value adopted in the literature, due to a larger mean free path compared to Worseck et al. (2014). If the correction factor of 1.7 also yields at , then the photo-ionization rate in Table 4 and Fig.6 turns out to be , which is in agreement with the value of the UV background measured at by Calverley et al. (2011); Davies et al. (2018a); D’Aloisio et al. (2018). Indeed, this value corresponds to 82% of the UV background inferred by Davies et al. (2018a), or alternatively to the 52% of the one by D’Aloisio et al. (2018). A further correction of the ionizing background of could be in place due to the impact of AGN jet lobes, according to Torres-Alba et al. (2020). These effects can have important consequences on the role of AGNs and SFGs in the reionization of the Universe.
5 Discussions
The results of this paper rely on the AGN classification of two objects, i.e. GDN3333 and GDS3073 in the CANDELS GOODS fields. The former object is a secure AGN, due to the strong X-ray emission by the 2Msec Chandra image (Barger et al., 2002; Alexander et al., 2003; Giallongo et al., 2019). The nature of the latter object, instead, has been questioned many times in the past (Fontanot et al., 2007; Stark et al., 2007; Wiklind et al., 2008; Vanzella et al., 2010; Raiter et al., 2010) with different interpretations. We provide here clues in favor of the AGN classification for GDS3073. We discuss in the following (Section 5.1) the reliability of this classification. In Section 5.2, we discuss the implications of our luminosity function determination. In Section 5.3 we discuss the new results we have achieved from the analysis of the AGN luminosity function at .
5.1 Is GDS3073 an AGN or a SFG ?
The absence of any detectable X-ray emission (Giacconi et al., 2002; Giallongo et al., 2019) or radio production (Kellermann et al., 2008) from GDS3073 down to relatively low flux levels preliminarly suggests a SFG interpretation for this object (Raiter et al., 2010; Vanzella et al., 2010). Composite galaxy spectra at by Shapley et al. (2003) show high ionization emission lines (e.g. NV, CIV) with P-Cygni profiles, which have been usually associated to powerful stellar winds or shocks. This classification scheme has been also adopted by Heckman et al. (2011) to interpret the spectra of local galaxies with strong emission lines. On the basis of these considerations, it was concluded that GDS3073 was a (somehow peculiar) SFG. We discuss in the following some evidences in favor of the AGN nature for this object.
GDS3073 was initially selected as an AGN candidate by Fontanot et al. (2007) on the basis of the adopted optical color selection and morphological criteria. The presence of an extremely strong Lyman- and a NIV] 1483,1486 inter-combination line in emission, coupled with the apparent absence of NV 1240 emission line in the shallow FORS2 spectrum (Raiter et al., 2010), induced them to classify this object as an HII galaxy (similar to the one described by Fosbury et al. 2003) at high-z.
The emission lines OVI 1032,1038, Lyman-, Lyman-, NV 1240, and NIV] 1483,1486 have been detected in the X-Shooter, FORS2 or VIMOS spectra of GDS3073. The presence of these high ionization lines in the UV rest-frame spectrum of GDS3073, however, seems to indicate that this object is powered by an AGN (see Fig. 5 by Le Fevre et al. 2019a). The powerful emission line doublet NIV] 1483,1486, for example, has been usually detected in high-redshift radio galaxies, as well as in rare optically selected QSOs (Hainline et al., 2011). In addition, the NV line at 1240 Å rest-frame is an indicator of high ionization state typical of narrow-line type II AGNs and low-luminosity QSOs (Hainline et al., 2011; Laporte et al., 2017), and its presence indicates bona-fide AGN radiation. The ionization potential of OVI is 100 eV, while NV 1240 has a slightly lower threshold of 78 eV, much more than expected from the typical emission of stellar populations (see Fig. 1 of Feltre et al. 2016). The Lyman- 1026 Å line in emission is usually detected in QSOs/AGNs (see Fig. 14 by Le Fevre et al. 2019a) but it is never detected in pure SFGs (Shapley et al., 2003).
According to Chisholm et al. (2019), massive stars with age less than 3 Myr can produce non negligible NV 1240 emission, e.g. adopting the BPASS stellar population synthesis model (Stanway et al., 2016). In order to have a prominent NV 1240 emission in the spectrum of a SFG, the age of GDS3073 should be very low, below 5 Myr, since this spectral feature drops very fast with the stellar population age and it is observable only under rare circumstances. Given the red SED of GDS3073, its high stellar mass and its present star formation rate, it seems quite implausible that this object is a young starburst whose light is dominated by very massive and extremely young stars. Indeed, GDS3073 is strongly detected in the 5.8 and 8.0 m IRAC bands, where no nebular line or strong nebular continuum are expected at , suggesting a high galaxy stellar mass of . An AGN interpretation for GDS3073 is more natural, and could explain in a simple way the presence of other strong emission lines with high ionizing potential, such as NIV], which is usually not observed in massive stars nor predicted by stellar evolution models (Leitherer et al., 2010, 2014). In addition, it is worth noting that Glikman et al. (2007) found a peculiar faint QSO with NIV] 1483,1486 in emission and with P-Cygni profile for NV 1240 emission line, similar to the GDS3073 spectral features, and Matsuoka et al. (2019) reported NV 1240 P-Cygni emission for the stack of 18 narrow-line QSOs. Thus, the P-Cygni profile is not a univocal signature of radiation by massive stars, but it can be also associated to faint AGN activity.
The FWZI of the Lyman- line for GDS3073 is of the order of 1050 km/s (Fig.4). Such powerful outflows with velocities exceeding 1000 km/s are beyond what stellar winds can commonly produce. Strong outflows, detected in high ionization absorption lines, are typically linked to the presence of hidden AGNs (Cimatti et al., 2013; Genzel et al., 2014; Karman et al., 2014; Brusa et al., 2015; Talia et al., 2017; Forster-Schreiber et al., 2019; Menci et al., 2019, e.g.,). This is a further indication that the source GDS3073 is being powered by an AGN.
The non detection of GDS3073 in X-ray is not in contrast with the AGN classification for this source. Steidel (2002) provided an example of a AGN which was not detected in the deep 1 Msec Chandra X-ray image of the GOODS-North field. This object has not been detected in X-ray also in the deeper 2 Msec Chandra image, after adopting the X-ray forced photometry with prior position from the HST detected sources, as described in Giallongo et al. (2019). It is thus not surprising that GDS3073 has not been detected in the ultradeep 7 Msec Chandra X-ray image (Giallongo et al., 2019). A similar case has been provided by Mignoli et al. (2019), where they indicate that strong CIV emitters at high-z are associated with bona-fide AGNs. In particular, the CIV emitters with narrow lines have been classified as type-2 AGNs and they have only less than 50% probability to be detected in deep X-ray images. Recently, Nardini et al. (2019) report the discovery of a significant sample (25%) of X-ray under-luminous (by a factor of 3-10) QSOs among a well defined and homogeneous sample of 30 QSOs that represent the most luminous, radio-quiet, non-broad absorption line, and intrinsically blue quasar population. The GDS3073 source in the CANDELS fields could be a similar case of X-ray dim AGN at higher redshift and fainter luminosity. It is worth noting at this aim that an X-ray obscuration is not a clear indication of a negligible Lyman continuum escape fraction, as discussed in Giallongo et al. (2019), since the absorption of UV and X-ray radiation are originated by two distinct materials (hydrogen vs metals) surrounding the SMBH.
If we fit GDS3073 with stellar libraries such as Bruzual & Carlot (2003), we obtain a star formation rate of 23 and a stellar mass of (Grazian et al., 2015; Santini et al., 2015). According to Forster-Schreiber et al. (2019), there is an elevated () AGN fraction among compact SFGs with which are close to the galaxy Main Sequence. Thus, it is likely that GDS3073 hosts an AGN at its center, as shown in the previous sections through deep UV rest-frame spectroscopy.
GDS3073 has been classified as an extended source in Vanzella et al. (2010), based on the comparison of its FWHM with observed stellar profiles and on a morphological fitting using a single Sersic profile as a template. We repeat a similar fit starting from a deeper333Hubble Legacy Fields (HLF) Data Release 2.0 for the GOODS-South region https://archive.stsci.edu/prepds/hlf/ HST F850LP image (Whitaker et al., 2019), resampled at a pixel scale of 30 milliarcsec. We use galfit version 3.0 (Peng et al., 2010) with two components, i.e. a point-like profile and a Sersic profile, leaving the centroid, the magnitudes, and the morphological parameters of the Sersic profile free to vary. In order to build the input PSF for galfit, we use a sample of relatively bright stars within 2 arcminutes from GDS3073. The resulting best fit gives a magnitude for the point source of 24.75 in the F850LP filter, while the extended source has a magnitude of 26.19 and a Sersic index close to 1. The ratio between the two components is of the order of 4, and it could resamble the ratio observed in local Seyfert galaxies, where the host galaxy is clearly visible and is not outshined by the active nucleus (Chen & Hwang, 2018, e.g.). If we convert the apparent nuclear magnitude into absolute magnitude, we obtain , i.e. 0.23 magnitude fainter than the total absolute magnitude inferred in Table 1. Adopting this conservative value for our calculation of the AGN space density, the central bin moves by only 0.11 magnitudes, with negligible effects on the parameterization of the luminosity function and the derivation of the photo-ionization rate by AGNs.
We have provided here a number of observational evidences supporting the presence of an AGN in GDS3073: the low-luminosity quasar/AGN interpretation may explain the NIV] emission indicating the presence of a hard radiation field, the broad Lyman- component, the presence of other high ionization lines in emission (OVI, Lyman-, NV). We can thus conclude that GDS3073 is a robust AGN at .
5.2 Is the AGN Luminosity Function at reliable ?
As already mentioned above, the estimate of the luminosity function in Fig. 5 is simply based on the ratio of the number of spectroscopically confirmed AGNs at in the CANDELS fields (GDN, GDS, and EGS) divided by the total cosmological volume of the survey in the same redshift interval. No correction for incompleteness have been applied to the observed space density. It is worth noting here that an extensive spectroscopic search for AGNs in the EGS field has not been carried out yet, so in principle we could exclude the EGS field from our calculations: if we follow this decision, the total survey volume will be reduced by a factor of , with a corresponding enhancement of the space density by the same amount.
At high redshifts, a serious issue for the luminosity function determination is the uncertainty due to the cosmic variance. We do not take into account here the effect of cosmic variance on the error bars of the luminosity function in Fig. 5. Since the CANDELS fields adopted here are based on three extra-galactic areas in different sky locations (GDN, GDS, and EGS), we expect that the effect of cosmic variance is mitigated.
5.3 What can we learn from the AGN Luminosity Function at ?
The AGN nature of GDN3333 and GDS3073 is of particular importance, since strong claims of the lack of numerous high-z AGNs at the faint side of the UV luminosity function (Matsuoka et al., 2018; McGreer et al., 2018, e.g.) are based on the lack of objects showing broad emission lines. These lines are indeed characteristics in bright QSOs typically detected at bright absolute magnitudes of . The narrow Lyman- lines of GDN3333 and GDS3073 indicate instead that the search for faint high-z AGNs must be carried out in a different way, for example through deep spectroscopy from space, e.g. with JWST. Ultra-deep spectroscopy from the ground could be a viable alternative before the advent of JWST, provided that the exposure time will be long enough, as done for GDS3073, or the observations will be carried out with powerful future generation telescopes (e.g. GSMT, EELT, TMT). Interestingly, recent results by Matsuoka et al. (2019) indicate that of QSOs at are showing strong and narrow Lyman- in emission. Their spectra are clearly different from that of the other QSOs, and show also NV 1240 in emission. These narrow line QSOs could be even more common at faint magnitudes, in the luminosity regime covered by the GDN3333 and GDS3073 sources.
The luminosity functions of Matsuoka et al. (2018); McGreer et al. (2018) are significantly underestimated w.r.t. our determination in CANDELS, which, it is worth stressing, is not subject to any bias or systematics. As discussed in Boutsia et al. (2018) and Giallongo et al. (2019), optical surveys based on optical color selection can be subject to strong incompleteness. This is especially true if their efficiencies are relatively high at , as for the case of e.g. Matsuoka et al. (2018). This could indicate that their selection criteria are rather stringent, in order to avoid the many contaminants, but their completeness turns out to be very low. Indeed, the color selection adopted by Matsuoka et al. (2018) is rather stringent, of . If we check the optical photometry of GDN3333 and GDS3073 from CANDELS, we obtain much bluer colors, of 0.12 for GDN3333 ( and ) and 0.69 for GDS3073 ( and ). Adopting the Matsuoka et al. (2018) color criterion, these two sources would not have been selected as high-z AGNs. It is thus not surprising at all the low level of the AGN space densities observed by Onoue et al. (2017); Matsuoka et al. (2018); McGreer et al. (2018) and Shin et al. (2020) with respect to our determination.
We note that our criterion does not rely on any limitation in terms of line width, consequently it is not biased with respect to the standard AGN spectral classification. Indeed, both type-1 and type-2 AGNs can be selected by our criterion. GDS3073 has a Lyman- line width of 600 km/s, or somewhat larger due to the strong IGM absorption along the blue wing (Vanzella et al., 2010). This value is typical of type-2 narrow-lined AGNs whose line widths are in the range km/s. Typical faint narrow-lined AGNs similar to our source are also present in the large LBG sample by Steidel et al. (2002). The presence of OVI emission along the line of sight shows the presence of highly ionized gas by hard UV photons. It is to note in this respect that recent results on type-2 AGNs are suggesting that geometrical/obscuration effects are not the main mechanisms producing the spectral differences between type-2 and type-1 AGNs. Indeed, type-2 AGNs often show faint broad components associated with average smaller black hole masses for a given X-ray luminosity (Onori et al., 2017). These considerations support the hypothesis of a significant contribution by this sub-class of AGNs whose abundance in the early phases of galaxy formation at is just emerging from our spectra and similar observations in other surveys.
Another consideration is that the incompleteness corrections applied by Giallongo et al. (2019) relied on the observed distribution of AGN candidates in the UV-rest/X-ray plane since their intrinsic distribution is not known a priori, especially at . For this reason, the UV/X-ray flux ratio could be biased towards brighter X-ray emitters, and thus the completeness correction in the volume densities of X-ray selected sources should be considered as a conservative lower limit, as discussed in Giallongo et al. (2019). The fact that GDS3073 is a confirmed AGN without X-ray emission may indicate that the incompleteness in Giallongo et al. (2019) is of the order of 50% at .
These limitations can in general be alleviated at shallower UV-rest and X-ray flux limits over larger sky areas. The progressive reduction in the last years of the Chandra sensitivity in the soft energy bands, however, prevents the planning of future medium-deep surveys in such larger areas. A multiwavelength effort is required to increase our knowledge on the space density of AGNs at and intermediate UV luminosities. Our paper shows that detailed spectral analysis focused on the detection of the NV and OVI high ionization emission lines in very deep spectra (with JWST and ELT in the future) of the UV brightest, Lyman- emitters can be an effective method to reveal signs of AGN activity in bright star forming galaxies. A further complementary approach comes from variability analysis in deep multicolor fields. In a recent study by Pouliasis et al. (2019), source variability has been investigated in the GOODS-South region providing the selection of faint AGNs up to . Noticeably, only 26 out of these 113 AGNs (23%) have been detected in X-ray by the ultra-deep 7 Msec Chandra image, indicating that there is a possible incompleteness of X-ray selected AGNs at high-z and faint luminosities. In Giallongo et al. (2019) we have found similar correction factors of 2-3 at , confirming these results.
An unbiased determination of the AGN luminosity function is useful in order to interpret correctly the number density of SFGs at high-z. The AGNs studied in this paper have UV luminosities which are comparable or fainter than the brightest SFGs observed at these redshifts (Finkelstein et al., 2019). It is thus possible that some AGNs brighter than the characteristic magnitude (-20) of the LBG luminosity function at can contribute to enhance its normalization artificially. The case of object GDS3073 is anecdotal. In previous works it has been classified as a SFG, and it thus contributed to the bright side of the LBG luminosity function at . As also proposed by Kulkarni et al. (2019b), it is possible that an enhanced incidence of faint AGNs at high-z is consistent with the flat bright-end slopes detected by Bowler et al. (2012, 2014); Bradley et al. (2014); Bowler et al. (2015) for the UV luminosity function of galaxies relative to a Schechter function. At lower redshifts, i.e. , the issue of the transition region between bright galaxies and faint AGNs has been studied by Stevans et al. (2018); Adams et al. (2020). Based on the recent results of Boutsia et al. (2018), Adams et al. (2020) concluded that there is a significant contribution of AGNs in the bright side of the luminosity function of galaxies, at , confirming our hypothesis.
The AGN nature of GDN3333 and GDS3073 is also important for the interpretation of the ratio of Lyman- emitters among LBGs at and its implications for reionization (Hoag et al., 2019). Both these AGNs, and in particular GDS3073, could have been misidentified as bright LAEs at high redshift, systematically biasing the observed LAE/LBG ratio towards higher values. As a notable example at higher redshifts, the peculiar LAEs spectroscopically confirmed, e.g., by Stark et al. (2015); Oesch et al. (2015); Roberts-Borsani et al. (2016); Schmidt et al. (2016); Laporte et al. (2017); Mainali et al. (2018); Tilvi et al. (2020) at are not expected due to an almost neutral IGM (Keating et al., 2020). The Lyman- detections could instead indicate that these objects are powered by highly ionizing radiation not produced by star-formation, and they are able to carve large ionized bubbles. Indeed, this hypothesis is corroborated by the detection of high-ionization lines, e.g. NV, CIV, HeII, OIII, CIII, in their UV rest-frame spectra.
5.4 The IGM temperature and the HeII reionization in an AGN-driven reionization scenario
Two issues related to an AGN-driven reionization scenario are a too high IGM temperature predicted at compared to the Lyman forest estimates (Becker & Bolton, 2013) and a too early HeII reionization expected at , which according to observations should be almost completed at (Garaldi et al., 2019). Recent measurements have revised upward the IGM temperature measured in the Lyman forest at (Hiss et al., 2018; Walther et al., 2019; Hiss et al., 2019; Telikova et al., 2019) and at (Gaikwad et al., 2020). In particular the latter work confirms the late and inhomogeneous scenario, where islands of neutral material are still persistent till , with strong spatial fluctuations of the IGM temperature.
An early population of faint AGNs can sustain extended HeII reionization at , but predicts a too low optical depth in HeII at (Puchwein et al., 2018). Using high S/N ratio QSO spectra by COS-HST, Worseck et al. (2019) observed at and narrow transmission spikes in the HeII forest at , the signposts of isolated patches of fully reionized helium. These measurements are in agreement with the predictions based on the stochasticity of the space density of ionizing sources such as high-z AGNs and the partial reionization of optically thick absorbers near the completion of the reionization process (Compostella et al., 2014; Chardin et al., 2015, 2017; Madau, 2017). In practice, strong fluctuations in HeII absorption could be due to spatial variation of the hard UV background in an already ionized medium at (Morrison et al., 2019). A soft UV background produced by a homogeneous distribution of ubiquitous ultra-faint SFGs at is in tension with such measurements. Moreover, if the hydrogen reionization is driven by SFGs with hard ionizing radiation, that show strong HeII, NV or CIV emission lines (Schaerer et al., 2019; Chisholm et al., 2019), they should emit copious amount of high-energy photons with eV, with the drawback, highlighted above, of a too early HeII reionization at .
6 Summary and Conclusions
We have used deep HST and ground-based images from the CANDELS GOODS-North, GOODS-South, and EGS fields in order to derive the space density of faint (, M) AGNs at . Thanks to the deep VLT spectroscopy with FORS2, VIMOS, and X-Shooter, we confirm the AGN nature for the source GDS3073 in the GOODS-South field, at and M. The presence of high-ionization emission lines (OVI, Lyman-, NV, NIV]) detected in the UV rest-frame spectra of GDS3073 indeed corroborates its AGN activity, even if this source is not detected in the ultradeep 7 Msec X-ray image by Chandra. The deep 2 Msec Chandra X-ray images of the GOODS-North field allow us to select another AGN, GDN3333, at and M. Interestingly, without the availability of deep Chandra X-ray imaging, this object would be classified as a normal SFG, due to the limited spectroscopic information available in the UV rest-frame wavelengths.
The AGN space density at M has been computed by dividing the number of observed AGNs by the total cosmological volume within in the CANDELS footprints (area=551.5 sq. arcmin.), without any correction for incompleteness. The derived space density of faint AGNs in the redshift interval is a lower limit for two main reasons: 1-we do not correct our data for incompleteness, which could be present at such faint observed magnitudes. 2-The adopted CANDELS area comprises also the EGS field, but the spectroscopic search for high-z objects in EGS has not been carried out as extensively as in the GOODS fields, thus a reduction of the effective survey area (of a factor 1.6) could be applied, with a corresponding enhancement of the luminosity function by the same amount.
We obtain a space density of at and M (). This value is much higher than recent determinations in the literature (McGreer et al., 2018; Matsuoka et al., 2018; Cowie et al., 2020), which could be affected by severe incompleteness, and it is marginally consistent with Marchesi et al. (2016); Ricci et al. (2017); Onoue et al. (2017); Parsa et al. (2018); Kulkarni et al. (2019b); Shen et al. (2020); Shin et al. (2020). Our new value is consistent or even higher than the one derived by Giallongo et al. (2019), although statistics in our measurements are still poor and could be affected by cosmic variance.
Connecting our new point at M with other AGN volume densities both at brighter (Jiang et al., 2016; Yang et al., 2016; Chehade et al., 2018) and fainter magnitudes as described in Giallongo et al. (2019), we have derived a faint-end slope of . This slope is similar to the one derived by Giallongo et al. (2019) at , although slightly flatter. The new determination of the AGN luminosity function in this paper, together with the results derived by Giallongo et al. (2019), can provide new predictions on the redshift evolution of the global AGN number density at , revising previous expectations (Kulkarni et al., 2019b; Shen et al., 2020, e.g.).
A Photo-ionization rate has been derived by adopting our new best-fit of the AGN luminosity function and standard redshift evolution of the mean free path of ionizing photons into the IGM (Worseck et al., 2014). We note in this context that adopting the new evolutionary scenario for the mean free path derived by Romano et al. (2019), would result in a photo ionization rate times higher, yielding . This value for the HI ionizing background is in agreement () to the recent estimates at derived from the analysis of the ionization level of the IGM (Calverley et al., 2011; Davies et al., 2018a; D’Aloisio et al., 2018) and suggests an important or even dominant contribution of the global AGN population to the ionizing UV background into the reionization epoch at , if such trend is confirmed at higher redshifts.
An important role of AGNs and QSOs in the cosmological reionization process may also provide a natural explanation for the large line-of-sight scatter on scales of 50 cMpc in the Lyman- opacity at (Becker et al., 2015; Chardin et al., 2015; Bosman et al., 2018; Eilers et al., 2018; Keating et al., 2020; Bosman et al., 2020; Meiksin, 2020) and for the quick and late drop of the neutral fraction of the IGM from to Hoag et al. (2019); Keating et al. (2020); Yung et al. (2020). Such features are not expected in galaxy-dominated reionization models (Naidu et al., 2019).
As discussed in Section 2.2.2, deep spectroscopic follow-up is required in order to determine the nature (SFG vs AGN) of high redshift sources selected by means of multi-wavelength criteria. In particular, deep spectroscopy is fundamental to detect the faint NV 1240 or CIV 1549 emission lines, which are clear signatures of the AGN activity even in narrow emission line sources (Boutsia et al., 2018; Matsuoka et al., 2019). Confirmation of AGNs requires ultra-deep spectroscopy extended in the NIR regime, on ground based 8-10m class telescopes. Indeed, the failure in the detection of NV in emission in some of the brightest galaxies could be simply due to the currently adopted shallow UV rest-frame spectra (Capak et al., 2011, e.g.).
An updated determination of the AGN luminosity function is particularly helpful for a correct evaluation of the SFG space density around . If the galaxy sample is contaminated by faint AGNs, which are mimicking the presence of bright and rare SFGs, it is possible to overestimate the galaxy luminosity function at the bright end. It is thus possible that the results by Bowler et al. (2012, 2014); Bradley et al. (2014); Bowler et al. (2015) at or by Bridge et al. (2019) at are affected by the presence of hidden faint AGNs. Moreover, cleaning the SFG samples from sources powered by AGNs is fundamental in order to measure with high accuracy the Lyman continuum photon production efficiency. Present renditions of at lower redshifts (Nanayakkara et al., 2020), indeed, could be biased high due to the presence of unrecognized AGNs, especially the sources dominated by high ionization lines in emission, e.g. those characterized by high OIII/OII line ratio or large EWs in HeII or H. A clear separation between SFGs and AGNs is also important in order to derive an unbiased estimate of the fraction of LAEs among LBGs, which have deep implications on the derivation of the neutral hydrogen fraction at high-z.
Deep JWST spectroscopy with NIRSpec of all the known Lyman- emitters and LBGs at down to luminosities of will be of fundamental importance to reveal the abundance of faint AGNs at the EoR. In the future GMT, EELT, and TMT telescopes will shed light on the early accretion history in the Universe. In particular, the AO-assisted MICADO instrument (Davies et al., 2018b) at the ESO ELT will provide the most detailed morphological information of the continuum and nebular emission from sources hosting young accreting SMBHs.
References
- Adams et al. (2020) Adams, N. J., Bowler, R. A. A., Jarvis, M. J., et al. 2020, MNRAS, 494, 1771
- Aird et al. (2018) Aird, J., Coil, A. L., & Georgakakis, A., 2018, MNRAS, 474, 1225
- Aird et al. (2019) Aird, J., Coil, A. L., & Georgakakis, A., 2019, MNRAS, 484, 4360
- Akiyama et al. (2018) Akiyama, M., He, W., Ikeda, H., et al. 2018, PASJ, 70S, 34
- Alexander et al. (2003) Alexander, D. M., Bauer, F. E., Brandt, W. N., et al. 2003, AJ, 126, 539
- Alvarez et al. (2019) Alvarez, M. A., Fialkov, A., La Plante, P., et al. 2019, Astro2020 Decadal Survey Science White Paper, arXiv:1903.04580
- Baldassare et al. (2019) Baldassare, V. F., Geha, M., Greene, J., 2019, ApJ subm., arXiv:1910.06342
- Baldwin et al. (1981) Baldwin, J. A., Phillips, M. M., Terlevich, R., 1981, PASP, 93, 5
- Baldwin et al. (2003) Baldwin, J. A., Hamann, F., Korista, K. T., et al. 2003, ApJ, 583, 649
- Barger et al. (2002) Barger, A. J., Cowie, L. L., Brandt, W. N., et al. 2002, AJ, 124, 1839
- Bao et al. (2019) Bao, M., Chen, Y., Yuan, Q., et al. 2019, MNRAS, 490, 3830
- Barro et al. (2019) Barro, G., Pérez-González, P. G., Cava, A. et al. 2019, ApJS, 243, 41
- Becker & Bolton (2013) Becker, G. D. & Bolton, J. S. 2013, MNRAS, 436, 1023
- Becker et al. (2015) Becker, G. D., Bolton, J. S., Madau, P., et al. 2015, MNRAS, 447, 3402
- Becker et al. (2018) Becker, G. D., Davies, F. B., Furlanetto, S. R., et al. 2018, ApJ, 863, 92
- Becker et al. (2019) Becker, G. D., Pettini, M., Rafelski, M., et al. 2019, ApJ, 883, 163
- Berg et al. (2018) Berg, D. A., Erb, D. K., Auger, M. W., et al. 2018, ApJ, 859, 164
- Bethermin et al. (2020) Bethermin, M., Fudamoto, Y., Ginolfi, M., et al. 2020, A& A subm., arXiv:2002.00962
- Bian & Fan (2020) Bian, F., & Fan, X., 2020, MNRAS, 493L, 65
- Birchall et al. (2020) Birchall, K. L., Watson, M. G., Aird, J., 2020, MNRAS, 492, 2268
- Bluem et al. (2019) Bluem, J., Kaaret, P., Prestwich, A. et al. 2019, MNRAS, 487, 4093
- Bosman et al. (2018) Bosman, S. E. I., Fan, X., Jiang, L., et al. 2018, MNRAS, 479, 1055
- Bosman et al. (2020) Bosman, S. E. I., Kakiichi, K., Meyer, R. A., et al. 2020, ApJ subm., arXiv:1912.11486
- Boutsia et al. (2018) Boutsia, K., Grazian, A., Giallongo, E. et al. 2018, ApJ, 869, 20
- Bouwens et al. (2016) Bouwens, R. J., Smit, R., Labbé, I., et al. 2016, ApJ, 831, 176
- Bowler et al. (2012) Bowler, R. A. A., Dunlop, J. S., McLure, R. J., et al. 2012, MNRAS, 426, 2772
- Bowler et al. (2014) Bowler, R. A. A., Dunlop, J. S., McLure, R. J., et al. 2014, MNRAS, 440, 2810
- Bowler et al. (2015) Bowler, R. A. A., Dunlop, J. S., McLure, R. J., et al. 2015, MNRAS, 452, 1817
- Bradley et al. (2014) Bradley, L. D., Zitrin, A., Coe, D., et al. 2014, ApJ, 792, 76
- Bridge et al. (2019) Bridge, J. S., Holwerda, B. W., Stefanon, M., et al. 2019, ApJ, 882, 42
- Brusa et al. (2015) Brusa, M., Bongiorno, A., Cresci, G., et al. 2015, MNRAS, 446, 2394
- Bruzual & Carlot (2003) Bruzual, G., & Charlot, S. 2003, MNRAS, 344, 1000
- Calderone et al. (2019) Calderone, G., Boutsia, K., Cristiani, S., et al. 2019, ApJ, 887, 268
- Calverley et al. (2011) Calverley, A. P., Becker, G. D., Haehnelt, M. G., & Bolton, J. S., 2011, MNRAS, 412, 2543
- Capak et al. (2011) Capak, P. L., Riechers, D., Scoville, N. Z., et al. 2011, Nature, 470, 233
- Cardamone et al. (2009) Cardamone, C., Schawinski, K., Sarzi, M., et al. 2009, MNRAS, 399, 1191
- Carniani et al. (2017) Carniani, S., Maiolino, R., Pallottini, A., et al. 2017, A&A, 605, A42
- Cassata et al. (2020) Cassata, P., Morselli, L., Faisst, A., et al. 2020, A& A subm., arXiv:2002.00967
- Chardin et al. (2015) Chardin, J., Haehnelt, M. G., Aubert, D., & Puchwein, E. 2015, MNRAS, 453, 2943
- Chardin et al. (2017) Chardin, J., Puchwein, E., & Haehnelt, M. G. 2017, MNRAS, 465, 3429
- Chehade et al. (2018) Chehade, B., Carnall, A. C., Shanks, T., et al., 2018, MNRAS, 478, 1649
- Chen & Hwang (2018) Chen, Y.-C. & Hwang, C.-Y., 2018, ARep, 62, 853
- Chisholm et al. (2019) Chisholm, J., Rigby, J. R., Bayliss, M., et al. 2019, ApJ, 882, 182
- Cimatti et al. (2013) Cimatti, A., Brusa, M., Talia, M., et al. 2013, ApJL, 779, 13
- Civano et al. (2016) Civano, F., Marchesi, S., Comastri, A., et al. 2016, ApJ, 819, 62
- Compostella et al. (2014) Compostella, M., Cantalupo, S., & Porciani, C. 2014, MNRAS, 445, 4186
- Cooray et al. (2019) Cooray, A., Chang, T.-C., Unwin, S., et al. 2019, BAAS, 51g, 23
- Cowie et al. (2009) Cowie, L. L., Barger, A. J., Trouille, L., 2009, ApJ, 692, 1476
- Cowie et al. (2020) Cowie, L. L., Barger, A. J., Bauer, F. E., et al. 2020, ApJ, 891, 69
- Cristiani et al. (2016) Cristiani, S., Serrano, L. M., Fontanot, F., Vanzella, E., & Monaco, P. 2016, MNRAS, 462, 2478
- D’Aloisio et al. (2018) D’Aloisio, A., McQuinn, M., Davies, F. B., & Furlanetto, S. R., 2018, MNRAS, 473, 560
- Davies et al. (2018a) Davies, F. B., Hennawi, J. F., Eilers, A.-C., Lukić, Z., 2018a, ApJ, 855, 106
- Davies et al. (2018b) Davies, R., Alves, J., Clenet, Y., et al. 2018b, SPIE, 10702, 1S
- Dayal & Ferrara (2018) Dayal, P. & Ferrara, A. 2018, Physics Reports, 780, 1
- Dittenber et al. (2020) Dittenber, B., Oey, M. S., Hodges-Kluck, E., et al. 2020, ApJ, 890, 12
- Efstathiou & Gratton (2019) Efstathiou, G., & Gratton, S. 2019, arXiv:1910.00483
- Eilers et al. (2018) Eilers, A.-C., Davies, F. B., Hennawi, J. F., 2018, ApJ, 867, 30
- Eilers et al. (2019) Eilers, A.-C., Hennawi, J. F., Davies, F. B., et al. 2019, ApJ, 881, 23
- Fan et al. (2001) Fan, X., Strauss, M. A., Schneider, D. P., et al. 2001, AJ, 121, 54
- Faucher-Giguère et al. (2008) Faucher-Giguère, C.-A., Lidz, A., Hernquist, L. & Zaldarriaga, M., 2008, ApJ, 688, 85
- Feltre et al. (2016) Feltre, A., Charlot, S., Gutkin, J., et al. 2016, MNRAS, 456, 3354
- Finkelstein et al. (2015) Finkelstein, S. L., Ryan, R. E. Jr., Papovich, C., et al. 2015, ApJ, 810, 71
- Finkelstein et al. (2019) Finkelstein, S. L., D’Aloisio, A., Paardekooper, J.-P., et al. 2019, ApJ, 879, 36
- Finkelstein et al. (2019b) Finkelstein, S. L., Bradac, M., Casey, C., et al. 2019b, BAAS, 51c, 221
- Fontanot et al. (2007) Fontanot, F., Cristiani, S., Monaco, P., et al. 2007, A&A, 461, 39
- Forster-Schreiber et al. (2019) Forster-Schreiber, N. M., Ubler, H., Davies, R. L., et al. 2019, ApJ, 875, 21
- Fosbury et al. (2003) Fosbury, R. A. E., Villar-Martin, M., Humphrey, A., et al. 2003, ApJ, 596, 797
- Furlanetto et al. (2019) Furlanetto, S., Beardsley, A., Carilli, C., L., et al., 2019, BAAS, 51c, 142
- Gaikwad et al. (2020) Gaikwad, P., Rauch, M., Haehnelt, M. G., et al. 2020, MNRAS subm., arXiv:2001.10018
- Garaldi et al. (2019) Garaldi, E., Compostella, M., Porciani, C., 2019, MNRAS, 483, 5310
- Gehrels (1986) Gehrels, N. 1986, ApJ, 303, 336
- Genzel et al. (2014) Genzel, R., Forster Schreiber, N. M., Rosario, D., et al. 2014, ApJ, 796, 7
- Giacconi et al. (2002) Giacconi, R., Zirm, A., Wang, J., et al. 2002, ApJS, 139, 369
- Giallongo et al. (2012) Giallongo, E., Menci, N., Fiore, F., et al. 2012, ApJ, 755, 124
- Giallongo et al. (2015) Giallongo, E., Grazian, A., Fiore, F., et al. 2015, A&A, 578A, 83
- Giallongo et al. (2019) Giallongo, E., Grazian, A., Fiore, F., et al. 2019, ApJ, 884, 19
- Glikman et al. (2007) Glikman, E., Djorgovski, S. G., Stern, D., et al. 2007, ApJL, 663, 73
- Grazian et al. (2015) Grazian, A., Fontana, A., Santini, P., et al. 2015, A&A, 575A, 96
- Grazian et al. (2016) Grazian, A., Giallongo, E., Gerbasi, R., et al. 2016, A&A, 585A, 48
- Grazian et al. (2017) Grazian, A., Giallongo, E., Paris, D., et al. 2017, A&A, 602A, 18
- Grazian et al. (2018) Grazian, A., K. Boutsia, Giallongo, E., et al. 2018, A&A, 613A, 44
- Guo et al. (2013) Guo, Y., Ferguson, H. C., Giavalisco, M., et al. 2013, ApJS, 207, 24
- Hainline et al. (2011) Hainline, K. N., Shapley, A. E., Greene, J. E., et al. 2011, ApJ, 733, 31
- Heckman et al. (2011) Heckman, T. M., Borthakur, S., Overzier, R., et al. 2011, ApJ, 730, 5
- Hinshaw et al. (2013) Hinshaw, G., Larson, D., Komatsu, E., et. al., 2013, ApJS, 208, 19
- Hiss et al. (2018) Hiss, H., Walther, M., Hennawi, J. F., et al. 2018, ApJ, 865, 42
- Hiss et al. (2019) Hiss, H., Walther, M., Onorbe, J., et al. 2019, ApJ, 876, 71
- Hoag et al. (2019) Hoag, A., Bradac, M., Huang, K., et al. 2019, ApJ, 878, 12
- Hu et al. (2017) Hu, W., Wang, J., Zheng, Z.-Y., et al. 2017, ApJ, 845, 16
- Iwata et al. (2019) Iwata, I., Inoue, A. K., Micheva, G., et al. 2019, MNRAS, 488, 5671
- Jaskot & Ravindranath (2016) Jaskot, A. E., & Ravindranath, S., 2016, ApJ, 833, 136
- Jaskot et al. (2019) Jaskot, A. E., Dowd, T., Oey, M. S., et al. 2019, ApJ, 885, 96
- Jiang et al. (2016) Jiang, L., McGreer, I. D., Fan, X., et al. 2016, ApJ, 833, 222
- Jones et al. (2018) Jones, L. H., Barger, A. J., Cowie, L. L., et al. 2018, ApJ, 862, 142
- Kaaret et al. (2017) Kaaret, P., Brorby, M., Casella, L., Prestwich, A. H., 2017, MNRAS, 471, 4234
- Karman et al. (2014) Karman, W., Caputi, K. I., Trager, S. C., et al. 2014, A&A, 565A, 5
- Kashino et al. (2020) Kashino, D., Lilly, S. J., Shibuya, T., et al. 2020, ApJ, 888, 6
- Keating et al. (2020) Keating, L. C., Weinberger, L. H., Kulkarni, G., Haehnelt, M. G., Chardin, J. 2020, MNRAS, 491, 1736
- Kehrig et al. (2015) Kehrig, C., Vilchez, J. M., Perez-Montero, E., et al. 2015 ApJ, 801, L28
- Kellermann et al. (2008) Kellermann, K. I., Fomalont, E. B., Mainieri, V., et al. 2008, ApJS, 179, 71
- Kim et al. (2019) Kim, Y., Im, M., Jeon, Y. et al. 2019, ApJ, 870, 86
- Kulkarni et al. (2019a) Kulkarni, G., Keating, L. C., Haehnelt, M. G., et al. 2019a, MNRAS, 485L, 24
- Kulkarni et al. (2019b) Kulkarni, G., Worseck, G., & Hennawi, J. F., 2019b, MNRAS, 488, 1035
- Laporte et al. (2017) Laporte, N., Nakajima, K., Ellis, R. S., et al. 2017, ApJ, 851, 40
- Latimer et al. (2019) Latimer, C. J., Reines, A. E., Plotkin, R. M., et al. 2019, ApJ, 884, 78
- Le Fevre et al. (2019a) Le Fevre, O., Lemaux, B. C., Nakajima, K., et al. 2019a, A&A, 625, A51
- Le Fevre et al. (2019b) Le Fevre, O., Bethermin, M., Faisst, A., et al. 2019b, A&A subm., arXiv:1910.09517
- Leitherer et al. (2010) Leitherer, C., Ortiz Otalvaro, P. A., Bresolin, F., et al. 2010, ApJS, 189, 309
- Leitherer et al. (2014) Leitherer, C., Ekstrom, S., Meynet, G., et al. 2014, ApJS, 212, 14
- Livermore et al. (2017) Livermore, R. C., Finkelstein, S. L., Lotz, J. M. 2017, ApJ, 835, 113
- Lusso et al. (2015) Lusso, E., Worseck, G., Hennawi, J. F., et al. 2015, MNRAS, 449, 4204
- Madau & Haardt (2015) Madau, P. & Haardt, F. 2015, ApJL, 813, 8
- Madau (2017) Madau, P., 2017, ApJ, 851, 50
- Mainali et al. (2018) Mainali, R., Zitrin, A., Stark, D. P., et al. 2018, MNRAS, 479, 1180
- Marchesi et al. (2016) Marchesi, S., Civano, F., Salvato, M., et al. 2016, ApJ, 827, 150
- Mason et al. (2019) Mason, C. A., Naidu, R. P., Tacchella, S., Leja, J., 2019, MNRAS, 489, 2669
- Matsuoka et al. (2018) Matsuoka, Y., Onoue, M., Kashikawa, N., et al. 2018, PASJ, 70S, 35
- Matsuoka et al. (2019) Matsuoka, Y., Iwasawa, K., Onoue, M., et al. 2019, ApJ, 883, 183
- McGreer et al. (2018) McGreer, I. D., Fan, X., Jiang, L, Cai, Z. 2018, AJ, 155, 131
- McLure et al. (2018) McLure, R. J., et al. 2018, MNRAS, 479, 25
- McQuinn (2016) McQuinn, M., 2016, ARA& A, 54, 31
- Meiksin (2009) Meiksin, A., 2009, Reviews of Modern Physics, 81, 1405
- Meiksin (2020) Meiksin, A. 2020, MNAS, 491, 4884
- Menci et al. (2019) Menci, N., Fiore, F., Feruglio, C., et al. 2019, ApJ, 877, 74
- Micheva et al. (2017) Micheva, G., Iwata, I., Inoue, A. K. et al. 2017, MNRAS, 465, 302
- Mignoli et al. (2019) Mignoli, M., Feltre, A., Bongiorno, A., et al. 2019, A&A, 626A, 9
- Morrison et al. (2019) Morrison, S., Pieri, M. M., Syphers, D., & Kim, T.-S., 2019, MNRAS, 489, 868
- Mostardi et al. (2013) Mostardi, R. E., Shapley, A. E., Nestor, D. B., et al. 2013, ApJ, 779, 65
- Naidu et al. (2019) Naidu, R. P., Tacchella, S., Mason, C. A., et al. 2019, ApJ, 892, 109
- Nakajima et al. (2018) Nakajima, K., Schaerer, D., Le Fevre, O., et al. 2018, A&A, 612, 94
- Nanayakkara et al. (2019) Nanayakkara, T., Brinchmann, J., Boogaard, L., et al. 2019, A& A, 624A, 89
- Nanayakkara et al. (2020) Nanayakkara, T., Brinchmann, J., Glazebrook, K., et al. 2020, ApJ, 889, 180
- Nardini et al. (2019) Nardini, E., Lusso, E., Risaliti, G., et al. 2019, A&A, 632, 109
- Nestor et al. (2011) Nestor, D. B., Shapley, A. E., Steidel, C. C., et al. 2011, ApJ, 736, 18
- Oesch et al. (2015) Oesch, P. A., van Dokkum, P. G., Illingworth, G. D., et al. 2015, ApJ, 804L, 30
- Onori et al. (2017) Onori, F., Ricci, F., La Franca, F., et al. 2017, MNRAS, 468L, 97
- Onoue et al. (2017) Onoue, M., Kashikawa, N., Willott, C. J., et al. 2017, ApJ, 847L, 15O
- Papovich et al. (2019) Papovich, C., Stark, D., Finkelstein, S. L., et al. 2019, BAAS, 51c, 266
- Parsa et al. (2018) Parsa, S., Dunlop, J. S. & McLure, R. J. 2018, MNRAS, 474, 2904
- Peng et al. (2010) Peng, C. Y., Ho, L. C., Impey, C. D., Rix, H.-W., 2010, AJ, 139, 2097
- Planck Collaboration (2018a) Planck Collaboration, Aghanim, N., Akrami, Y., Ashdown, M., et al., 2018a, arXiv:1807.06209
- Planck Collaboration (2019) Planck Collaboration, Aghanim, N., Akrami, Y., Ashdown, M., et al., 2019, arXiv:1907.12875
- Plat et al. (2019) Plat, A., Charlot, S., Bruzual, G., et al. 2019, MNRAS, 490, 978
- Pouliasis et al. (2019) Pouliasis, E., Georgantopoulos, I., Bonanos, A. Z., et al., 2019, MNRAS, 487, 4285
- Prescott & Sanderson (2019) Prescott, M. K. M. & Sanderson, K. N., 2019, ApJ, 885, 40
- Puchwein et al. (2018) Puchwein, E., Haardt, F., Haehnelt, M. G., & Madau, P. 2018, MNRAS, 485, 47
- Raiter et al. (2010) Raiter, A., Fosbury, R. A. E. & Teimoorinia, H., 2010, A&A, 510, A109
- Reichardt et al. (2020) Reichardt, C. L., Patil, S., Ade, P. A. R., et al. 2020, ApJ subm., arXiv:2002.06197
- Ricci et al. (2017) Ricci, F., Marchesi, S., Shankar, F., La Franca, F., & Civano, F. 2017, MNRAS, 465, 1915
- Roberts-Borsani et al. (2016) Roberts-Borsani, G. W., Bouwens, R. J., Oesch, P. A., et al. 2016, ApJ, 823, 143
- Romano et al. (2019) Romano, M., Grazian, A., Giallongo, E., et al., 2019, A&A, 632A, 45
- Santini et al. (2015) Santini, P., Ferguson, H. C., Fontana, A., et al. 2015, ApJ, 801, 97
- Schaerer et al. (2019) Schaerer, D., Fragos, T., Izotov, Y., 2019, A&A, 622, L10
- Schindler et al. (2018) Schindler, J.-T., Fan, X., McGreer, I. D. et al. 2018, ApJ, 863, 144
- Schindler et al. (2019) Schindler, J.-T., Fan, X., McGreer, I. D. et al. 2019, ApJ, 871, 258
- Schirber & Bullock (2003) Schirber, M., & Bullock, J. S. 2003, ApJ, 584, 110
- Schmidt et al. (2016) Schmidt, K. B., Treu, T., Bradac, M., et al. 2016, ApJ, 818, 38
- Senchyna et al. (2017) Senchyna, P., Stark, D. P., Vidal-Garcia, A., et al. 2017, MNRAS, 472, 2608
- Senchyna et al. (2019) Senchyna, P., Stark, D. P., Chevallard, J., et al. 2019, MNRAS, 488, 3492
- Senchyna et al. (2020) Senchyna, P., Stark, D. P., Mirocha, J., et al. 2020, MNRAS, 494, 941
- Shapley et al. (2003) Shapley, A. E., Steidel, C. C., Pettini, M., et al. 2003, ApJ, 588, 65
- Shapley et al. (2006) Shapley, A. E., Steidel, C. C., Pettini, M., et al. 2006, ApJ, 651, 688
- Sharma et al. (2018) Sharma, M., Theuns, T., Frenk, C., 2018, MNRAS, 477L, 111
- Shen et al. (2020) Shen, X., Hopkins, P. F., Faucher-Giguere, C.-A., et al. 2020, MNRAS subm., arXiv:2001.02696
- Shin et al. (2020) Shin, S., Im, M., Kim, Y., et al. 2020, ApJ, 893, 45
- Sobral et al. (2017) Sobral, D., Matthee, J., Best, P., et al. 2017, MNRAS, 466, 1242
- Stanway et al. (2016) Stanway, E. R., Eldridge, J. J., Becker, G. D., et al. 2016, MNRAS, 456, 485
- Stanway & Eldridge (2019) Stanway, E. R. & Eldridge, J. J., 2019, A&A, 621A, 105
- Stark et al. (2007) Stark, D. P., Bunker, A. J., Ellis, R. S., Eyles, L. P., & Lacy, M. 2007, ApJ, 659, 84
- Stark et al. (2015) Stark, D. P., Walth, G., Charlot, S., et al. 2015, MNRAS, 454, 1393
- Stark (2016) Stark, D. P., 2016, ARA& A, 54, 761
- Steidel et al. (2001) Steidel, C. C., Pettini, M., Adelberger, K. L., et al. 2001, ApJ, 546, 665
- Steidel et al. (2002) Steidel, C. C., Hunt, M. P., Shapley, A. E., et al. 2002, ApJ, 576, 653
- Steidel et al. (2018) Steidel, C. C., Bogosavljevic, M., Shapley, A. E., et al. 2018, ApJ, 869, 123
- Stevans et al. (2018) Stevans, M. L., Finkelstein, S. L., Wold, I., et al. 2018, ApJ, 863, 63
- Svoboda et al. (2019) Svoboda, J., Douna, V., Orlitova, I., et al. 2019, ApJ, 880, 144
- Talia et al. (2017) Talia, M., Brusa, M., Cimatti, A., et al. 2017, MNRAS, 471, 4527
- Tanvir et al. (2019) Tanvir, N. R., Fynbo, J. P. U., de Ugarte Postigo, A. et al. 2019, MNRAS, 483, 5380
- Telikova et al. (2019) Telikova, K. N., Shternin, P. S., Balashev, S. A. 2019, ApJ, 887, 205
- Tilvi et al. (2020) Tilvi, V., Malhotra, S., Rhoads, J. E., et al. 2020, ApJ, 891L, 10
- Torres-Alba et al. (2020) Torres-Alba, N., Bosch-Ramon, V., Iwasawa, K., et al. 2020, A&A, 635A, 57
- Vanzella et al. (2010) Vanzella, E., Grazian, A., Hayes, M., et al. 2010, A&A, 513A, 20
- Walther et al. (2019) Walther, M., Onorbe, J., Hennawi, J. F., & Lukic, Z. 2019, ApJ, 872, 13
- Wang et al. (2019) Wang, L., Mould, J., Baade, D., et al. 2019, BAAS, 51c, 399
- Whitaker et al. (2019) Whitaker, K. E., Ashas, M., Illingworth, G., et al. 2019, ApJS, 244, 16
- Wiklind et al. (2008) Wiklind, T., Dickinson, M., Ferguson, H. C., et al. 2008, ApJ, 676, 781
- Wise (2019) Wise, J. H. 2019, Published online in Contemporary Physics, arXiv:1907.06653
- Worseck et al. (2014) Worseck, G., Prochaska, J. X., O’Meara, J. M., Becker, G. D., et al. 2014, MNRAS, 445, 1745
- Worseck et al. (2019) Worseck, G., Davies, F.B., Hennawi, J. F., & Prochaska, J. X., 2019, ApJ, 875, 111
- Wu et al. (2019) Wu, J. F., Baker, A. J., Heckman, T. M., et al. 2019, ApJ, 887, 251
- Wyithe & Bolton (2011) Wyithe, J. S. B., Bolton, J. S., 2011, MNRAS, 412, 1926
- Yang et al. (2016) Yang, J., Wang, F., Wu, X.-B., et al. 2016, ApJ, 829, 33
- Yang et al. (2019) Yang, J., Wang, F., Fan, X., et al. 2019, ApJ, 871, 199
- Yung et al. (2020) Yung, L. Y. A., Somerville, R. S., Finkelstein, S. L., et al. 2020, MNRAS subm., arXiv:2001.08751