Molecular dynamics studies of interactions between Arg9(nona-arginine) and a DOPC/DOPG(4:1) membrane
Abstract
It has been known that the uptake mechanisms of cell-penetrating peptides(CPPs) depend on the experimental conditions such as concentration of peptides, lipid composition, temperature, etc. In this study we investigate the temperature dependence of the penetration of Arg9s into a DOPC/DOPG(4:1) membrane using molecular dynamics(MD) simulations at two different temperatures, T = 310 K and T = 288 K. Although it is difficult to identify the temperature dependence because of having only one single simulation at each temperature and no evidence of translocation of Arg9s across the membrane at both temperatures, our simulations suggest that followings are strongly correlated with the penetration of Arg9s: a number of water molecules coordinated by Arg9s, electrostatic energy between Arg9s and the lipids molecules. We also present how Arg9s change a bending rigidity of the membrane and how a collective behavior between Arg9s enhances the penetration and the membrane bending. Our analyses can be applicable to any cell-penetrating peptides(CPPs) to investigate their interactions with various membranes using MD simulations.
I Introduction
Cell penetrating peptides(CPPs), typically comprising 5–30 amino acids, can translocate across cell membranes. They have been extensively studied for a couple of decades since they are capable of transporting various cargoes(e.g., proteins, peptides, DNAs, and drugs) into cells,Guidotti et al. (2017) However, the uptake mechanisms of CPPs are still controversial. It is known that the translocation mechanisms of different families of CPPs are not the same, and most CPPs can have more than a single pathway depending on the experimental conditions.Madani et al. (2011) There are two major uptake mechanisms, i.e., the endocytotic(energy-dependent) pathway and the direct(energy-independent) translocation. The detailed uptake mechanisms can be found in Refs. Madani et al., 2011; Guidotti et al., 2017; Ruseska and Zimmer, 2020.
The uptake mechanisms of CPPs depend on various factors such as the physical and chemical properties of CPPs, concentration of CPPs, the properties of the membrane, etc. Ruseska and Zimmer (2020) The concentration of CPPs is one of key factors which gives different uptake pathways. It is generally accepted in many CPPs that endocytosis occurs at low concentration while the direct translocation occurs at low concentration. However, penetratin shows the reverse. Endocytosis occurs at high concentration while the direct translocation occurs at low concentration in the case of penetratin. Pae et al. (2014) Therefore, the uptake mechanism seems much more complicated than we thought. There are various models to explain the direct translocation, such as the carpet-like model Pouny et al. (1992), pore formation Matsuzaki et al. (1996), inverted micelle formation Derossi et al. (1996), the membrane thinning model Lee et al. (2005), etc. Detailed mechanisms of those models are also given in Refs. Madani et al., 2011; Ruseska and Zimmer, 2020.
Among various CPPs, arginine-rich peptides seem very interesting. As mentioned above the switch between different uptake mechanisms might depend on the concentration of the peptides. It has been shown in experiments that endocytosis is only dominant to a specific low peptide concentration. Fretz et al. (2007) One of possible scenarios for the insertion of arginine-rich peptides into the lipid bilayer is a strong interaction with negatively charged phospholipid heads (see, e.g., Ref. Ruseska and Zimmer, 2020). The charge neutralization results in the membrane deformations and this can lead to a decrease in a bending rigidity of the membrane.
The rapid cytoplasmic entry has been explained by the accumulation of the peptides at certain membrane areas, called nucleation zones.Wallbrecher et al. (2017) It was also reported that a rapid temperature decrease from 37∘C to 15∘C induces an efficient entry of Arg9(called R9 or nona-arginine in different literature) even at a low peptide concentration.Melikov et al. (2015) This is why two temperatures(T = 310 K and 288 K) were chosen in our simulations. Although the mechanism of temperature dependence shown in Ref. Melikov et al., 2015 is closely related to the calcium signalling, we focus primarily on the temperature dependence of interactions between Arg9 and the lipids molecules.
It was shown by Eiríksdóttir et al. Eiríksdóttir et al. (2010) that several CPPs can adopt a specific secondary structure in stabilizing their interactions with membranes. Among them Arg9 exhibited a random coil in both water and membrane environments, and it means that Arg9 was unable to adopt any specific secondary structure in both environments. Eiríksdóttir et al. Eiríksdóttir et al. (2010) also carried out leakage tests to assess the consequence of interactions between Arg9 and membranes on membrane stability, and found that Arg9 did not induce any leakage, suggesting no membrane perturbation and probably no insertion into the bilayer.
It was suggested that the entry of Arg9 into DOPG/DOPC-GUV(GUV: the giant unilamella vesicle) and DLPG/DTPC(2/8)-GUV occurs through transient hydrophilic prepores. Islam et al. (2018) A prepore is an area of decreased density of lipids due to the fluctuations of local lateral density. Prepores immediately close because of the large line tension. The interaction of CPPs with these prepores may stabilize the prepores by decreasing their line tension. More detailed physical views on prepores and comparison of the line tension of several lipid mixtures are given in Ref. Islam et al., 2018 and references therein.
Herce et al. Herce et al. (2009) showed in their molecular dynamics(MD) simulations that Arg9 follows the same mechanism previously found for Tat Herce and Garcia (2007) by the same authors. The attractive interactions between the Arg9 peptides and the phosphate groups of the phospholipids results in large local distortions of the bilayer, and these distortions lead to the formation of a toroidal pore. Note that the authors used the system containing a single phospholipid(DOPC) in their MD simulations. However, the authors showed in experiments that anionic phospholipids such as DOPG lipids are not required for the Arg9 peptides to penetrate bilayers.Herce et al. (2009)
MD simulations have been used to investigate functional properties of Arg9 and its interactions with many different lipids, however, only a few simulations used mixtures of lipids(e.g., a mixture of DOPC/DOPG or DOPC/DOPE) so far and the mechanism of translocation of Arg9 and interactions with lipids are still not conclusive. It was found that a DOPC/DOPG membrane appeared the better host for the translocation of KR9C in MD simulations.Crosio et al. (2019)
In our study we investigate the penetration of Arg9 peptides into a model membrane(e.g., a mixture of DOPC/DOPG(4:1)) using MD simulations at two different temperatures(T = 310 K and T = 288 K). Our first goal is to see if Arg9 can translocate across the DOPC/DOPG mixture by making a pore or a prepore, and the second goal is to investigate the temperature dependence of interactions between Arg9 and the lipids mixture.
II Simulation Methods
All simulations were performed using the NAMD package Phillips et al. (2005) and CHARMM36 force field.Brooks et al. (2009) CHARMM-GUI Jo et al. (2008) was used to setup a DOPC/DOPG(4:1) mixture and TIP3P water molecules. The lipids mixture consists of 76 DOPC and 19 DOPG lipids in each layer. K and Cl ions were added to make a concentration of 150 mM. One Arg9 peptide was made by the molefacture plugin in VMD Humphrey et al. (1996) and it was duplicated to make four Arg9 peptides. The total number of Arg9 peptides was the same as in Herce et al.’s Herce et al. (2009) to make a similar concentration of Arg9s. All Arg9 peptides were initially located in the upper solution and they were bound to the upper layer during the equilibration. The total number of water molecules after making the system neutralized was 9643. The NPT simulations were performed at two different temperature T = 288K and 310K in order to investigate the temperature dependence of penetration of Arg9s. Temperature and pressure were kept constant using Langevin dynamics. An external electric field(0.05 V/nm) was applied in the negative z direction(from the Arg9s peptides to the membrane) as suggested in previous work Herce et al. (2009); Walrant et al. (2012) to account for the transmembrane potential. Roux (2008) The particle-mesh Ewald(PME) algorithm was used to compute the electric forces and the SHAKE algorithm was used to allow a 2 fs time step during the whole simulations. At the first stage, the system was equilibrated at T = 310 K for 500 ns long. At the second stage, two systems were prepared: One was a system with the same temperature(T = 310 K) as in the equilibration at the first stage. The other was a system with T = 288 K. When the temperature was down from T = 310 K to T = 288 K in the second system, the system was quickly equilibrated at T = 288 K. Both systems(T = 310 K and 288 K) were ran for another 500 ns. The first 200 ns data in both simulations were discarded for the equilibration and only the last 300 ns data were used for the analyses.
III Simulation Results
A number of water molecules coordinated by Arg9s is strongly correlated with the penetration depth
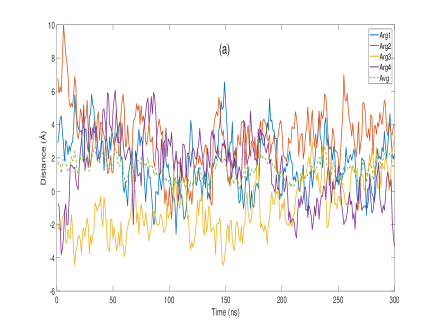
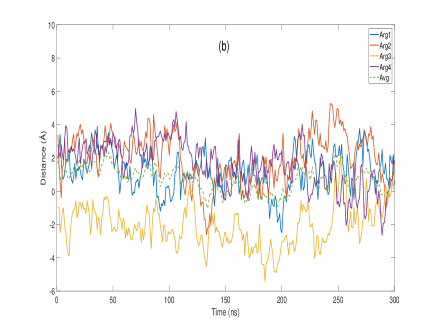
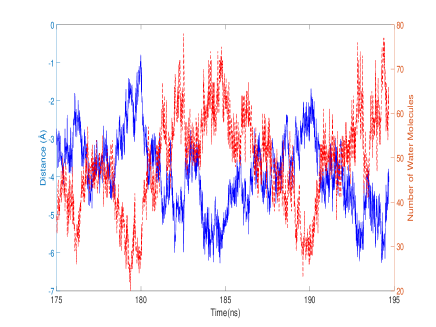
We don’t see any translocation of Arg9 across the DOPC/DOPG bilayer during the simulations. However, it can penetrate into the lipids mixture along with a quite number of water molecules. We define a penetration depth as a distance in the z direction between the center of mass of each Arg9(taking only Cαs for the sake of simplicity) and that of the upper leaflet. Here, a leaflet means a surface which consists of 95 phosphorus(P) atoms in the upper or the lower layer.
Fig. 1(a) shows the penetration depth of each Arg9 at T = 310 K. The solid lines denote the penetration depth of each Arg9, and the dotted line represents an average over those four values. The positive value means that the center of mass of Arg9 is located above the center of masses of phosphorus(P) atoms, and the negative means below the phosphorus(P) atoms. One of Arg9s(Arg3) is located below the upper leaflet during the most of simulation time.
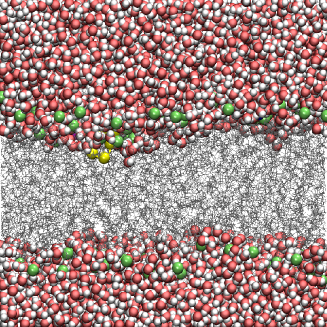
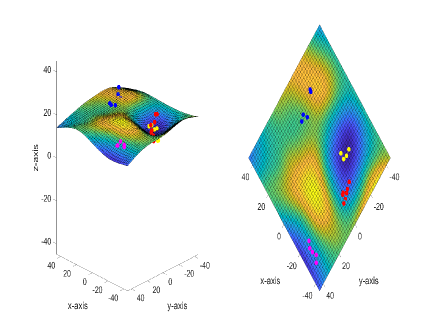
Fig. 1(b) shows the same quantity as in Fig. 1(a), but at T = 288 K. It shows that Arg9 can penetrate slightly more into the lipids mixture at T = 288 K. One of Arg9s(Arg3) is below the upper leaflet during the whole simulation time, and it reaches even -5 Å in this figure. Note that each point in the figures corresponds to a block average over 1 ns. We find that the largest penetration depth is -6.3 Å during the simulation at T = 288 K, and Fig. 2 shows a snapshot at that moment. Cαs of Arg3 are shown as the same color code in Fig. 1. The green dots by the vdW representation of VMD correspond to phosphorus(P) atoms in the DOPC/DOPG mixture. The lipids molecules are shown as gray lines and water molecules are represented by vdW of VMD. Fig. 3 represents a deformation of the upper leaflet due to the presence of Arg9s and a relative distance between the upper leaflet and each Arg9 using the snapshot in Fig. 2. The lower leaflet is not shown in this figure for clarity. The blue color in the leaflet denotes a trough and the yellow a crest. Some of Cs located below the leaflet are not seen in this figure.
A quite number of water molecules also penetrate into the DOPC/DOPG mixture and this results in a membrane thinning and bending. Fig. 4 shows the total number of water molecules located 15 Å apart from the center of mass of Arg3 at T = 288 K. We count only water molecules below the center of masses of phosphorus(P) atoms. Fig. 4 shows a strong correlation between the penetration depth of Arg9 and the number of water molecules surrounding it. The number of water molecules increases as the penetration of Arg3 increases. This confirms the previous results from MD simulations. Freites et al. (2005); Dorairaj and Allen (2007); MacCallum et al. (2007)
At the current stage we can not conclude that the lowering temperature will really help Arg9s to make more penetration into the lipids mixture. First of all, the difference in average penetration depths at two temperatures is not that significant(about 1 or 2 Å in average). Second, we have only one single simulation at each temperature, and the total simulation time(300 ns) may not be long enough to see the temperature dependence. However, it turns out that the penetration depths are affected by electrostatic energy between Arg9s and the lipids mixture and we want to focus on how Arg9s interact with the lipids mixture in the following analyses.
Electrostatic energy between Arg9s and the DOPC/DOPG mixture is important for the penetration
It is difficult to imagine how Arg9s can pass through the DOPC/DOPG mixture because DOPG is a negatively charged lipid and therefore one can expect strong attractive interactions between Arg9s and DOPG lipids. It was suggested that the electrostatic interaction between positive charges of Arg9s and negative charges of lipid molecules is crucial at the early stage of translocation.Walrant et al. (2012) We want to investigate this feature in our simulations.
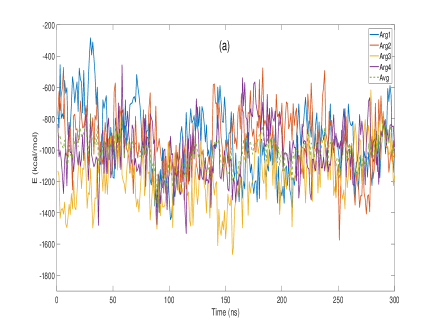
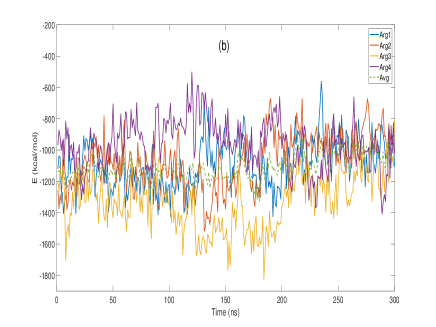
We calculate electrostatic energy between each Arg9 and the DOPC/DOPG mixture at both temperatures using the NAMD Energy plugin in VMD. We want to see if there is any correlation between the strength of electrostatic energy and the penetration depth. Fig. 5(a) shows electrostatic energy between each Arg9 and the DOPC/DOPG mixture at T = 310 K. Each color code(the same color scheme as in the previous figures) represents the interaction between one of Arg9s and the lipids mixture. Avg denotes an average energy over all four Arg9s. Fig. 5(b) shows the same energy, but at T = 288 K. The average electrostatic energy at T = 288 K is slightly lower(more stable) than that at T = 310 K by 100 kcal/mol. This can be explained by comparing the average penetration depths in Figs. 1(a) and 1(b). Arg9 can penetrate slightly more at T = 288 K because of a lower electrostatic energy. Note that in Fig. 5(b) one of the lowest energy regions(170-200 ns) corresponds to a region which shows the largest penetration depth in Fig. 1(b). One can see a similar behavior in the case of Arg1(blue) at about 200 ns in Figs. 1(b) and 5(b). In both Figs. 5(a) and 5(b) electrostatic energy between Arg3(yellow) and the lipids mixture increases(less stable) at the end of simulation because the penetration depth of Arg3 decreases as shown in Figs. 1(a) and 1(b), respectively. Our simulations clearly suggest that electrostatic energy plays a key role to control the penetration depth of Arg9.
Then, the next question will be whether Arg9 can make a pore or a prepore in the presence of strong electrostatic energy between Arg9s and the lipids mixture. At this stage it is not clear how this can happen, but we think that Fig. 2 can give us a clue. In Fig. 2 one can observe a quite number of water molecules coordinated by Arg3 when it makes the largest penetration through the lipids mixture at T = 288 K. It was known by molecular dynamics simulations that water molecules can enhance a membrane bending and disorder the lipid molecules. Freites et al. (2005); Dorairaj and Allen (2007); MacCallum et al. (2007) We conjecture that the concentration of Arg9s will be one of key factors to coordinate more water molecules. More water molecules will accelerate the membrane bending and thinning, and thus there may be more interactions between Arg9s and the lipids molecules in the lower layer. However, the concentration of Arg9s in our simulations seems not large enough to see this behavior. In the Appendix we present the membrane thinning due to the penetration of Arg3. It is obvious that the increase of penetration of Arg9s results in the membrane thinning. The detailed method to obtain the distance between the layers is explained in the Appendix. More on the membrane bending is given in the below.
Bending rigidity of the membrane is decreased due to the presence of Arg9s
It was shown that there is a correlation between CPP hydropathy and the penetration of water molecules in the lipid bilayer and the presence of water molecules locally destabilizes the lipid order and reduces a bending modulus of the membrane. Grasso et al. (2018) The reduction in membrane bending rigidity has also been reported in other literature.Crosio et al. (2019); Ruseska and Zimmer (2020)
We compare bending moduli of the DOPC/DOPG mixture at two different temperatures(T = 288 K and 310 K). We compute the bending moduli using the method described in Ref. Khelashvili et al., 2010, 2013; Grasso et al., 2018. A similar approach to calculate the bending moduli of various lipid molecules was suggested by Levine et al. Levine et al. (2014) The authors also tried Khelashvili et al.’s method Khelashvili et al. (2013) to analyze their data and found that their bending moduli are consistent with Khelashvili et al.’s. We use Khelashvili et al.’s method for obtaining the bending modulus of the membrane and this will be enough to see the temperature dependence of the bending moduli in our simulations.
It was shown that one can calculate the splay modulus by calculating splay angles() between lipids molecules. We use the same definition of a splay angle in Ref. Khelashvili et al., 2010, 2013; Grasso et al., 2018(see more in the Appendix). There are two criteria to analyze the splay angles as explained in the previous work Khelashvili et al. (2013); Levine et al. (2014): 1) Only lipid pairs separated by less than 10 Å are considered. 2) At least one director should be oriented less than or equal to 10 degrees from the bilayer normal. In this approach a normalized probability distribution is used to calculate the potential of mean force(PMF). PMF is defined by
| (1) |
where is the probability distribution of a hypothetical non-interacting particle system, the Boltzmann factor and T the temperature. The splay modulus is obtained by a quadratic fit of the PMF data, and it corresponds to the bending modulus of a monolayer . The presence of Arg9, e.g, in the upper layer, also affects the bending modulus of the lower layer. Therefore, we compute the bending modulus of a bilayer by averaging two moduli from each layer.
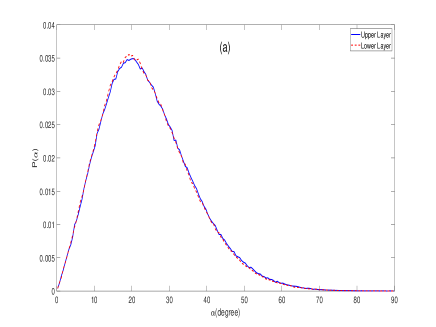
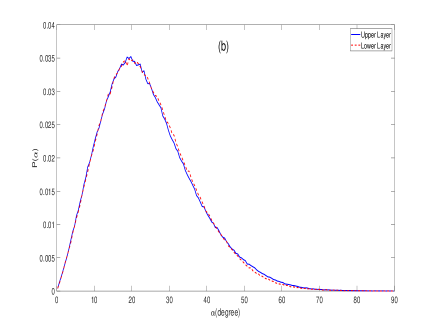
Fig. 6(a) shows normalized probability distributions of , P(), at T = 310 K. The blue solid line is a distribution from the upper layer, while the red dotted line comes from the lower layer. Two lines are almost overlapped with each other and the same behavior is seen in probability distributions at T = 288 K(see Fig. 6(b)). From the second order polynomial fitting of Eq.(1) as described in Ref. Khelashvili et al., 2013; Levine et al., 2014; Grasso et al., 2018, we obtain Kc(310 K) = 7.6 10-20 J and Kc(288 K) = 6.8 10-20 J as bending moduli of the DOPC/DOPG mixture(see Figs. 11 and 12 for the quadratic fits). The bending modulus at T = 288 K is slightly smaller, but the difference is minimal. Our values( 17 18 T) are slightly smaller than an experimental value, 20 T 1 T.Steinkühler et al. (2018) This is due to the penetration of water molecules along with Arg9s and water molecules play a role to make softening of the lipids mixture.
A collective behavior between Arg9s enhances the penetration and the membrane bending
Li et al. Li et al. (2013) found that it is difficult for a single peptide to penetrate through the membrane while multiple peptides can translocate across membranes by making a pore. Hu et al. Hu et al. (2015) also showed that the water pore formation is facilitated by the aggregated charge peptides, and the authors claimed that the cooperative effect from global and local disturbance of membrane by random and aggregated peptides results in the pore formation.
Although we don’t see any translocation of Arg9s during our simulations, our simulation results are consistent with above findings that the collective behavior between Arg9s significantly changes a local membrane curvature and results in more penetration into the lipids mixture. In Fig. 3 one can see that two Arg9s(red and yellow) come closer and make a significant change in the membrane bending and thinning(see also the Appendix and Fig. 10 for the membrane thinning).
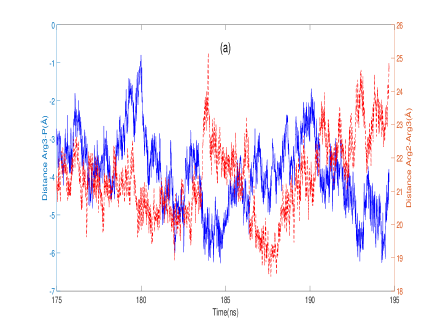
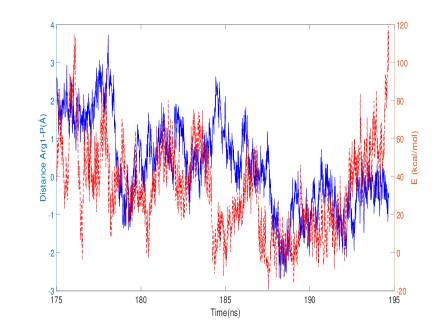
First, we investigate a relation between the penetration depth of Arg3(yellow) and the distance between the center of mass of Arg2(red) and that of Arg3(yellow). In Fig. 7(a) the solid blue line denotes the penetration depth of Arg3 and the dotted red line shows the distance between Arg2 and Arg3. We show only data from 175 ns to 195 ns, which include the moment of the largest penetration depth of Arg3. Whenever Arg3 is trying to reach one of the largest penetration depths(e.g., about -6Å at 184 ns or at 193 ns), the distance between Arg2 and Arg3 is going to increase rapidly.
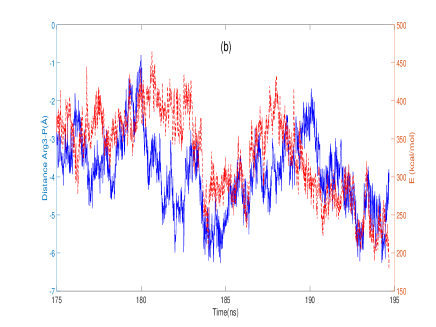
We have another plot which shows a comparison between the penetration depth of Arg3 and electrostatic energy between Arg2 and Arg3. We expect that the finding in Fig. 7(a) regarding the distance between Arg2 and Arg3 could be related to electrostatic energy between Arg2 and Arg3, and this analysis will give an idea why the distance between Arg2 and Arg3 is slightly reduced when Arg3 makes the maximum penetration depth at 184.68 ns in Fig. 7(a). In Fig. 7(b) the solid blue line is the same as in Fig. 7(a)(the penetration depth) and the dotted red line is electrostatic energy between Arg2 and Arg3. Whenever Arg3 reaches the maximum penetration, electrostatic energy between Arg2 and Arg3 becomes the minimum(or less repulsive).
The induction of curvature by association of proteins to the membrane has been well known for the so-called curvature sensing proteins. Maniti et al. (2014) For example, it was known that if one protein induces a given membrane curvature, it attracts more proteins that favor a similar curvature. Sens et al. (2008) It was also shown that curvature-inducing proteins experience attractive short-range interactions due to a membrane curvature, and this curvature-mediated interaction leads to protein aggregation. Reynwar et al. (2007) In order to estimate membrane-mediated interactions(attractive or repulsive potential) between Arg9s we need to consider long-range interactions such as entropic membrane fluctuations, Goulian et al. (1993); Agrawal et al. (2016) however, we want to focus primarily on a cooperative effect between Arg9s which affects the penetration depth and the membrane bending. Our electrostatic energy calculations seem to be enough to show this feature.
We want to briefly mention the usefulness of membrane curvatures such as the mean curvature() or the Gaussian curvature() in our simulations. Schmidt et al. (2010) Each curvature is defined by
| (2) | |||||
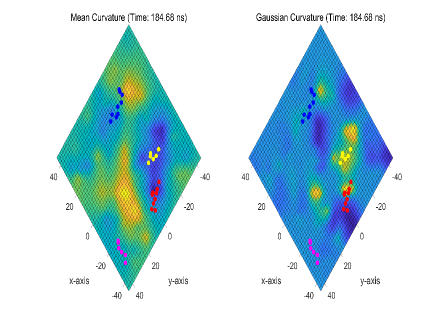
where and are the principal curvatures at a point on the membrane. Fig. 8 represents the mean curvature and the Gaussian curvature of the membrane in the presence of Arg9s when Arg3 shows the largest penetration at T = 288 K(see also Fig. 3). The blue color in the figure means a negative curvature while the yellow denotes a positive curvature. As we expect the mean curvature near Arg2(red) and Arg3(yellow) is negative which means a concave deformation. We have checked that the Gaussian curvature near Arg3 is always positive during the simulation at T = 288 K, which means no evidence of the pore formation. Schmidt et al. (2010)
We expect that both the concentration of Arg9s and the collective behavior are important in translocation. More simulation studies with different concentration of Arg9s may be necessary to gain more insights into the collective behavior.
IV Discussion
Our simulations show that Arg9 can penetrate into the DOPC/DOPG mixture, but it can not pass through the mixture both at T = 310 K and at T = 288 K. It doesn’t show any pore or prepore as suggested in Refs. Herce et al., 2009; Islam et al., 2018. Although we don’t see any translocation of Arg9, our simulations suggest that electrostatic energy between Arg9 and the lipids mixture plays a role in determining the penetration depth. A few remarks regarding our results are given below.
The role of the Arg side chain was identified in the previous MD simulations.Herce et al. (2009) The Arg side chains bind to the phosphate groups of the phospholipids, then this binding makes large distortions of the bilayer which lead to the formation of a pore.
Our simulation shows that more than 70 water molecules also penetrate into the lipids mixture when Arg9 reaches the maximum penetration depth(see Fig. 4), however, Arg9s in our simulations don’t make such strong distortions in the DOPC/DOPG mixture which can lead to a pore. We expect that the translocation may be difficult at low concentration of Arg9s due to the attractive potential energy between Arg9s(positive charge) and DOPG lipids(negative charge). We find that all Arg9s were strongly bound to the DOPG lipids during the simulations. We conjecture that the ability of the translocation can be highly dependent on the concentration of Arg9s. To our knowledge, it has not yet known how positively charged Arg9s pass through the DOPC/DOPG mixture within all-atom MD simulations. One of crucial reasons will be a simulation timescale. It was claimed that spontaneous translocation is not expected within timescales accessible to MD simulations, unless nonphysical restraints are applied to accelerate the underlying process.Yesylevskyy et al. (2009) In that case, a path sampling approach(e.g., the weighted ensemble method Zwier et al. (2015)) might be one of solutions to reveal the underlying mechanism of the translocation of Arg9s.
It was known that charged surfaces are more rigid than neutral ones, therefore, the decrease in membrane rigidity could be explained by considering that the arginine-rich peptide partially neutralizes the membranes.Crosio et al. (2019) Crosio et al. Crosio et al. (2019) claimed based on their experiments in the DOPC/DOPG(1:1) environment that the recruiting of the anionic DOPG lipids in the regions close to the arginine-rich peptide would lead to an enrichment of DOPC lipids in other regions, subsequently decreasing the observed bending rigidity. The incorporation of water coupled with peptide translocation and local membrane thinning can be another explanation for the reduced bending rigidity of the membrane. Grasso et al. (2018) Our simulations suggest that both the partial neutralization and the membrane thinning affect a softening of the DOPC/DOPG mixture. As we mentioned above, Arg9s are strongly bound to DOPG lipids during the simulations and this results in the partial neutralization of the membrane. We also showed the membrane thinning due to the penetration of water molecules in the previous section. It will be interesting to investigate which factor(the neutralization or the membrane thinning) can contribute more on the softening of the membrane. This can be done using different concentration of Arg9s as well as using different DOPC/DOPG ratios.
Although the total number of Arg9s and the system size may not be large enough to clearly show the collective behavior in our simulations, our results suggest that it can affect the membrane bending and thinning and thus the penetration of Arg9s. Movie S1 shows how each Arg9 makes membrane deformations during the time frame between 175 ns and 195 ns which includes the moment that Arg3 shows the largest penetration depth at about 185 ns. One can see in this movie that there are two main local minima made by Arg1(blue) and Arg3(yellow). Arg2(red) is already got closer to Arg3(yellow) and it is trapped in a local minimum during this time frame. One interesting finding is that sometimes two local minima are connected to each other, and this results in a drastic change in the membrane bending(see, e.g., at 188.6 ns, 190.4 ns, and 191.6 ns in the movie). One can find an increased penetration depth and a drastic decrease of electrostatic energy of Arg1(blue) at about 190 200 ns in Figs. 1(b) and 5(b), respectively. We compute electrostatic energy between Arg1(blue), Arg2(red), and Arg3(yellow) as we did previously for the interaction between Arg2 and Arg3. Fig. 9 represents these calculations with the penetration depth of Arg1 for comparison. The blue solid line is the penetration depth of Arg1 and the red dotted line is the sum of two electrostatic energy: One is electrostatic energy between Arg1 and Arg2, and the other one is that between Arg1 and Arg3. There is an interesting energy drop at about 185 ns, and this time frame corresponds to the moment that Arg3 makes the maximum penetration depth. One can see that the penetration increases at the time frames mentioned above, i.e., at 188.6 ns, 190.4 ns, and 191.6 ns, and electrostatic energy becomes minimum (or less repulsive) at these time frames. It shows that there exits the collective behavior between Arg9s which enhances the disorder of the membrane. Further simulations with more detailed curvature analyses Schmidt et al. (2010); Maniti et al. (2014) will be helpful to identify the factors(e.g., concentration of Arg9s, a distribution of DOPG lipids in the DOPC/DOPG mixture, etc.) which control the collective behavior between Arg9s and their effects on the membrane bending.
V Conclusion
The uptake mechanisms of CPPs have been extensively studied in both experiments and computer simulations. However, they are not still conclusive. The difficulty comes from the fact that the uptake pathway is not the same for different families of CPPs and depends on the experimental conditions.Madani et al. (2011) There is no doubt that an MD simulation is still one of valuable tools to reveal functional and mechanical properties of different families of CPPs and their interactions with various types of lipid membranes.
Our simulations suggest that the electrostatic interaction between Arg9s and the lipids molecules is important at the early stage of the penetration, and water molecules coordinated by Arg9s make a membrane thinning which results in a softening of the bending rigidity of the membrane. The collective behavior between Arg9s also plays a role to help the penetration of Arg9s into the membrane. Although we don’t see any direct translocation of Arg9 across the DOPC/DOPG bilayer in our simulations, our analyses will be helpful for understanding functional properties of other CPPs and their interactions with various membranes using MD simulations.
Supplementary Material
See supplementary material for the supplemental movie S1.
Acknowledgements.
The author thanks Hanna Salman and Xiao-lun Wu for valuable comments on the early stage of this work, and he also thanks the University of Pittsburgh for support during his stay. This work was supported in part by the start-up fund from the Daegu Gyeongbuk Institute of Science & Technology(DGIST).DATA AVAILABLE STATEMENT
The data that support the findings of this study are available from the corresponding author upon reasonable request.
Appendix A Membrane thinning due to the penetration of Arg9
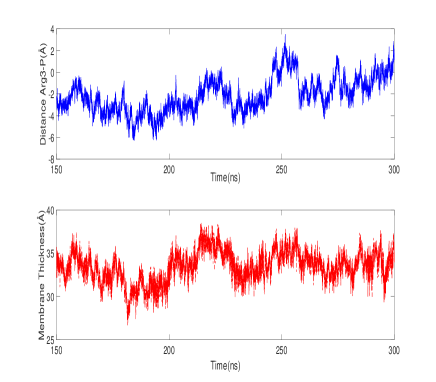
We investigate a relation between the penetration depth of Arg3(one of Arg9 peptides in our simulations) and the membrane thickness at T = 288 K(see Fig. 10). When the penetration depth of Arg3 increases, the membrane thickness near Arg3 is expected to be decreased. The first panel represents the penetration depth of Arg3(the distance between the center of mass of Arg3 and the center of masses of phosphorus(P) atoms in the upper leaflet, where a leaflet is a surface which consists of 95 phosphorus(P) atoms in each layer) between 150 ns and 300 ns. The negative value means that the center of mass of Arg3 is below than the center of masses of phosphorus(P) atoms, and the positive means the reverse. The second panel shows time variations of the membrane thickness due to the penetration of Arg3. The smallest thickness is about 27 Å, which is almost 10 Å smaller than that of a membrane without any interactions with Arg9s(a rest state). We compute the membrane thickness as follows: First, we find the three nearest phosphorus(P) atoms in the upper leaflet from the center of mass of Arg3 and calculate an average z position of these three atoms. Next, we do the same thing in the lower leaflet, namely, we obtain another average z position of three nearest phosphorus(P) atoms in the lower leaflet. Then, we define a membrane thickness as a distance between those two z positions. One can see that two figures show a very similar trend. This is what we exactly expected. We choose Arg3 because it shows the largest penetration depth at T = 288 K. The other Arg9s can have different patterns in the membrane thickness.
Appendix B Bending modulus of the DOPC/DOPG mixture
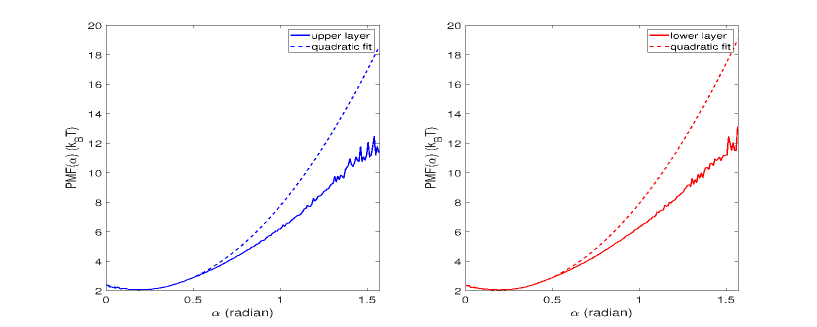
One of mechanical properties of a membrane is its bending modulus. It was known that the penetration of a quite amount of water molecules plays a role to decrease a bending rigidity of a membrane. We investigate the bending modulus of the DOPC/DOPG mixture in the presence of Arg9s both at T = 310 K and at T = 288 K. We use Khelashvili et al.’s approach Khelashvili et al. (2013) to get the bending modulus from MD simulations. One can compute a bending modulus from a probability distribution of splay angles. Here is a general method to obtain splay angles.Khelashvili et al. (2013) First, local lipid director vectors is defined, where is the vector that connects the midpoint between the phosphate and backbone C2 atoms to the center of mass of the three terminal carbons on the two lipid chains. The splay modulus for a particular pair of lipid molecules is calculated by defining a splay angle () between vectors and constructing probability distributions P() (see the main text and Ref. Khelashvili et al., 2013). Fig. 11 represents the potential of mean force (PMF) profile PMF()= - T ln (P()/sin()) and a quadratic fit at [10, 30] degrees at T = 310 K, where sin () is the probability distribution of a hypothetical non-interacting particle system. A figure in the left represents the PMF profile(the blue solid line) from the upper layer and a quadratic fit(the blue dotted line). A figure in the right shows the same plots from the lower layer.
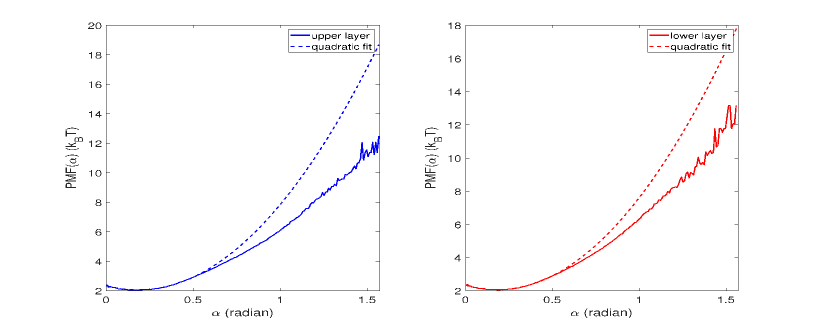
In order to obtain a quadratic fit of the PMF profile we use the Curve Fitting Tool of MATLAB. We obtain the following bending modulus at T = 310 K: 17.408 T(the upper layer) and 17.990 T(the lower layer). We take an average of these two values, 17.699 T , as the bending modulus of the DOPC/DOPG mixture at T = 310 K. Fig. 12 is the same as in Fig. 11, but at T = 288 K. As for the probability distributions of the splay angles, there are no significant changes at T = 288 K. Using the same approach, we get the following bending modulus: 17.428 T(the upper layer) and 16.600 T(the lower layer). Again, we take an average of these two values, 17.014 T, as the bending modulus of the DOPC/DOPG mixture at T = 288 K.
References
- Guidotti et al. (2017) G. Guidotti, L. Brambilla, and D. Rossi, Trends in Pharmacological Sciences 38, 406 (2017).
- Madani et al. (2011) F. Madani, S. Lindberg, U. Langel, S. Futaki, and A. Gräslund, J. Biophys. 2011, 1 (2011).
- Ruseska and Zimmer (2020) I. Ruseska and A. Zimmer, Beilstein J. of Nanotechnol. 11, 101 (2020).
- Pae et al. (2014) J. Pae, P. Säälik, L. Liivamagi, D. Lubebets, P. Arukuusk, U. Langel, and M. Pooga, J. Controlled Release 192, 103 (2014).
- Pouny et al. (1992) Y. Pouny, D. Rapaport, A. Mor, P. Nicolas, and Y. Shai, Biochemstry 31, 12416 (1992).
- Matsuzaki et al. (1996) K. Matsuzaki, S. Yoneyama, O. Murase, and K. Miyajima, Biochemistry 35, 8450 (1996).
- Derossi et al. (1996) D. Derossi, S. Calvet, A. Trembleau, A. Brunissen, G. Chassaing, and A. Prochiantz, J. Biolo. Chem. 271, 18188 (1996).
- Lee et al. (2005) M. T. Lee, W. C. Hung, F. Y. Chen, and H. W. Huang, Biophys. J. 89, 4006 (2005).
- Fretz et al. (2007) M. M. Fretz, N. A. Penning, S. Al-Taei, S. Futaki, T. Takeuchi, I. Nakase, G. Storm, and A. T. Jones, Biochem. J. 403, 335 (2007).
- Wallbrecher et al. (2017) R. Wallbrecher, T. Ackels, R. A. Olea, M. J. Klein, L. Caillon, J. Schiller, P. H. Bovée-Geurts, T. H. van Kuppevelt, A. S. Ulrich, M. Spehr, M. J. W. Adjobo-Hermans, and R. Brock, J. Controlled Release 256, 68 (2017).
- Melikov et al. (2015) K. Melikov, A. Hara, K. Yamoah, E. Zaitseva, E. Zaitsev, and L. V. Chernomordik, Biochem. J. 471, 221 (2015).
- Eiríksdóttir et al. (2010) E. Eiríksdóttir, K. Konate, U. Langel, G. Divita, and S. Deshayes, Biochimica Biophysica Acta 1798, 1119 (2010).
- Islam et al. (2018) M. Z. Islam, S. Sharmin, M. Moniruzzaman, and M. Yamazaki, Appl. Microbio. Biotech. 102, 3879 (2018).
- Herce et al. (2009) H. D. Herce, A. E. Garcia, J. Litt, R. S. Kane, P. Martin, N. Enrique, A. Rebolledo, and V. Milesi, Biophys. J. 97, 1917 (2009).
- Herce and Garcia (2007) H. D. Herce and A. E. Garcia, Proc. Natl. Acad. Sci. USA 104, 20805 (2007).
- Crosio et al. (2019) M. A. Crosio, M. A. Via, C. I. Cámara, A. Mangiarotti, M. G. D. Pópolo, and N. Wilke, Biomolecules 9, 625 (2019).
- Phillips et al. (2005) J. Phillips, R. Braun, W. Wang, J. Gumbart, E. Tajkhorshid, E. Villa, C. Chipot, R. D. Skeel, L. Kale, and K. Schulten, J. Comput. Chem. 26, 1781 (2005).
- Brooks et al. (2009) B. R. Brooks, C. L. B. III, A. D. M. Jr., L. Nilsson, R. J. Petrella, B. Roux, Y. Won, G. Archontis, C. Bartels, A. C. S. Boresch, L. Caves, Q. Cui, A. R. Dinner, M. Feig, S. Fischer, J. Gao, M. Hodoscek, W. Im, K. Kuczera, T. Lazaridis, J. Ma, V. Ovchinnikov, E. Paci, R. W. Pastor, C. B. Post, J. Z. Pu, M. Schaefer, B. Tidor, R. M. Venable, H. L. Woodcock, X. Wu, W. Yang, D. M. York, and M. Karplus, J. Comput. Chem. 30, 1545 (2009).
- Jo et al. (2008) S. Jo, T. Kim, V. G. Iyer, and W. Im, J. Comput. Chem. 29, 1859 (2008).
- Humphrey et al. (1996) W. Humphrey, A. Dalke, and K. Schulten, J. Molec. Graphics 14, 33 (1996).
- Walrant et al. (2012) A. Walrant, A. Vogel, I. Correia, O. Lequin, B. E. S. Olausson, B. Desbat, S. Sagan, and I. D. Alves, Biochimica Biophysica Acta 1818, 1755 (2012).
- Roux (2008) B. Roux, Biophys. J. 95, 4205 (2008).
- Freites et al. (2005) J. A. Freites, D. J. Tobias, G. von Heijne, and S. H. White, Proc. Natl. Acad. Sci. USA 102, 15059 (2005).
- Dorairaj and Allen (2007) S. Dorairaj and T. W. Allen, Proc. Natl. Acad. Sci. USA 104, 4943 (2007).
- MacCallum et al. (2007) J. L. MacCallum, W. F. D. Bennett, and D. P. Tieleman, J. Gen. Physiol. 129, 371 (2007).
- Grasso et al. (2018) G. Grasso, S. Muscat, M. Rebella, U. Morbiducci, A. Audenino, A. Danani, and M. A. Deriu, J. Biomech. 73, 137 (2018).
- Khelashvili et al. (2010) G. Khelashvili, G. Pabst, and D. Harries, J. Phys. Chem. B 114, 7524 (2010).
- Khelashvili et al. (2013) G. Khelashvili, B. Kollmitzer, P. Heftberger, G. Pabst, and D. Harries, J. Chem. Theory Comput. 9, 3866 (2013).
- Levine et al. (2014) Z. A. Levine, R. M. Venable, M. C. Watson, M. G. Lerner, J.-E. Shea, R. W. Pastor, and F. L. H. Brown, J. Am. Chem. Soc. 136, 13582 (2014).
- Steinkühler et al. (2018) J. Steinkühler, P. D. Tillieux, R. L. Knorr, R. Lipowsky, and R. Dimova, Sci. Rep. 8, 11838 (2018).
- Li et al. (2013) Z. Li, H. Ding, and Y. Ma, Soft Matter 9, 1281 (2013).
- Hu et al. (2015) J. Hu, W. Tian, and Y. Ma, Macromol. Theory Simul. 24, 399 (2015).
- Maniti et al. (2014) O. Maniti, H. Piao, and J. Ayala-Sanmartin, Int. J. Biochem & Cell Biolo. 50, 73 (2014).
- Sens et al. (2008) P. Sens, L. Johannes, and P. Bassereau, Current Opinion in Cell Biology 20, 476 (2008).
- Reynwar et al. (2007) B. J. Reynwar, G. Illya, V. A. Harmandaris, M. M. Müller, K. Kremer, and M. Deserno, Nature 447, 461 (2007).
- Goulian et al. (1993) M. Goulian, R. Bruinsma, and P. Pincus, Europhys. Lett. 22, 145–150 (1993).
- Agrawal et al. (2016) H. Agrawal, L. Liu, and P. Sharma, Soft Matter 12, 8907 (2016).
- Schmidt et al. (2010) N. Schmidt, A. Mishra, G. H. Lai, and G. C. L. Wong, FEBS Letters 584, 1806 (2010).
- Yesylevskyy et al. (2009) S. Yesylevskyy, S.-J. Marrink, and A. Mark, Biophys. J. 97, 40 (2009).
- Zwier et al. (2015) M. C. Zwier, J. L. Adelman, J. W. Kaus, A. J. Pratt, K. F. Wong, N. B. Rego, E. Suarez, S. Lettieri, D. W. Wang, M. Grabe, D. M. Zuckerman, and L. T. Chong, J. Chem. Theory Comput. 11, 800 (2015).